The forward Class IV/III gap is now worth $11,000–$16,000/month on a 500-cow herd — and DMC enrollment closes in 17 days.
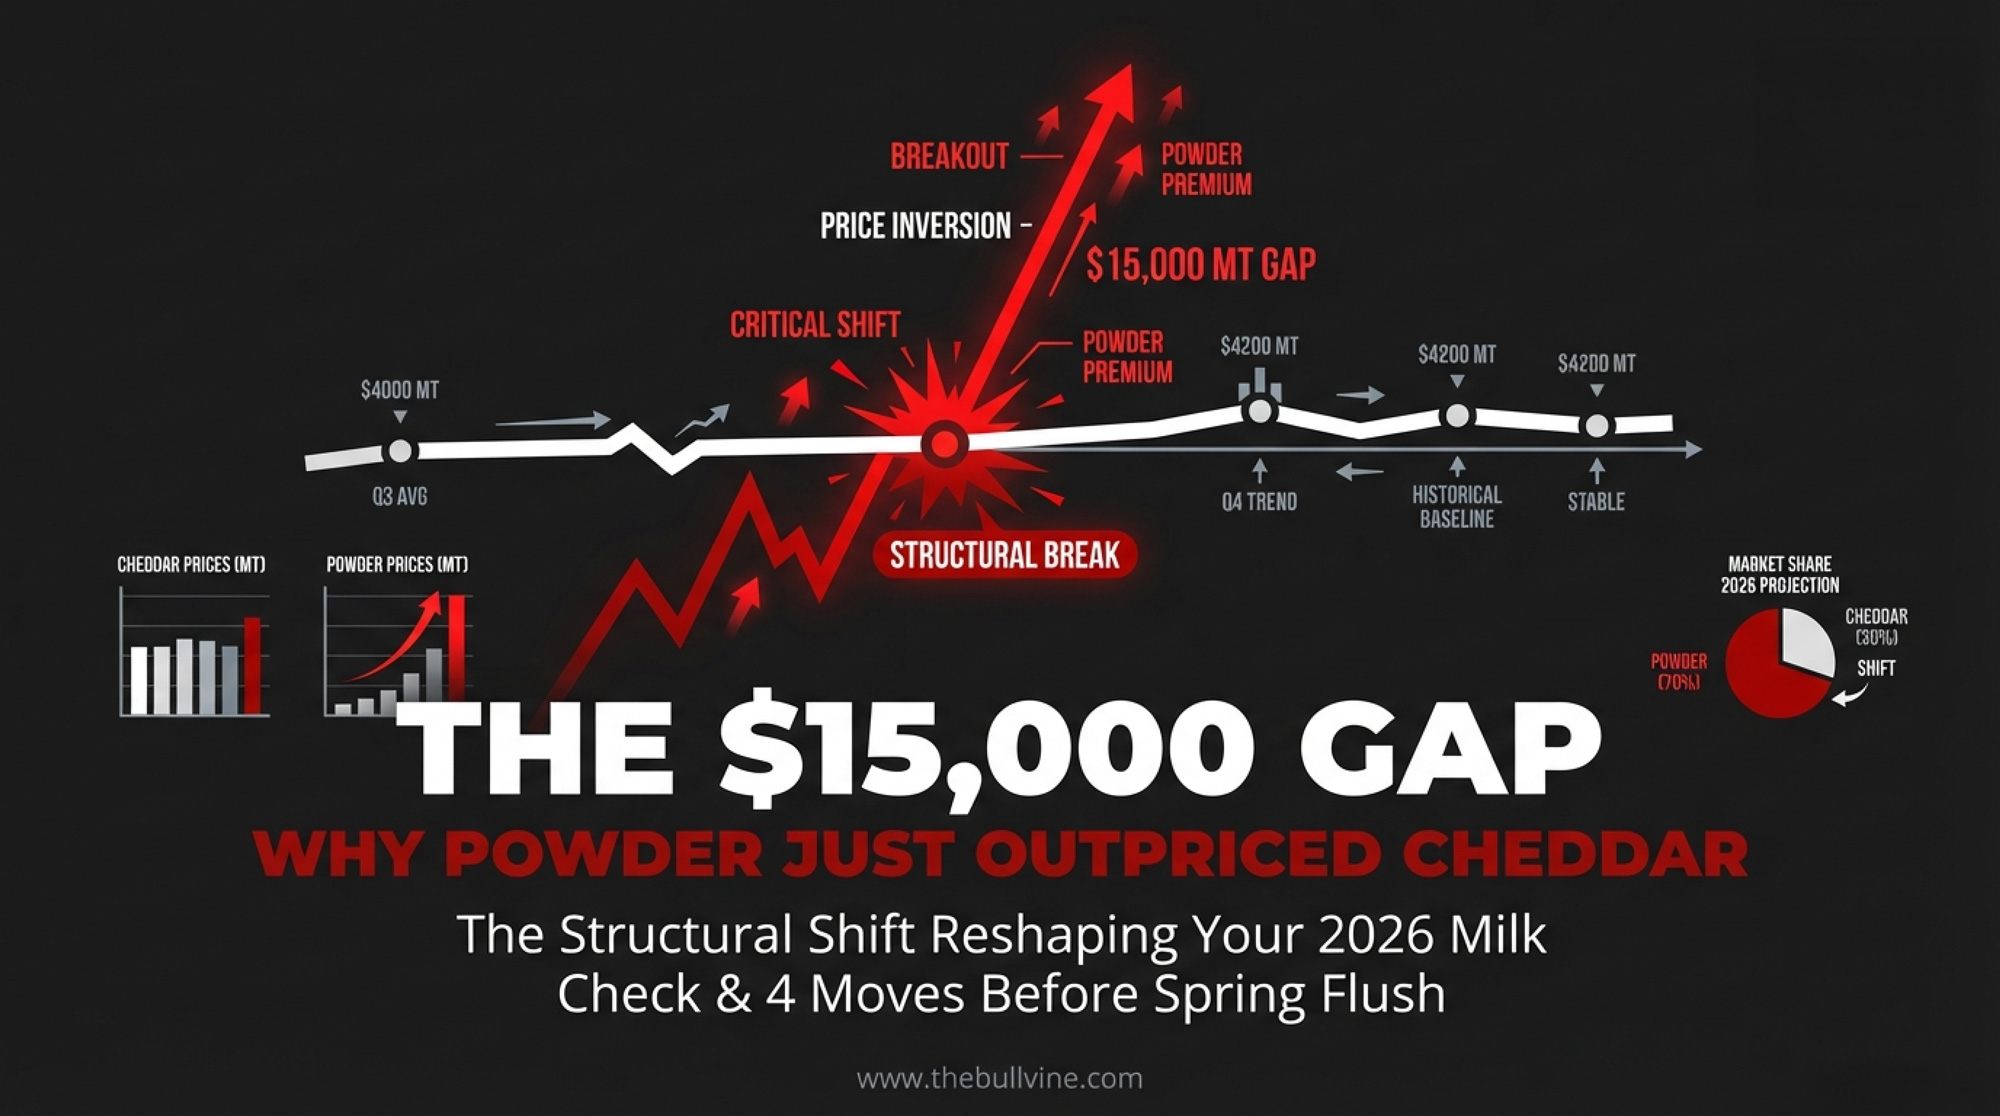
Executive Summary: NDM jumped 18¢ in a single week to $1.64/lb — the biggest move since 2007 —, and it dragged the entire global dairy complex with it. The GDT index surged 6.7% with every product higher, EEX butter futures ripped 10.7%, and forward Class IV is now running $1.40+/cwt above Class III through year-end. On a 500-cow herd, that spread alone is worth $11,000–$16,000 a month. EU spot butter tells the flip side: down 46.6% year-over-year, a reminder that last year’s overproduction hasn’t cleared, even as dry whey slipped to become the week’s only loser. The scarcity behind this powder rally isn’t going away — 2025 NDM/SMP output was the weakest since 2013, while $11 billion in new US processing capacity went to cheese, not dryers. DMC enrollment closes February 26, Ever.Ag is projecting payouts above $1/cwt through April, and if you haven’t run the numbers on your Class III/IV exposure this week, you’re already behind.
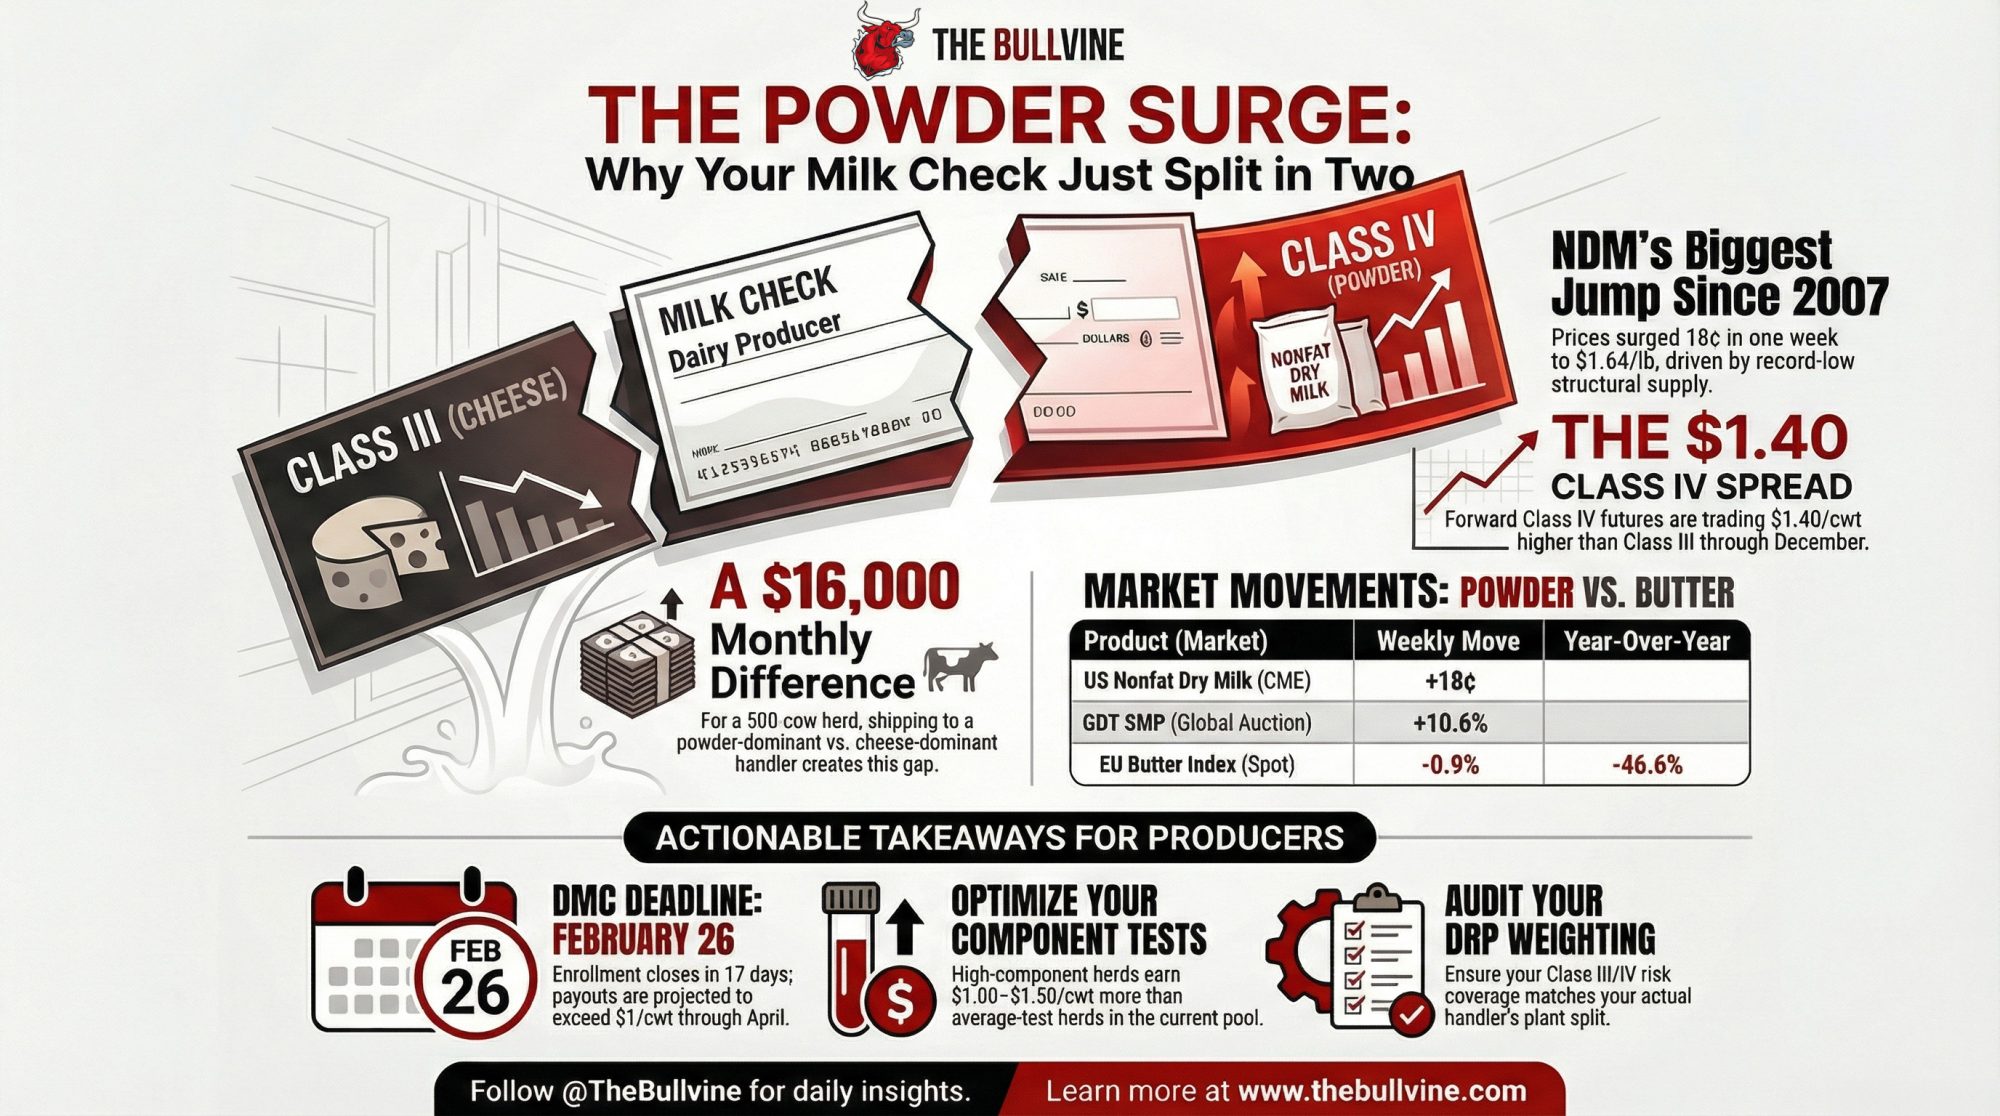
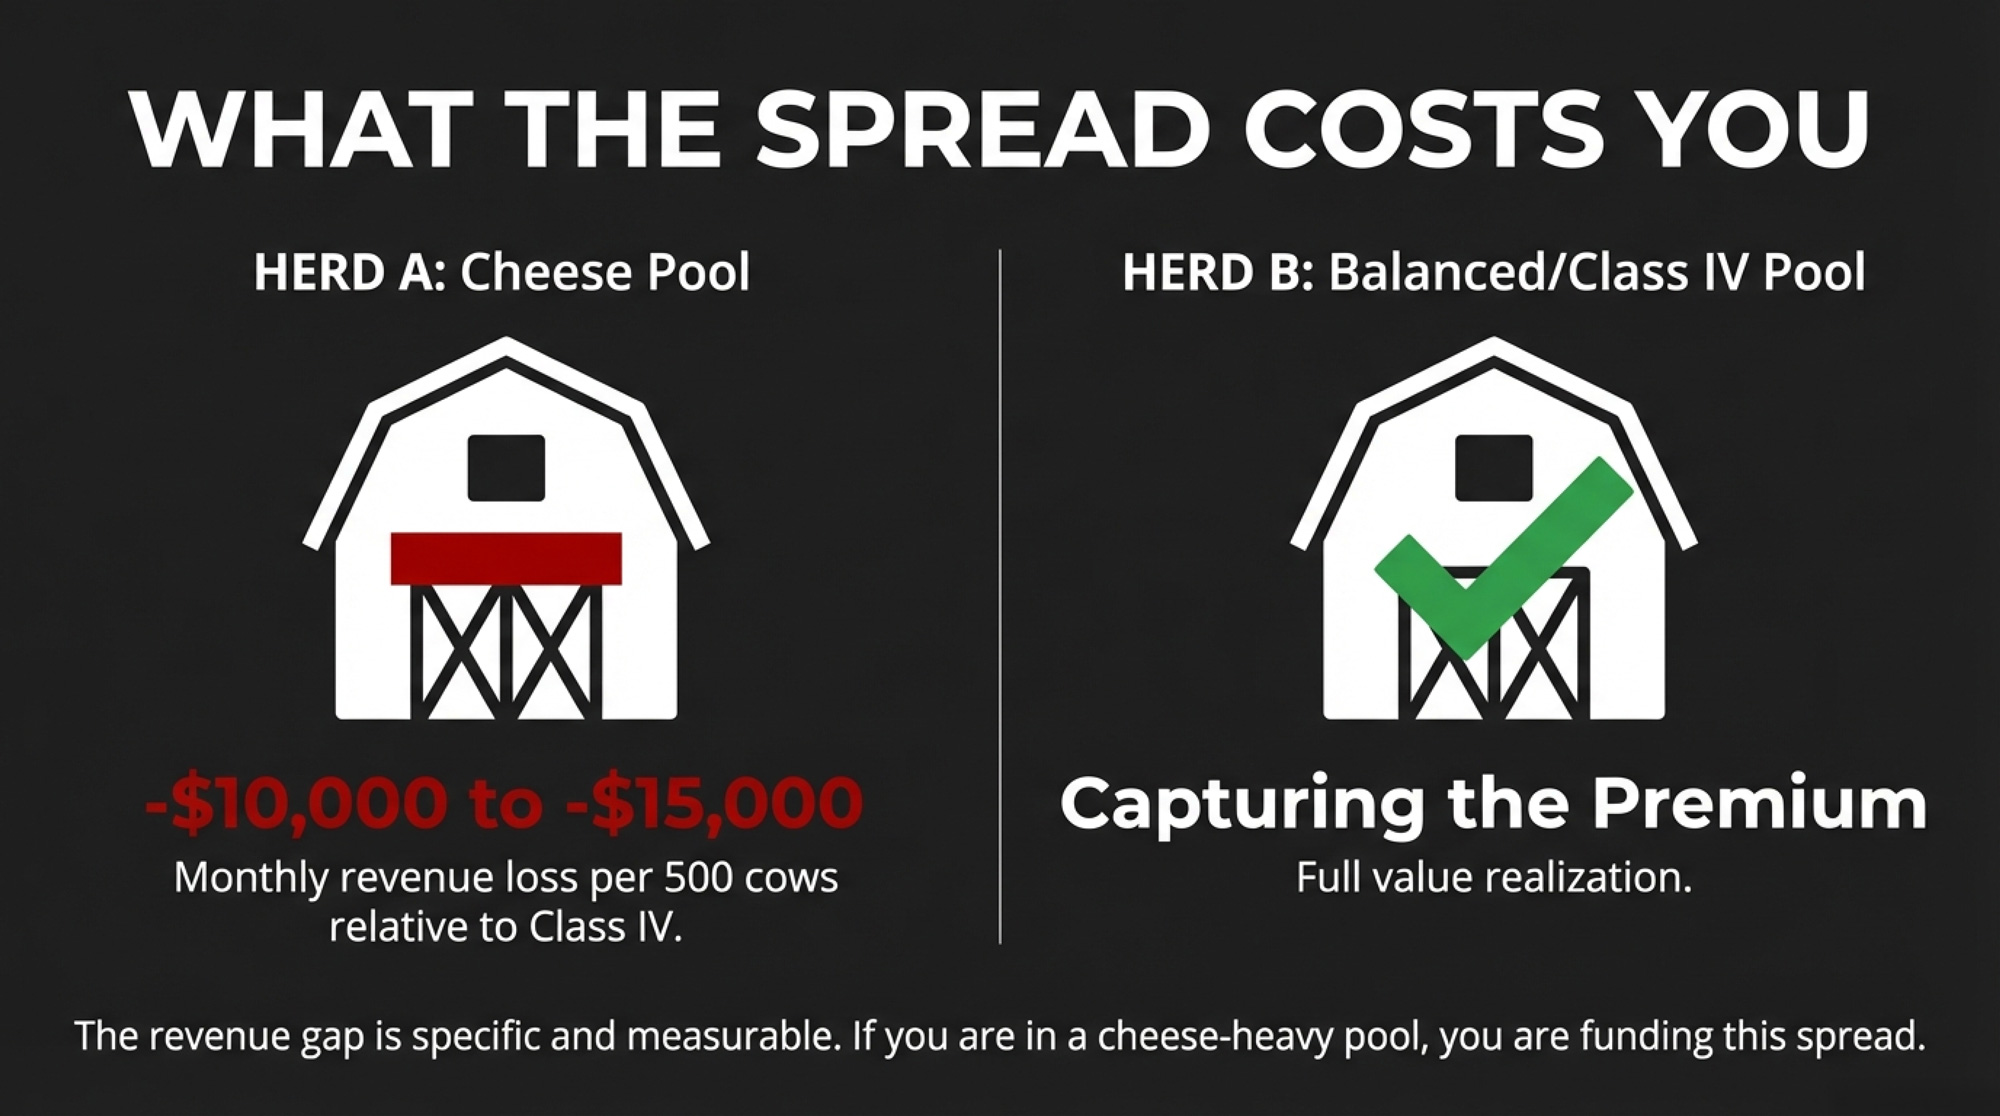
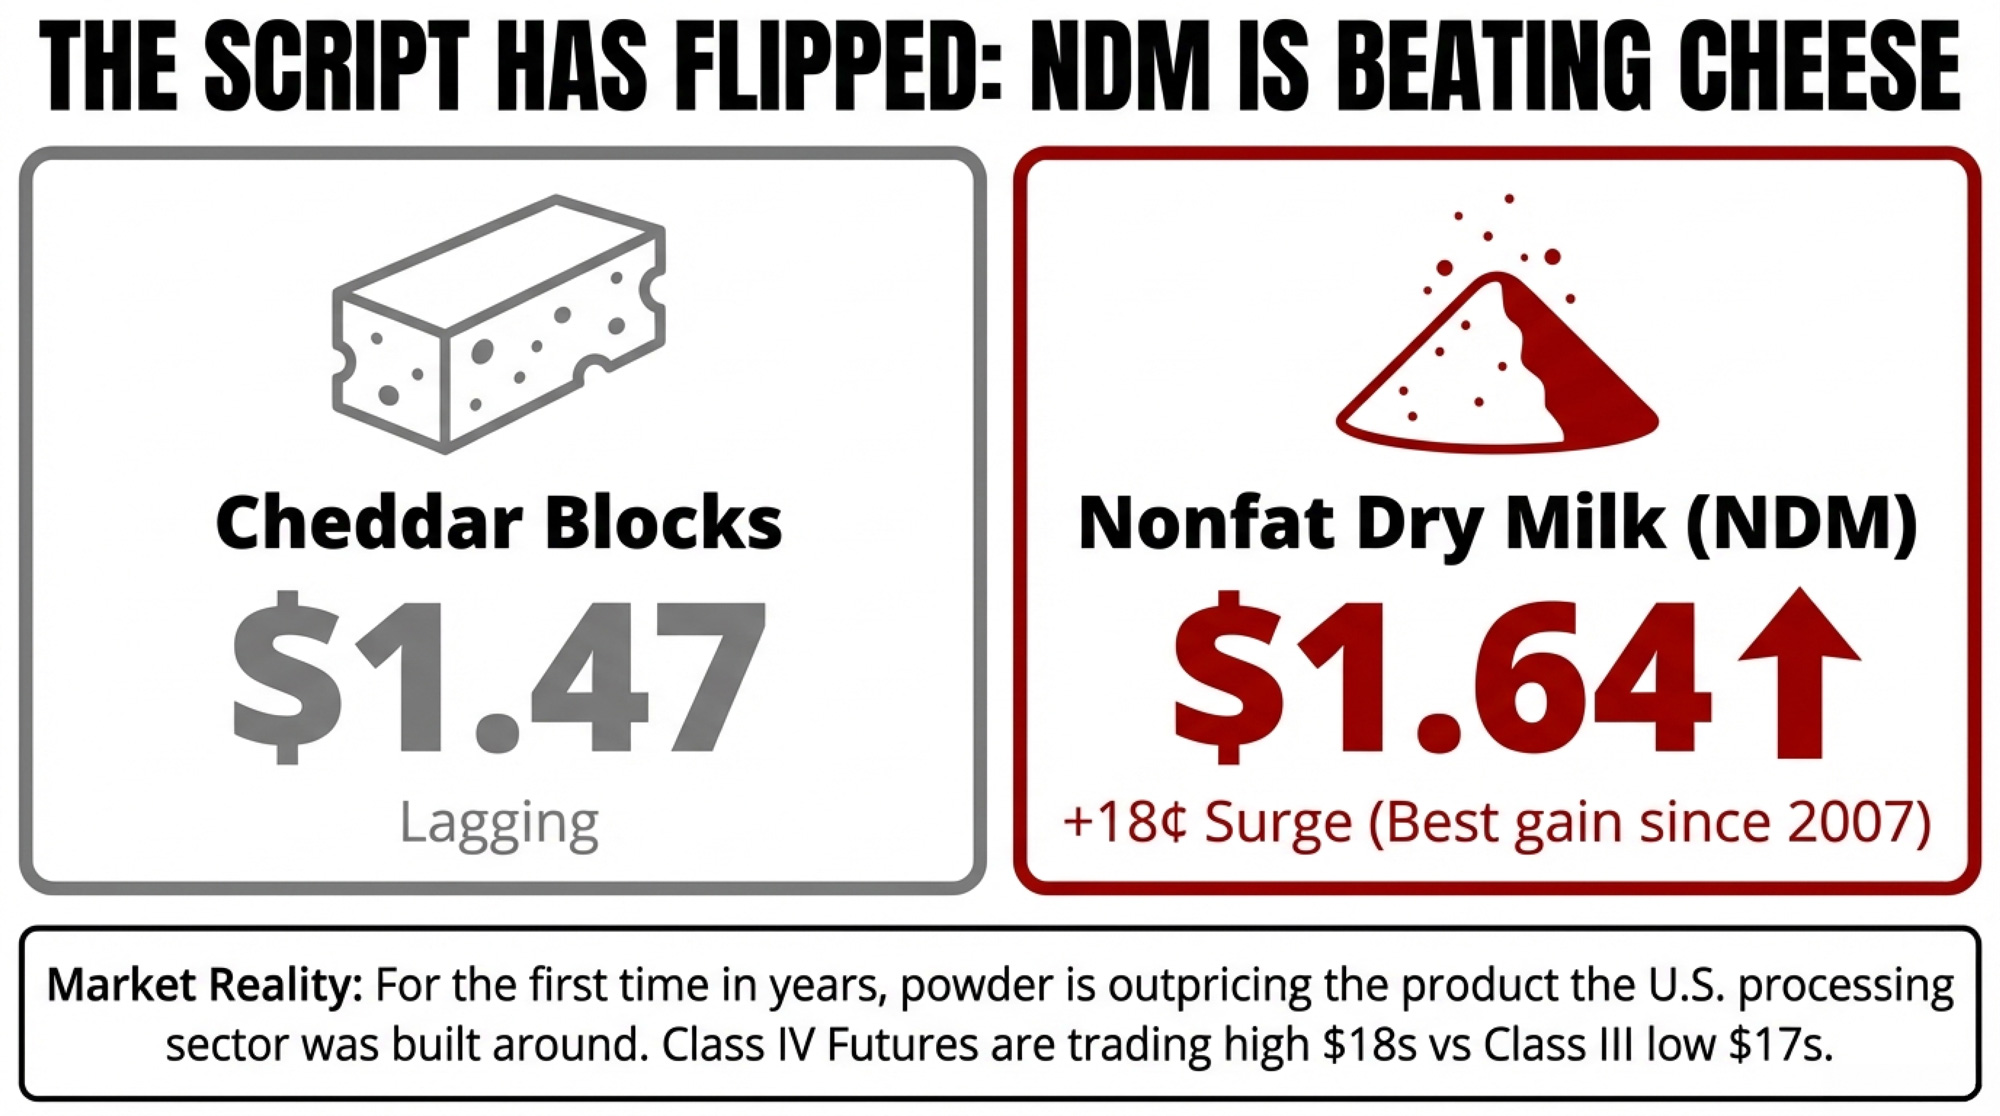
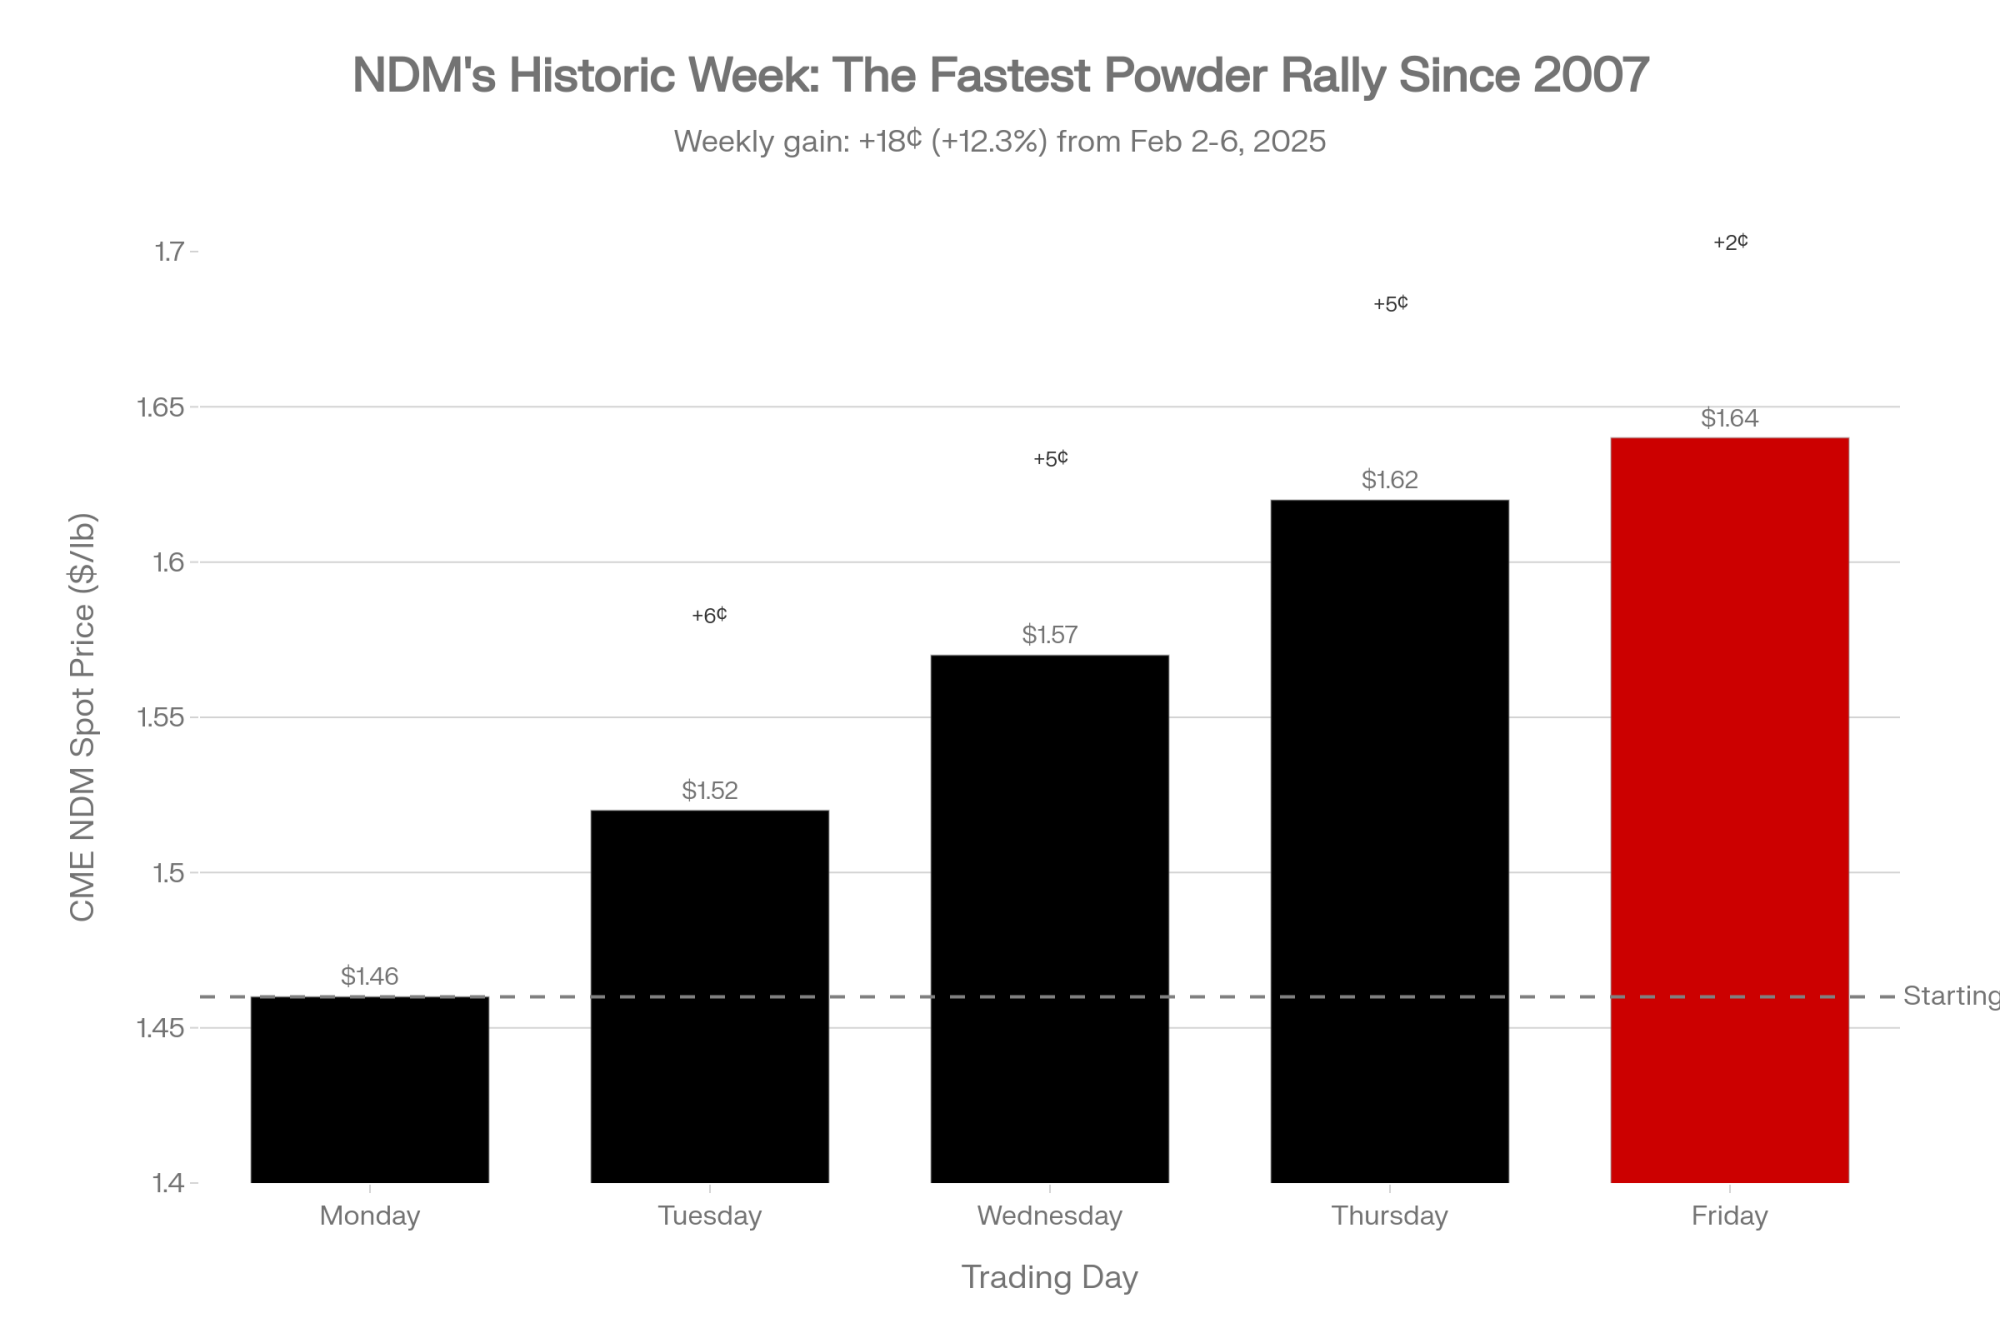
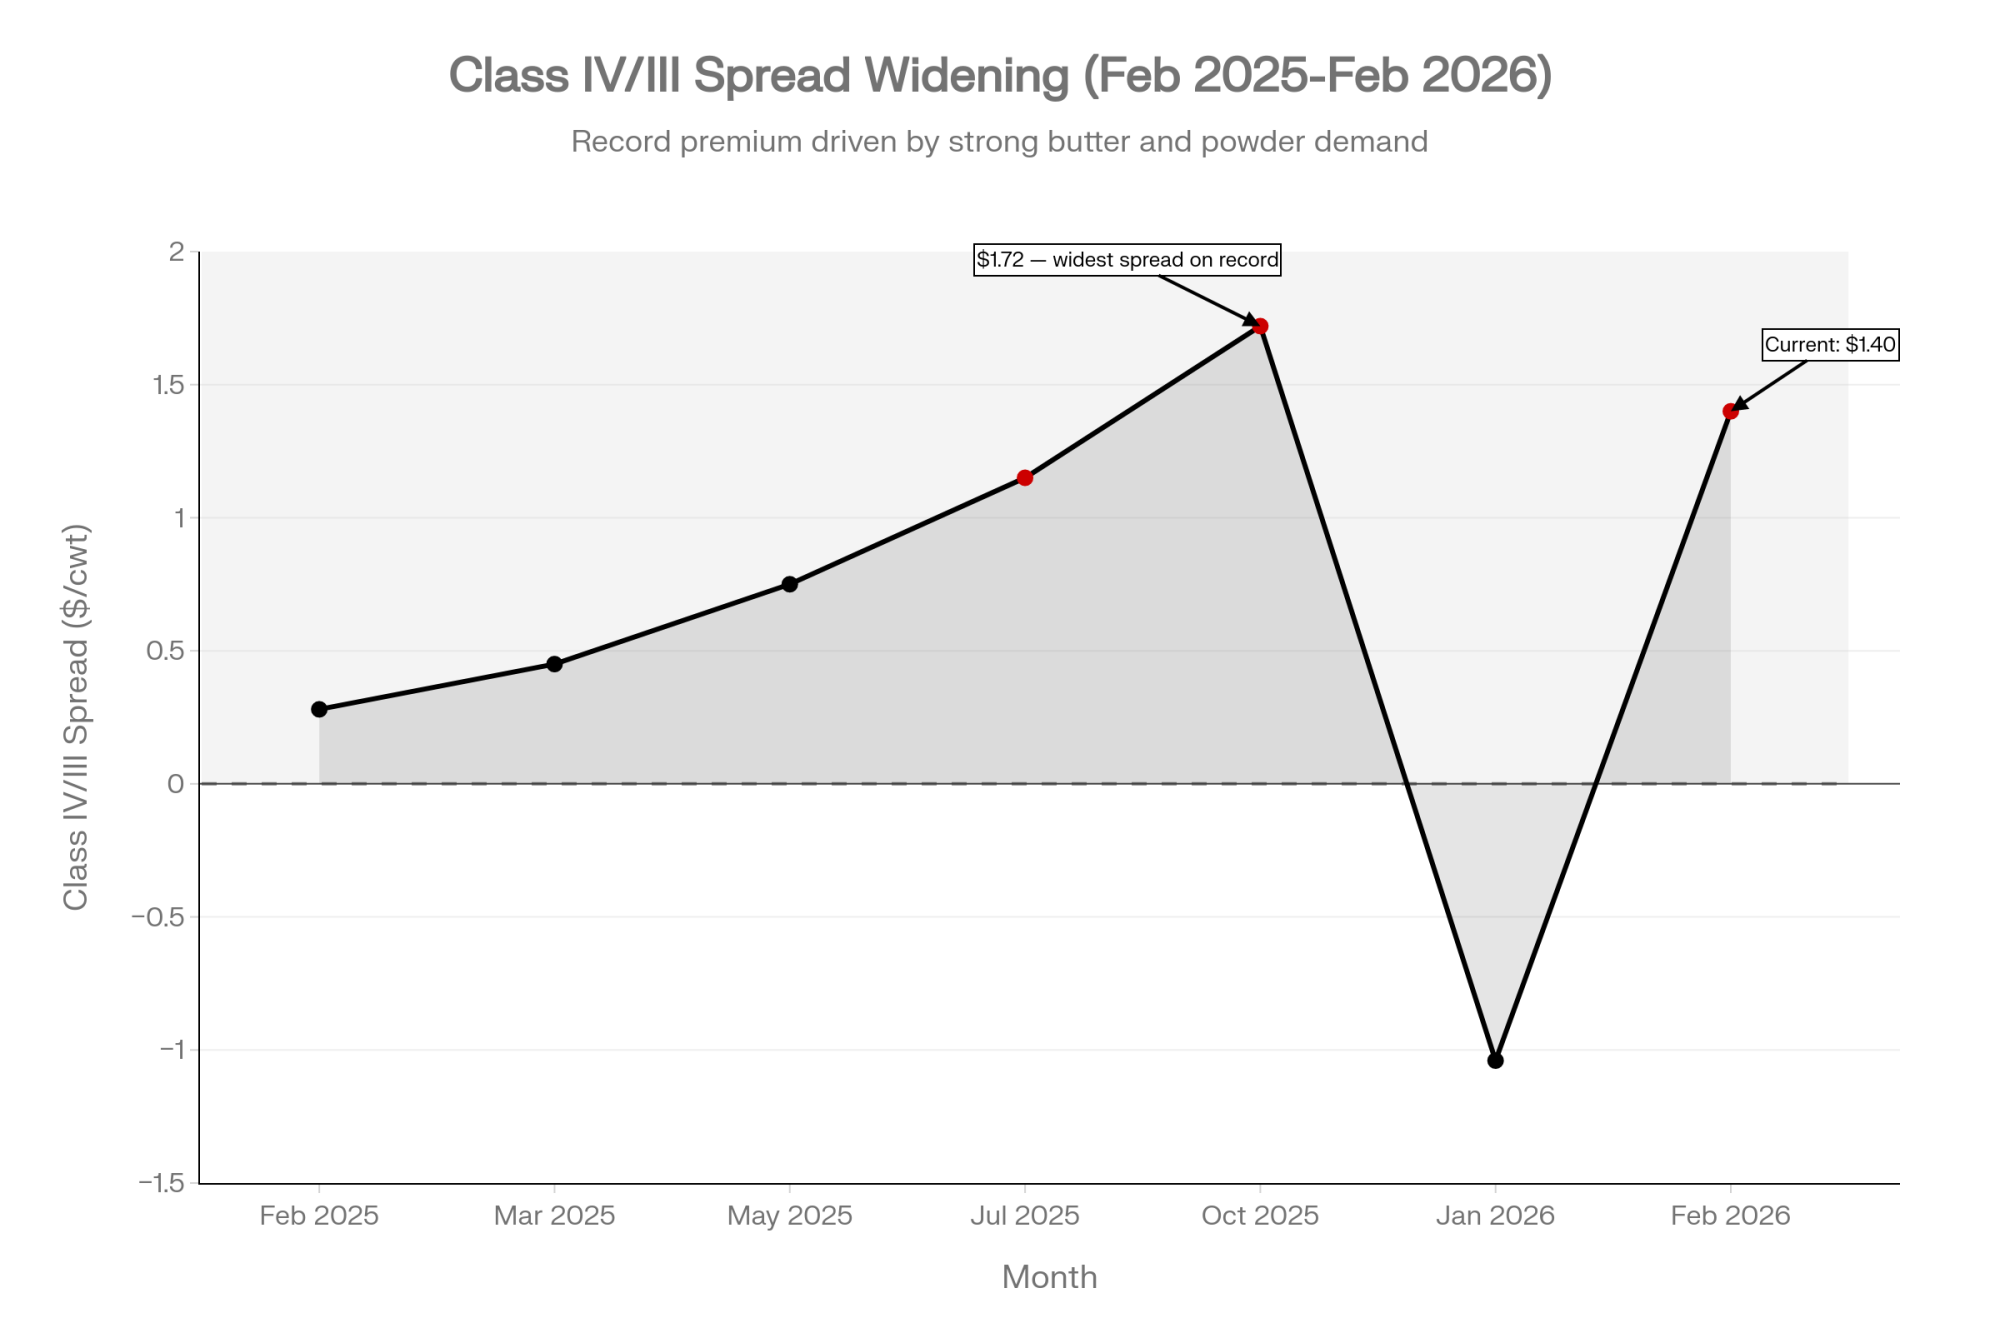
Nonfat dry milk surged 18¢ in a single week to settle at $1.64/lb on Friday — its highest CME spot price since August 2022 and the strongest weekly dairy market gain since May 2007. By Friday, Class IV futures from March through December 2026 were trading in the high $18s/cwt while Class III sat just above $17/cwt. That’s a spread north of $1.40/cwt, and on a 500-cow herd producing roughly 11,250 cwt/month, it works out to $11,000–$16,000/monthdepending on your component tests and pool structure. NDM is now 16.75¢ above Cheddar blocks — and within pennies of butter.
| Herd Size (cows) | Monthly Production (cwt) | At $0.50 Spread | At $1.00 Spread | At $1.40 Spread (Current) |
| 250 | 5,625 | $2,813 | $5,625 | $7,875 |
| 500 | 11,250 | $5,625 | $11,250 | $15,750 |
| 750 | 16,875 | $8,438 | $16,875 | $23,625 |
| 1,000 | 22,500 | $11,250 | $22,500 | $31,500 |
USDA’s own weekly NDM report for February 2–6 spells it out: “Tight inventories are the primary factor driving prices higher, as some manufacturers have limited or no spot loads available in the near term.” Katie Burgess, director of risk management at Ever.Ag, put the margin picture in sharper terms — her models show DMC payouts of “more than $1 per hundredweight for January through April, and then some smaller payments for May through July as well.” That was modeled before this week’s powder rally reshaped the Class IV curve.
This Week at a Glance
| Market | Key Price | Weekly Move | YoY |
| US NDM (CME spot, Feb 6) | $1.64/lb | +18¢ | — |
| US Cheddar Blocks (CME spot) | $1.4725/lb | +11¢ | — |
| US Butter (CME spot) | $1.71/lb | +13¢ | — |
| GDT Index (TE397, Feb 3) | +6.7% | — | — |
| GDT SMP | $2,874/MT | +10.6% | — |
| EEX Butter (Feb–Sep 26 strip) | €4,730/MT | +10.7% | — |
| EU Butter Index (spot, Feb 4) | €3,933/MT | -0.9% | -46.6% |
| EU Whey Index (spot, Feb 4) | €999/MT | Flat | +12.5% |
GDT TE397: Every Product Up — Short Squeeze or Real Demand?
The February 3 auction was all green. SMP and Mozzarella led at +10.6% each. Butter jumped 8.8% to $5,773/MT. WMP gained 5.3% to $3,614. Even Cheddar — the laggard — posted 3.8% to $4,772.
| Seller | Product | C2 Price | vs Prior GDT |
| Fonterra | WMP Regular | $3,590 | +$205 (+6.1%) |
| Fonterra | SMP Medium Heat (NZ) | $2,920 | +$275 (+10.4%) |
| Arla | SMP Medium Heat (EU) | $2,800 | +12.4% |
| Solarec | SMP (Belgian) | $2,875 | +12.5% |
| Solarec | Butter | $4,950 | +9.6% |
CZ App’s February 8 analysis describes the rally as partly a short squeeze — traders who’d sold forward at lower levels were forced to cover as stops triggered. But the demand side has real teeth too. Strong participation from Asia and the Middle East, with pre-Ramadan and pre-Easter purchasing piling on. Algeria’s ONIL tendered for 56,000 tonnes of WMP — more than double expectations — which tightened supply quickly.
The total volume of 24,034 tonnes wasn’t unusually high. This was a demand-driven move on limited supply, amplified by positioning — not processors dumping product. The February 17 GDT will show whether the squeeze has run its course or genuine scarcity is sustaining these levels.
Global Futures: EEX and SGX Both Surge — Whey the Exception
On EEX, 5,365 tonnes (1,073 lots) traded last week. Thursday alone accounted for 1,805 tonnes — the busiest single session.
| Exchange | Product | Avg Price | Weekly Move |
| EEX | Butter (Feb–Sep 26) | €4,730/MT | +10.7% |
| EEX | SMP (Feb–Sep 26) | €2,605/MT | +9.4% |
| EEX | Whey (Feb–Sep 26) | €1,019/MT | -1.8% |
| SGX | WMP (Jan–Aug 26) | $3,791/MT | +8.6% |
| SGX | SMP (Jan–Aug 26) | $3,298/MT | +11.0% |
| SGX | AMF (Jan–Aug 26) | $6,281/MT | +6.3% |
| SGX | Butter (Jan–Aug 26) | $5,664/MT | +7.3% |
SGX SMP’s 11.0% weekly gain actually outpaced EEX — this isn’t just a European story. SGX traded 11,266 lots for the week, more than double EEX volume. The NZX milk price futures contract moved 1,763 lots (10,578,000 kgMS).
The outlier? EEX Whey, down 1.8%. Spot demand is migrating toward higher-protein concentrates and isolates, leaving standard whey behind. CZ App’s February 8 report also flagged quality concerns in the infant formula segment as a factor pushing WPC80 and specialty ingredient demand higher, with whey protein prices up more than 25% in both the EU and New Zealand. Same protein-shift story stateside.
EU Spot Prices: The -46.6% YoY Butter Collapse Nobody’s Talking About
The EU weekly quotations from February 4 paint a more complicated picture than the futures. Week-on-week, SMP gained 4.4%, and Mozzarella rose 2.6%. Zoom out year-over-year, and it’s brutal.
| Index | €/MT | Weekly | YoY |
| Butter | €3,933 | -0.9% | -46.6% |
| SMP | €2,247 | +4.4% | -10.6% |
| WMP | €3,065 | -0.3% | -30.0% |
| Whey | €999 | Flat | +12.5% |
| Cheddar Curd | €3,222 | -1.4% | -33.1% |
| Mild Cheddar | €3,248 | -0.1% | -31.9% |
| Young Gouda | €3,059 | +1.1% | -29.0% |
| Mozzarella | €3,098 | +2.6% | -24.0% |
Butter’s collapse — down €3,433/MT from a year ago — is the legacy of 2025’s European production surge. French butter fell €160 (-4.0%) to €3,800, German held at €4,050, and Dutch rose €50 to €3,950. That’s a €250/MT spreadbetween France and Germany. European butter isn’t one market anymore. It’s three markets wearing one index.
Whey remains the lone EU bright spot year-over-year at +12.5% — same protein-demand shift driving the US whey complex.
US Market: The $1.64 NDM Price and the Math Behind the Class IV/III Gap
NDM rose every trading day from Tuesday through Friday. At $1.64/lb, it’s 16.75¢ above Cheddar blocks and closing in on butter at $1.71. US dryers produced just 2.143 billion pounds of NDM/SMP in 2025 — the weakest annual output since 2013, according to the USDA’s Dairy Products report. Combined December output was 170.3 million pounds, down 6.2% year-over-year.
But positioning is part of this story too. CZ App’s analysis points to a rumored US short squeeze in the SMP/NFDM market, with traders forced to cover forward sales at sharply higher prices. Whether you call it scarcity or a squeeze, the practical effect on your milk check is the same.
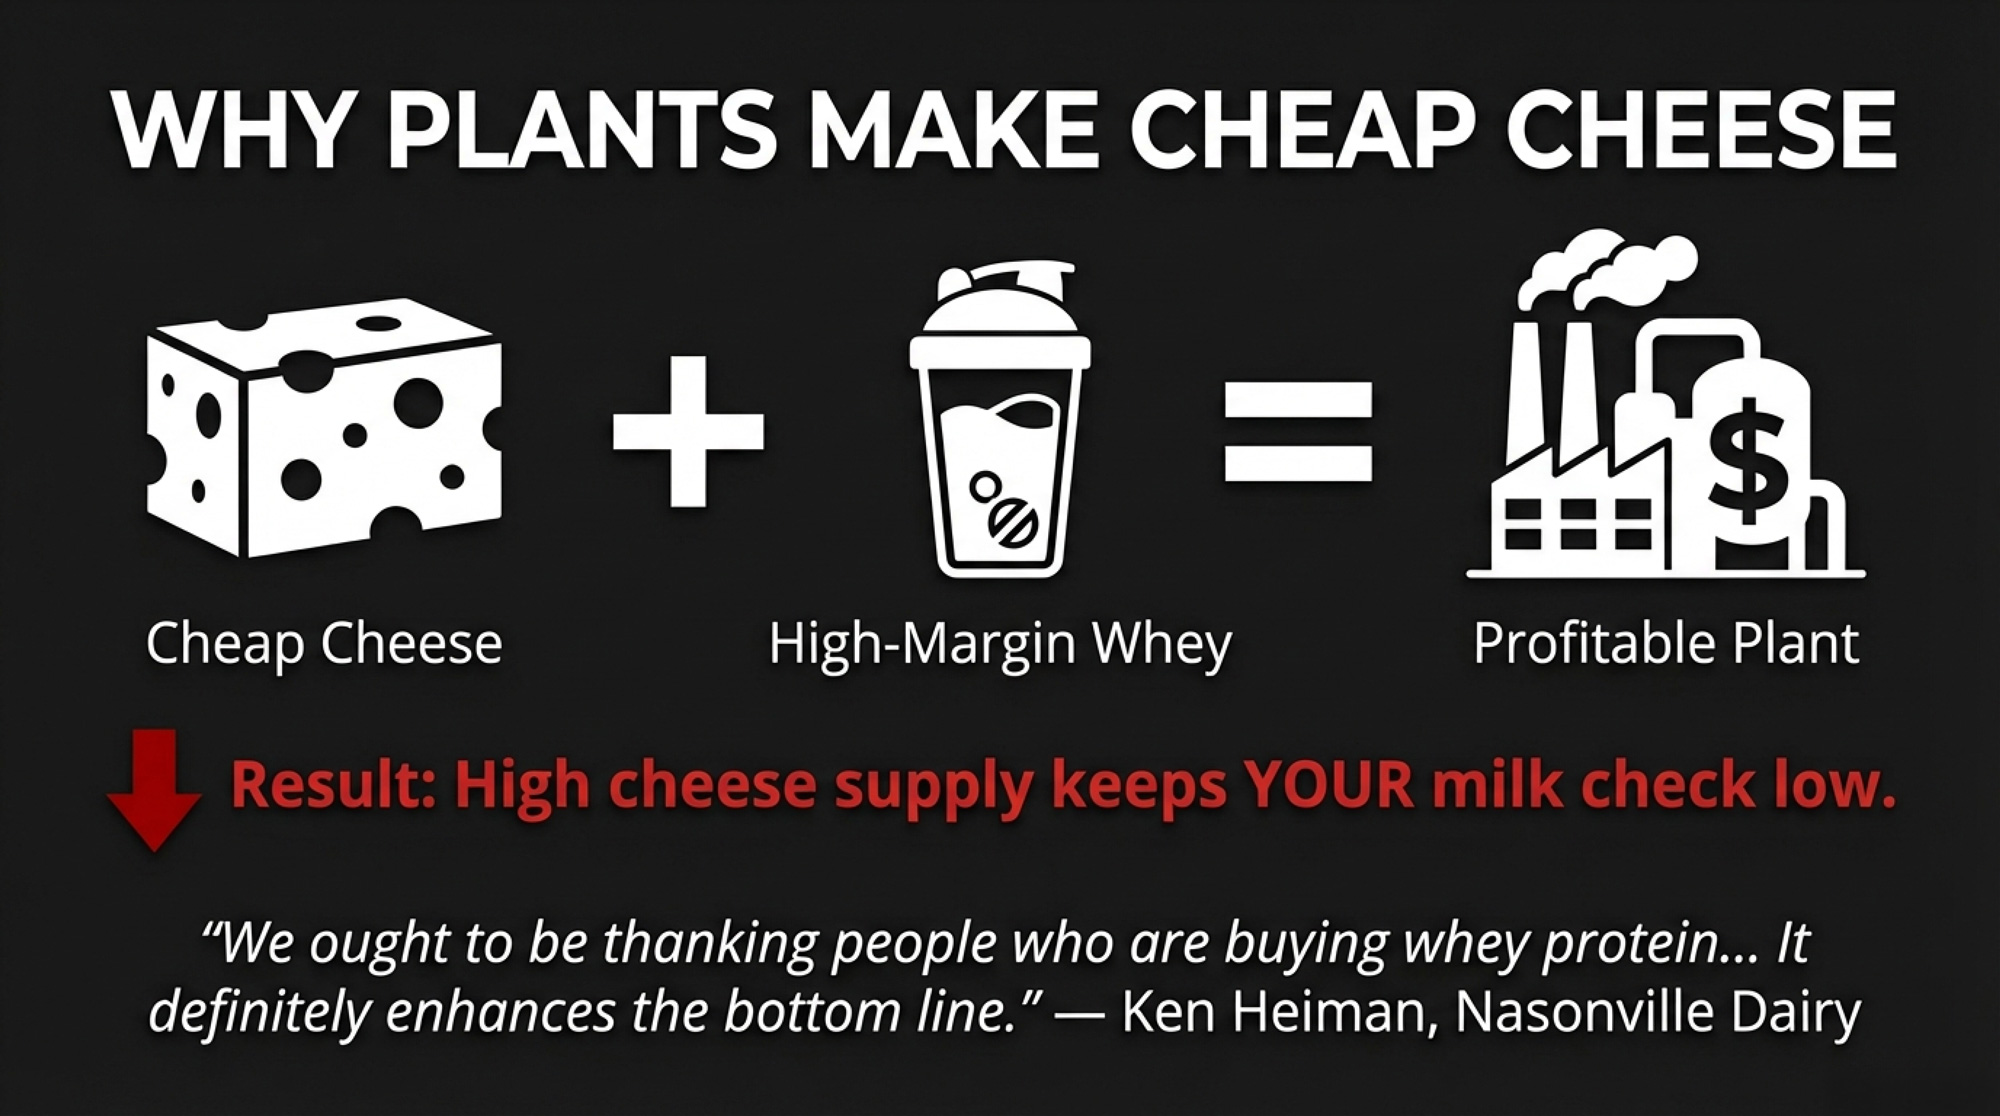
Why is powder so scarce when milk is abundant? Because the $11 billion in new processing capacity that IDFA highlighted on October 2, 2025 — 50-plus projects across 19 states — went overwhelmingly toward cheese and protein, not dryers. IDFA CEO Michael Dykes said the investment “reflects the confidence dairy companies have in the future of American agriculture.” The industry bet on cheese. The market is punishing that bet through the Class IV/III spread.
Despite the GDT’s 10.6% SMP surge, the GDT-priced product still holds roughly a 25¢/lb advantage over CME NDM after correcting for protein levels. That’s choking US export competitiveness and keeping domestic availability tight.
Cheese gained 11¢ on 51 loads to $1.4725/lb — cheap enough globally that US shipments keep running at a record pace. USDEC reported that November 2025 was the seventh consecutive month above 50,000 MT, volume up 28% year-over-year. But December output hit 1.279 billion pounds (+6.7% YoY), with Cheddar alone up 9%. Production isn’t slowing down.
Butter rose 13¢ to $1.71/lb, including a 10.25¢ jump on Thursday. Twenty-one loads traded, but dozens of unfilled bids stayed on the board. December production grew a modest 2% YoY to 203.8 million pounds. The average US fat test hit 4.51% in December per USDA’s Agricultural Prices report — up 0.05 percentage points from a year ago.
Dry whey was the lone loser, down 2¢ to 73¢/lb. Whey protein isolate production surged 11.7% YoY to 20.6 million pounds in December, while lower-protein WPC (25–49.9%) fell 12.8%. The market is telling processors where the money is.
Milk futures: Class III from March through year-end above $17/cwt. Class IV, driven by NDM, in the high $18s/cwt. That forward spread — not the announced January prices — is the defining number in US dairy right now.
Global Production: Where the Supply Pressure Lives
| Country | Period | Volume | YoY | Key Detail |
| Ireland | Dec 2025 | 267kt | -3.0% | Full-year: 9.10M tonnes (+5.0%); butter 286kt (+7.1%) |
| UK | Dec 2025 | 15.4kt butter | +6.6% | Full-year cheese: 513kt (+2.9%) |
| Spain | Dec 2025 | 624kt | +1.8% | Full-year flat (-0.2%); milksolids +3.4% |
| China | Jan 2026 | — | -2.8% farmgate YoY | 3.03 Yuan/kg; cull cycle ongoing |
Don’t confuse Ireland’s December contraction (-3.0%) with structural decline — full-year 2025 collections hit 9.10 million tonnes, up 5.0%. Irish butter production reached 286kt for the year, up 7.1%, and the UK added 6.6% more butter in December. More product hitting export channels. One more reason the EU butter index keeps falling year-over-year, even as powder attempts to stabilize.
China’s ongoing cull cycle — the Ministry of Agriculture confirmed less productive cows are being destocked, with growth driven by yield per cow — could keep Chinese import demand firm through Q2.
Grains and IOFC: $11/cwt Keeps the Lights On, Nothing More
March 2026 soybean meal settled at $303.20/ton on Thursday; March corn at $4.35/bu before giving back ground Friday. South American weather and Trump administration comments about expanding Chinese soybean purchases drove the rally.
At $17/cwt Class III and current grain prices, income over feed cost sits around $11/cwt — consistent with Cattlytics’ January 29 projection of ~$11.40/cwt for 2026. They described it as “not a year that forgives loose management.” Class IV shippers look better on the forward curves. That spread between the two classes isn’t an abstract futures curve — it’s the difference between treading water and building equity.
What This Means for Your Operation
Before anything else, answer three questions your lender will eventually ask:
- What’s your handler’s cheese-to-powder plant split?
- What’s your current DRP Class III/IV weighting?
- What’s your rolling 12-month butterfat test?
If you can’t answer all three, that’s your first move this week.
- Cheese-dominant shippers, check your DRP weighting. The forward Class IV/III spread is real money — potentially off your check. By Friday, Class IV futures were running $1.40+/cwt above Class III from March through December. On a 500-cow herd, that’s $11,000–$16,000/month in potential value difference. Pull your DRP parameters and check whether your III/IV weighting reflects the forward curve, not last year’s relationship.
- Below 4.0% butterfat and 3.1% protein? Run your breakeven now. As of January 2026, FMMO component prices ($1.4525/lb butterfat, $2.1768/lb protein): each 0.1% increase in butterfat translates to roughly $0.15–$0.35/cwt. Moving from average to high-component tests is worth $1.00–$1.50/cwt — roughly $22,000–$34,000 per month on 1,000 cows. Ask your nutritionist for the breakeven test level before the spring flush dilutes components.
- DMC enrollment closes February 26 — 17 days out. The One Big Beautiful Bill Act reauthorized DMC through 2031 with expanded Tier 1 coverage up to 6 million pounds (up from 5 million). NMPF reported the predicted December 2025 margin at $9.19/cwt — generating a $0.31/cwt payment at $9.50 coverage, the only DMC payout for 2025. But 2026 looks different. Ever.Ag’s Burgess projects payouts exceeding $1/cwt January through April. NMPF’s William Loux confirmed he “would certainly expect to see some DMC payments here through the first quarter and probably through the first half of the year.” At 15¢/cwt for Tier 1 enrollment, Burgess calls DMC “the best risk management coverage you can buy right now.” The six-year lock-in (2026–2031) saves 25% on premiums but sacrifices annual flexibility. Run the math against your feed cost trajectory.
- Consider locking 30–40% of forward powder exposure before the February 17 GDT. The Feb26–Sep26 EEX SMP strip at €2,605 and the CME Class IV near $18.50/cwt offer a window. But CZ App flags short-squeeze dynamics in this rally. If the squeeze unwinds, prices give back a chunk fast. If genuine scarcity persists, unhedged operations fall further behind. Neither outcome is wrong — being completely unhedged is.
- Canadian producers: your export-class economics just improved. The CDC’s 2.3255% farm-gate price increase took effect on February 1, with carrying charges rising to $0.0254/kg of butter from $0.0137/kg. But your CEM allocation and export-class shipments are priced off these same global benchmarks. This GDT rally directly supports Class 5 (export) pricing. If GDT SMP holds above $2,800 at TE398, P5 pool returns should reflect it in the next provincial board pricing announcement — watch for the butter-to-SMP ratio shift.
- Two signals to watch over the next 30 days. (1) If NDM/SMP output stays below 180 million pounds in the USDA’s next Dairy Products report, the scarcity thesis holds. (2) A second consecutive strong GDT auction on February 17 (TE398) confirms this isn’t just short-covering. If prices retreat sharply, the squeeze narrative wins, and you want downside protection in place.
The Bottom Line
The hard choice this week isn’t whether the rally is real — the data says it is, even if short-covering is turbocharging the move. The hard choice is whether you position for it to continue or protect against it reversing. Producers who locked in forward coverage three weeks ago are sitting pretty. The ones who waited are chasing. What does your plan for February 17 look like?
Complete references and supporting documentation are available upon request by contacting the editorial team at editor@thebullvine.com.
Learn More
- Same Cows, $15,000 Apart: Class III Milk Price, DRP, and Your Spring 2026 Risk Plan – Capture the Class III/IV spread with specific DRP weighting strategies that separate high-margin herds from the rest, arming you with the math to secure revenue before the spring flush dilutes your milk check.
- The $8 Billion Processing Boom That’s About to Reshape Your Milk Check – Expose the structural shift in U.S. processing capacity and discover why cheese-heavy investments are driving powder scarcity, revealing how to position your operation to thrive as the FMMO landscape evolves over the next five years.
- Dairy’s Quiet Victory: How the Protein Market Shift Creates an 18-Month Window of Opportunity – Maximize your revenue by exploiting the beef-on-dairy revolution and component-first genetics, turning current market volatility into a long-term competitive advantage for your herd’s bottom line and future profitability.
 Join the Revolution!
 Join the Revolution!
Join over 30,000 successful dairy professionals who rely on Bullvine Weekly for their competitive edge. Delivered directly to your inbox each week, our exclusive industry insights help you make smarter decisions while saving precious hours every week. Never miss critical updates on milk production trends, breakthrough technologies, and profit-boosting strategies that top producers are already implementing. Subscribe now to transform your dairy operation’s efficiency and profitability—your future success is just one click away.