Archive for herd health economics

Your Fresh Cow Problems Started 6 Weeks Ago: The $70K Dry Period Fix

Metritis Day 5 = Dry pen Day -45. Elite dairies know this. Average dairies pay $70K/year, learning it the hard way. Which are you?

Executive Summary: That fresh cow disease you’re treating today started 6 weeks ago in your dry pen. Research from Barry Bradford at Michigan State and Jessica McArt at Cornell confirms that immune suppression begins around Day -35 and hits bottom at calving—by the time metritis appears on Day 5, the conditions were established on Day -45. This timing gap costs average 400-cow dairies $50,000-$70,000 annually in treatment, lost milk, and reproductive failure. Elite operations running disease rates below 10% have figured this out: instead of reacting to fresh cow problems, they invest upstream in negative DCAD diets (-100 to -150 mEq/kg), dry pen density management, and teat sealants that cut infection rates by 52-70%. Farms making this shift typically see disease rates drop from 35-40% to under 20% within a year. The dry period isn’t downtime between lactations—it’s where your transition success or failure gets decided.

The farms with the best fresh-cow outcomes aren’t doing more in the fresh pen—they’re obsessing over the dry pen.

I know that feels backwards. We pour so much energy into treating ketosis, monitoring for metritis, and dealing with fresh-cow problems after they show up. But here’s what the research keeps telling us: by the time you see disease in the fresh pen, the damage was done 4-6 weeks earlier. That metritis case on Day 5? It started around Day -45.

Work from Cornell and other land-grant universities puts the cost of preventable fresh-cow disease at $50,000 to $70,000 annually for a 400-cow dairy. Elite operations running disease rates below 10% capture that value. Average operations? They’re paying what amounts to a “mediocrity tax” every single year.

So what are the top performers actually doing differently? That’s what we’re digging into.

Disease Rate CategoryFresh Cow Disease RateAnnual Cases (400 cows)Cost per CaseTotal Annual Loss
Elite Performance10%40$450$18,000
High Performance15%60$450$27,000
Industry Average35%140$450$63,000
Poor Performance40%160$450$72,000

The Real Cost—It’s Bigger Than You Think

Garrett Oetzel at Wisconsin has documented how transition costs cascade, and the numbers are worth understanding. Treatment for metritis, mastitis, and clinical ketosis runs $80-$150 per case. But that’s just the visible part.

Lost milk hits harder. Jessica McArt’s research team at Cornell found that subclinical ketosis (BHBA ≥1.2 mmol/L) decreased milk production by 0.5 kg/day during the first 30 days of lactation. And here’s what caught my attention: each 0.1 mmol/L increase in BHBA also raised the risk of displaced abomasum and early culling. That’s not a sick cow for a week—that’s damage following her through the entire lactation.

Reproduction takes a hit, too. Research from Overton’s group at Cornell showed cows with elevated NEFA or BHBA had 13-19% lower pregnancy probability within 70 days of the voluntary waiting period. At roughly $4 per day open, you can see how the math compounds pretty quickly.

Mortality clusters early. Industry data consistently shows dairy cow deaths are disproportionately concentrated in the early lactation period, with transition complications as a leading cause.

When you add it all up, the total cost per case of transition disease ranges from $300 to $700, depending on severity and what else goes wrong downstream.

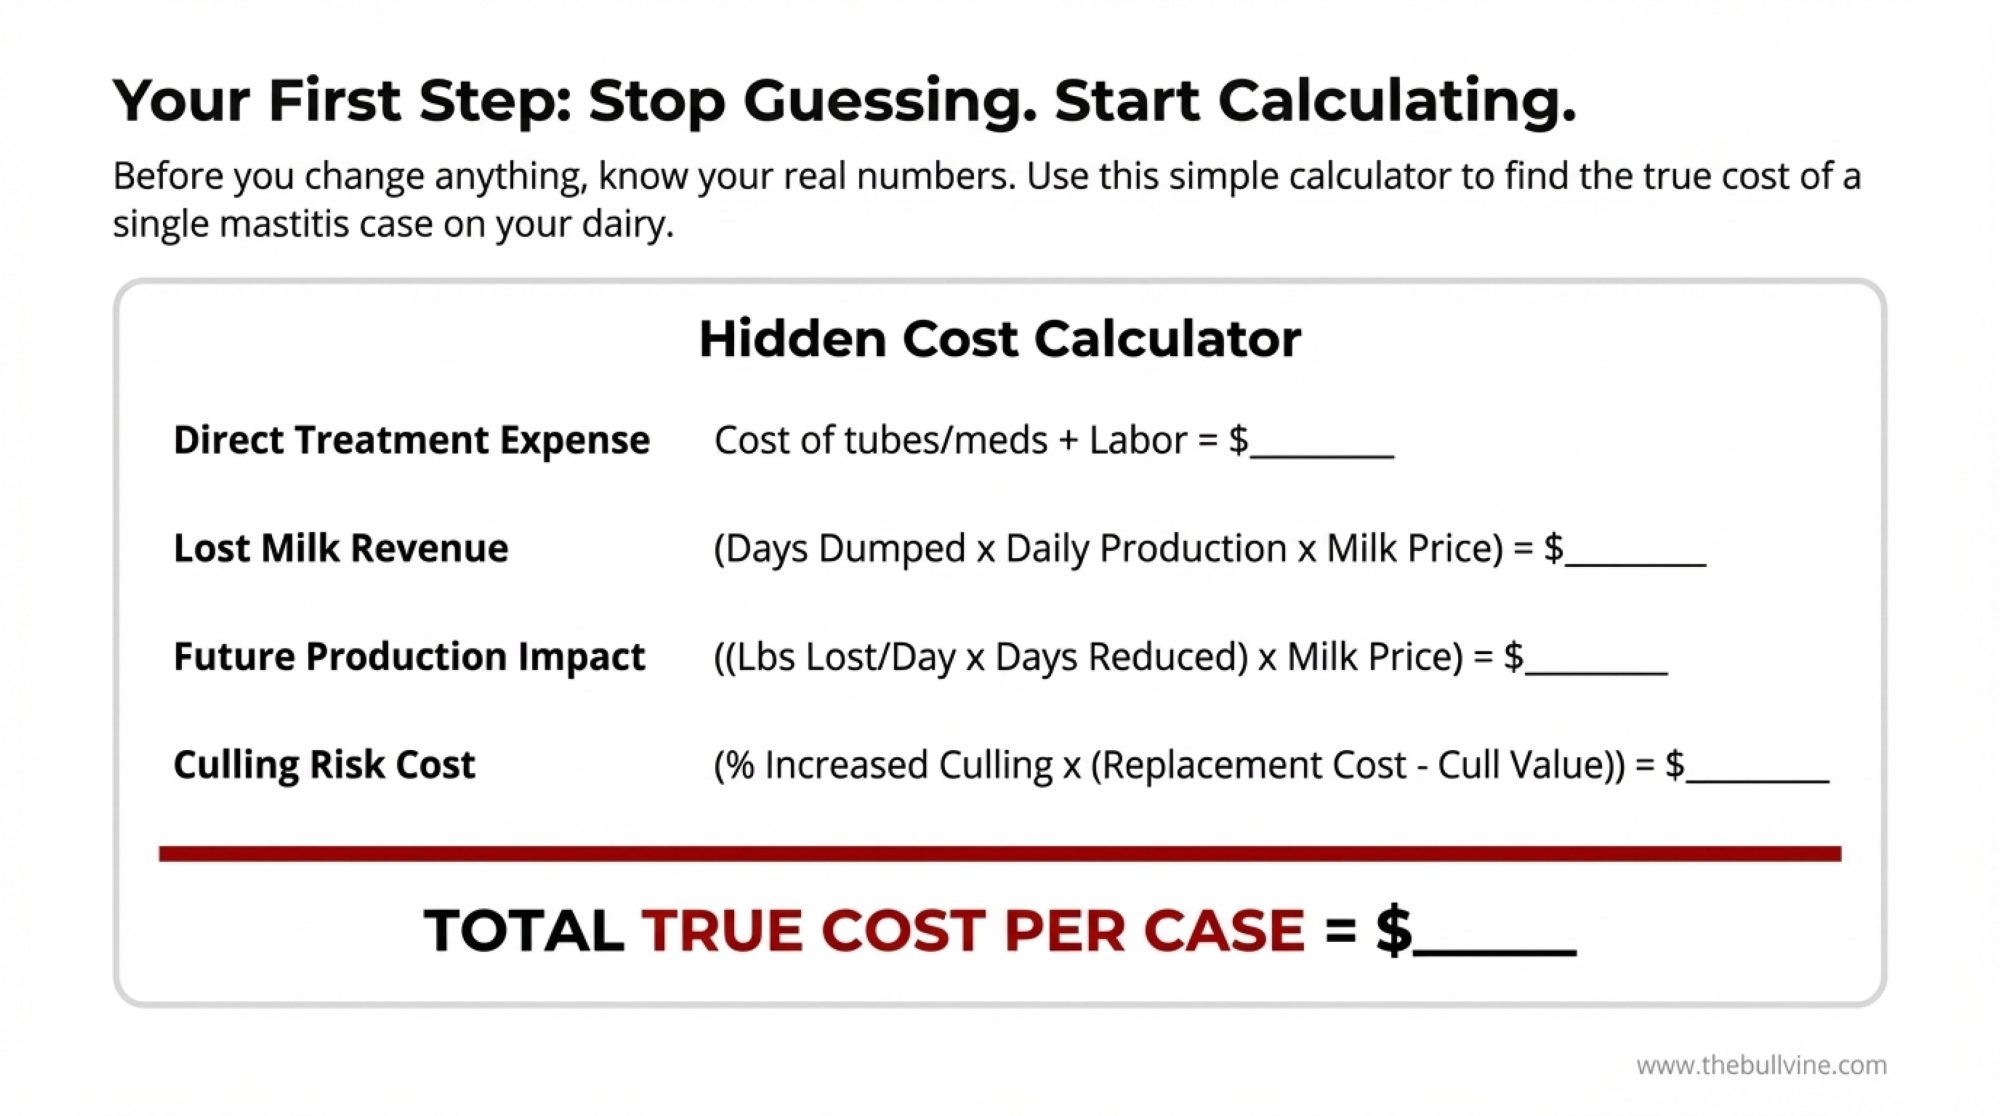
Here’s a quick way to see what this might mean for your operation:

Herd size × disease rate × $450 = annual transition losses

400 cows at 38% disease rate: 400 × 0.38 × $450 = $68,400/year

400 cows at 15% disease rate: 400 × 0.15 × $450 = $27,000/year

The difference: over $41,000 in recoverable value—not theoretical savings.

The $115 treatment you see vs the $385 in damage you don’t.

“Most producers don’t calculate these costs because they’re scattered across multiple categories,” Tom Overton at Cornell has observed. “The treatment expense is visible. The lost milk shows up gradually. The impact of reproduction doesn’t surface for months. But when you put it all together, transition disease is often the single largest controllable cost on the dairy.

That’s worth sitting with for a minute.

The Biology: What’s Actually Happening

Here’s where things get interesting—and where the conventional approach starts to look incomplete.

Barry Bradford (now at Michigan State) and Lorraine Sordillo have mapped the immune trajectory around calving in considerable detail. The timeline matters more than most of us realized.

The Immune Suppression Timeline

TimeframeWhat’s Happening
Day -35 to -21Inflammatory responses triggered by rapid fetal growth begin suppressing immune function
Day -21 to -7Metabolic stress intensifies as the cow shifts into negative energy balance; feed changes disrupt rumen microbiota
Day -7 to calvingEnvironmental stressors peak—overcrowding, pen moves, and heat stress all compound the immune suppression
Day 0 to +3Immune function hits its lowest point—this is when infections take hold
Day +5 to +14Clinical disease appears—but the conditions were set weeks earlier

As Bradford explains it: “The inflammatory cascade that compromises immune function starts with fetal cortisol release and metabolic changes that happen well before we see clinical signs. By the time a cow develops metritis on Day 7, the conditions that allowed that infection were established three to four weeks earlier.

By the time you’re treating disease, immune collapse happened 10 days ago.

The implication is pretty clear: you can’t fix fresh-cow disease in the fresh pen. You prevent it in the dry pen.

From what I’ve observed across Midwest and Northeast operations, average farms dedicate 60-70% of transition attention to fresh cows and maybe 25-35% to dry cows. The elite performers? They often flip that ratio entirely.

What High Performers Actually Do

When you talk to veterinarians, nutritionists, and managers at farms achieving consistently strong transition outcomes, certain patterns keep showing up.

Measurement Discipline

The biggest difference between average and elite isn’t fancy technology—it’s measurement.

Top farms track fresh-cow disease weekly by condition. They compare the first DHI test against genetic expectations. They run BHBA blood tests to catch subclinical ketosis before it becomes clinical. They review days open monthly with their vet team.

Average farms? Most can’t tell you their actual disease rate. They’re estimating. And you probably know this already, but without measurement, it’s nearly impossible to know if you’re improving—or to identify which interventions are actually working.

“The farms that turn this around always start the same way,” Jessica McArt has observed. “They commit to measuring outcomes systematically before they change anything else. You need that baseline, or you’re just guessing.

Written Protocols

This sounds almost too simple, but elite operations develop written disease definitions and treatment protocols with their veterinarians. Exact criteria for each condition. Standardized treatments. Clear escalation triggers.

Why does this matter so much? Consistency. It doesn’t depend on who’s working that day. It’s a repeatable process that survives staff turnover—and staff always turns over eventually.

Dedicated Monitoring Time

Here’s where commitment becomes tangible. High-performing farms dedicate 1.5-2 hours daily specifically to fresh-cow monitoring. Structured screening with documented results—not casual observation while doing other tasks.

The daily routine typically includes appetite assessment, attitude evaluation, discharge observation, udder examination, and locomotion scoring. Results get to the manager each morning for same-day decisions.

Catching subclinical ketosis on Day 3 rather than clinical ketosis on Day 7 changes outcomes dramatically. But you can’t catch what you’re not systematically looking for.

Dry-Period Investments That Pay Forward

Farms achieving elite transition outcomes share common approaches to dry-period management. This is where the real leverage exists—and where I often see the widest gap between what farms think they’re accomplishing and what’s actually happening.

Nutrition Fundamentals

Negative DCAD diets for close-up cows—most commonly targeting -100 to -150 mEq/kg—keep calcium metabolism on track through calving. Jose Santos’ 2019 meta-analysis of 42 experiments in the Journal of Dairy Science found that negative DCAD significantly reduces hypocalcemia, retained placenta, and metritis while improving postpartum feed intake and milk yield in multiparous cows.

DCAD Program ElementTarget RangeMonitoring MethodFrequencyOut-of-Spec Consequence
Dietary DCAD-100 to -150 mEq/kgRation analysisMonthlyInadequate calcium mobilization
Urine pH (Holstein)5.5 to 6.0pH strips or meterWeekly (10-12 cows)Program not working – adjust immediately
Urine pH (Jersey)5.8 to 6.2pH strips or meterWeekly (10-12 cows)Higher target than Holsteins – breed difference
Vitamin E2,000-3,000 IU/daySupplement auditWeeklyImmune function compromised
Selenium0.5-1.0 mg/daySupplement audit + blood testWeekly audit / Quarterly bloodRetained placenta risk increases 35%

Some operations target more aggressive levels (-150 to -200 mEq/kg), particularly in higher-risk multiparous cows. The key is monitoring urine pH weekly to verify cows are responding appropriately—target urine pH of 5.5-6.0 for Holsteins indicates the program is working. Assumptions about ration performance tend to drift from reality over time.

Vitamin E and selenium supplementation (2,000-3,000 IU vitamin E daily; 0.5-1.0 mg selenium) supports immune function heading into calving. Cost: $2- $5 per cow, monthly.

“The mineral piece is where I see the biggest gap between what farms think they’re doing and what’s actually happening,” Bill Weiss at Ohio State has noted. “Testing forage mineral content and adjusting supplementation—it sounds basic, but most farms don’t do it consistently.

Density Management

Overcrowding during the dry period—exceeding 100-110% of bunk space and lying area—creates chronic stress that suppresses immune function. Research from Rick Grant at the Miner Institute shows cows in overcrowded dry pens eat less, have elevated cortisol, and reduced lying times.

Regional considerations matter here. Heat stress complicates close-up management significantly in the Southeast, where summer humidity compounds the metabolic burden. Large Western operations face different scale challenges around pen design and monitoring logistics. Upper Midwest farms deal with seasonal extremes in both housing and nutrition.

The fundamentals stay consistent, but the application requires regional adaptation.

Teat Sealants at Dry-Off

One of the highest-ROI interventions that’s still underutilized on many farms.

Meta-analyses in Animal Health Research Reviews show that internal teat sealants reduce new intramammary infections during the dry period by 52-70% when used with proper technique. Simon Dufour’s 2019 analysis showed a 52% reduction in risk compared with untreated controls.

The math: $10-$20 per cow prevents infections costing $300-$500 to treat post-calving.

A Wisconsin producer managing about 1,200 cows shared a story I’ve heard many times: “We fought teat sealants for years because we’d tried them early and had problems. Turned out we were just rushing through, not being careful enough about prep. Once we committed to proper technique and gave people enough time, our fresh cow mastitis dropped by half within a year.

That pattern—initial frustration followed by success after protocol refinement—repeatedly shows up in conversations with producers who eventually embraced the practice.

💡 PRO TIP: How Cohort Grouping Changes the Math

Instead of continuous cow flow through transition pens (animals entering and leaving daily), consider moving to weekly cohort systems. All cows due within a 7-14 day window group together and move as a unit.

Why this works:

  • Reduces social disruption from constant pen changes
  • Allows thorough cleaning between groups
  • Matches capacity to actual weekly calving numbers rather than random peaks

Example: A farm averaging 20 calvings weekly but peaking at 28 needs capacity for 28 under continuous flow. With cohort grouping, the same pen accommodates 20 at near-full utilization, then empties and refills. You often end up with better per-cow space during actual occupancy.

Some farms discover that adjusting herd size to match facility capacity actually improves profitability. A 350-cow dairy at 15% fresh-cow disease may generate better returns than a 400-cow operation struggling with 40% disease in undersized facilities. That’s not always comfortable math to confront, but it’s worth examining honestly.

When Other Priorities Make Sense

I should acknowledge something important here: not every operation is positioned to make transition management their primary focus right now. Farms managing heavy debt, facing generational transitions, or operating in severely compressed markets may reasonably direct capital elsewhere.

A California producer I spoke with recently put it plainly: “We know transition matters, but right now we’re dealing with water costs that threaten our whole operation. First things first.”

That’s a legitimate constraint that deserves respect rather than dismissal.

The question isn’t whether transition management matters—it clearly does—but whether it’s the highest-return use of limited capital for your operation at this specific moment. That’s a calculation each farm needs to make, honestly.

But don’t assume you’re in that category by default. Many farms have more room to improve without major capital investment than they initially think. The first steps—measuring baseline disease rates, writing down protocols, restructuring time allocation—require commitment more than cash.

Realistic Timelines

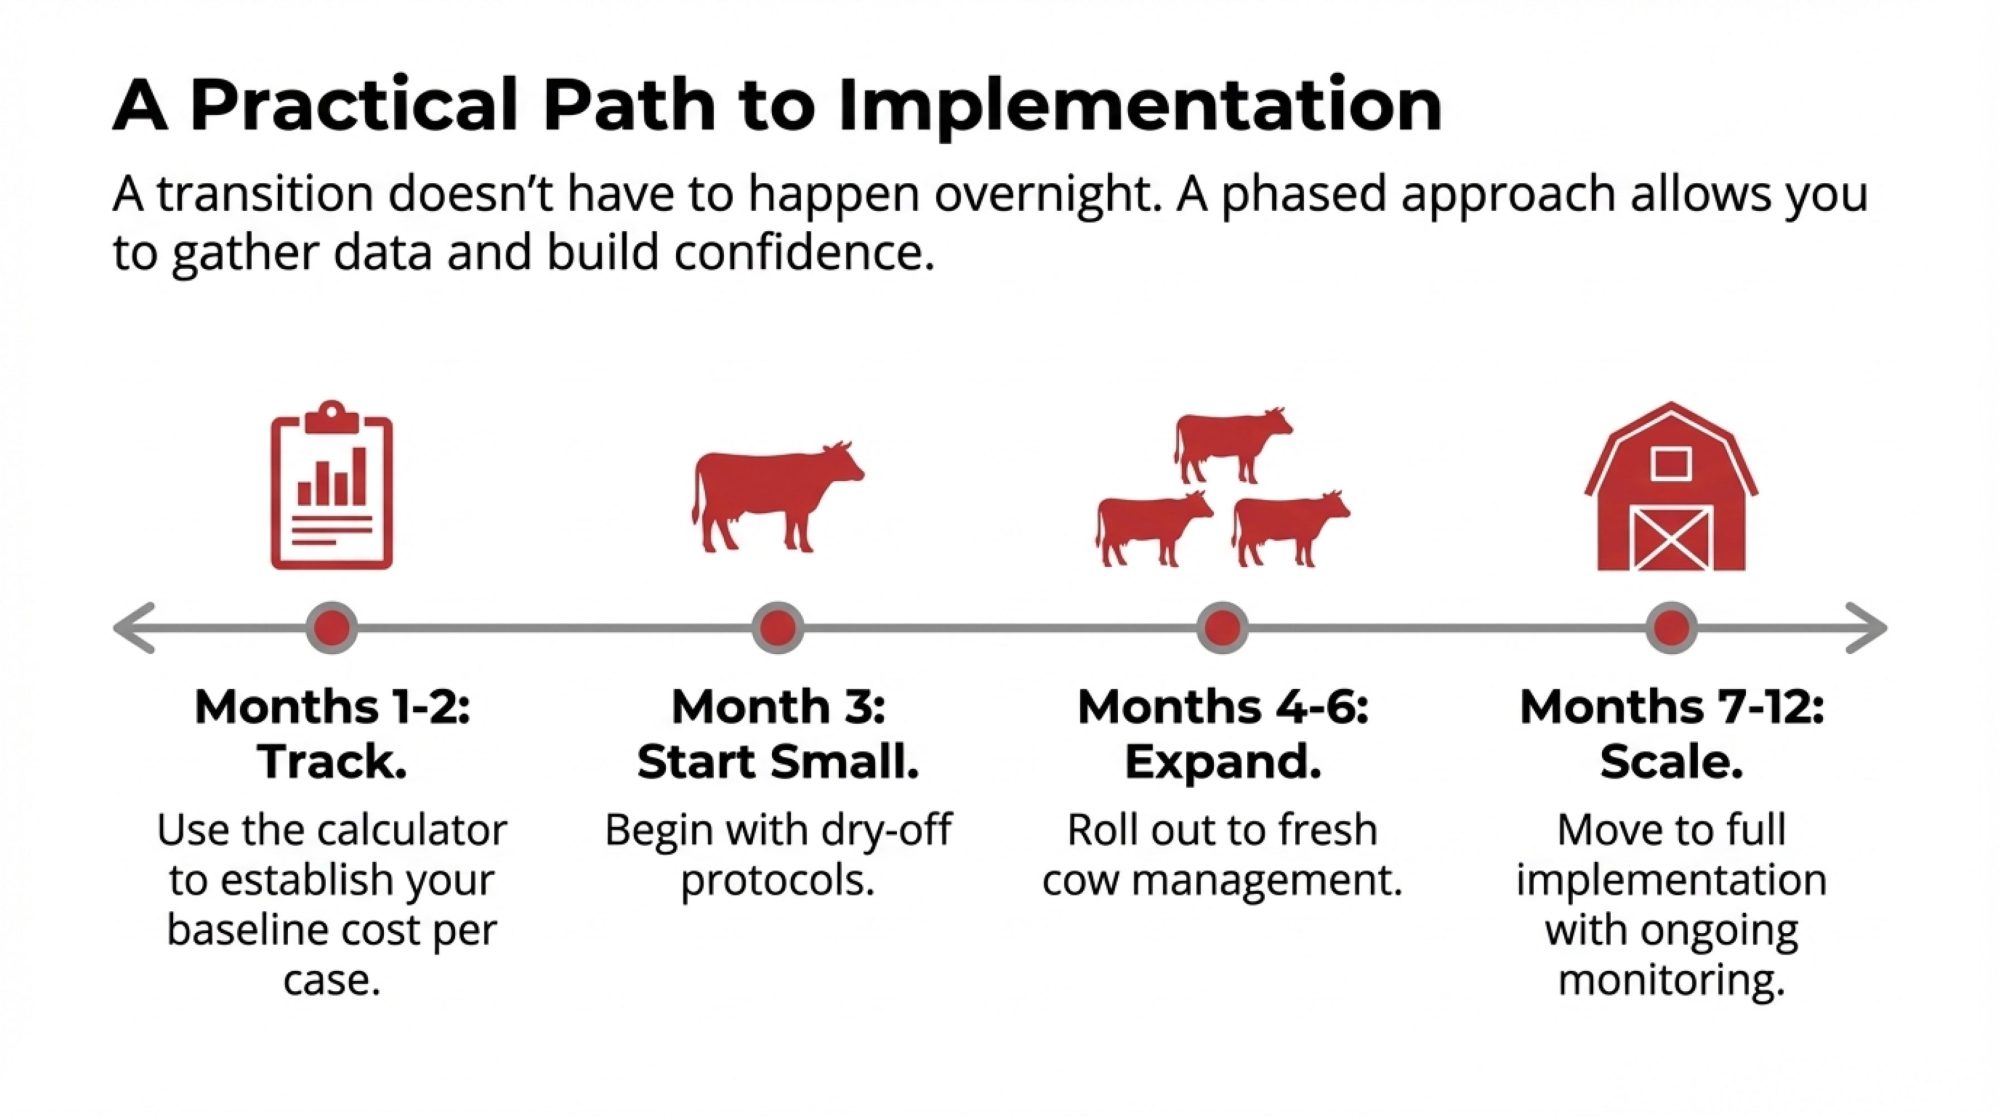
For producers ready to pursue meaningful improvement, understanding realistic timelines helps maintain momentum when progress feels slow.

Months 1-3: Foundation Baseline measurements, written protocols, daily screening, BHBA testing, and close-up nutrition review. Realistic outcome: Disease drops from 35-40% to 25-30%. Investment: Approximately $5,000-$8,000.

Months 4-12: Optimization Protocol refinement based on emerging data, facility adjustments, and staff training for consistency. Realistic outcome: Disease reaches 18-24%.

Year 2+: Building Culture Transition metrics integrated into regular management review. Genetic selection for health traits. Facility improvements where economically justified. Best performers: 10-15% disease. Most committed: Single digits—but that typically takes 3-5 years of sustained focus.

PhaseTimelineManagement ActionsInvestment RequiredExpected Disease Rate
BaselineWeek 1Measure current disease rate by condition – this is non-negotiable$500 (records + BHBA testing)35-40% (typical average)
FoundationMonths 1-3Written protocols, daily screening, DCAD nutrition review, teat sealants$5,000-$8,00028-32% (visible progress)
OptimizationMonths 4-12Protocol refinement, facility adjustments, staff training for consistency$8,000-$15,00018-24% (the slow middle)
Culture BuildYear 2+Transition metrics in regular mgmt review, genetic selection, dedicated monitoring labor$35,000-$45,000/year (labor)10-15% (high performance)
EliteYear 3-5System becomes self-sustaining, continuous improvement mindset embeddedOngoing operational cost<10% (elite – single digits)

The Labor Reality

Here’s something that deserves honest discussion: sustainable transition improvement requires dedicated labor.Farms that try adding monitoring to already-full staff schedules typically see the effort erode within a few months.

A dedicated fresh-cow monitoring position runs approximately $35,000-$42,000 annually, including benefits. That’s substantial, particularly for smaller operations.

But consider the math differently. Prevented disease losses of $30,000-$50,000 annually often justify the expense within the first year. Add better reproduction and longer productive life, and the investment calculation shifts considerably.

Farms that can’t make this commitment may still achieve meaningful improvement through protocol discipline alone—perhaps reaching 25-28% disease incidence rather than 35-40%. Understanding those realistic ceilings helps set appropriate goals for your situation.

“I tell producers to think about it as an investment decision, not an expense decision,” Tom Overton suggests. “Would you spend $40,000 to capture $50,000 in value? Most would say yes. But when it’s framed as ‘hiring another person,’ suddenly it feels impossible.”

That reframing is worth considering.

Quick Self-Assessment

Before wrapping up, it might be useful to reflect on a few questions:

  • Do you know your actual fresh-cow disease rate by condition? Or are you estimating?
  • What percentage of your transition attention goes to the dry period versus the fresh period?
  • Are treatment protocols written down—or do they depend on who’s working that day?
  • When did you last verify your DCAD program with urine pH testing?
  • If you use teat sealants, are you giving staff adequate time for proper technique?

There’s no judgment in these questions—just an invitation to consider where opportunities might exist.

The Bottom Line

The transition period is where money is made or lost. Farms that measure outcomes, implement protocols, invest appropriately in monitoring, and recognize that the dry period determines fresh-cow success are capturing $30,000-$50,000 in value that average operations leave on the table every year.

The top performers stopped seeing fresh-cow disease as an inevitable form of bad luck. They started seeing it as a management outcome they can actually influence.

The dry period isn’t a holding pattern between lactations. It’s the foundation for everything that follows.

You’re leaving money in the dry pen. Run the numbers this week—or keep paying the “average dairy” tax.

The choice is yours.

Key Takeaways:

  • The timing is backwards: That metritis case on Day 5 started on Day -45. Fresh cow disease begins in the dry pen—not the fresh pen.
  • The cost is massive: Average 400-cow dairies lose $50,000-$70,000 annually to preventable transition disease. Elite herds running <10% disease rates capture that value instead.
  • The solution is upstream: Negative DCAD diets (-100 to -150 mEq/kg), dry pen stocking under 110%, and teat sealants that cut new infections by 52-70%.
  • The results are proven: Disease rates typically drop from 35-40% to under 20% within Year 1. Top performers reach single digits by Year 3—with first-year investments of $5,000-$8,000 returning $30,000-$50,000 in prevented losses.

Complete references and supporting documentation are available upon request by contacting the editorial team at editor@thebullvine.com.

Learn More:

Join the Revolution!

Join over 30,000 successful dairy professionals who rely on Bullvine Weekly for their competitive edge. Delivered directly to your inbox each week, our exclusive industry insights help you make smarter decisions while saving precious hours every week. Never miss critical updates on milk production trends, breakthrough technologies, and profit-boosting strategies that top producers are already implementing. Subscribe now to transform your dairy operation’s efficiency and profitability—your future success is just one click away.

NewsSubscribe
First
Last
Consent

The $775-Per-Cow Secret: Why This California Dairy’s Hospital Pen Stays Empty

His hospital pen is empty. His antibiotic bill is zero. His cows make $775 more each. Here’s how

If you ever visit Trevor Nutcher’s dairy operation out in California’s Central Valley, something will immediately catch your eye—the hospital pen was empty. Not just quiet for the day, but consistently empty. For those of us who recall his operation a few years ago, which involved 20-plus cows cycling through treatment protocols, this is worth discussing.

What’s interesting here is that Nutcher didn’t achieve this through gradual reduction or selective dry cow therapy. He went cold turkey on antibiotics—completely eliminated them. And before you think he’s taking unnecessary risks, let me share what’s actually happened to his operation.

The Real Economics We’re Not Calculating

So here’s what I’ve been thinking about lately—we all know treating mastitis costs money, right? But it’s the hidden expenses that really add up. The milk we’re dumping during those extended withdrawal periods, the productive days lost to chronic cases, those early culling decisions we’re forced to make.

In my conversations with producers from Wisconsin to California, as well as some individuals in the Northeast and Southeast, I’m hearing that resistant cases often cost significantly more than straightforward treatments. What’s particularly interesting is that many producers are reporting higher retreatment rates than a few years ago.

A producer in Pennsylvania mentioned something that stuck with me: “We’re so focused on the treatment cost, we forget about the cow that never quite comes back.” That’s the hidden math we’re not doing.

Examining operations in Georgia and North Carolina, where heat stress exacerbates these issues, the economics become even more challenging. One producer near Athens told me his resistant cases during summer can cost three times as much as winter treatments when you factor in extended recovery.

Understanding What’s Really Happening

Dr. Geoff Ackaert, the technical director and global head of ruminants at AHV International, shared something with me that really shifted my perspective. He described our traditional approach as trying to defeat an organized army by capturing individual soldiers.

Emerging research suggests that bacterial communities form protective structures known as biofilms. You know that stubborn slime that builds up in water tanks? Same basic idea, except it’s happening in udder tissue. These biofilms function like protective shields, making bacteria 10- to 1,000-fold more resistant to traditional treatments, according to AHV’s research documentation.

Here’s what really got my attention—bacteria actually talk to each other using chemical signals. They coordinate their attacks for when the cow’s stressed. That’s why we often see mastitis blow up during transition, heat stress, or when we change the ration. The bacteria aren’t getting stronger; they’re getting better organized.

Joe Soares’ Unintentional Experiment

The Joe Soares operation gave us valuable data during last year’s H5N1 outbreak. His Chowchilla facility followed traditional protocols, including electrolyte support, aspirin powder, and B12 supplementation. Cost them $26.71 per treated cow according to their records. Meanwhile, his Turlock operation implemented AHV’s communication-disruption protocol at $54.02 per cow.

That initial cost difference would make anyone nervous. But here’s what happened: Turlock cows returned to normal production in three days. The Chowchilla group? Some took weeks, with several never returning to previous production levels. The milk production data showed that Turlock maintained 11 pounds more milk per cow per day during recovery. When you do the math, that higher upfront cost turned into a $775 advantage per cow.

What really convinced me was the collar monitoring data—Turlock cows showed measurable improvement in eating and chewing cud within 24 hours.

The Numbers That Matter:

  • Traditional protocol: $26.71/cow with weeks of recovery
  • Alternative protocol: $54.02/cow with 3-day recovery
  • Net advantage: $775 per cow when factoring in production
  • Irish trial results: 74.8% antibiotic reduction
  • Fertility improvement: 9.3% better conception, 28 fewer days open

COMPARISON AT A GLANCE:

FactorTraditional ApproachCommunication Disruption
Initial Cost$26.71/cow$54.02/cow
Recovery TimeWeeks3 days
Production LossVariable, often permanentMinimal
Retreatment RateHigh (30%+ in some operations)Low
Long-term ROIDeclining due to resistance$775/cow advantage
Works With RobotsYesYes, with monitoring benefits

How This Works (And Where It Doesn’t)

So instead of trying to kill bacteria—which just breeds tougher ones—this method scrambles their communication. Think of it like jamming their cell phone signals so they can’t coordinate.

This approach (called quorum sensing inhibition if you want the technical term) prevents bacteria from organizing their group attacks. A cow’s immune system handles individual bacteria just fine—it’s when they all attack at once that problems arise.

The field data from Ireland that AHV tracked is pretty compelling. Six farms with 1,344 cows achieved 74.8% reduction in antibiotic use. But here’s what’s really interesting—conception rates went up 9.3% and days open dropped by 28. We’re talking about overall health improvement, not just udder health.

Now, I should mention that not everyone sees these results. A Vermont grazing operation I heard about had mixed outcomes, partly because their system already had low infection rates. A 200-cow tie-stall barn in Wisconsin found it tough to implement with their setup. Some Southeast operations, which deal with year-round high humidity, report needing adjusted protocols.

For operations with robotic milking systems, there’s actually an advantage—the constant monitoring helps catch that 24-72 hour response window better than visual observation alone.

What Implementation Really Looks Like

Nutcher was candid about his transition. “Those first 72 hours test everything you’ve learned,” he told me. “You see swelling developing, and every instinct says reach for that mastitis tube.”

The difference lies in how quickly it works. Traditional antibiotics provide a familiar, quick knock-down effect within hours. Communication disruption takes 24 to 72 hours as the cow’s own immune system clears out the now-confused bacteria. It’s a different healing, not slower.

From what I’m seeing, successful transitions share these traits:

  • Start with prevention during dry-off and fresh cow periods
  • Look beyond per-treatment costs to total economics
  • Get your vet on board early

Several producers have mentioned that once they calculated milk dump plus early culling, the economics became clearer. But if you’re just comparing tube prices? Yeah, it’s harder to justify.

Dr. Sarah Mitchell, a practicing veterinarian in Wisconsin who has worked with three operations making this transition, told me, “The biggest challenge isn’t the science—it’s changing 30 years of muscle memory when you see that first swollen quarter.”

Is Your Operation Ready?

This approach may not be suitable for every situation. If you’re exiting dairy within two years, you may not recoup your investments. Small operations with fewer than 100 cows may find the per-cow investment challenging. But for operations that keep getting the same cows sick over and over? That’s when it becomes compelling.

Examining different regions reveals varying economic conditions. Texas operations dealing with heat stress see different results than Idaho’s large-scale dairies or New Mexico’s dry lot systems. Grazing operations in the Southeast—places like Tennessee and Kentucky—report different outcomes than large freestall barns out West. Florida producers dealing with year-round humidity face unique challenges that require a different approach.

Consider market access, too. Premium contracts for antibiotic-free milk vary widely by region and processor. Even modest premiums can add up to real money when you’re shipping year-round.

Based on documented trials, operations can see significant reductions in treatment needs—those Irish farms achieved nearly a 75% reduction. Though results vary by system.

What You Can Do Today

For operations considering change, here’s a practical timeline:

  • Month 1-2: Start tracking current treatment costs using the calculator below
  • Month 3: Begin with dry-off protocols
  • Month 4-6: Expand to fresh cow management
  • Month 7-12: Full implementation with ongoing monitoring

HIDDEN COST CALCULATOR:

Calculate Your True Treatment Cost Per Case:

1. Direct Treatment Expense

  • Cost of tubes/medications: $_____
  • Labor (hours × hourly rate): $_____

2. Lost Milk Revenue

  • Days of dumped milk: _____ days
  • Daily production × milk price: $_____/day
  • Total milk loss: $_____

3. Future Production Impact

  • Expected production drop: _____ lbs/day
  • Days of reduced production: _____ days
  • Production loss value: $_____

4. Culling Risk Cost

  • Increased culling probability: _____ %
  • Replacement cost – cull value: $_____
  • Risk-adjusted culling cost: $_____

5. TOTAL TRUE COST PER CASE: $_____

Even if you’re maintaining current protocols, track failure rates carefully. Document retreatment rates, identify chronic cases, and calculate true per-incident costs using the calculator above. This baseline data proves invaluable whether you transition now or later.

Sponsored Post

The Bottom Line

What we’re witnessing here is something fundamental—the conversation shifting from “How do we kill bacteria?” to “How do we prevent them from organizing?” That’s more than a technical change. It’s a whole new way of thinking about animal health.

The producers successfully navigating this aren’t abandoning proven practices completely. They’re combining new understanding with established principles. Sure, it requires education, patience, and sometimes stepping away from familiar protocols. But for operations embracing evidence-based innovation, the rewards look compelling.

The dairy industry has consistently evolved through cycles of innovation. Bacterial communication disruption may represent the next significant advance. Producers exploring these approaches today? They’re writing the management playbooks others will follow tomorrow.

As we all know, change in dairy comes slowly, then suddenly. That empty hospital pen at Nutcher’s operation might be showing us what sudden change looks like when it finally arrives. And for those of us still figuring out our path, it’s worth remembering—we don’t all have to take the same route, but understanding the options? That’s just good business.

KEY TAKEAWAYS

  •  Zero sick cows is achievable: Trevor Nutcher’s hospital pen went from 20+ cows to consistently empty—no antibiotics—by disrupting bacterial communication instead of fighting bacteria directly
  • $775 per cow ROI is documented: Joe Soares proved this during H5N1 with 3-day recoveries versus weeks and 11 lbs more daily milk production
  • Benefits go beyond mastitis: Irish trials (1,344 cows) achieved 74.8% antibiotic reduction while improving conception by 9.3% and cutting 28 days open
  • This rewards high-challenge herds most: Operations with already-low infection rates reported mixed results—know your baseline before investing
  • Your first step: calculate true costs: Most producers underestimate what chronic mastitis really costs when you add milk dump, retreatment, and early culling

EXECUTIVE SUMMARY: 

Trevor Nutcher’s hospital pen used to hold 20+ sick cows—now it stays empty, and he hasn’t used an antibiotic tube since switching protocols. The breakthrough: instead of killing bacteria (which breeds resistance), this approach disrupts their communication, preventing them from coordinating attacks. Real-world proof came during Joe Soares’ H5N1 outbreak—cows on the new protocol recovered in 3 days versus weeks, produced 11 pounds more milk daily, and delivered a $775-per-cow advantage. Irish trials across 1,344 cows documented a 74.8% reduction in antibiotics, while improving conception by 9.3% and cutting days open by 28. This approach isn’t universal—operations with already-low infection rates and small tie-stall setups report mixed results. But for dairies trapped in chronic retreatment cycles, the economics of bacterial communication disruption are becoming impossible to ignore.

Complete references and supporting documentation are available upon request by contacting the editorial team at editor@thebullvine.com.

Learn More:

Join the Revolution!

Join over 30,000 successful dairy professionals who rely on Bullvine Weekly for their competitive edge. Delivered directly to your inbox each week, our exclusive industry insights help you make smarter decisions while saving precious hours every week. Never miss critical updates on milk production trends, breakthrough technologies, and profit-boosting strategies that top producers are already implementing. Subscribe now to transform your dairy operation’s efficiency and profitability—your future success is just one click away.

NewsSubscribe
First
Last
Consent

The $640 Question: Why Some Dairy Farmers Are Rethinking Everything They Know About Dry-Off

Wisconsin trial: 47% fewer deaths, 70% less leakage, $640 more per cow. The dry-off method? Backwards from everything you know.

I recently spoke with a producer from central Wisconsin who asked me something that really made me think: “What if everything we’ve accepted about dry-off losses is actually preventable?”

Looking at what’s happening on Wisconsin farms this past year, I’m starting to believe he’s onto something. Here’s what caught my attention—across two dairies with 404 cows total, the ones using StopLac had 70% less milk leakage and nearly half the death losses in the first 60 days after calving. And get this—they’re producing 6.7 pounds more milk daily during their first 100 days in milk. That’s data from AHV International’s trials, and honestly, it’s making me rethink a lot of assumptions.

StopLac achieves dramatic reductions in leakage and death loss, plus boosts daily milk yield post dry-off

The Story Behind the Science

Sometimes the best innovations come from people who just can’t accept “that’s how it’s always been done.” There’s this veterinarian in the eastern Netherlands, Dr. Gertjan Streefland, who kept running into cows that wouldn’t respond to antibiotics the way they should. As Jan de Rooy—he runs AHV International now—tells it, Streefland didn’t just throw more drugs at the problem. He started asking different questions.

Now here’s where it gets interesting. The Dutch couldn’t just expand when they hit problems—land costs were astronomical, and they had production quotas limiting them until 2015. So they had to get smarter with what they had. Traditional dry-off had worked fine for decades, but when you can’t add cows, you’ve got to make every single one count.

The breakthrough came around 2010, when de Rooy attended a university course on bacterial communication—something called quorum sensing. Basically, bacteria can coordinate their attacks through chemical signals. When de Rooy and Streefland connected after that course, they began wondering whether bacteria in udder tissue were essentially organizing themselves into a coordinated army rather than random raiders.

What they found aligns with research from places like Cornell’s Quality Milk Production Services—these bacterial communication patterns are real, and they’re a big part of why some infections are so hard to beat. Similar work from the University of Minnesota’s veterinary diagnostic lab has shown that mastitis pathogens exhibit comparable biofilm resistance patterns.

Understanding What Really Happens at Dry-Off

Let me walk you through what happens when we dry off a cow the traditional way. You’ve got a cow making 60, maybe 80 pounds of milk daily, and we just… stop. That udder pressure doesn’t magically disappear. Research from AHV’s work with Utrecht University shows it stays elevated for several days—creating stress we’re only now starting to understand.

Dr. Geoff Ackaert, who’s the Technical Director at AHV, has presented some fascinating evidence about this. Those stress hormones from the abrupt dry-off? They actually wake up dormant bacteria that have been hiding in what we call biofilms—think of them like bacterial apartment buildings where they protect each other and wait out the tough times.

And here’s the kicker—bacteria protected in these biofilms can be 10 times, sometimes much more, resistant to antibiotics in experimental settings. Even on the low end, that’s a huge problem. The National Mastitis Council has documented similar patterns, and independent research from institutions like Ohio State’s veterinary college confirms these biofilm resistance levels.

How This New Approach Actually Works

StopLac takes a completely different approach. Instead of that sudden stop, which creates all that pressure, it helps the cow naturally wind down production—basically a guided shift in how her body manages the transition. It’s different from selective therapy or just using teat sealants, and it’s also distinct from gradual cessation protocols that some farms have tried.

The Utrecht collaboration documented a 56% drop in milk production within 24 hours, but here’s the important part—it’s due to physiological changes, not pressure building up. Jon Beller, who runs about 2,400 cows in Wisconsin, told me something that really stuck: “A lot less vocalization during the dry-off period. The cows cease production almost instantly with no more milk secretion after dry-up.”

Steve Jaeger shared something similar that really caught my attention. “On Friday morning, when I do my walk through and I walk past the dry pen, in the past, after dry off, there were always cows screaming. I mean, just screaming. You could tell the udders were full. They were uncomfortable,” he told me. “Since May 15, I barely had a, you know, you want to say a murmur? The barn was quiet. I just couldn’t believe it.”

You probably know this already—when cows are quieter during dry-off, that tells you everything. They’re not stressed.

What’s happening in the udder is pretty clever, too. The pH shifts so bacteria don’t thrive. Lactose is reabsorbed instead of being fermented by bacteria. Calcium stays balanced—and anyone who’s dealt with milk fever knows how crucial that is. The liver keeps functioning properly instead of getting overwhelmed.

Flowchart comparing the stress-heavy traditional dry-off with the guided, health-protective StopLac approach

The Numbers That Matter

Let’s talk about what this means in real numbers. In those Wisconsin trials with 404 cows, only four cows—about 1.7%—in the StopLac group had milk leakage issues. The control group? Thirteen cows, or 7.6%. Death losses within 60 days were 1.3% versus 2.4%.

That 6.7-pound daily production advantage during the first 100 days? If that holds even partially through the full lactation, you’re looking at substantial gains. Many producers are reporting the improved start carries through, though individual results vary.

During that H5N1 outbreak at Joe Soares Farms—nobody wants to deal with that kind of crisis, but it gave us a valuable comparison. Their Turlock facility, with 2,500 cows using the AHV protocol, maintained about 88 pounds per cow daily, with monthly losses of around 40-60 cows. Their Chowchilla facility with 5,500 cows on traditional protocols? They dropped to 77 pounds per day and were losing over 100 cows per month. The comparison is eye-opening.

AHV protocol outperformed traditional methods during Bird Flu—Turlock dairy achieved 11 lbs more milk per cow daily.

Breaking Down the Economics

Here’s how the money actually works out. Traditional dry-off has all these hidden costs that add up:

You’ve got milk leakage at about $11.55 per cow. New infections run around $94. Death losses within 60 days average $66. Extra culling adds $120. Antibiotics and withdrawal time, another $32.90. Extra labor dealing with problems, at least $16.

Add it all up—that’s $340.45 per cow for each dry-off when things go relatively well.

Now, with an investment of roughly $40 per cow, plus implementation costs, you’re looking at a total investment of $55-60 per cow. The measured benefits in improved production during early lactation, reduced health events, and lower death losses average over $400 according to the trial data. When you stack the $340 in avoided costs on top of the $400+ in production/health gains, and subtract the investment, you are looking at a net economic benefit of $640 per cow.

For a 1,000-cow dairy, that’s significant annual savings. Even if you’re milking 200-300 cows, the proportional benefits are worth looking at. Actually, I talked to a producer in Vermont with 180 cows who started with just his repeat offenders—the cows that always seemed to have issues. He’s now using it across the whole herd because the results on those problem cows were so clear.

It’s important to note that individual results depend on current management practices, facility design, and local conditions. The $640 benefit represents best-case scenarios from trial data—your actual results may vary based on factors like current dry-off success rates, labor efficiency, and herd health status

For comparison, other dry-off innovations typically show different returns. Selective dry cow therapy can reduce antibiotic costs by about 50% while maintaining udder health, according to University of Wisconsin extension research. Internal teat sealants alone generally show ROI in the 200-300% range based on Cornell studies.

Sponsored Post

Who’s Ready for This (And Who Isn’t)

Not every farm is ready to make this change immediately, and that’s fine. The operations I’ve seen succeed with this usually have a few things in common. They’re closely tracking individual cow data. Their teams actually follow protocols—you know how that goes. They think in full lactations, not just quarterly numbers. And they see change as an opportunity, not a threat.

Of course, not everyone’s convinced yet. As one Pennsylvania dairyman told me, ‘I’ll wait to see three-year data before switching my whole herd.’ That’s fair—major management changes deserve careful consideration.

David Goodrich at Goodrich-Cylon Dairy really exemplifies this approach. He’s been using StopLac since early December and tells me, “I have no difference in cell count or fresh cows with mastitis. I find it works really well on the farm, and I have no plans of going back to using tubes and sealants and all that stuff anymore.”

What’s interesting is his observation about implementation: “I don’t think it takes really any more time than putting tubes and sealants in every cow. I actually think it might cut a step out… the employees have really liked that they don’t have to handle the cows twice in the parlor.”

I should mention—some farms in the trials did hit bumps initially, mostly around training staff and getting protocols consistent. One producer said it took about three weeks for his team to really get comfortable with the new approach, but the results made it worthwhile. Another operation struggled initially because it tried to implement during its busiest season—timing matters.

If you’re not tracking individual cows well yet, or if you’re managing finances month-to-month, you might want to build those systems first. There’s no shame in that—recognizing what you need before jumping into new technology is actually smart management.

What to Expect Month by Month

Based on what producers have told AHV during their follow-ups, here’s the typical timeline:

First couple of months: Your milking crew notices cows are calmer at dry-off. No udder engorgement. Staff finds it easier. As Steve Jaeger noted, “It’s obvious that pressure isn’t there, that the AHV StopLac is doing what we need it to do.”

Months 3-4: Hospital pen has fewer cows. The Giacomini trial showed conception rates improving by several percentage points—that’s meaningful progress.

Months 6-8: Treatment costs drop noticeably. Those first StopLac cows are milking better than expected in their new lactation. Jaeger is particularly excited about this: “If we can shrink that udder faster and give that udder more time to regenerate, those cows are going to take off, I hope, a lot faster and perform a little better.”

By month 12: Everything compounds. Better production, fewer deaths, less culling—your banker notices the improved cash flow.

Regional Differences to Consider

It’s worth noting that results might vary depending on where you are and how you manage. Operations in hot, humid areas might encounter different bacterial pressures than those in drier regions. Down in the Southeast, where heat stress is a constant battle, producers report that the reduced metabolic stress during dry-off seems especially beneficial. Meanwhile, Southwest producers dealing with dust and environmental challenges say the stronger immune response helps their cows better handle those conditions.

Grazing dairies could see variations compared to confinement. Organic producers—who can’t use many traditional treatments anyway—might find this particularly useful.

Spring and fall transitions might show different responses, too. Some producers report better results during cooler months, though the trials didn’t show major seasonal variations.

The Regulatory Picture

The regulatory landscape keeps evolving, as we all know. The EU’s Regulation 2019/6 took effect on January 28, 2022, basically ending blanket dry cow therapy as we knew it. Canada’s national framework includes clear objectives to reduce agricultural antibiotic use. And let’s be honest—consumers increasingly want products from farms using antibiotics responsibly.

According to AHV’s specifications, StopLac has a zero withdrawal time—something to consider as regulations continue to tighten.

The Bottom Line

We’re seeing an interesting split in our industry: some operations are questioning old assumptions, while others are sticking with tradition. The Dutch example shows what happens when you can’t just expand your way out of problems—you innovate.

AHV reports over 2,650 farms are now using StopLac, with more than a million tablets distributed since last June. Industry trends suggest these approaches will likely become more common, though nobody can predict exactly how fast things will change.

Questions worth asking yourself: How do your current dry-off results compare to what’s possible now? What happens when neighbors cut their fresh cow losses in half? How might evolving market preferences affect your opportunities?

What started as one vet’s frustration with antibiotic failures has become a documented opportunity for real economic improvement. Each dry-off cycle represents biological potential—once it’s lost, you can’t get it back. Wisconsin producers in these trials aren’t just saving money today; they’re building advantages that compound with each lactation.

The most successful farms I’ve seen treat this as fundamental management evolution, not just buying a new product. Maybe that’s the real lesson—when you can’t expand, innovation becomes essential.

MetricTraditional Dry-OffStopLac
Milk leakage (%)7.61.7
Death loss (%)2.41.3
Daily milk increase (lbs)06.7
Withdrawal time (days)3-60
Annual cost per cow ($)34055-60
ROI per cow ($)0640

KEY TAKEAWAYS

  • The $640/cow revelation: Traditional dry-off creates $340 in preventable losses (mastitis, deaths, culling)—a $55 StopLac investment returns $640 through prevention plus 6.7 lbs more daily milk in early lactation
  • Your barn doesn’t lie: Screaming dry cows = tissue damage and bacterial activation. Silent cows = healthy metabolic transition. Wisconsin trials proved the difference: 47% fewer deaths, 70% less mastitis
  • Implementation roadmap: Start with repeat offenders; implement during calmer seasons; expect a 3-week staff adjustment. Month 1: quieter barns. Month 3: fewer hospital cows. Month 12: banker notices cash flow improvement
  • The regulatory advantage: Zero withdrawal time positions you ahead of tightening regulations (EU already banned blanket dry therapy in 2022, North America following)

Complete references and supporting documentation are available upon request by contacting the editorial team at editor@thebullvine.com.

EXECUTIVE SUMMARY: 

Wisconsin data just proved the unthinkable: traditional dry-off costs you $640 per cow annually in completely preventable losses. In trials with 404 cows, StopLac achieved what tubes and sealants never could—70% less milk leakage, 47% fewer deaths, and 6.7 pounds more daily milk during the first 100 days. The breakthrough came when Dutch farmers, unable to expand due to land constraints, discovered that helping cows metabolically wind down production prevents the pressure that awakens biofilm-protected bacteria. 

Steve Jaeger describes the transformation: “After traditional dry-off, cows were screaming… now with StopLac, the barn is silent.” With an investment of roughly $40 per dose and zero withdrawal time, the economics are undeniable—invest $55-60 total, recover $640 in reduced deaths, mastitis, culling, and improved production. With 2,650 farms already switched and testimonials like David Goodrich’s (“tubes may have caused MORE mastitis”), for many producers, the question isn’t just whether to change—it’s whether they can afford not to.

Complete references and supporting documentation are available upon request by contacting the editorial team at editor@thebullvine.com.

Learn More:

Join the Revolution!

Join over 30,000 successful dairy professionals who rely on Bullvine Weekly for their competitive edge. Delivered directly to your inbox each week, our exclusive industry insights help you make smarter decisions while saving precious hours every week. Never miss critical updates on milk production trends, breakthrough technologies, and profit-boosting strategies that top producers are already implementing. Subscribe now to transform your dairy operation’s efficiency and profitability—your future success is just one click away.

NewsSubscribe
First
Last
Consent

Lameness Costs You $28,000 Yearly. Genetics Can Fix It – But not for 10 Years. Here’s Your Strategy

Every lame cow costs you $225. Genetics can fix it—in 10 years. Here’s what works NOW

EXECUTIVE SUMMARY: Lameness costs the average 500-cow dairy $28,000 annually, and while CDCB’s new genetic evaluations promise a 30% reduction, you won’t see meaningful savings for 10 years. The reality check: these evaluations rely on data from just six elite farms with $100,000 camera systems—not typical operations dealing with old concrete and tight margins. By year 10, genetics deliver $4,879 annual savings, reaching $8,160 by year 15, but European-style welfare markets will emerge by 2030, before genetics pay off. Smart producers aren’t waiting—they’re investing $40-60K in immediate flooring improvements while simultaneously selecting for lameness resistance. The winning strategy combines environmental fixes that work today with genetics that compound forever. Bottom line: this isn’t about choosing between short-term and long-term solutions, it’s about having the vision and patience to pursue both.

Dairy Lameness ROI

You know that sinking feeling when your trimmer shows up and the bill starts climbing? We’re all dealing with it—lameness affects about a quarter of our cows, and at $120 to $330 per case according to multiple studies in the Journal of Dairy Science, it’s hitting checkbooks hard.

Here’s what’s interesting, though: CDCB just presented at their 2025 Industry Meeting that they’re developing genetic evaluations that could reduce lameness by 20-30% over the next couple of decades. And I say “could” because, well… let’s talk about what that really means.

What caught my attention when I dug into the presentations from Dr. Kristen Gaddis and her team is that the timeline stretches much longer than you’d expect. The economics? More modest than the headlines suggest. And get this—the entire system currently depends on mobility data from just six farms with camera systems, plus trimmer records from about 686 herds. That’s from CDCB’s own numbers.

Click the link to view the presentation: Improving the Wheels on the Car: Hoof Health and Mobility
Ashley Ling, Ph.D., CDCB Support Scientist Slides

The Science: Two Very Different Traits

Here’s where it gets fascinating, and I think you’ll appreciate the biological difference between CDCB’s two strategies.

Traditional hoof health data from trimmer records? We’re looking at heritability of just 3-5%—that’s what the research consistently shows. So basically, 95-97% of what we see comes down to the environment. Your flooring, nutrition program, whether you’ve got digital dermatitis making the rounds… you probably know this already. Put most cows in bad enough conditions—wet concrete, poor ventilation, overcrowding—and they’ll develop problems no matter what their genetics look like.

But mobility scores tell a completely different story. The heritability ranges from 10% to 30% based on CDCB’s findings in their reference population of 63,000 cows. That’s getting into the range of moderately heritable production traits we’ve been successfully selecting for. What’s encouraging here is that mobility seems to capture those deeper genetic differences—skeletal structure, pain sensitivity, basic biomechanics—that persist regardless of housing.

Mobility scores show 2-6x higher heritability than traditional trimmer records, revealing why AI-powered camera systems capture the genetic differences that actually matter for breeding decisions. When 95-97% of hoof problems come from environment, you need that 10-30% genetic signal—not the 3-5% noise.

The innovation piece that’s worth noting is these AI-powered camera systems from companies like CattleEye. They’ve captured over 14 million daily scores from those 63,000 cows, and research in Preventive Veterinary Medicine shows these systems agree with trained vets about 80% of the time. That’s precision you just can’t get when someone’s scribbling notes in the trim chute.

Your Bottom Line: The Real Economics

Let me walk you through the economics, because that’s what matters when you’re making breeding decisions today.

Based on USDA data and that 25% prevalence we’re all dealing with, you’re looking at about $56.25 per cow annually in lameness costs. For a 500-cow operation, that’s $28,125. Real money, absolutely.

The genetic savings timeline reveals the harsh reality—no financial benefit for the first 2-4 years, with meaningful savings only arriving by Year 6 and substantial impact delayed until Year 10-15. This isn’t about choosing between short-term and long-term strategies; it’s about having the vision and patience to pursue both.

But here’s what genetic selection actually delivers over time—and I’ve run these numbers based on CDCB’s genetic trend projections with standard 35% replacement rates:

  • Years 0-2: Nothing. Zero. You’re breeding, but no change in your barn yet.
  • Year 4: Maybe—and I mean maybe—you’ll notice three fewer lame cows in a 200-cow herd.
  • Year 6: Now we’re seeing something. About nine fewer lame cows, saving around $2,070 annually.
  • Year 10: Clear improvement. Twenty-two fewer lame cows, saving $4,879 annually.
  • Year 15: This is when it really shows. Thirty-six fewer lame cows, saving $8,160 annually.

The moderate scenario suggests a lifetime value of about $19-24 per cow from lameness resistance. To put that in perspective—and this is interesting—that’s right between Productive Life at $24 and Daughter Pregnancy Rate at $12 in the current Net Merit index, according to Dr. Paul VanRaden’s team at USDA.

The 6-Farm Problem

This is where things get… well, uncomfortable. Those six farms generating mobility data with their 14 million observations—impressive, sure. But are they really representative of the diversity we have across U.S. dairy operations?

What I’ve found in the Foundation for Food & Agriculture Research grant documentation is that these aren’t your typical farms. We’re talking operations that can afford $50,000 to $100,000 camera installations. They’ve got IT staff, sophisticated management protocols—they’re probably in the top 5% of the industry by any measure.

Now, statistically speaking, 63,000 cows far exceeds the 3,000-5,000 that genetics researchers say you need for reliable predictions. That’s well-documented.

But here’s what concerns me—research in Genetics, Selection, Evolution consistently shows that genomic predictions developed in one environment can lose 30-50% of their accuracy when applied to different management systems.

Think about it: if these six farms all have pristine rubber matting, optimal nutrition designed by PhD nutritionists, and professional trimmers on schedule, will their genetic evaluations actually help that 200-cow operation in Wisconsin dealing with 30-year-old concrete and tight margins?

CDCB’s got a $2 million grant from FFAR to expand collection to 60,000 more cows over three years. That’s great, but even then, we’re talking about less than 1.5% of the national dairy cow population contributing lameness data. And DHI participation? Down to 43% of U.S. cows from over 50% a decade ago, according to USDA census data.

Regional Realities Matter

What’s particularly interesting when you look at regional differences is how implementation challenges vary—and as many of us have seen, what works in California doesn’t always work in Vermont.

California operations with dry lot systems face completely different lameness dynamics than Vermont grazing operations or Michigan freestall barns. Cornell’s PRO-DAIRY research shows prevalence ranging from 15% in well-managed pasture systems to over 40% in older confinement facilities in the Northeast.

Down South—and I’ve talked to several producers dealing with this—heat stress creates its own problems. University of Georgia extension work shows lameness spikes during summer when cows spend more time standing on concrete to access shade and cooling.

These regional realities mean genetic evaluations developed primarily from Midwest and Western mega-dairies might need serious recalibration elsewhere.

The European Warning We Can’t Ignore

Here’s what keeps me up at night—and should concern any producer thinking long-term. It’s not today’s milk check. It’s what’s already happening in Europe.

European welfare markets hit by 2030, but your genetic investments won’t pay off until 2035—creating a 5-year window where early adopters gain permanent competitive advantage while late movers scramble. This isn’t theory; FrieslandCampina and Tesco already require welfare audits. Are you positioned?

FrieslandCampina in the Netherlands has implemented welfare monitoring programs that incorporate lameness metrics into supplier requirements. Major UK retailers, such as Tesco, require welfare audits with lameness as a key metric. Germany passed animal welfare labeling legislation in 2023 that creates premium pricing tiers.

Based on typical lag patterns, we could see similar requirements in U.S. markets by 2030-2035. Several major processors here have already started supplier welfare assessments. Walmart and Costco are asking questions. Export markets to Europe increasingly require welfare documentation.

And here’s the catch nobody wants to discuss: genetic decisions you make today determine your herd composition a decade from now. If you wait for clear market signals—actual premiums or penalties—before emphasizing lameness resistance, your genetics will be 10 years behind when those payments show up. It’s like trying to turn a cruise ship, as they say.

The Consolidation Dynamic

I’ve been around this industry long enough to recognize patterns, and here’s one that deserves honest discussion. These early-stage evaluations will work best for operations that already look like the reference farms—large, well-capitalized, technology-forward.

The math is sobering. If large operations gain even a 3-5-year head start while these evaluations are validated across broader environments, they maintain permanent genetic superiority that smaller operations can never close. That’s just how genetics works—it compounds. Research from ag economists at Iowa State confirms this dynamic across multiple livestock sectors.

This isn’t CDCB’s fault or intention. But when you combine superior lameness genetics with all the other advantages large operations already have—purchasing power documented by USDA’s Agricultural Resource Management Survey, technical expertise, preferential genetics access—you’re looking at one more force driving consolidation. We’ve already lost 50% of dairy farms in the past two decades, according to the 2022 Census of Agriculture.

What Actually Works: Practical Strategies

Flooring delivers immediate relief while genetics won’t catch up for 8-10 years—but the combined approach dominates by Year 10 with $16K+ in annual savings that continues compounding. This is how smart producers win: immediate environmental fixes buy time for genetics to mature.

After wading through all this research and talking with producers who’ve tried various approaches, here’s what’s clear:

For immediate impact (Years 0-5): Environmental management still wins. University of Wisconsin’s Dairyland Initiative research shows that traction-milling concrete floors—that’ll run you $40,000-60,000—can immediately reduce lameness by 10 percentage points. That’s $11,250 in annual savings with a 3- to 5-year payback. Genetic selection won’t match this for 8-10 years.

For long-term positioning (Years 5-15): This is where genetics shines. It compounds permanently while that nice flooring depreciates. By year 10, genetic selection could deliver $12,000+ in annual savings with no additional capital required. And unlike flooring that needs to be redone every 6-15 years, genetic improvement continues to improve.

The optimal approach: Do both if you can. Fix critical environmental problems for immediate relief while shifting breeding emphasis toward lameness resistance. Year 10 projections show combined benefits of around $23,450 annually—way better than either approach alone.

Alternative Approaches for Smaller Operations

Something that didn’t make CDCB’s main presentations but came up in technical discussions—lower-tech options are being explored that might work for many of us.

University College Dublin researchers developed smartphone apps that can score mobility from short videos with a 64% correlation to camera systems. Penn State Extension is testing a simplified visual scoring that your herd vet could do during routine visits. DairyComp 305 and other software providers are working on integration—you know how they’re always adding features.

Research in the Irish Veterinary Journal shows human-assigned mobility scores correlate at 0.64 with camera scores and still show 10-15% heritability. Not as good as fancy cameras, but might be good enough if it means smaller operations can participate without massive investments.

AI organizations could explore subsidized phenotyping programs—similar to what happened with genomic testing adoption a decade ago—where they’d help cover costs for farms willing to share data.

Making the Right Decision for Your Operation

Not every operation should chase lameness genetics—this decision tree cuts through the complexity to show exactly which producers will actually benefit from the 10-year investment. Screenshot this and take it to your next breeding strategy meeting.

Not every operation should prioritize this the same way. Based on the economics and timeline, here’s how I see it breaking down:

Strong candidates for emphasis:

  • Multi-generation family farms planning to be around 20+ years
  • Operations with chronic lameness over 30%—you’ve got more room for improvement
  • Farms that can’t afford major facility renovations—genetics might be your only option
  • Producers are already thinking about welfare-premium markets
  • Operations in regions where consumer pressure is strongest (California, Northeast)

Probably should focus elsewhere:

  • Planning to sell or retire within 5-7 years? You won’t see the payoff
  • Already under 15% lameness? Limited upside
  • Need immediate cash flow improvements? Production traits deliver faster
  • Got capital for facility upgrades? Environmental fixes give quicker returns
  • Located where welfare pressure is minimal

Where the Industry Goes from Here

What strikes me most about CDCB’s lameness resistance development is how it highlights a broader challenge. Should genetic evaluation systems optimize for current conditions or anticipate where markets are heading? When breeding decisions take 10 years to play out but markets can shift in 5, who bears the risk?

We learned this lesson painfully with fertility. Spent decades emphasizing production while fertility tanked—USDA data shows it clearly. Then we scrambled when replacement costs exploded. Took 15+ years to dig out. Are we setting up for the same pattern with welfare traits?

Dr. Chad Dechow at Penn State has written extensively about needing anticipatory breeding strategies that position for probable future markets rather than just optimizing for today. But that’s easier said than done when you’re trying to make payroll next month.

What This Means for You

Looking at all this, here’s what I’d tell my neighbors:

  • Adjust your timeline expectations. This isn’t a quick fix. If you need lameness relief in 3-5 years, invest in flooring, footbaths, and management. Genetics is your 10-year plan.
  • Understand the real economics. That $19-24 lifetime value per cow is real but modest. Don’t abandon production traits in pursuit of lameness improvement—use balanced selection via Net Merit or TPI.
  • Consider your market position. Selling commodity milk to the co-op? Current genetics might be fine. But if you’re eyeballing premium markets or brands like Organic Valley, starting selection now positions you for 2030-2035.
  • Contribute data if you can. These evaluations only improve with broader participation. If you’re working with a good trimmer or thinking about mobility scoring, explore data sharing with CDCB or your breed association.
  • Combine strategies. The successful producers I see aren’t choosing between genetics and management—they’re doing both with appropriate timeframes.

The promise of genetic selection for lameness resistance is real. We’re looking at a potential 30% reduction over 20 years according to CDCB projections, permanent benefits that compound, and positioning for evolving markets. But it’s not magic, won’t replace good management, and requires more patience than most of us naturally have.

What we’re discovering about lameness genetics is pretty much what we’ve learned with every other trait: biological systems change slowly, market signals arrive late, and success goes to those who position for tomorrow while managing today. The tools are coming—CDCB says April 2025 for initial implementation. Whether we have the patience and vision to use them effectively? Well, that’s the real question, isn’t it?

KEY TAKEAWAYS

  • The 10-year reality: Lameness genetics save nothing initially, then compound to $4,879 (Year 10) and $8,160 (Year 15)—patience required
  • Data disconnect warning: Six elite farms with $100K cameras shape genetics for 34,000 dairies—verify relevance to YOUR operation
  • Win with both strategies: $40-60K flooring investment (immediate relief) + genetic selection (permanent gains) = $23K+ annual savings by Year 10
  • Timeline mismatch alert: European welfare markets arrive by 2030, but genetics won’t deliver until 2035+—early adopters gain 5-year advantage

Complete references and supporting documentation are available upon request by contacting the editorial team at editor@thebullvine.com.

Learn More:

Join the Revolution!

Join over 30,000 successful dairy professionals who rely on Bullvine Weekly for their competitive edge. Delivered directly to your inbox each week, our exclusive industry insights help you make smarter decisions while saving precious hours every week. Never miss critical updates on milk production trends, breakthrough technologies, and profit-boosting strategies that top producers are already implementing. Subscribe now to transform your dairy operation’s efficiency and profitability—your future success is just one click away.

NewsSubscribe
First
Last
Consent

Udder Edema Hits 86% of Heifers: The $3,500 Fresh Cow Problem You Can Actually Fix

That swollen udder costs $63 in lost milk. Add 2.5x mastitis risk? Now it’s $350+. Fix it with $40 in vitamins. The math is simple.

EXECUTIVE SUMMARY: That “normal” swollen udder on your fresh heifer? It’s actually a $400+ problem affecting 86% of first-lactation animals—and you can fix it for $40. Research from Cornell, Wisconsin, and Colorado State proves this isn’t inevitable: simple changes like maintaining BCS 3.0-3.5, separating heifer feeding (skip the anionic salts!), and adding vitamin E and selenium cut incidence in half. The best herds have dropped from 86% to under 40%, saving thousands annually while adding a full lactation to cow longevity. Most operations see measurable results within 60-90 days. With documented returns of 300%, this might be the most profitable hour you’ll invest in your operation this year. The math is simple—the decision should be too.

Udder Edema Prevention

You know that feeling when you’re walking through the fresh pen during calving season? There’s always at least one—that first-calf heifer with an udder so swollen it makes you wince just looking at it. And what do we do? Shrug it off. “That’s just how heifers freshen,” we tell ourselves. Give it a week or two, and it’ll go down, right?

Well, here’s what’s interesting. I’ve been digging into the research on this lately, and what I’ve found is making me rethink everything we’ve accepted as normal. Sarah Morrison’s team at Colorado State has been systematically tracking this, and their work—along with several other studies published in the Journal of Dairy Science over the past five years—shows that about 86% of first-lactation heifers develop udder edema. Compare that to just 56% in mature cows.

That’s not occasional. That’s nearly universal.

And when you start penciling out what this actually costs us… Preliminary estimates suggest that a typical 100-cow herd bringing in 40 replacement heifers annually could face losses ranging from a few thousand to upwards of $16,000 annually. Now, that varies considerably depending on your operation and management system, but still—we’re talking real money here.

First-lactation heifers face dramatically higher udder edema rates (86%) compared to mature cows (56%)—but top herds prove this isn’t inevitable.

Why First-Calf Heifers Get Hit So Hard

So what makes heifers so much more vulnerable than mature cows? It’s worth understanding the physiology here, because once you see what’s happening, a lot of other things start making sense.

These first-lactation animals are basically trying to do three things at once. They’re still finishing their own skeletal growth (because, let’s face it, most of us are breeding them younger than their grandmothers were). They’re often already carrying their second pregnancy. And now they’re trying to figure out how to make milk for the first time. It’s… a lot.

Here’s something that really puts it in perspective—research from Cornell’s Department of Animal Science shows that to produce just one liter of milk, about 500 liters of blood need to pass through the udder. So when you’ve got a heifer suddenly ramping up to 60 liters of daily production? That’s 30,000 liters of blood trying to circulate through tissue that’s never handled anything close to this volume before. The vascular system, the lymphatic drainage… none of it has had time to develop the efficient patterns we see in mature cows.

I was talking with a producer from central Wisconsin last month, and he made an observation that stuck with me: “We’ve been selecting for production so hard that I wonder if we’ve created cows that are almost too good at making milk for their own physiology to handle initially.” You know, looking at the research comparing modern Holstein genetics to historical bloodlines—which shows higher edema incidence in today’s cows—I think he might be onto something.

And then there’s the regional piece of this puzzle. Down in the Southeast, where that summer heat stress is just brutal, producers tell me they’re seeing even higher rates during July and August calvings. Meanwhile, I’ve noticed operations in the Pacific Northwest often report better outcomes with their spring-calving heifers. That milder climate probably helps with the metabolic stress.

What’s interesting is how grass-based systems handle this differently. Producers in Ireland and New Zealand generally report lower overall incidence—though when they do block calving, any problems hit a lot of animals at once. It’s a different management challenge entirely. And for those exploring alternative approaches, while some producers report success with homeopathic remedies, the peer-reviewed research on these methods remains limited.

The Real Economic Impact of Udder Edema in Dairy Cattle

The math is simple: invest $40 per heifer in vitamin E and selenium, prevent $63-350 in losses. That’s a 300% return in 90 days—better than any other investment on your dairy.

You know what makes preventing udder edema in dairy heifers particularly frustrating from a business perspective? It’s not one big obvious expense like a DA or milk fever. It’s death by a thousand cuts, spread across multiple areas where the costs kind of hide.

Research shows affected heifers produce about 316 pounds less milk per lactation. At current prices hovering around $20/cwt (though we all know how that fluctuates), that’s roughly $63 per affected heifer. But here’s where the cost of udder edema in dairy cattle gets worse—when edema triggers secondary problems like udder cleft dermatitis, which happens in about 30% of severe cases, you’re looking at combined losses approaching 1,000 pounds of milk.

Let me walk through what this might look like for that 100-cow dairy with 40 replacement heifers:

  • You’ve got about 34 affected heifers (based on that 86% incidence)
  • Direct production loss: 34 × $63 = $2,142
  • If 30% develop secondary complications: 10 heifers × $137 = $1,370
  • Just in production losses alone, you’re at $3,512 minimum

But wait, there’s more. (Isn’t there always?) Studies tracking thousands of fresh cows show that heifers with udder edema have about 2.5 times higher clinical mastitis rates in their first 30 days. They’re also showing elevated ketone levels, suggesting increased subclinical ketosis risk. Each mastitis case typically runs $300-350 in treatment costs, while ketosis treatment averages around $200 per case—though these numbers vary depending on your protocols and region.

What really concerns me, though, is the long-term structural damage. Severe edema can lead to permanent breakdown of the suspensory ligament. Research tracking culling patterns shows these animals often leave the herd a full lactation earlier than their herdmates. When you’re investing anywhere from $2,000 to $4,000 raising each heifer (depending on your system), and she needs three lactations just to pay that back… early culling due to structural breakdown isn’t just a cow problem. It’s a business model problem.

Most producers who implement comprehensive prevention strategies report seeing measurable results within 60-90 days—and that’s when tracking your incidence rates becomes crucial for measuring improvement.

Cost/Loss CategoryQuantity/RateDollar ImpactNotes
Affected Heifers (86% of 40)34 heifers86% incidence rate from research
Direct Milk Loss per Heifer316 lbs milk$63At $20/cwt milk price
Total Direct Milk Loss34 × $63$2,142Production loss only
Heifers with Complications (30%)10 heifers30% develop secondary issues
Additional Loss from Complications$137 each$1,370Udder scald, dermatitis
Mastitis Risk (2.5x higher)Clinical mastitis$300-350/caseIncreased 2.5x vs healthy
Early Culling Risk (1 lactation early)Per affected heifer$2,000-4,000Loss of raising investment
TOTAL ANNUAL LOSS (Minimum)$3,512Conservative estimate
TOTAL ANNUAL LOSS (Maximum)$16,000Includes all complications
PREVENTION COST per HeiferVit E + Se, 6 wks$40Research-proven protocol
Total Prevention Investment (40 heifers)40 × $40$1,600Entire heifer group
NET SAVINGS (Minimum)Min loss – prevention$1,912After deducting prevention cost
NET SAVINGS (Maximum)Max loss – prevention$14,400Best-case scenario
ROI PercentageReturn on investment300%Realized within 90 days

What’s Actually Working: Prevention Strategies

Now here’s what’s encouraging—and why I wanted to write about this. Operations that have tackled this systematically are seeing real improvements, and the interventions aren’t particularly complex or expensive.

Body Condition: The Foundation

Multiple university research teams have confirmed what many of us suspected: overconditioned cows—those scoring above 3.75 at calving—face about double the risk for udder edema and pretty much every other transition disorder.

StageTarget BCSKey Risk/BenefitManagement Priority
Dry-Off3.0-3.25Establish baseline conditionHigh – Set foundation
3-4 Weeks Pre-Calving2.5-3.0Prevent over-conditioning before close-upCritical – Prevention window
Calving (Target)3.0-3.5Optimal: Balanced immune function & milk productionCritical – Calving health
Calving (Overconditioned Risk)>3.752x risk of transition disorders, reduced feed intakeRed Flag – Immediate intervention
60 Days Post-Calving2.5-3.0Maintain fertility & breeding successHigh – Reproduction target
Maximum Acceptable Loss0.5 unitsLoss >1.0 reduces reproduction efficiencyMonitor closely

The targets are pretty straightforward:

  • Dry-off: 3.0-3.25
  • Calving: 3.0-3.5
  • Maximum acceptable loss postpartum: 0.5 units

But here’s the critical thing—and I learned this the hard way—you can’t fix an overconditioned cow in the close-up pen. A dairy nutritionist from Pennsylvania put it perfectly: “We spent years trying to slim down fat cows in the close-up pen. Now we know the real opportunity is managing condition through late lactation and the early dry period. By the time they’re close-up, you’re mostly just trying not to make things worse.”

Spring-calving herds often find this easier to implement when facilities aren’t at capacity. That’s your window to establish new protocols before the busy fall season hits. For those of you running organic or grass-based systems, I know the challenge is often keeping condition ON cows during peak grazing, not taking it off—but the same physiological principles apply.

Rethinking Heifer Nutrition

This really surprised me when I first learned about it. For years, most of us have been feeding close-up heifers and cows from the same TMR wagon, using the same anionic salt programs designed to prevent milk fever in mature cows.

Turns out, that’s been a mistake. Michael van Amburgh’s group at Cornell and researchers at Michigan State have shown that feeding heifers those anionic salt programs actually increases edema severity. The mechanism makes sense once you think about it—excess dietary sodium forces the body to retain water to maintain osmotic balance, and where does that fluid accumulate? Right in the udder tissue.

Operations switching to separate heifer management typically use:

  • Neutral to slightly positive DCAD (no anionic salts)
  • 16-18% crude protein to support both growth and lactation
  • Enhanced vitamin E and selenium supplementation
  • Target dry matter intake around 28 pounds daily

The extra feed cost? Usually about $1.50 per heifer per day for three weeks. Compared to the potential returns, that’s pocket change. Even smaller operations with 80-100 cows are making this work—I’ve seen folks use portable panels to section off just 10-15 stalls for their close-up heifers.

The Antioxidant Angle

This isn’t just about preventing problems—it’s about making more milk. Vitamin E supplementation delivered 21% more milk (56.3 vs 46.4 lbs daily) through the critical first 12 weeks. That’s an extra 840 lbs per heifer in just three months.

What’s really fascinating is the recent research on oxidative stress during transition. Zheng Cao’s team at China Agricultural University published a paper in Veterinary World this year, in which they followed Holstein cows supplemented with vitamin E and selenium through the transition period. The results? Pretty remarkable—35% increase in antioxidant capacity, significant drops in inflammatory markers, and clinical mastitis falling from 18% to 7%.

The biology here is that transition cows experience massive oxidative stress. Their natural antioxidant systems just get overwhelmed by the metabolic demands. Supplementation at the right levels—typically around 3,000 IU vitamin E and 6 mg organic selenium daily—provides that cellular protection when they need it most.

European research groups are seeing similar patterns. Comprehensive antioxidant programs are associated with 30-40% reductions in overall transition disorders. Not just edema—the whole metabolic picture improves. The cost typically runs $30-40 per cow for the six-week transition period, though that varies by supplier and the specific products you’re using.

Technology and the Genetic Long Game

The technology side is evolving fast. Automated body condition scoring systems from companies like DeLaval and CattleEye can pick up gradual changes that our eyes miss, scoring every cow at every milking.

I recently visited an operation in Idaho using this technology, and what they discovered was eye-opening. The pen they thought was full of thin, high-producing cows? Actually averaged BCS 3.0 while producing 95 pounds daily. Meanwhile, a whole group of later-lactation cows had crept toward BCS 4.0 without anyone noticing. By automatically routing those overconditioned cows to a lower-energy pen, they cut fresh cow ketosis by 40% in one year.

The key seems to be integrating the technology into automated decision-making, not just generating reports that sit on someone’s desk. When BCS drops below 2.75, cows automatically route to high-energy pens. Above 3.5 in late lactation? Different ration. The system just handles it.

On the genetic side, Kent Weigel’s group at Wisconsin has been analyzing data from robotic milking systems—they published some fascinating work in the Journal of Dairy Science just this October. Udder depth has a remarkably high heritability of around 0.79, indicating it responds well to selection pressure. The challenge? There’s an unfavorable correlation of about -0.40 with milk yield.

As we’ve selected for more milk, we’ve inadvertently selected for deeper, more pendulous udders that are prone to edema. But here’s what’s encouraging—producers are starting to rebalance their priorities. A genetics specialist I talked with at World Dairy Expo mentioned that five years ago, everyone wanted the highest Net Merit scores possible. Now? Many specifically request bulls with udder composite scores above +2.0, even if they rank a bit lower overall.

Getting Started: Practical First Steps

I know this can feel overwhelming. There’s a lot to consider here. So, where do you actually begin?

Start with the easy wins. Order vitamin E and selenium for your close-up pen. It’ll typically cost you $30-40 per cow for six weeks—you can probably have it by next week. The research consistently shows meaningful benefits from this modest investment.

Get serious about body condition scoring. Penn State Extension offers excellent free online training materials. Just start measuring and recording consistently. You’ll be amazed at the patterns that emerge. And remember—tracking your results is crucial. You can’t improve what you don’t measure.

If you’re ready to separate heifers, even 20 headlocks sectioned with portable panels can work. Talk with your nutritionist about a heifer-specific ration without anionic salts. The conversation alone might reveal opportunities you hadn’t considered.

And think long-term with your genetics. Set a minimum threshold for udder composite scores—maybe +1.5 to start—and stick to it. Yes, you might pass on some bulls with higher production potential, but you’re investing in cows that’ll actually last in your herd.

If you’re implementing these strategies and still seeing a high incidence after 90 days, consider working with your veterinarian to rule out other metabolic factors. Sometimes there are underlying issues that need addressing.

The Bottom Line

The challenges facing our industry make this issue increasingly relevant. Climate change is causing heat stress in regions that have never experienced it before. Labor availability continues limiting individual animal attention. And we keep pushing the genetic envelope on production.

There’s also the consumer and retailer piece to consider. How long before severe udder edema incidence becomes another tracked welfare metric alongside everything else we’re already monitoring?

But here’s what gives me optimism: that 86% incidence rate isn’t set in stone. It’s an outcome influenced by dozens of management decisions we make every day. The best operations are proving that you can get below 40% with a systematic approach.

We’re talking about investing roughly $60-80 per heifer for comprehensive prevention that potentially prevents $200-400 in losses. That kind of return… well, you don’t see that very often in our business.

This isn’t about suggesting anyone’s failing or doing things wrong. We’re all doing the best we can with the information and resources we have. It’s about recognizing that what we’ve accepted as normal might actually be an opportunity. Sometimes the biggest improvements come from questioning our assumptions about what’s inevitable versus what’s changeable.

The knowledge exists. The tools are available. The economics look favorable. The question becomes whether we’re ready to reconsider what “normal” should look like in our fresh pens.

I’m curious about what others are seeing out there. What’s worked for you? What barriers have you hit? Every operation is different, and solutions that work in one setting might need tweaking for another. That’s how we all learn and improve.

KEY TAKEAWAYS

  • That 86% incidence rate? It’s not biology—it’s management. Top herds prove <40% is achievable with your current genetics
  • ROI that actually makes sense: Spend $60-80 per heifer → Save $200-400 in losses → 300% return in 90 days
  • The game-changer nobody talks about: Stop feeding heifers anionic salts. This one change alone cuts problems in half
  • Hidden cost = early culling: Every heifer leaving a lactation early costs you her entire $3,000 raising investment
  • Monday morning action: Order vitamin E + selenium ($40/heifer). You’ll see results before Christmas
MetricAverage HerdsTop Performing HerdsImprovement
Udder Edema Incidence Rate86%<40%53% reduction
First Lactation Heifers Affected34 of 40 heifers16 of 40 heifers18 fewer heifers
Annual Economic Loss (100-cow herd)$3,500-16,000<$1,500$2,000-14,500 saved
Milk Production Loss per Heifer316 lbs<127 lbs60% less loss
Clinical Mastitis Rate (first 30 days)2.5x baselineBaseline rate60% fewer cases
Average Body Condition at CalvingVariable (2.5-4.0+)3.0-3.5 (controlled)Optimized
Heifer Feeding ProtocolSame as mature cowsSeparate (no anionic salts)Protocol change
Vitamin E + Selenium SupplementationMinimal or none3,000 IU + 6mg daily$40 investment/heifer
Time to See ResultsN/A60-90 daysRapid implementation
Annual Net Savings vs AverageBaseline$2,000-14,500+300% ROI

For additional resources on transition cow management and body condition scoring, check out Penn State Extension (extension.psu.edu) and Cornell PRO-DAIRY (prodairy.cals.cornell.edu). Your local Extension dairy specialist is another great resource. The automated BCS systems mentioned are available through DeLaval (delaval.com) and CattleEye (cattleeye.com). For visual guides and additional materials on preventing udder edema in dairy heifers, visit The Bullvine’s online resources.

Complete references and supporting documentation are available upon request by contacting the editorial team at editor@thebullvine.com.

Learn More:

Join the Revolution!

Join over 30,000 successful dairy professionals who rely on Bullvine Weekly for their competitive edge. Delivered directly to your inbox each week, our exclusive industry insights help you make smarter decisions while saving precious hours every week. Never miss critical updates on milk production trends, breakthrough technologies, and profit-boosting strategies that top producers are already implementing. Subscribe now to transform your dairy operation’s efficiency and profitability—your future success is just one click away.

NewsSubscribe
First
Last
Consent
Send this to a friend