Archive for heifer supply

$80 Per Cow Vanishing Monthly: 5 Moves Dairy Producers Must Make Before Spring

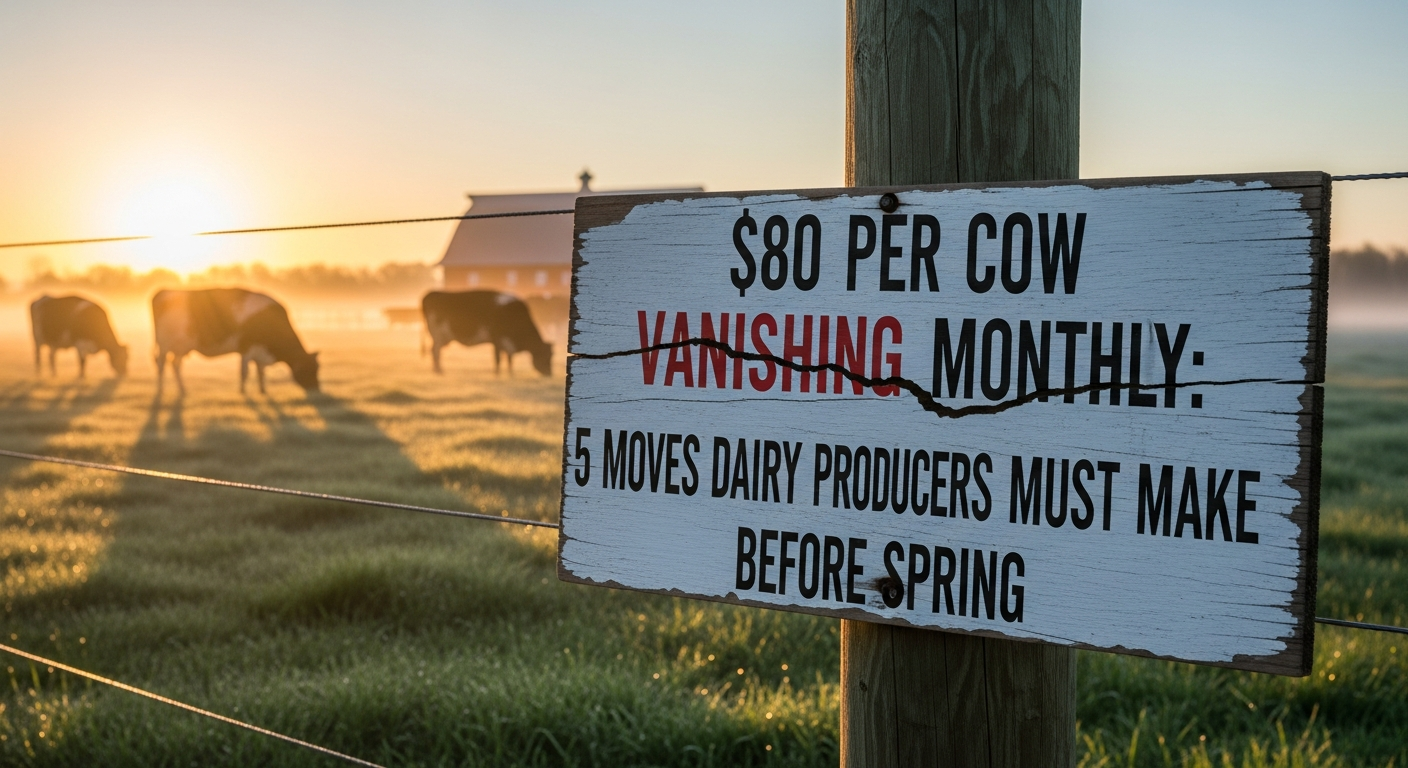
You’re bleeding $80/cow every month, and the industry just added 211,000 more cows to make it worse. 5 moves to make before spring.

Executive Summary: Every month you wait, you’re losing $80 per cow. Class III has crashed from $20 to $15.86 since spring—and the industry just added 211,000 cows to make sure it stays there. California’s rapid H5N1 recovery, surging EU production, and strong New Zealand output have created a global oversupply that isn’t easing anytime soon. Need replacements? Quality springers now cost $4,000-plus amid the tightest heifer pipeline in 20 years. Add $4.40 corn to the equation, and margins are getting crushed from every angle. Here’s what’s actually driving the squeeze—and five specific moves to protect your operation before spring.

Dairy Market Squeeze

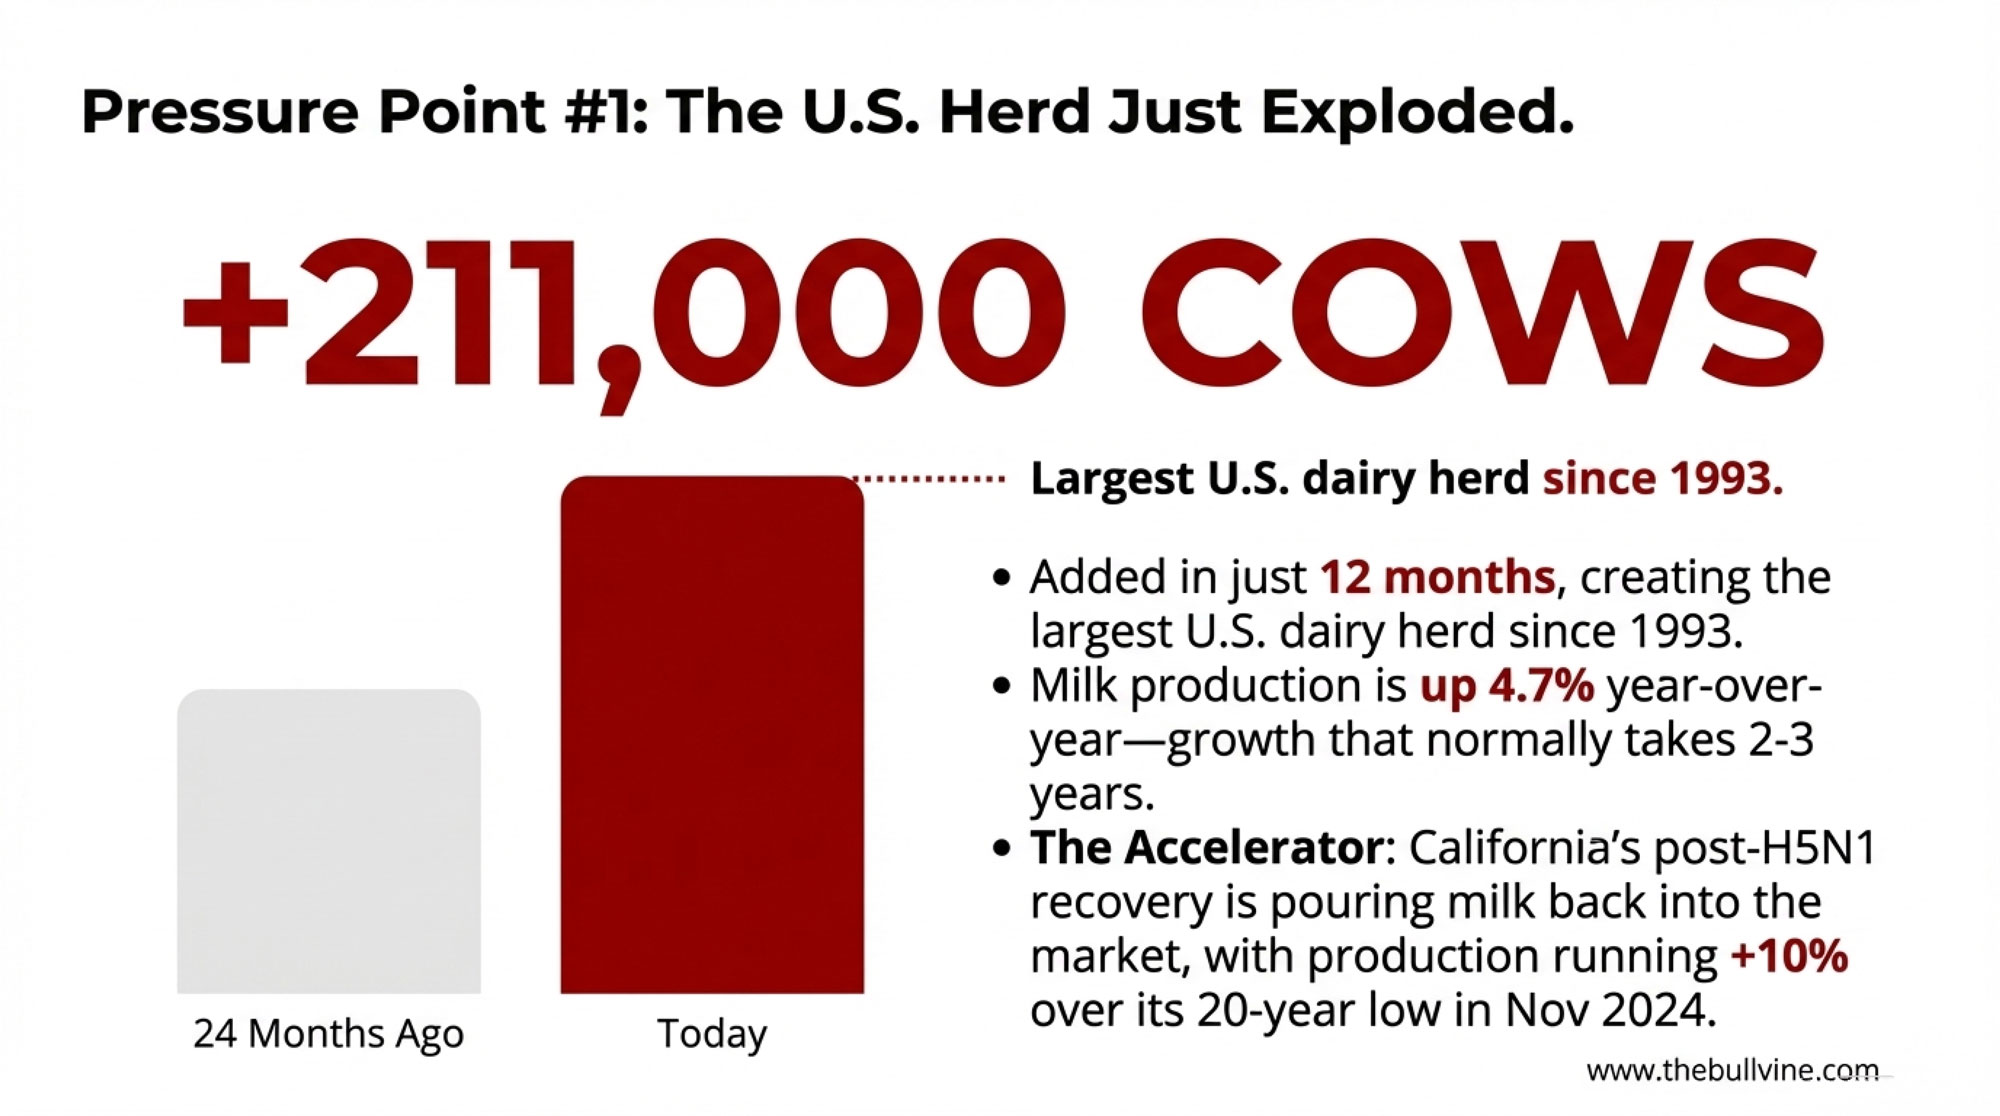
The U.S. dairy industry just added 211,000 cows in 12 months—the largest herd since 1993, according to USDA NASS—at the exact moment Class III prices dropped from $20 to $15.86 per hundredweight. Meanwhile, anyone trying to expand is staring at $4,000 springers and the tightest heifer supply in two decades. That collision of forces is going to define 2026 economics for operations of every size, whether you’re milking 80 cows in Vermont or 8,000 in the Central Valley.

Let me walk through what the numbers actually show and what the producers who are navigating this successfully are doing differently.

The Production Surge Nobody Can Ignore

USDA NASS confirmed that November 2025 milk production in the 24 major states hit 18.1 billion pounds—a 4.7% jump from the prior year. Nationwide, we’re looking at 18.8 billion pounds, up 4.5% year-over-year. For context, that’s the kind of production growth that typically takes two to three years to accumulate. We got it in twelve months.

And California’s recovery has accelerated the math. After H5N1 hammered the state through late 2024 and into 2025—federal livestock program records indicate roughly 75% of commercial herds experienced infections at some point—production is now running more than 10% above year-ago levels. November 2024 represented a 20-year production low for California. The turnaround has happened faster than most analysts expected, and all that milk is flowing back into national markets.

Class III milk prices have collapsed from $20.50 to $15.30 per hundredweight in just 12 months—a 25% decline that’s costing dairy producers $80-90 per cow monthly across all operation sizes 

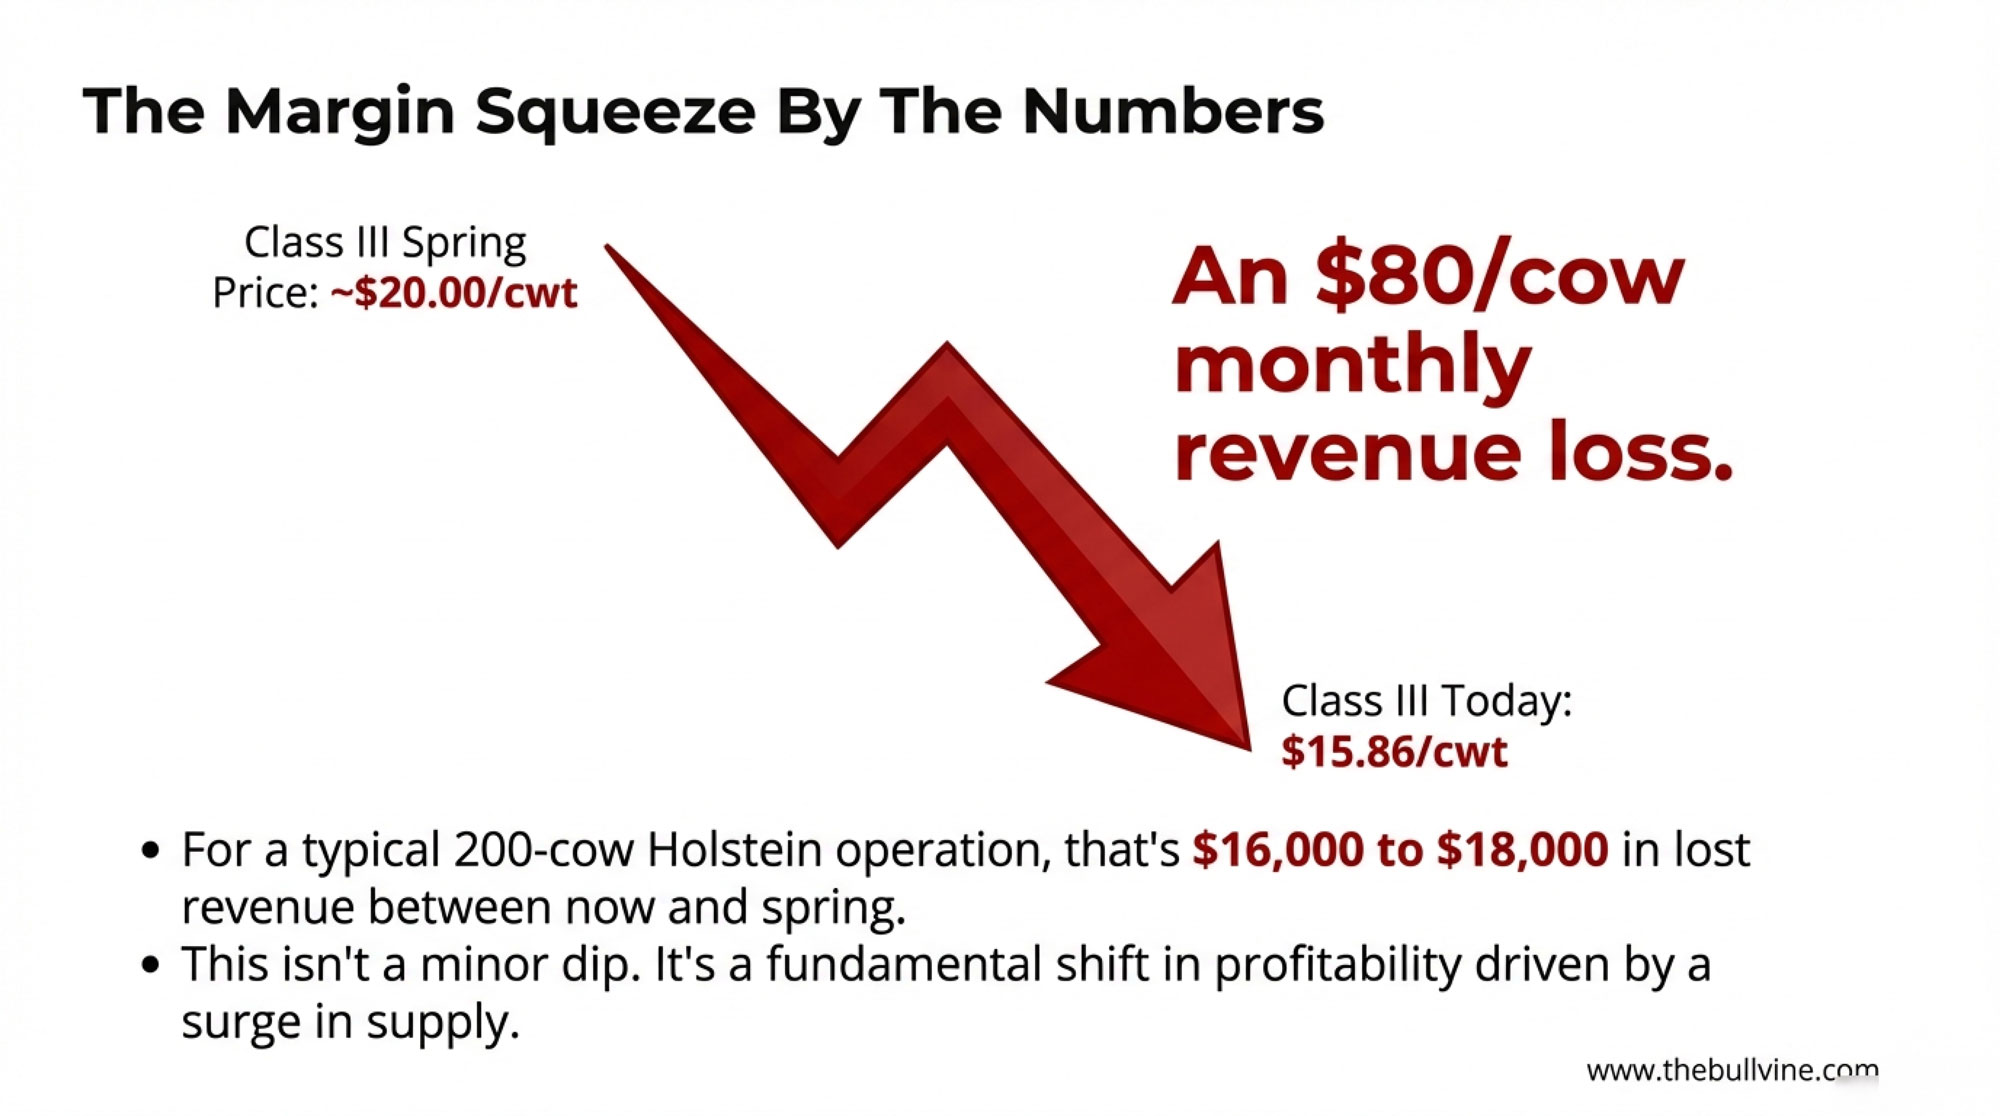
Here’s what this means for your check: at $15.86 Class III versus $18.50 three months ago, that’s roughly $80-90 per cow per month in lost revenue for a typical Holstein operation. On a 200-cow herd, you’re looking at $16,000-18,000 less coming in between now and spring—assuming prices don’t drop further.

Herd SizeMonthly Loss ($80/cow)Spring Loss (3 months)Annual Impact
50 cows$4,000$12,000$48,000
100 cows$8,000$24,000$96,000
200 cows$16,000$48,000$192,000
500 cows$40,000$120,000$480,000
1,000 cows$80,000$240,000$960,000
2,500 cows$200,000$600,000$2,400,000

The Heifer Bottleneck Is Real

This is the constraint that will shape expansion decisions over the next three years, so let’s dig into it.

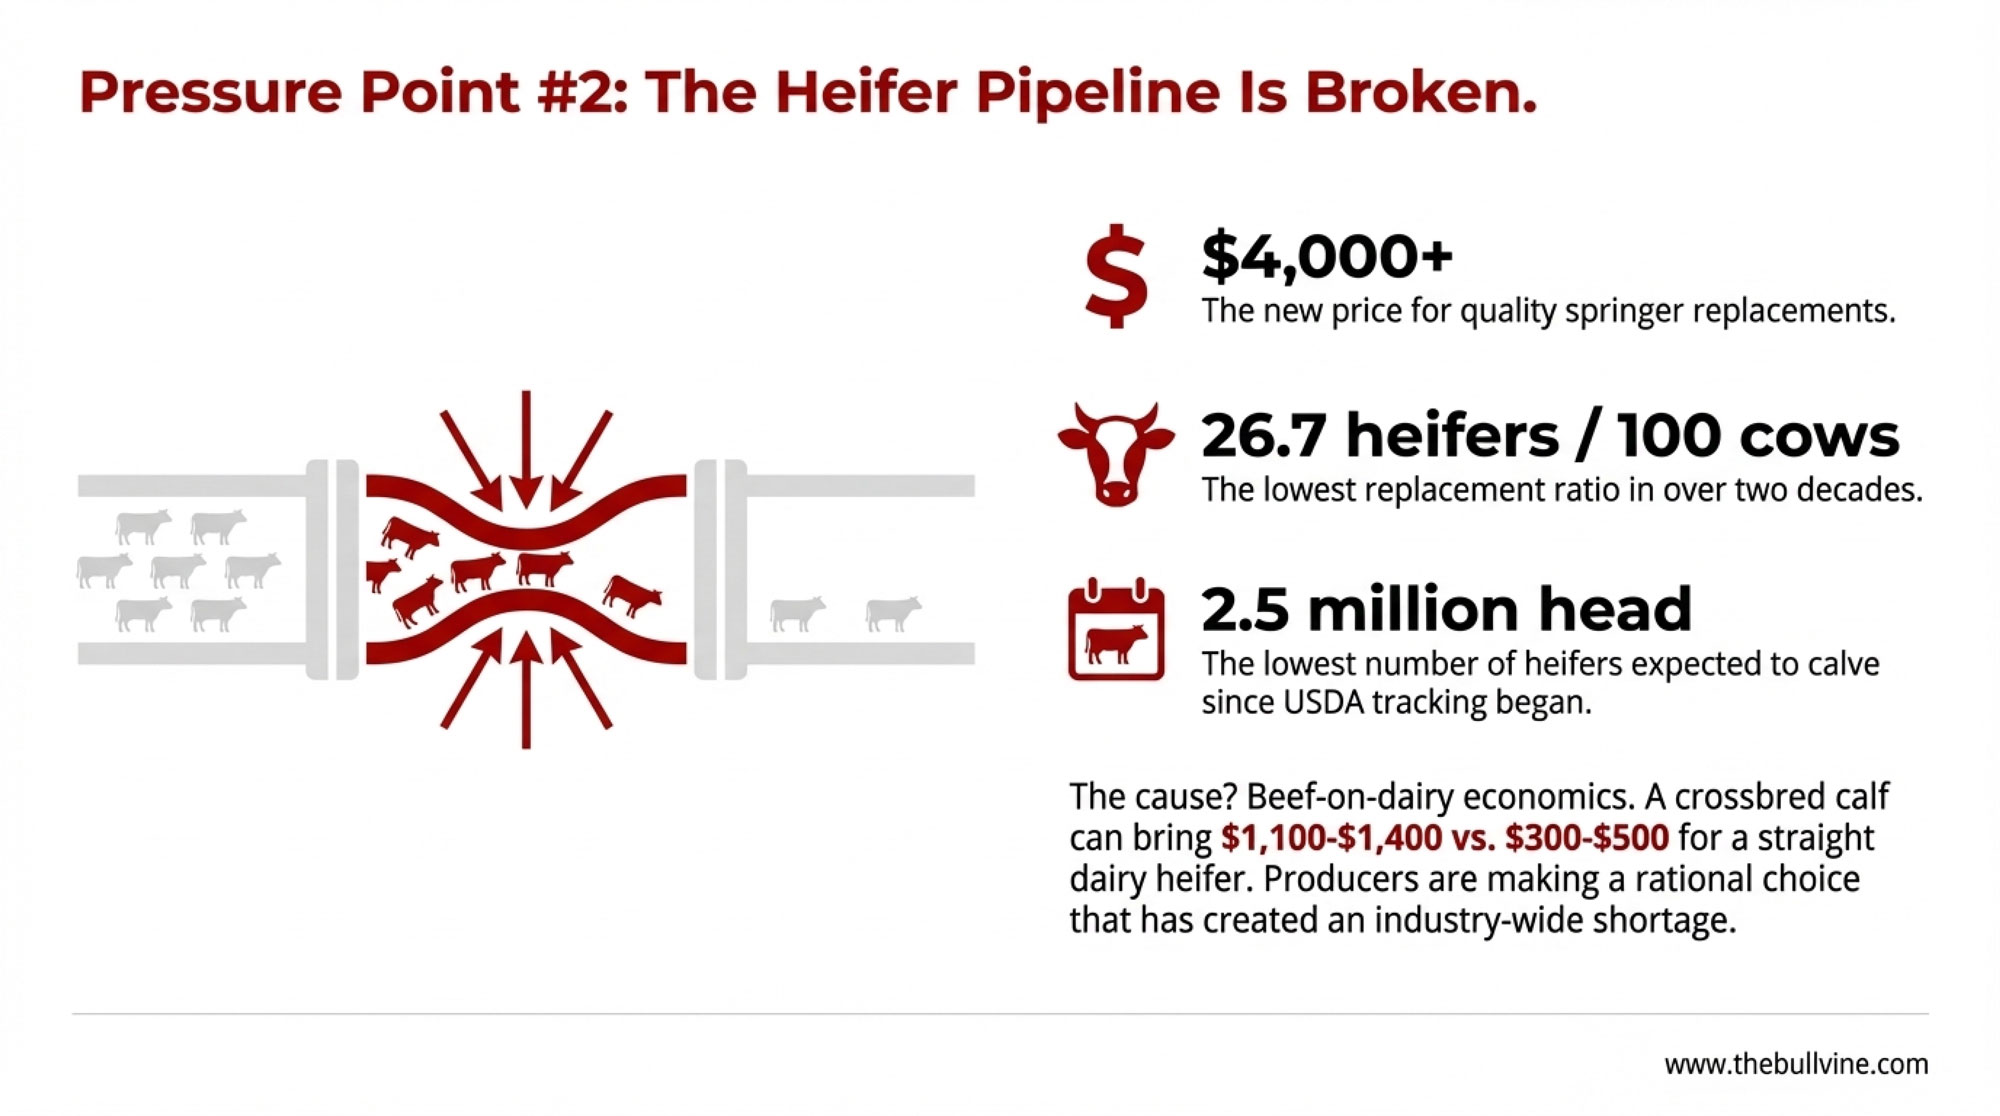
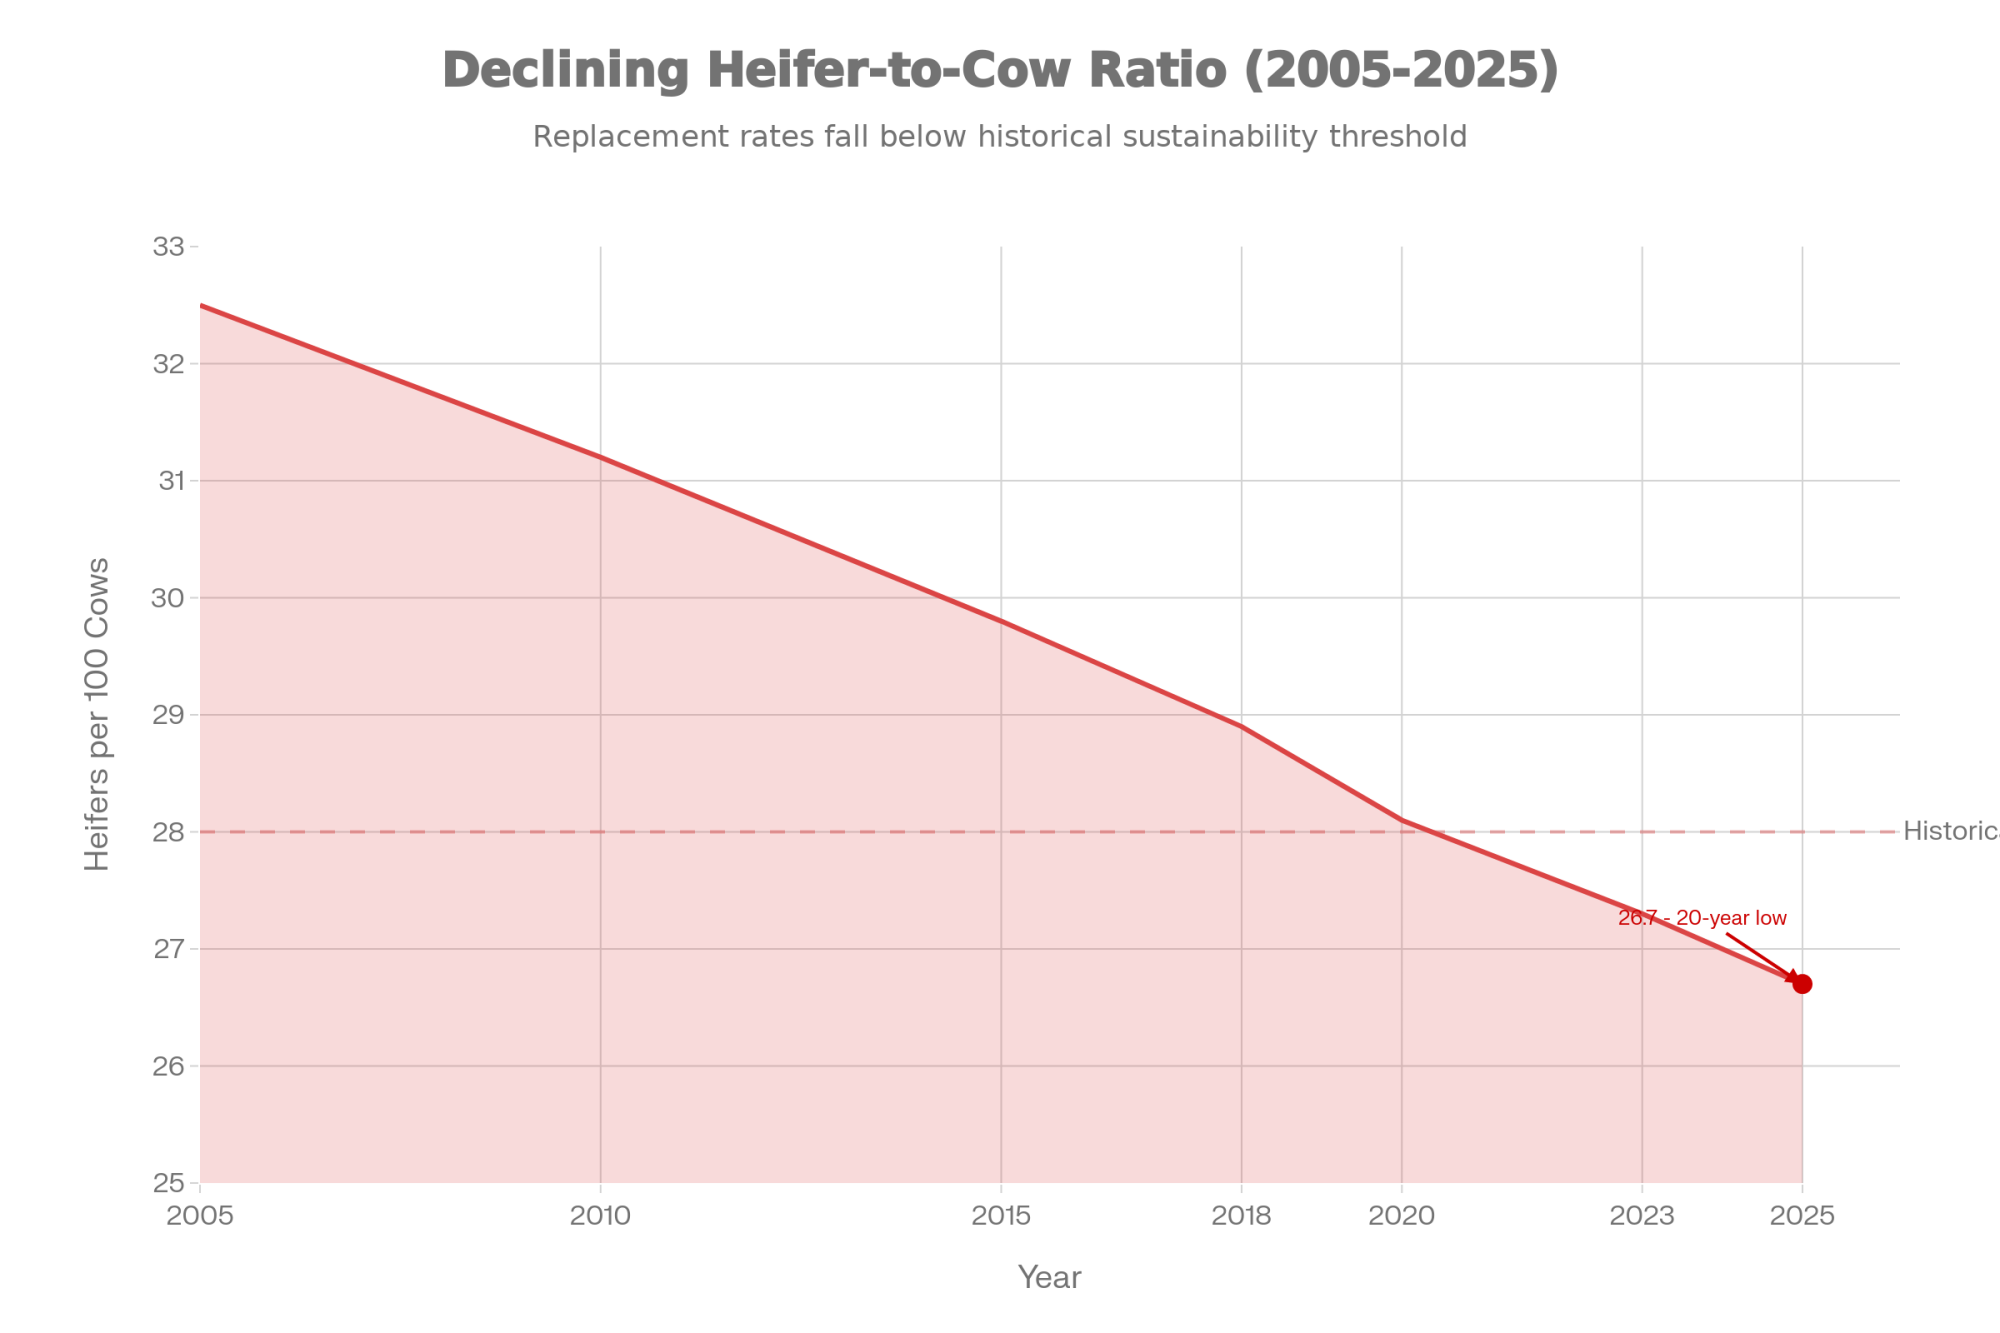
USDA data shows approximately 26.7 heifers expected to calve per 100 milk cows—the lowest ratio in at least two decades. Total dairy heifers expected to calve in 2025? Just under 2.5 million head, the lowest since USDA began tracking this metric.

The heifer-to-cow ratio has declined to a 20-year low of 26.7 per 100 cows, creating a replacement crisis that explains why quality springers now cost $4,000+ and why expansion-minded producers need to source animals immediately

The economics driving this aren’t mysterious. Ag Proud market reports show beef-cross calves bringing $1,100-1,400 at many auctions, sometimes higher for well-bred Angus or Limousin crosses. Straight dairy heifers? Often $300-500 unless they come from high-genomic programs with strong marketing. When beef-on-dairy creates that much value differential, producers make rational decisions about their breeding programs.

I was talking with a Wisconsin producer last month who’s running about 70% beef semen across his herd. His logic is straightforward: the premium on those crossbred calves more than offsets the cost of purchasing replacements when he needs them. For his operation and cash flow, that math works.

MetricBeef-Cross CalfRaise Own Dairy HeiferBuy Springer
Calf Sale Value$1,250$400N/A
Heifer Raising Cost (to calving)$0 (sold)$2,200$0
Purchase Price (springer)N/AN/A$4,000
Net Economics per Head+$1,250-$1,800-$4,000
Value DifferentialBaseline-$3,050 vs beef-$5,250 vs beef

A Northeast producer I know takes the opposite approach—she’s kept her replacement program intact because she doesn’t want to be buying springers at $4,000 when she needs them. Her calculation: the heifer she raises for $2,200 all-in is worth $1,800 more than the one she’d have to buy.

Both strategies can pencil out. The question is which matches your operation’s cash flow, facilities, and expansion timeline.

The practical implication: quality springer replacements now command $3,500-4,000 or more in many markets. If you’re planning any expansion over the next 18-24 months, heifer sourcing needs to be part of your planning conversation this month. The animals aren’t available in the numbers we’ve historically seen.

Global Oversupply Compounds the Problem

Four major dairy-producing regions are simultaneously flooding global markets with increased production—California up 10%, EU up 6%, U.S. overall up 4.7%, and New Zealand up 2.9%—creating synchronized oversupply that’s crushing milk prices worldwide

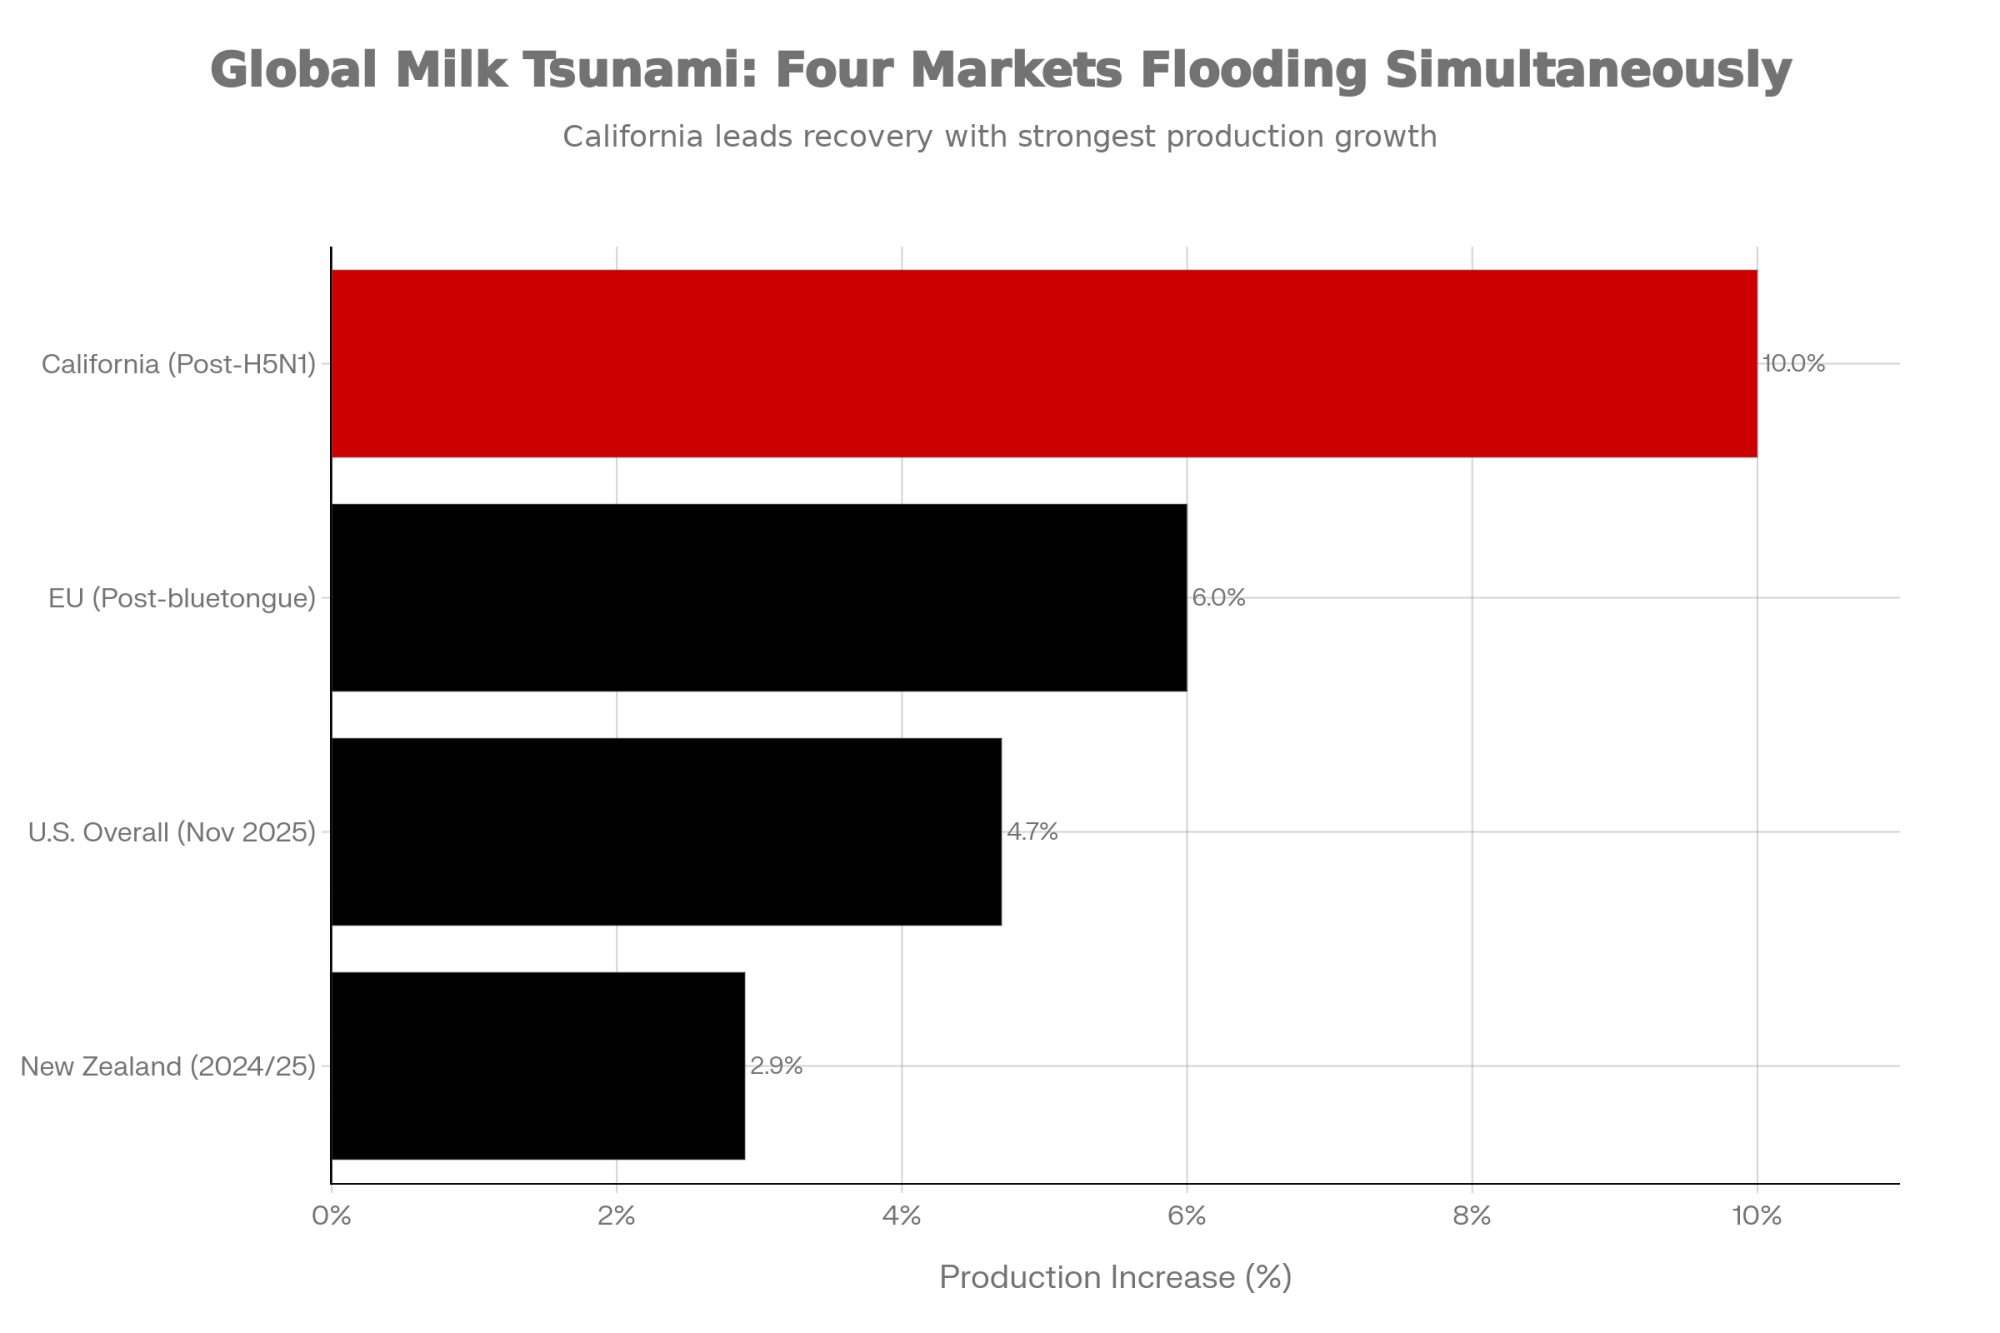
It’s not just U.S. production running hot. The latest AHDB market review shows EU milk deliveries jumped around 6% in September after the bloc worked through its bluetongue challenges. DairyNZ and LIC statistics show that New Zealand’s 2024/25 season finished with total milk solids production up 2.9% to 1.94 billion kilograms.

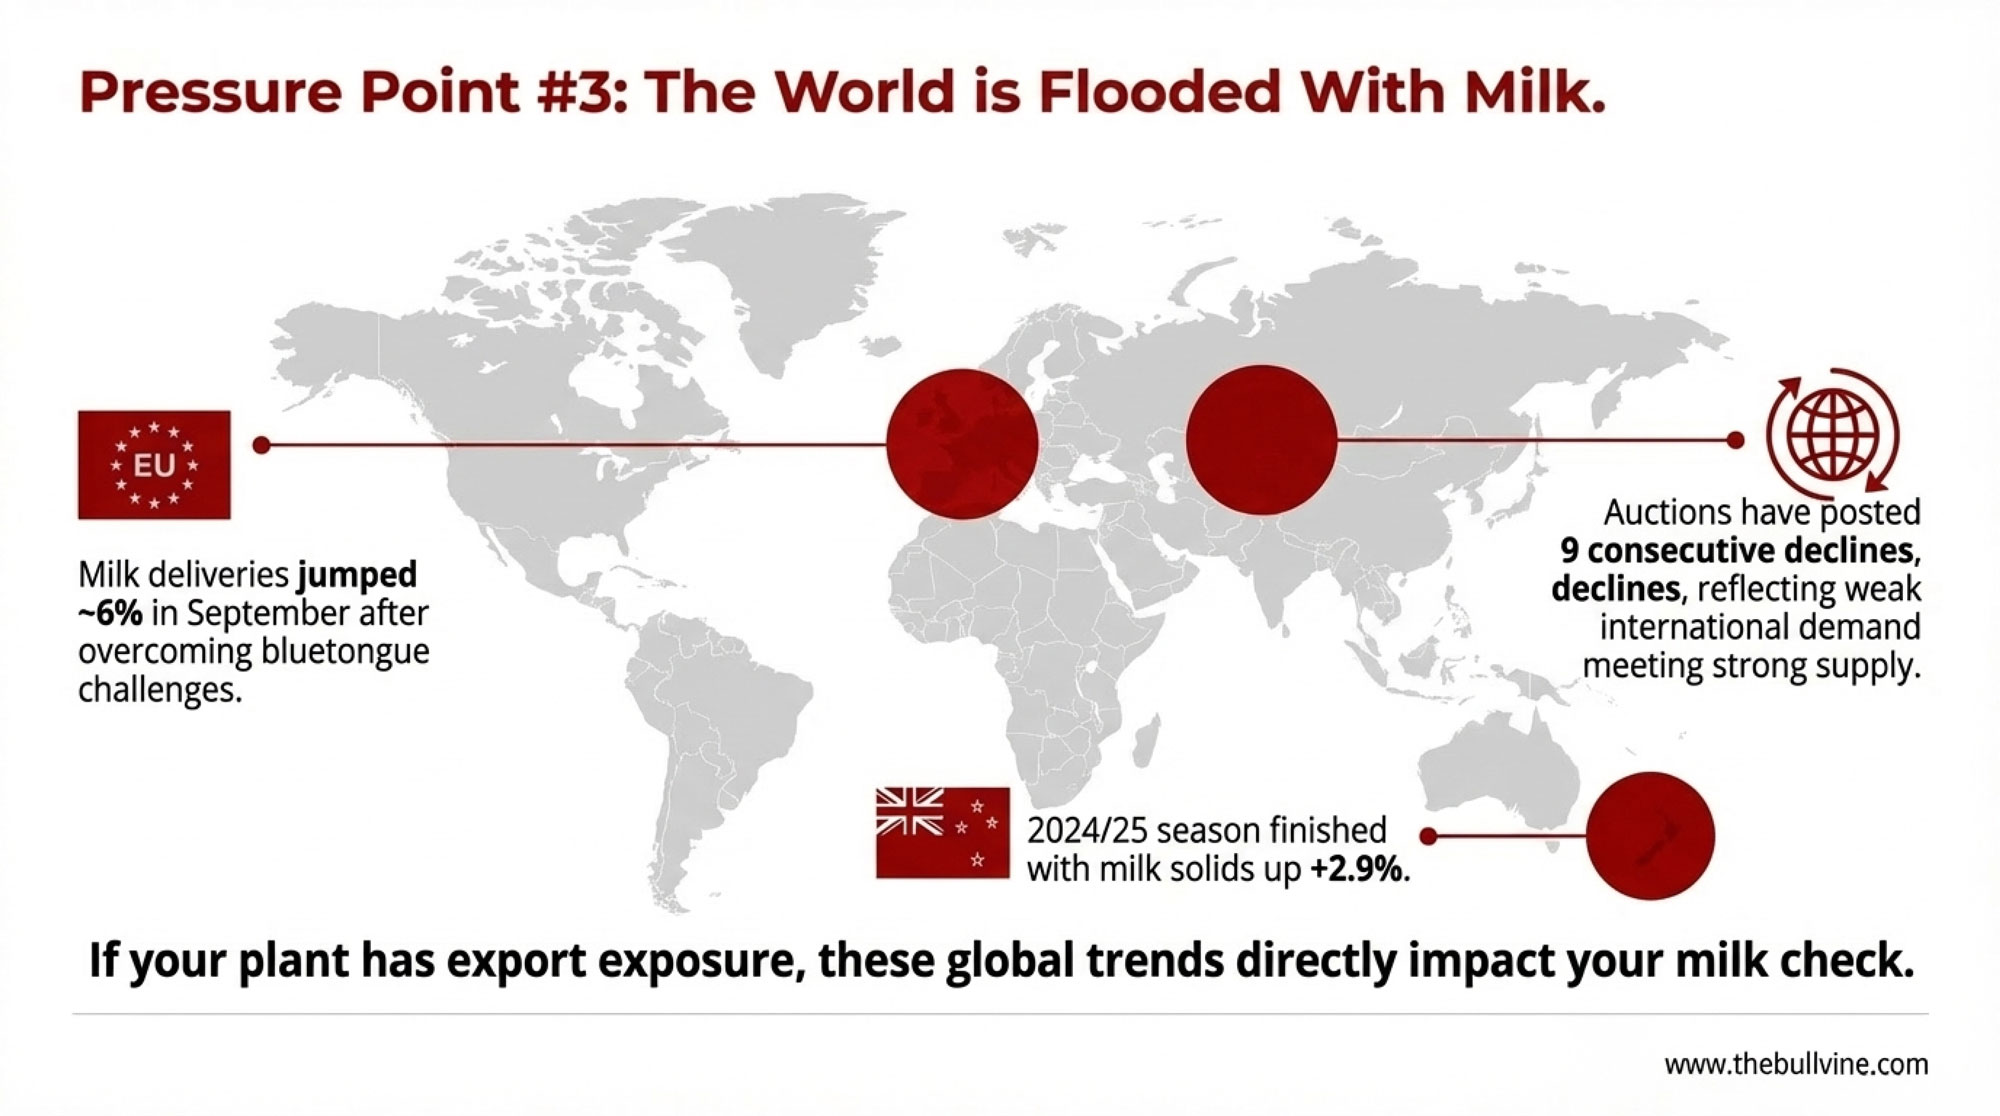
The Global Dairy Trade auctions have posted nine consecutive declines now, reflecting strong global supply meeting softer demand from key importing regions. If you’re shipping to a plant with export exposure—and that includes many operations in Wisconsin, Idaho, and the Southwest—those GDT results eventually flow back into your mailbox price.

For Canadian producers watching from across the border, the U.S. production surge creates its own dynamics. American oversupply tends to intensify pressure on USMCA access negotiations and affects cross-border pricing signals, even within the quota system.

California’s role amplifies these dynamics domestically. The state produces roughly 18% of U.S. milk, but here’s what really matters for price discovery: California Dairies Inc. alone churns over 480 million pounds of butter annually (about 23% of U.S. production), and the state manufactures the largest share of nonfat dry milk powder in the country. When California production swings, commodity pricing moves for everyone.

The Butter Paradox

Here’s something that looks like good news until you understand what’s actually happening.

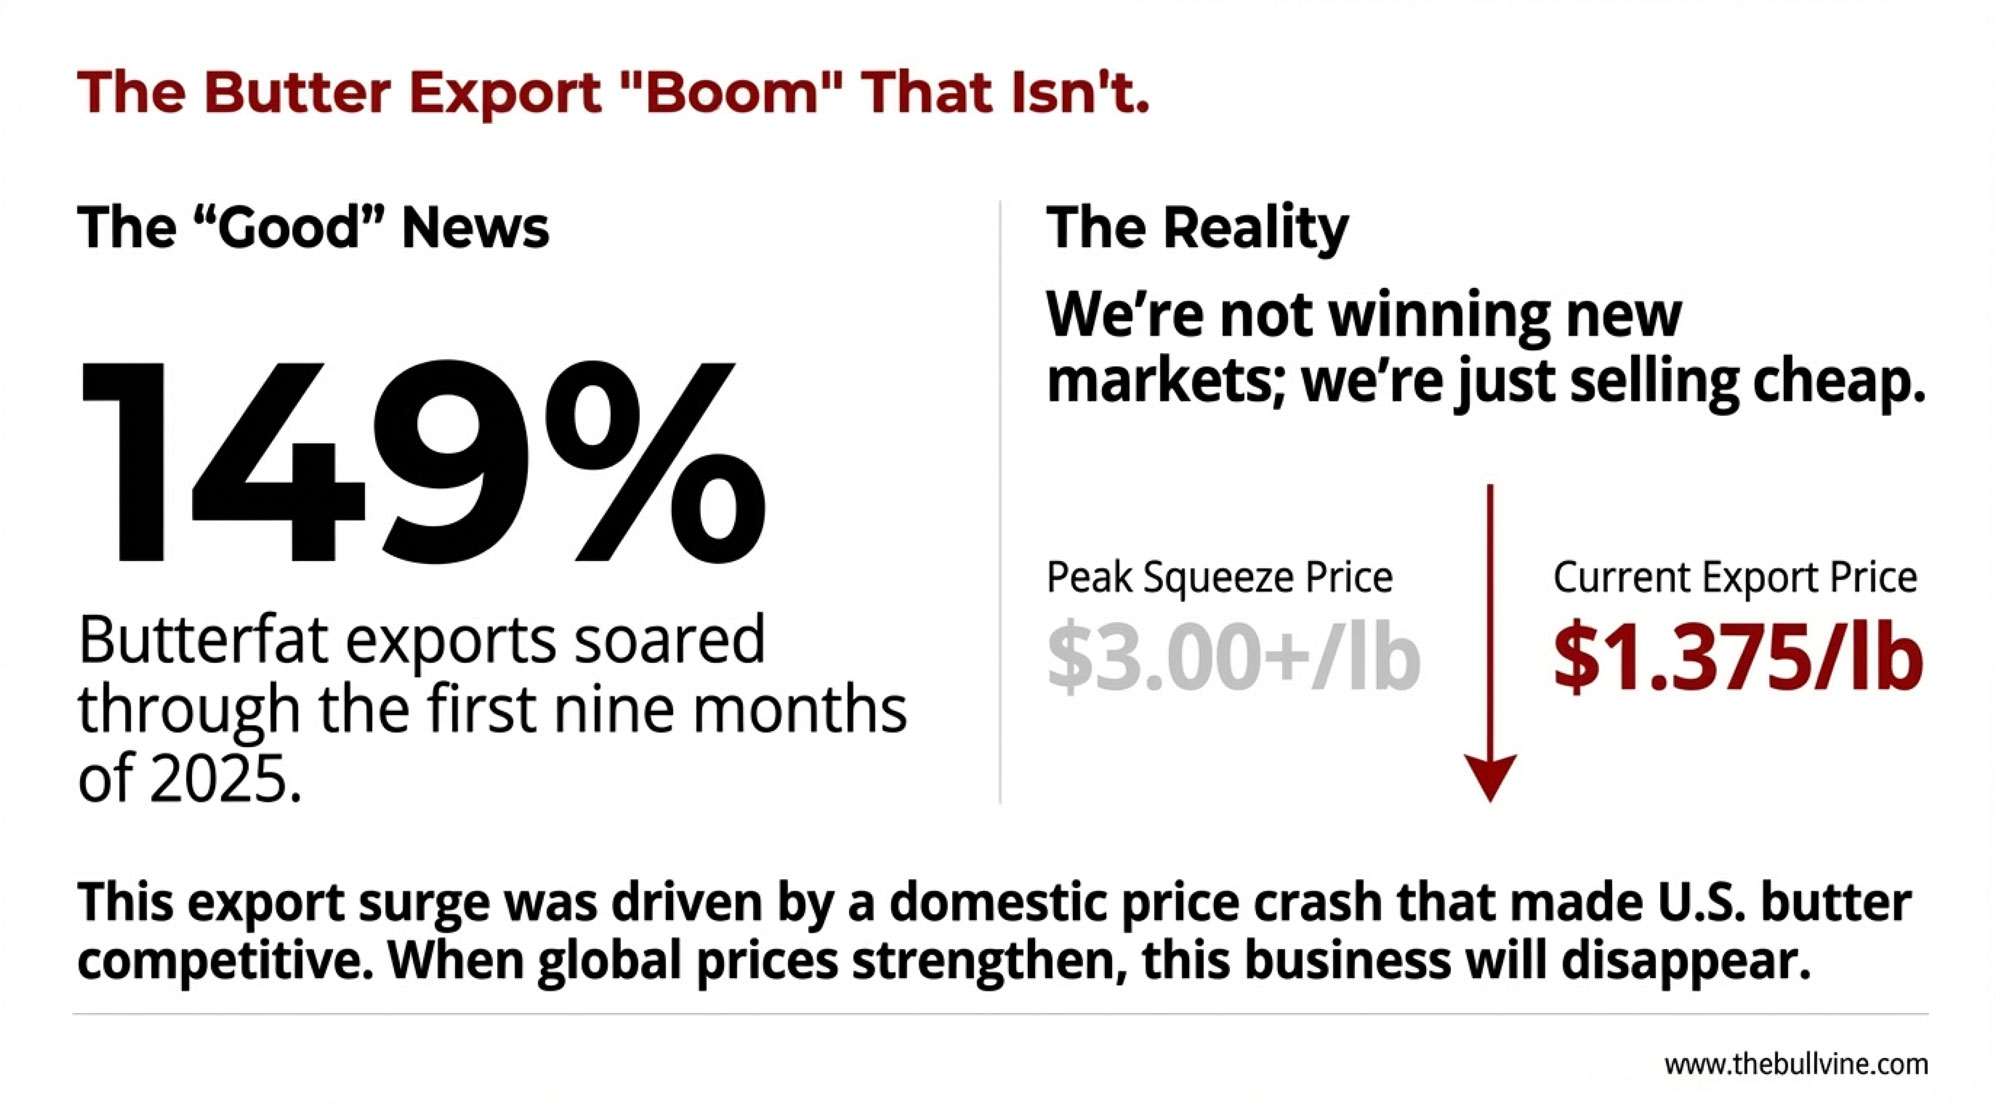
USDEC data shows butter exports surged in 2025. January alone was up 41% year-over-year, and through the first nine months, total butterfat exports soared 149%.

Sounds great, right? Here’s the catch: U.S. prices had dropped enough to compete in markets we typically can’t reach. Brownfield Ag News reports CME spot butter trading around $1.375 to $1.40 per pound as we moved into January—a long way from the $3.00-plus prices we saw during the supply squeeze.

We were essentially selling butter globally because domestic prices made us competitive, not because we’d developed new market access. That’s fundamentally different from export growth driven by structural demand improvement. When global prices strengthen, that business disappears.

Cheese Exports: The Genuine Bright Spot

If you’re looking for actual strength in the dairy complex, cheese exports tell a legitimately positive story.

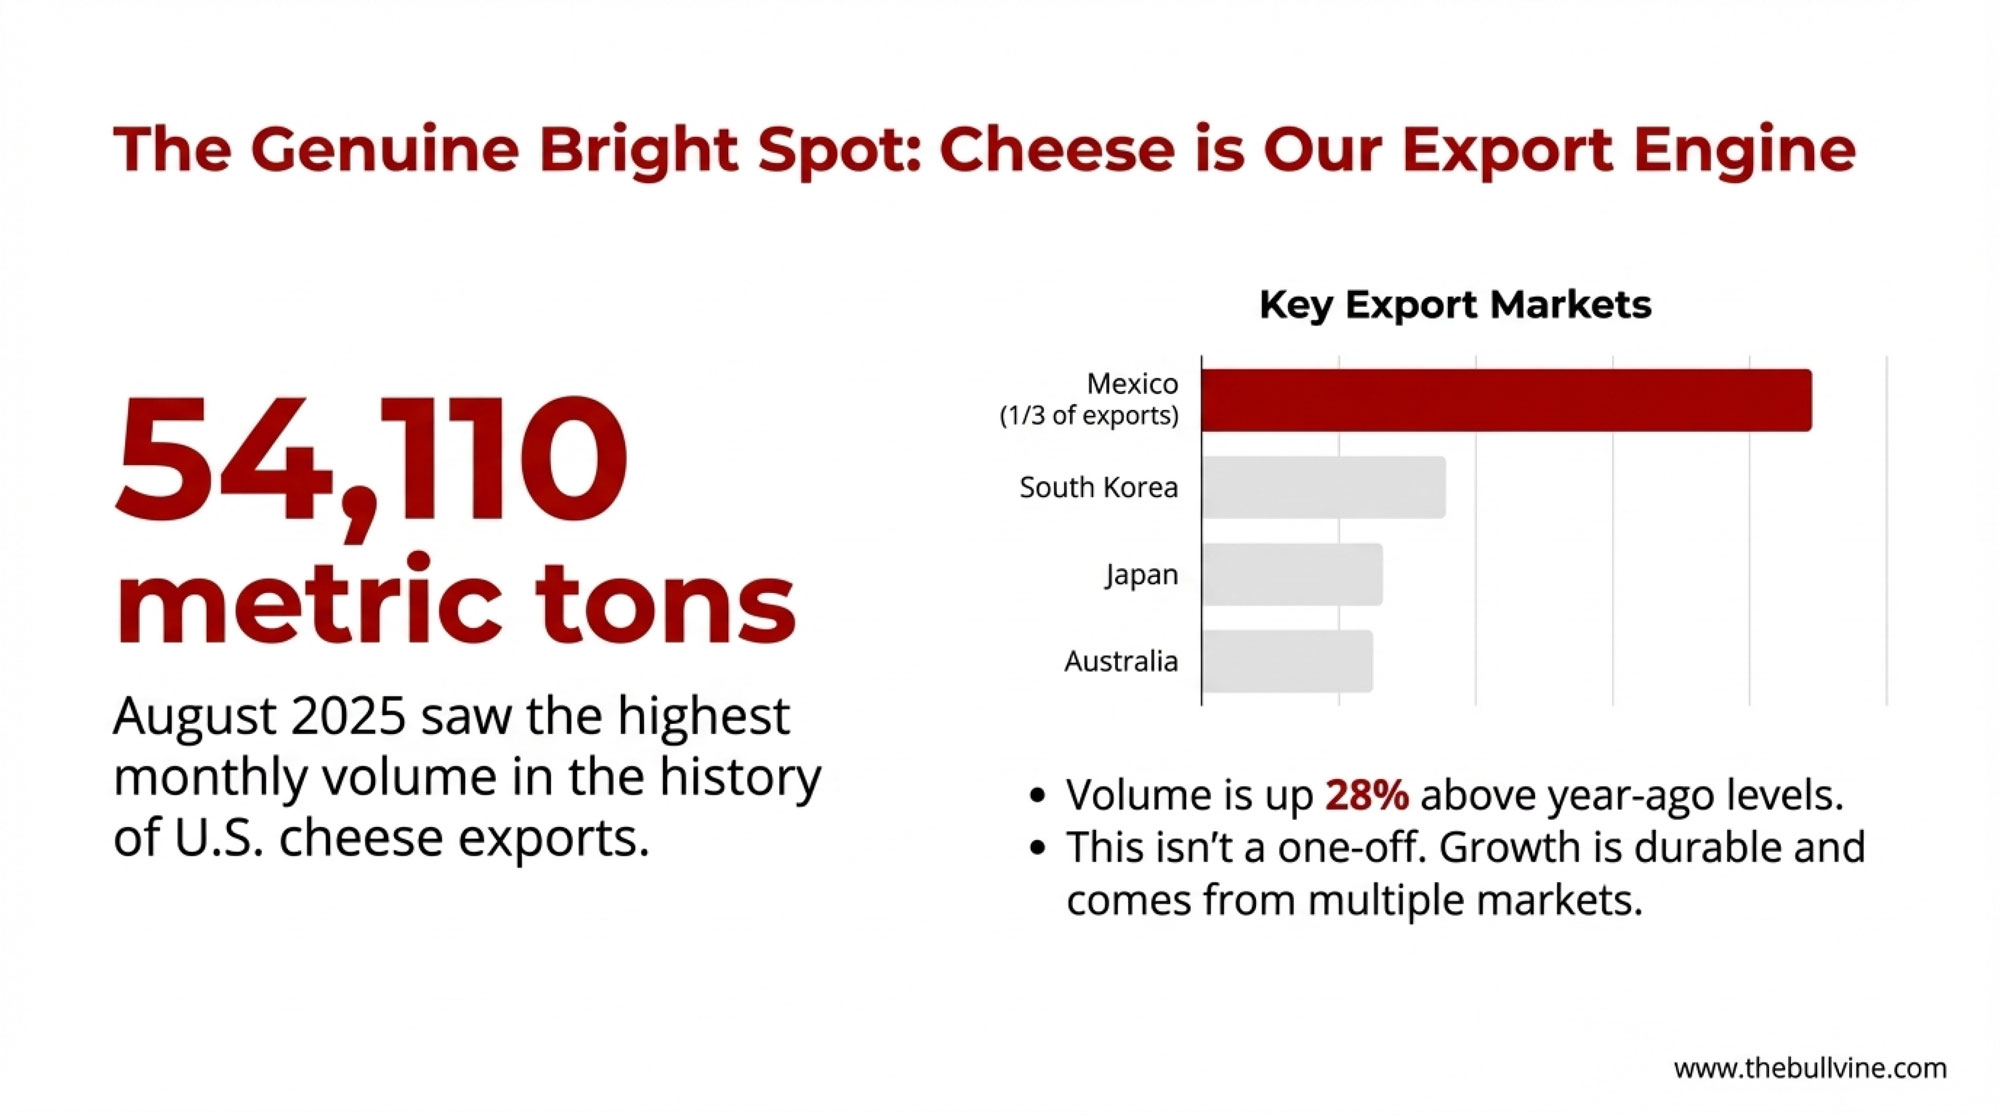
USDEC confirmed that August 2025 reached 54,110 metric tons—the highest monthly volume in the history of U.S. cheese exports. That’s 28% above year-ago levels, and the growth has come from multiple markets rather than depending on any single buyer.

Mexico remains our foundation, accounting for roughly a third of total U.S. cheese exports, according to USDEC trade data. But South Korea, Japan, and Australia all posted strong growth in the first half of 2025. The fundamentals here—growing global demand, improved U.S. product quality, established market relationships—look durable.

One constraint worth watching: USTR data shows USMCA quota utilization is still around 42%, suggesting meaningful upside if Canadian market access improves. That’s a trade policy question beyond any individual producer’s control, but it represents real unrealized potential.

The GLP-1 Demand Question

GLP-1 drugs have some dairy economists predicting significant demand shifts. The actual data tells a more nuanced story, concerning in specific categories but not the catastrophe some suggest.

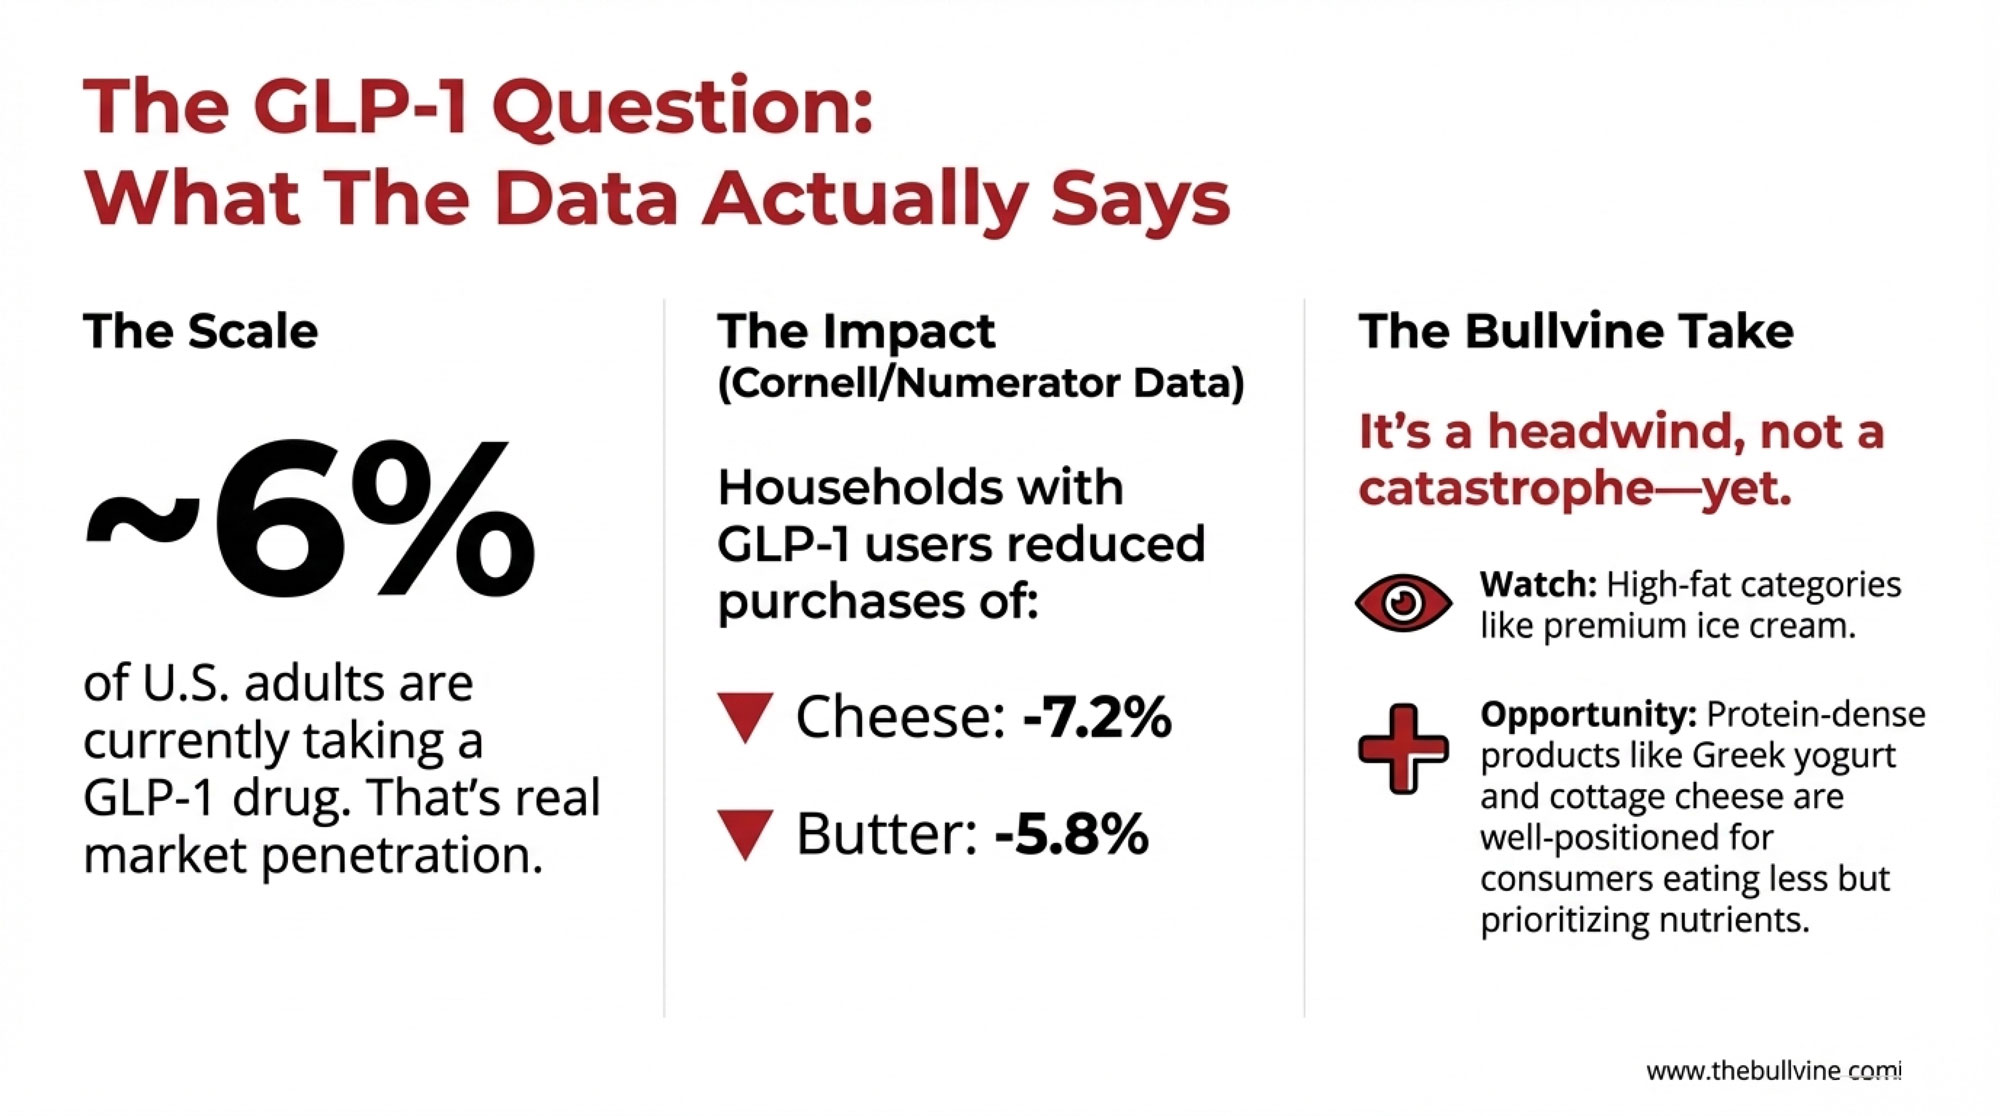
Kaiser Family Foundation polling indicates about 12% of American adults have used a GLP-1 medication at some point, with roughly 6% currently taking one. That’s real market penetration.

Cornell University and Numerator recently published detailed grocery purchasing data on this population. Households with GLP-1 users reduced cheese purchases by 7.2% and butter by 5.8%. They cut sweet bakery items and cookies by 6-11% across categories.

Here’s how I’d frame this practically: it matters, but it’s not an existential threat—yet. The protein density of dairy actually positions products like Greek yogurt and cottage cheese favorably for consumers who are eating less but prioritizing nutrient-dense foods.

Where I’d watch more carefully is high-fat categories. If GLP-1 adoption reaches the 15-24% levels Morgan Stanley projects for the early 2030s, premium ice cream and butter-heavy applications could face meaningful headwinds. Worth factoring into long-term product mix thinking, but not a reason to panic about 2026.

Current Price Reality

Let’s be direct about where we are.

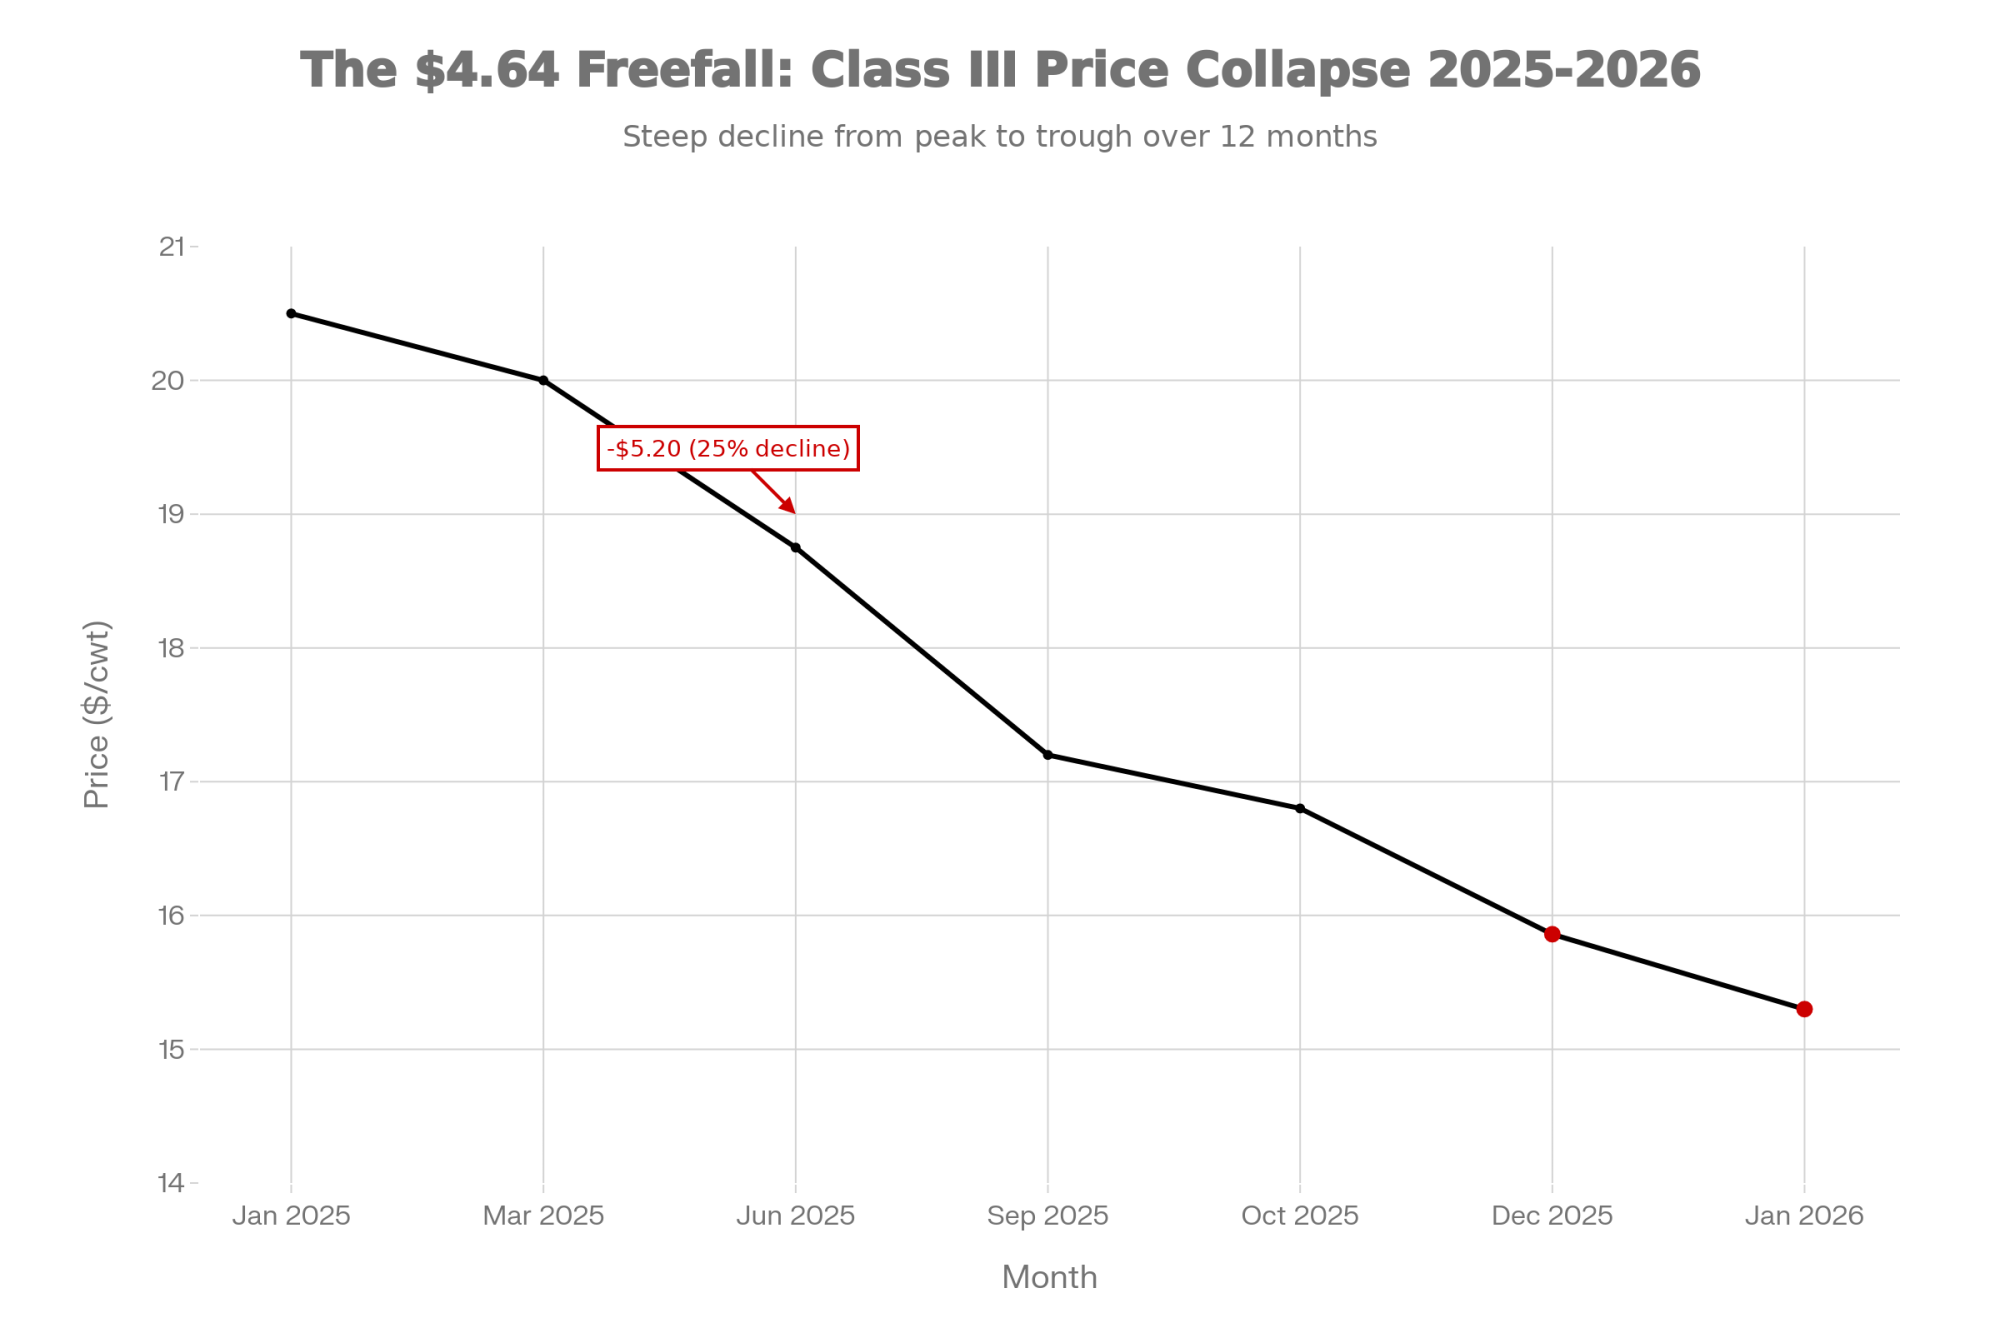
According to USDA’s official Class and Component Price announcements, December Class III came in at $15.86/cwt—January futures point to the low-to-mid $15 range. That’s the math when production expands as quickly as it has.

The Class III to Class IV spread has been particularly notable. December showed Class III at $15.86 versus Class IV at $13.64—a $2.22 gap favoring cheese markets over butter and powder. If you’re a Class IV shipper, you’ve felt that spread directly in your check. Geography and market assignment matter more than usual right now.

On the feed side, corn has been trading around $4.40 per bushel according to Trading Economics futures data. USDA projects an average farm price around $4.00 for the 2025/26 marketing year, which would provide some relief—but that’s not guaranteed.

What to Do Before Q2

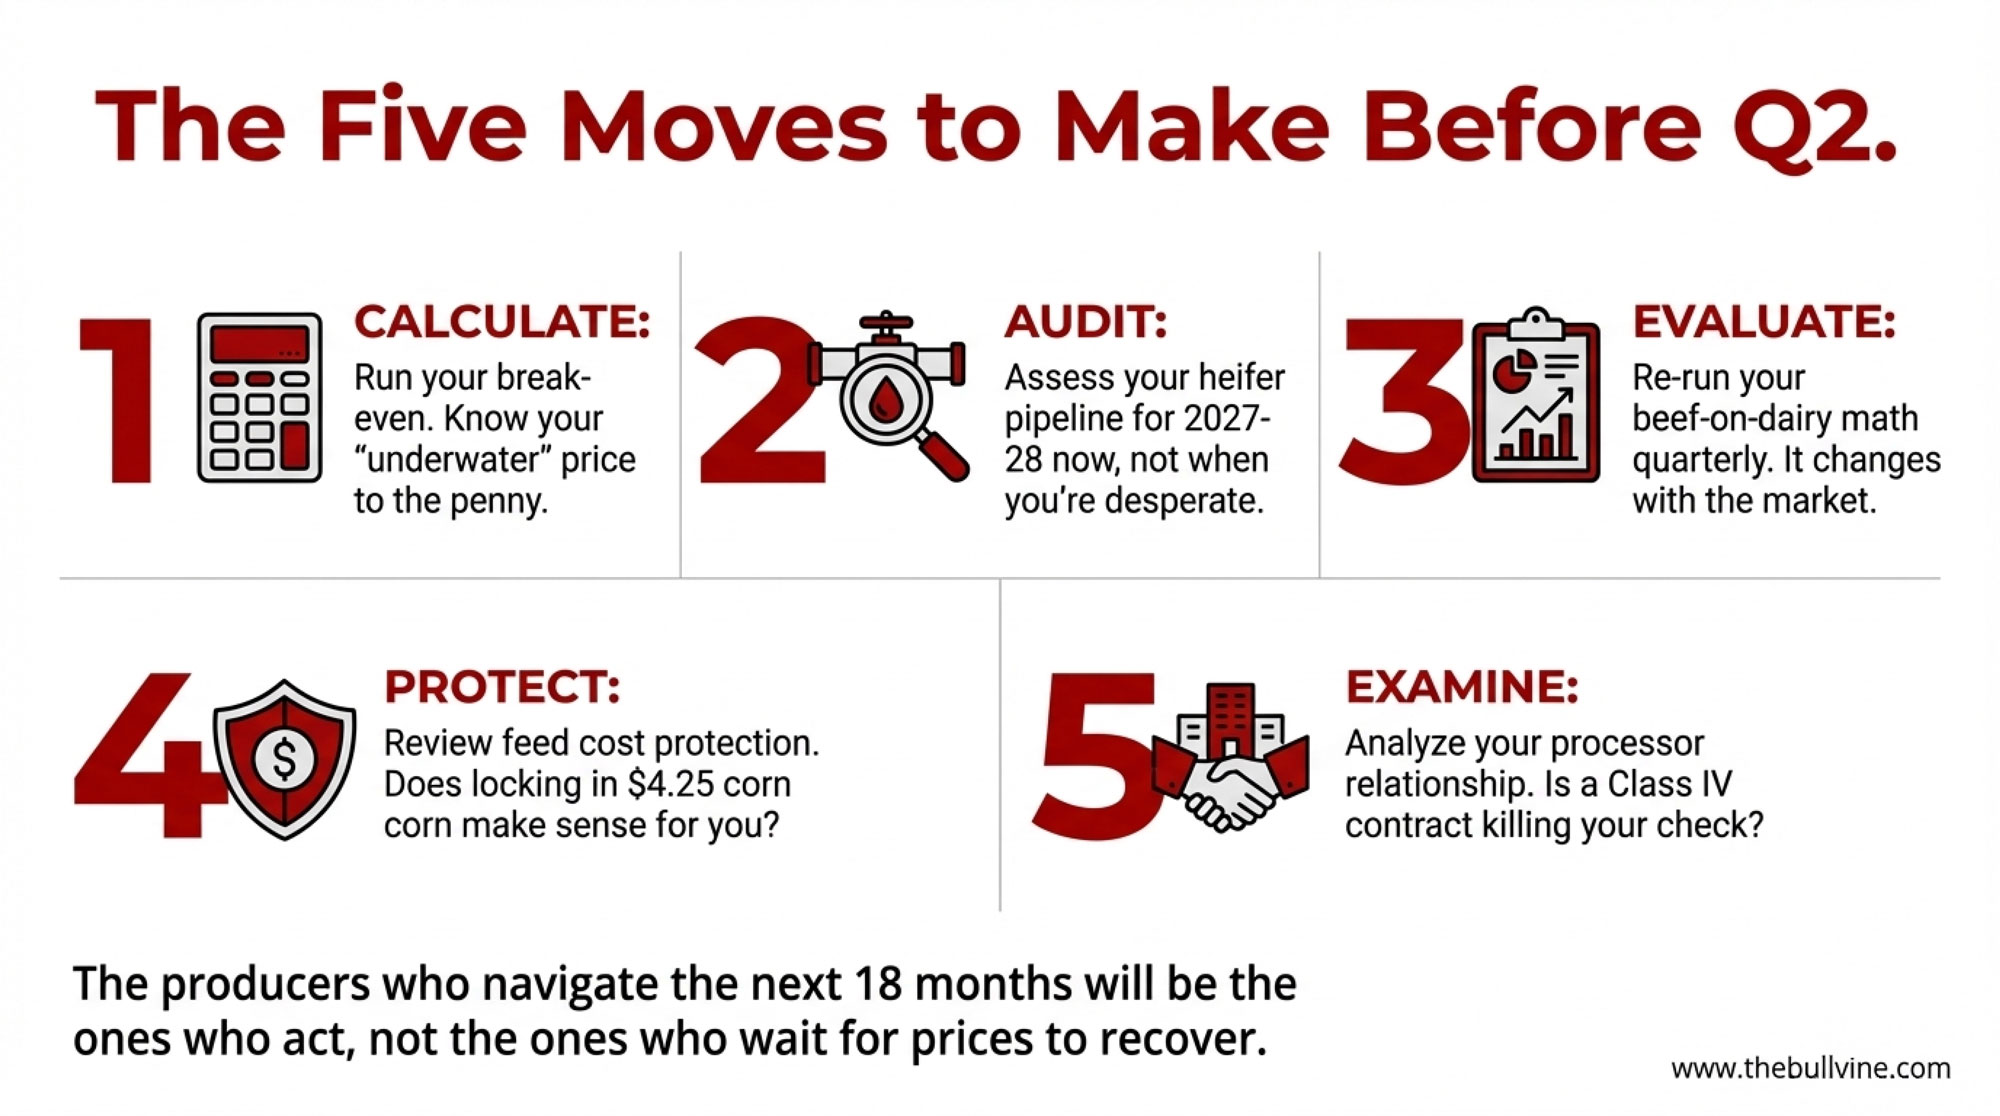
Based on the data and the producer conversations I’ve been having, here are five moves worth considering before spring:

  • Run your break-even calculation this week. Know exactly what Class III price puts you underwater. If you haven’t updated this math since prices were $20, you’re operating blind. Have contingency triggers ready—what do you cut first at $15? At $14?
  • Audit your heifer pipeline now. Calculate your replacement availability for the 2027-2028 calving. If you’re below 28 heifers per 100 cows, start sourcing conversations immediately. Set a price ceiling before you need animals urgently—desperation buying at $4,500 in twelve months is a lot more expensive than planned purchasing at $3,800 today.
  • Evaluate your beef-on-dairy math quarterly. The premium calculation shifts with calf prices and heifer availability. A 70% beef semen strategy that worked at $1,400 crossbred calves might need adjustment if those prices soften. Don’t set-and-forget your breeding program.
  • Review feed cost protection. With corn at $4.40 and possible relief toward $4.00, evaluate whether forward contracts make sense for Q1-Q2 before spring planting volatility. Locking in $4.25 corn looks smart if prices spike; it looks expensive if they fall to $3.80. Know your risk tolerance.
  • Examine your processor relationship. If you’re Class IV-dependent and watching checks come in $2.20 below Class III equivalents, it’s worth exploring whether component shipping options or processor alternatives exist in your region. Not every operation has flexibility here, but some do and aren’t using it.

The Bottom Line

The operations that navigate the next 12-18 months successfully won’t be the ones waiting for prices to recover on their own. They’ll be the ones who used this window to lock in replacement animals before the shortage intensifies, controlled feed costs where possible, and knew their break-even to the penny.

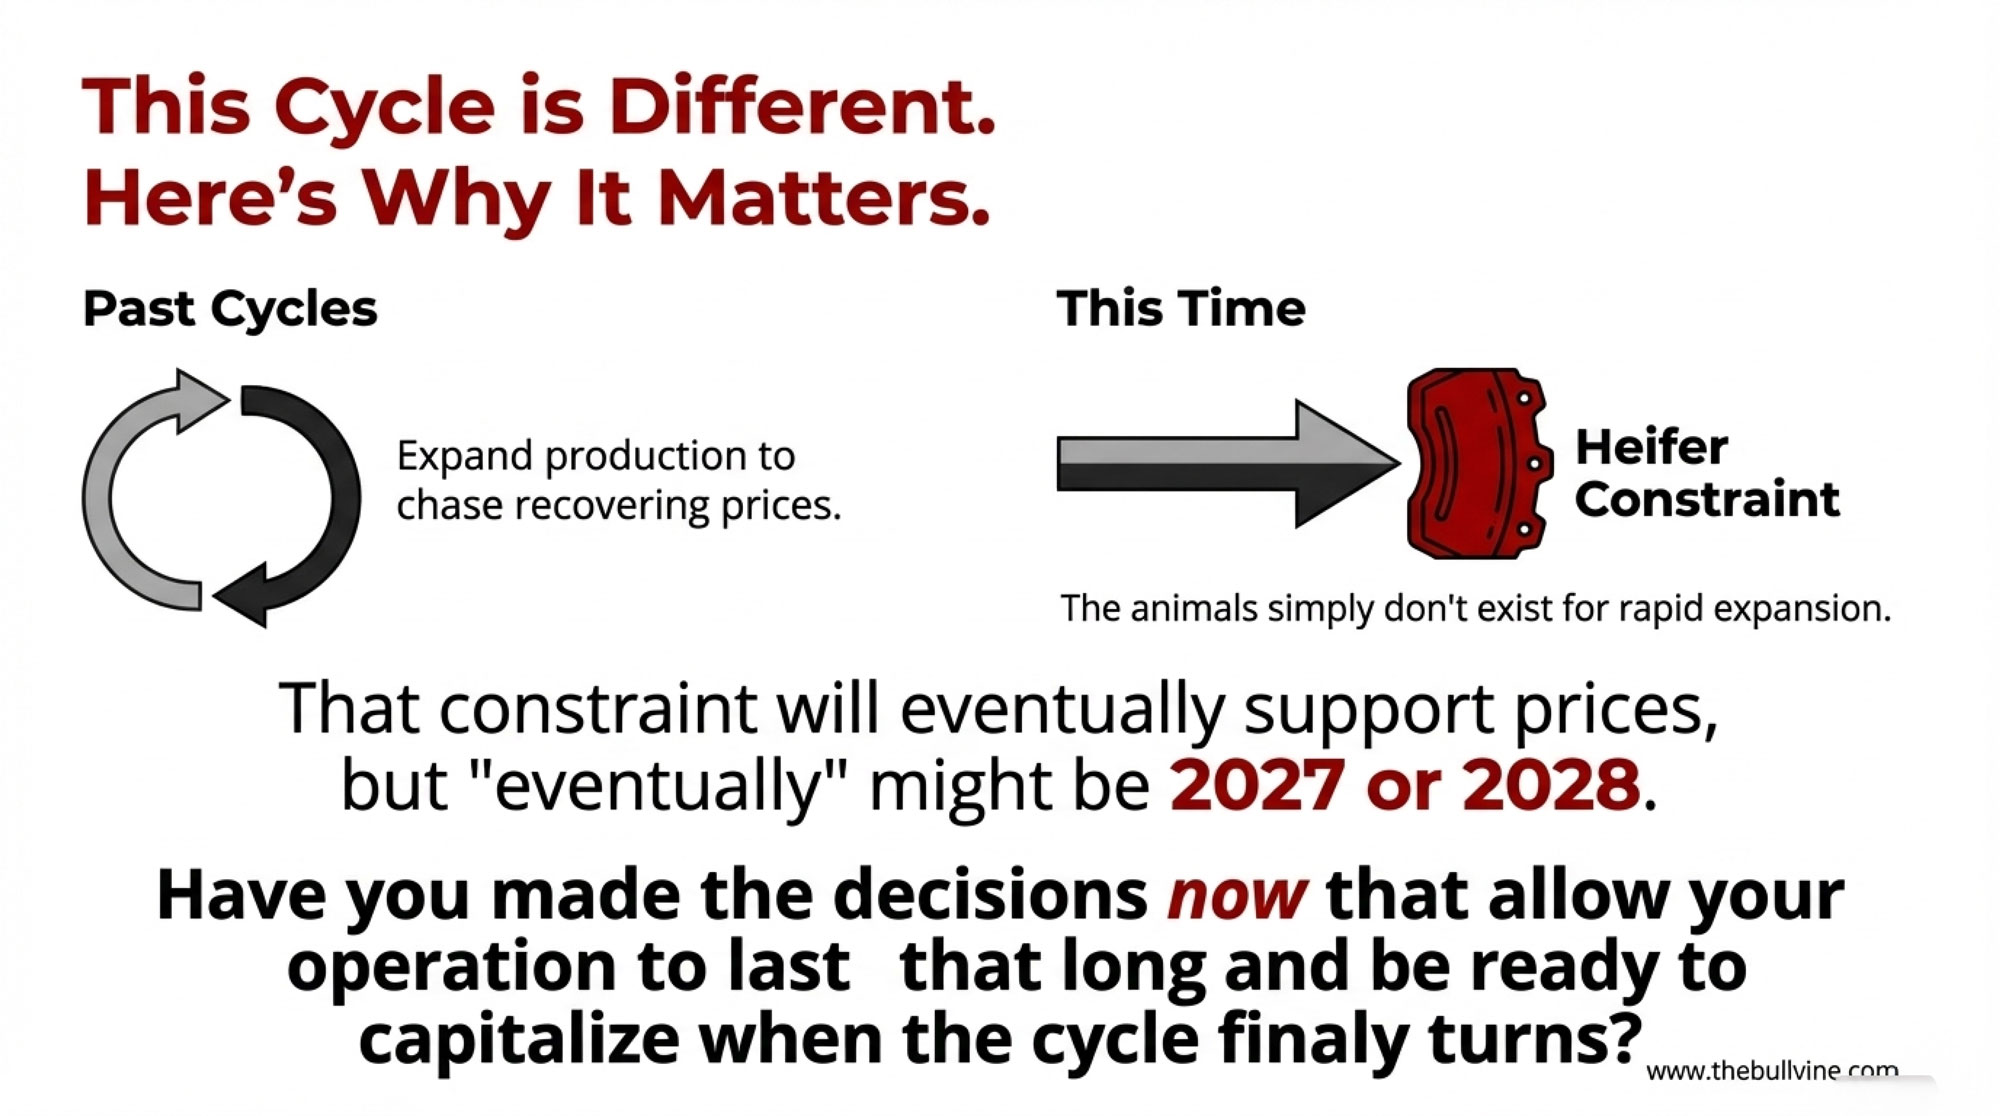
Dairy has always been cyclical. Strong production, recovering global supply, and moderating prices—we’ve been through this pattern before. What’s different this time is the heifer constraint underneath it all. The industry can’t simply expand out of tight margins when replacement animals don’t exist.

That constraint will eventually support prices. But “eventually” might be 2027 or 2028. The question is whether your operation’s financial position lets you wait that long—and whether you’re taking the steps now that position you to expand when the cycle turns.

The fundamentals of dairy demand remain constructive. Protein consumption is growing. Convenience continues driving category growth. Despite years of plant-based competition, real dairy holds its market share.

Those realities matter. But so does the math of $15.86 Class III with $4.40 corn and $4,000 springers. The producers who acknowledge both—the long-term demand strength and the short-term margin pressure—are the ones making decisions right now that they won’t regret in 2027. 

Key Takeaways 

  • You’re bleeding $80/cow monthly — Class III crashed to $15.86; that’s $16,000 vanishing from a 200-cow herd before spring
  • 211,000 cows added in 12 months — Largest U.S. herd since 1993; prices won’t recover until supply corrects
  • Springers hit $4,000+ — Tightest heifer pipeline in 20 years; replacement economics have flipped
  • Global milk keeps flooding in — California +10%, EU +6%, New Zealand +3%; no relief coming in 2026
  • 5 moves to make now — Know your break-even, source heifers before desperation, reassess beef-on-dairy, lock feed, review your processor

Complete references and supporting documentation are available upon request by contacting the editorial team at editor@thebullvine.com.

Learn More

Join the Revolution!

Join over 30,000 successful dairy professionals who rely on Bullvine Weekly for their competitive edge. Delivered directly to your inbox each week, our exclusive industry insights help you make smarter decisions while saving precious hours every week. Never miss critical updates on milk production trends, breakthrough technologies, and profit-boosting strategies that top producers are already implementing. Subscribe now to transform your dairy operation’s efficiency and profitability—your future success is just one click away.

NewsSubscribe
First
Last
Consent

U.S. Milk Production Dips: A Look Behind the Numbers

Is the U.S. running out of milk? Find out the troubling trends impacting dairy farmers and the future of milk production. Read more now.

Summary: Brace yourself, dairy farmers, for a deep dive into the latest trends shaping our industry. July 2024 has ushered in a subtle yet significant shift in U.S. milk production, marking the thirteenth consecutive month of decline. The USDA’s recent report shows a 0.4% decrease year-over-year, with the major milk states producing 18.171 billion pounds—a slight dip from July 2023. Despite a minor increase in production per cow, the overall number of milked cows decreased, driving this downward trend. California still tops the charts, but Texas surprises with a notable production boost. In July, the top 24 states saw a reduction in output by 0.2%, although per-cow productivity rose slightly. Key states like California and Idaho recorded drops, but Texas outperformed with a 6% rise in output due to herd expansion and better yields. Factors like tight heifer supplies, high beef prices, and hot summer temperatures are complicating herd expansion, pushing dairy commodity prices upwards. So, what’s really happening on our farms, and how can we navigate this complexity? Let’s explore.

  • US milk production continues to decline, marking the thirteenth consecutive month of reduced output.
  • USDA’s report shows a 0.4% decrease in year-over-year production in July 2024, with a total of 18.171 billion pounds.
  • Despite a slight increase in per-cow production, a reduction in the number of milked cows is driving the downward trend.
  • California remains the top producer, while Texas saw a surprising 6% increase in milk production due to herd expansion and improved yields.
  • Tight heifer supplies, high beef prices, and hot summer temperatures are complicating herd expansion efforts.
  • Dairy commodity prices are rising, affected by the tight supply and challenging conditions faced by producers.
milk output, United States, top 24 milk-producing states, dairy herd, climatic conditions, USDA, productivity per cow, California, Wisconsin, Michigan, efficiency, production, reductions, Idaho, Minnesota, Texas, dairy slaughter rates, heifer supply, beef prices, health difficulties, average yields, supply crunch, cheese, butter, consumer pricing, export opportunities, scaling up output, aging herd

Did you know that in July 2024, the United States experienced a significant 0.2% decrease in milk output? According to the USDA, the top 24 milk-producing states produced 18.171 billion pounds of milk, reflecting a subtle but impactful shift in the industry. As our dairy herd diminishes and climatic conditions change, we can’t help but worry about what the future holds for the dairy sector. “The USDA reduced its 2024 and 2025 milk production forecasts, suggesting that the sector may face more problems. Stay ahead by being informed.” — USDA Report for August 2024. As dairy producers, understanding the milk production environment helps us negotiate the complexity of our profession. So, let’s talk about what’s going on and what it implies for you and your farm.

MonthMilk Production (Billion Pounds) – 2023Milk Production (Billion Pounds) – 2024Year-over-Year Change (%)
January19.12518.950-0.91%
February17.80817.685-0.69%
March19.45019.210-1.23%
April19.81519.530-1.44%
May20.01019.770-1.20%
June19.64519.310-1.70%
July18.99018.915-0.40%

Milking More from Less: Navigating Dairy’s Subtle Shifts 

Milk production patterns show a small but significant change for dairy producers. According to the USDA’s most current figures, milk output in the top 24 milk-producing states fell by 0.2% from last year. On a bigger scale, overall US milk output fell by 0.4%.

Interestingly, average productivity per cow climbed somewhat, indicating a trend toward efficiency despite overall reductions. Each cow produced an average of 2,047 pounds of milk, a two-pound increase from the previous year. However, these improvements were countered by a decline in milk cows, which fell from 8.909 million to 8.878 million.

As dairy producers manage these challenges, the emphasis on individual cow production becomes more important. Do you see any comparable fluctuations in your herd’s productivity? What tactics are you using to adapt to these shifting dynamics?

California Dominates, But Texas Takes a Surprising Leap

StateProduction (Billion Pounds)Change from July 2023Average Production per Cow (Pounds)
California3.3-0.3%2,112
Wisconsin2.6-0.1%2,142
Michigan1.1-0.9%2,178
Texas1.58+6%2,073
Idaho1.22-1%2,032

Regarding state performance, California remains the leader in milk output and herd size. California’s extensive resources and infrastructure lead the way in dairy production.

Wisconsin, known for its dairy business, continues to do well, ranking second in output and herd size. However, like many other states, Wisconsin is not immune to the industry’s gradual decline.

Michigan stands out as having the highest per-cow average. This reflects the state’s focus on efficiency and production, which means each cow’s contribution is significant.

Despite these regions of strength, other states have seen reductions. California witnessed a 0.3% reduction in production, while Idaho’s dropped by 1%. In the Midwest, Michigan’s output fell by 0.9%, Minnesota’s by 4%, and Wisconsin’s by 0.1%.

On a positive note, Texas outperformed the trend with a remarkable 6% rise in output. This jump, driven by an 18,000-cow increase and improved yields, indicates a solid rebound from previous struggles and is a beacon of hope in the industry’s current challenges.

The Silent Shrinking Herd: Behind the Dip in Milk Production

The smaller dairy herd is a significant reason influencing lower milk output. The fall in cow numbers corresponds to a decrease in milk yield. In July 2024, the number of cows milked declined to 8.878 million from 8.909 million the previous year. This decrease may seem tiny, but its influence on total productivity is enormous.

Dairy slaughter rates exacerbate the problem. Producers have attempted to maintain herd levels, but limited heifer supply and high beef prices impede growth. Even with a healthy margin, these variables restrict the potential to add additional productive cows to the herd. As a result, barns stay less complete than anticipated, reducing milk production potential.

Then there’s the problem of the aging herd and ongoing animal health concerns. As cows age, their output naturally falls. When combined with health difficulties, the productivity per cow might drop even lower. While average yields rose by 0.1% in July, this rise was insufficient to balance losses due to lower herd size. These health and aging issues are expected to have a more significant long-term impact on productivity.

When Weather Wears Down: The Heat Wave Impact

Understanding the significant impact of weather on milk production is crucial for dairy producers. Hot temperatures significantly reduced milk quantities this summer, notably in the West and Upper Midwest. California, the milk production powerhouse, witnessed a 0.3% reduction, while Idaho saw less than a 1% drop. Michigan, Minnesota, and Wisconsin recorded reductions of 0.9%, 4%, and 0.1%, respectively. Extreme heat affects cows, lowering their feed intake and milk supply. These weather trends are not random variations but rather significant issues that dairy producers must confront. Even the best-managed herds cannot sustain peak production levels as temperatures rise.

Extreme heat affects cows, lowering their feed intake and milk supply. These weather trends are not random variations but rather significant issues that dairy producers must confront. Even the best-managed herds cannot sustain peak production levels as temperatures rise.

Supply Crunch Driving Up Dairy Prices: Can Farmers Keep Up? 

It’s no surprise that restricted milk supply is driving up dairy commodities and milk prices. When supply falls, the fundamental economics of demand and supply come into play. Less milk implies less raw material for dairy products, like cheese and butter. As a consequence, prices for these goods automatically rise. According to the USDA, a continuing reduction in herd size and lower milk output impacts everything from consumer pricing to export opportunities [USDA Milk Output Report, July 2024].

However, dairy producers confront considerable obstacles when they scale up output. First, low heifer supply and high beef prices make it difficult for producers to grow their herds. Farmers face a balancing act; they want to keep their barns full, but economic circumstances are only sometimes favorable. Furthermore, ongoing health difficulties and an aging herd will further reduce output. This delicate balance gets more complicated with an 18.000-cow rise in specific locations, indicating that other areas struggle to sustain populations [USDA Report].

Because of these complicating circumstances, the anticipated supply response is limited. Producers are unwilling to grow in an uncertain market, mainly when insufficient profits cover expenditures. Hot summer temperatures have also hurt milk production in the West and Upper Midwest. Challenges like these indicate that rising pricing pressure on dairy goods and milk will likely continue in the foreseeable future. Understanding these processes helps farmers navigate these economic waves more effectively.

From Price Hikes to Plant Milk: Navigating Consumer Trends in Dairy 

Consumer demand and market changes are critical in determining the dairy industry’s landscape. As milk output falls, it’s no wonder that prices begin to increase. Reduced supply naturally causes upward pressure on pricing, which may be beneficial and detrimental. On the one hand, higher prices may result in more significant margins for dairy producers; conversely, they may discourage customers from buying as much dairy as they would otherwise.

Have you noticed that your dairy products have become more expensive lately? This is a direct outcome of the reduced milk production rates we’ve been experiencing. However, consumer behavior is multidimensional. When prices rise, people sometimes respond by purchasing fewer amounts or choosing less costly alternatives. This change may be minor, but it has long-term implications for total demand.

In terms of alternatives, the plant-based milk market continues to rise. According to recent projections, the worldwide plant-based milk industry is predicted to grow to $21.52 billion by 2024. This spike is primarily due to increasing health awareness and dietary choices. So, what does this imply for the dairy farmers?

So, it’s a call to adapt. The emergence of plant-based alternatives does not signal death for the dairy business. Still, farmers must be more intelligent about market trends. Diversifying product lines to include value-added dairy products or investigating niche markets such as organic or A2 milk might be helpful. Furthermore, increasing farm-level efficiency might help mitigate some issues caused by shifting market needs.

The bottom line is that recognizing and reacting to shifting customer preferences and market trends will be necessary. Embracing innovation and anticipating market expectations may help dairy producers convert obstacles into opportunities.

Strategic Planning Amidst Shifting Projections: Your Blueprint for Resilience 

The USDA’s latest modification of milk production predictions presents a cautious future picture. The forecasts for 2024 and 2025 have been reduced, indicating that sustaining supply levels may continue to be complicated. As a dairy farmer, this information is more than background noise; it’s an essential indicator for strategic planning. The subsequent supply and demand figures, due on September 12th, will give more information.

Keeping up with these changes is critical. Understanding how national and global changes affect milk production may help you make choices that keep your operations robust. By staying ahead of the curve, you may strategically position yourself for success, whether altering herd size, investing in efficiency, or exploring new markets.

The Bottom Line

Dairy producers must remain aware and agile as they negotiate a terrain defined by diminishing herds, unpredictable productivity, and constant weather concerns. The surprise increase in milk output in Texas and the steady reduction in regions such as California and Wisconsin underscore the industry’s geographical heterogeneity. Furthermore, the impact of tighter supply on dairy prices must be considered.

Understanding these patterns is essential for flourishing in a competitive market, not simply surviving. The capacity to predict and adapt to these changes can influence your bottom line. Climate change, commercial needs, and changing customer tastes all contribute to a dynamic future for dairy production.

Are you ready to adapt to the ever-changing landscape? Your choices now will influence the resilience and sustainability of your business tomorrow.

Learn more: 

Dairy Margin Watch: Stable July Amid Strong Cheese Demand and Constrained Supply

Learn how high cheese demand and limited supply are keeping dairy margins stable this July. Want to know how this affects milk prices and feed costs? Find out more.

Dairy margins remained stable in early July, with milk prices and feed costs holding steady. This stability reflects the broader market, as highlighted by the USDA’s July WASDE report, which projects new-crop corn production at 15.1 billion bushels—up 240 million due to increased planted and harvested areas. Adjustments in crop usage resulted in a slight drop in projected 2024-25 ending stocks to 2.097 billion bushels. Similarly, soybean ending stocks decreased by 20 million bushels to 435 million, staying within the expected ranges.

CategoryJuly 2023 EstimateJune 2023 EstimateChange
Corn Production (billion bushels)15.114.86+0.24
Ending Corn Stocks (billion bushels)2.0972.102-0.005
Soybean Ending Stocks (million bushels)435455-20
Cheese Production (billion lbs)1.2
May Cheese Exports (million lbs)105.972.3+33.6
Class III Milk Price ($/cwt)19.5

Strong Cheese Demand and Limited Spot Supply: Navigating the Current Dairy Market Challenges 

Strong cheese demand has been pivotal in supporting milk prices, further boosted by limited spot supply. Market challenges, including heat stress, avian influenza, and a constrained heifer supply, have tightened milk output. USDA reports note that cheesemakers have seen zero spot milk offers, a rare situation even during holiday weeks. This scarcity highlights the significant impact of these stressors on milk production.

Analyzing Cheese Production Variables: Parsing the Impacts on Milk Prices 

May cheese production saw a modest increase of 0.7% from the previous year, totaling just over 1.2 billion pounds. A closer look shows Mozzarella production surged by 7.1%, reflecting strong demand, while American cheese varieties, including Cheddar, declined by 5.7%. This reduction in Cheddar has driven up Class III milk prices, adding complexity to market dynamics for dairy producers.

Record-breaking Cheese Exports: A Pivotal Surge in the U.S. Dairy Landscape 

The significant growth in cheese exports, especially the surge to Mexico, is pivotal for the U.S. dairy industry. Over the past seven months, U.S. cheese exports have set new records even after seasonal adjustments. This trend highlights strong international demand alongside record domestic consumption, driving historically strong profit margins. Our analysis shows this dual demand—the global market expansion and local appetite—could continue to support milk prices, giving U.S. dairy producers a unique opportunity to capitalize on these robust conditions.

The Bottom Line

As we review the intricacies of the current dairy market, it becomes clear that supply constraints and robust demand are pivotal in shaping milk prices. The first half of July saw marginal stability in dairy margins, reflecting a balance between feed costs and milk prices, influenced by USDA estimates and market activities. Reduced corn and soybean stocks and increased cheese production and exports to Mexico present a multifaceted scenario. 

The USDA’s projection of higher new-crop corn production contrasts with a slight decrease in ending stocks, illustrating the complexities of balancing supply and demand. Meanwhile, the record-breaking surge in cheese exports underscores the U.S. dairy sector’s growing global influence. Strong cheese demand, limited spot milk supply, and factors like heat stress and avian influenza impact Class III milk prices, creating a favorable margin environment for forward contract planning. 

These market movements suggest a need for strategic foresight and adaptive measures within the dairy sector. Producers are encouraged to capitalize on favorable margins by extending coverage in deferred marketing periods. The current landscape calls for vigilant market monitoring and proactive risk management strategies to sustain profitability. Leveraging historical margins can strengthen positions and help confidently navigate the complexities ahead.

Key Takeaways:

  • Dairy margins remained largely unchanged in the first half of July.
  • The USDA’s July WASDE report aligns with analyst expectations for new-crop corn production at 15.1 billion bushels.
  • Projected 2024-25 ending stocks for corn are down by 5 million bushels to 2.097 billion bushels.
  • Soybean ending stocks saw a decline of 20 million bushels from June, totaling 435 million bushels.
  • Milk prices are buoyed by limited spot supply availability and robust cheese demand.
  • USDA reports indicate a significant constraint in milk output due to factors like heat stress, avian influenza, and limited heifer supply.
  • May cheese production witnessed a mild increase of 0.7% year-over-year.
  • Mozzarella production surged by 7.1%, while American varieties dropped 5.7% from last year.
  • Cheese exports reached a record high in May, up 46.6% from the previous year with substantial contributions from Mexico.
  • U.S. cheese exports have set records for seven consecutive months.
  • Domestic cheese demand has hit record levels in 10 of the past 17 months.
  • Clients continue to secure coverage in deferred marketing to leverage historically strong margins.

Summary:

In early July, dairy margins remained stable, with milk prices and feed costs remaining steady. The USDA’s July WASDE report shows new-crop corn production at 15.1 billion bushels, up 240 million due to increased planted and harvested areas. Adjustments in crop usage resulted in a slight drop in projected 2024-25 ending stocks to 2.097 billion bushels, and soybean ending stocks decreased by 20 million bushels to 435 million. Strong cheese demand has been pivotal in supporting milk prices, further boosted by limited spot supply. Market challenges, including heat stress, avian influenza, and a constrained heifer supply, have tightened milk output. May cheese production saw a modest increase of 0.7% from the previous year, totaling just over 1.2 billion pounds. Mozzarella production surged by 7.1%, reflecting strong demand, while American cheese varieties, including Cheddar, declined by 5.7%. The significant growth in cheese exports, especially the surge to Mexico, is pivotal for the U.S. dairy industry, as it highlights strong international demand alongside record domestic consumption, driving historically strong profit margins. Producers are encouraged to capitalize on favorable margins by extending coverage in deferred marketing periods and calling for vigilant market monitoring and proactive risk management strategies to sustain profitability.

Learn more:

Send this to a friend