Archive for heifer inventory shortage

The Heifer Crisis Hiding in Plain Sight: Why Your Next 90 Days Determine Your 2028 Herd

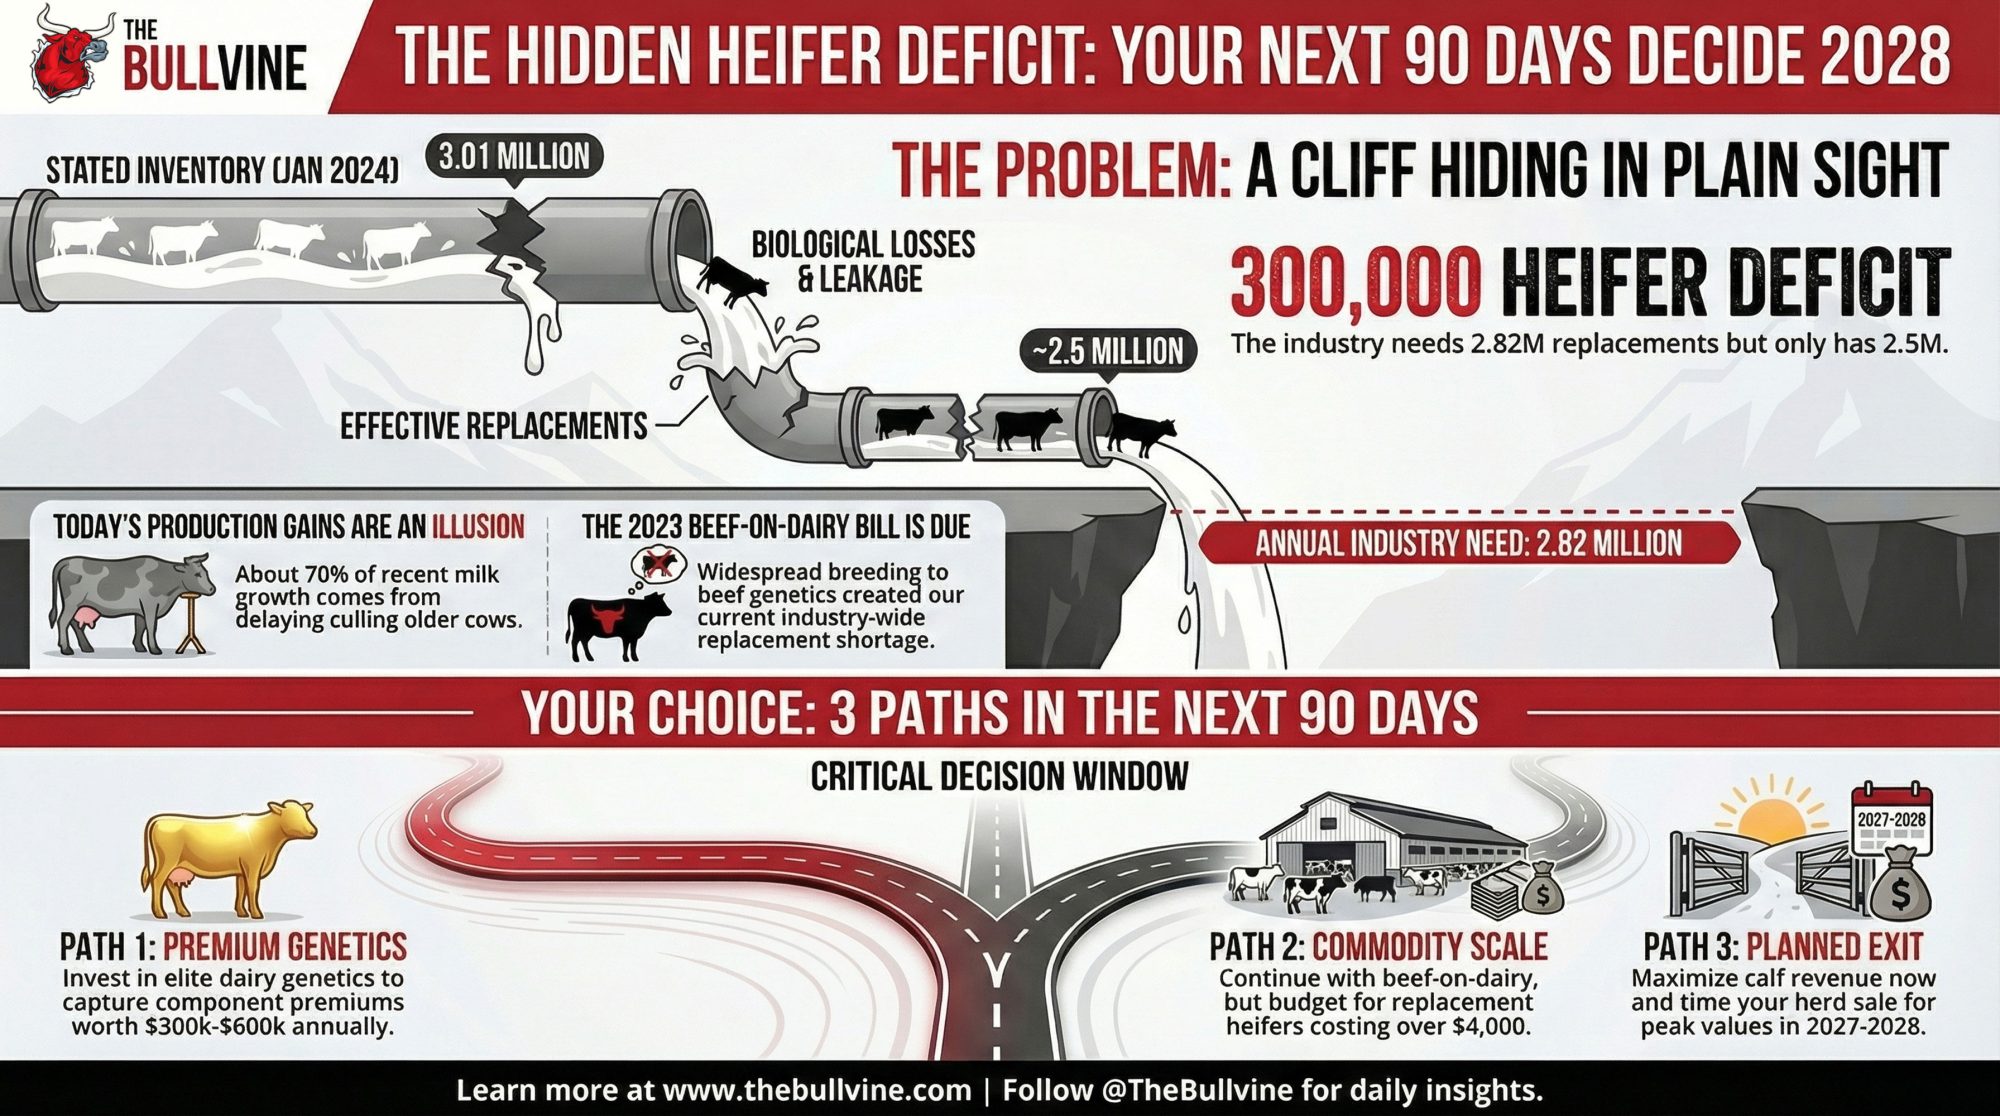
Here’s what USDA’s numbers aren’t saying: we’re producing 2% more milk by keeping older cows longer, not breeding better replacements. Heifer inventory: 3M. Effective after losses: 2.5M. Need: 2.8M. Q1 2025 contract negotiations may be your last window for leverage.

Dairy Heifer Inventory Crisis

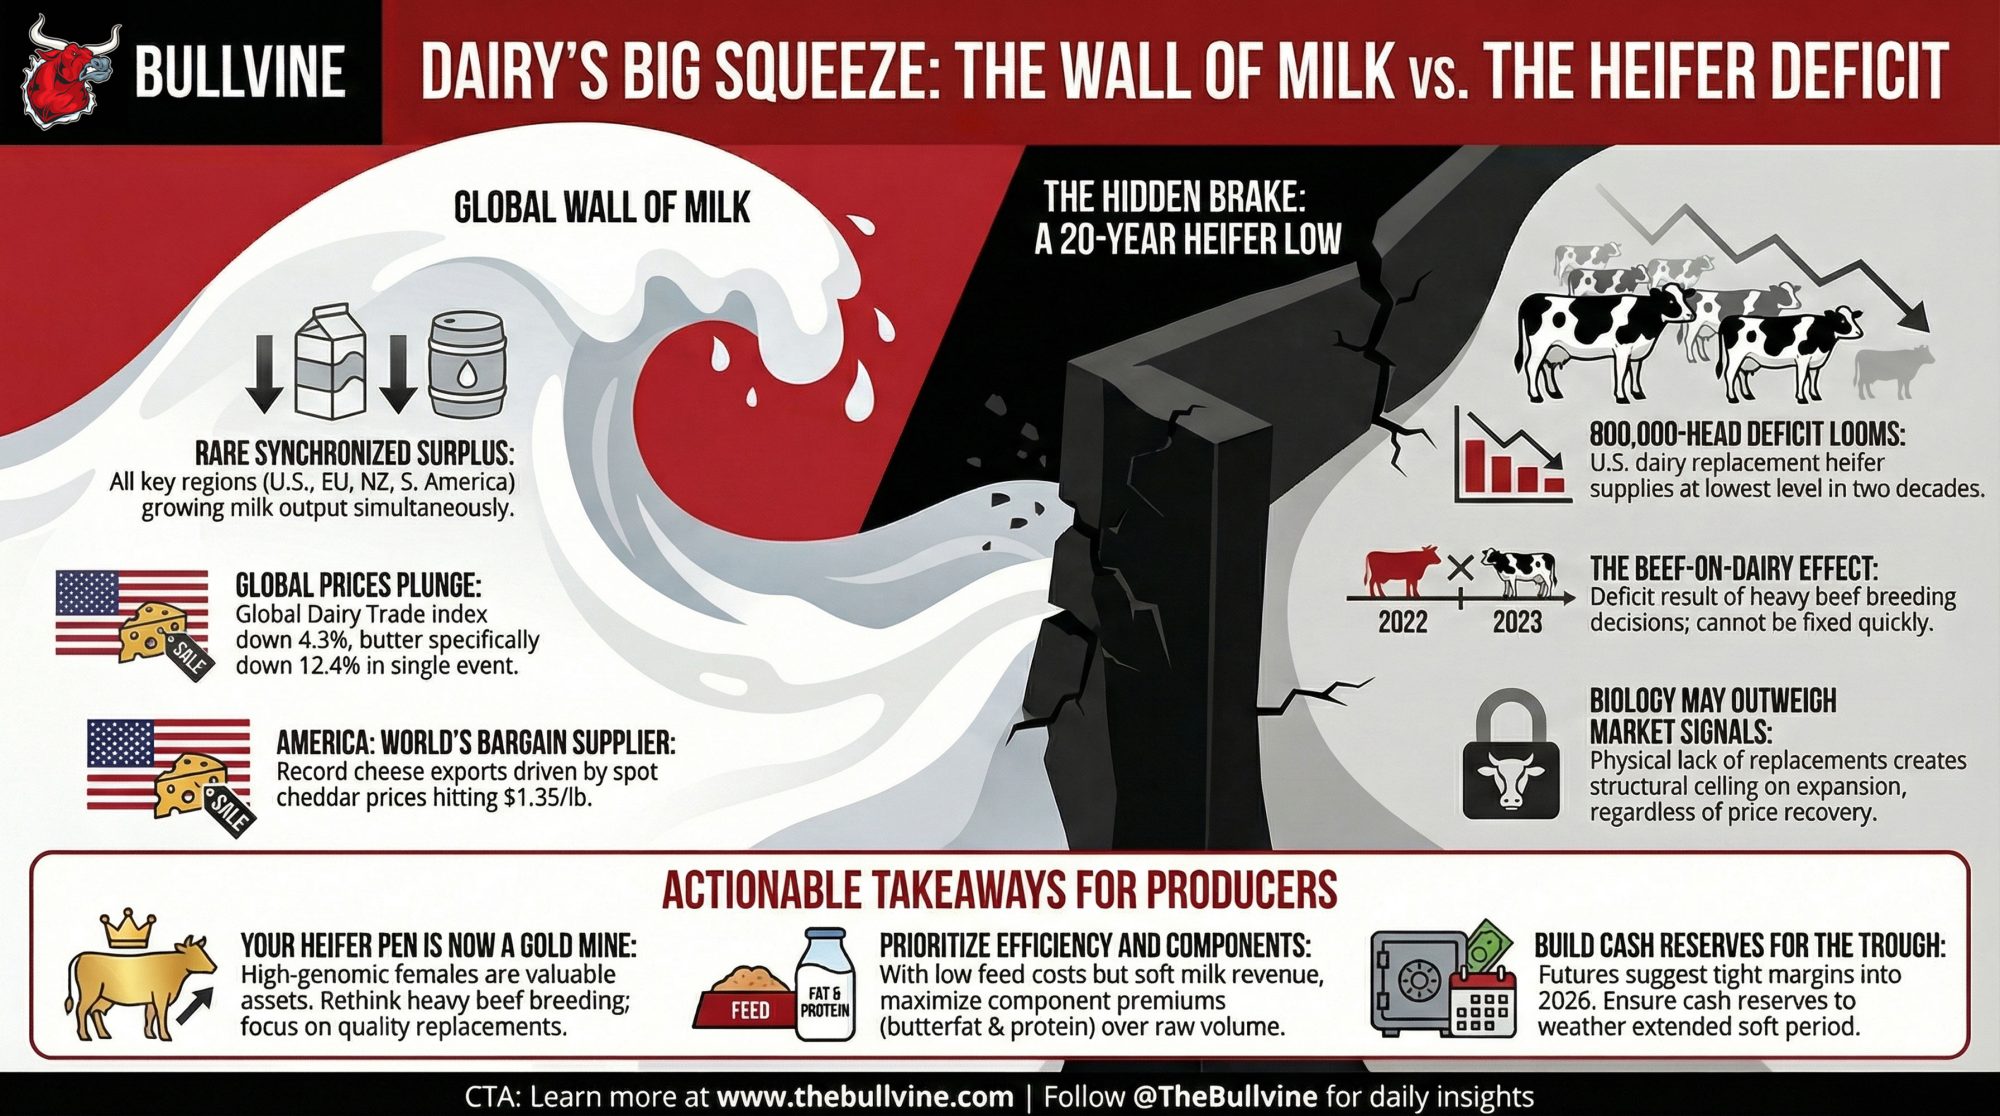
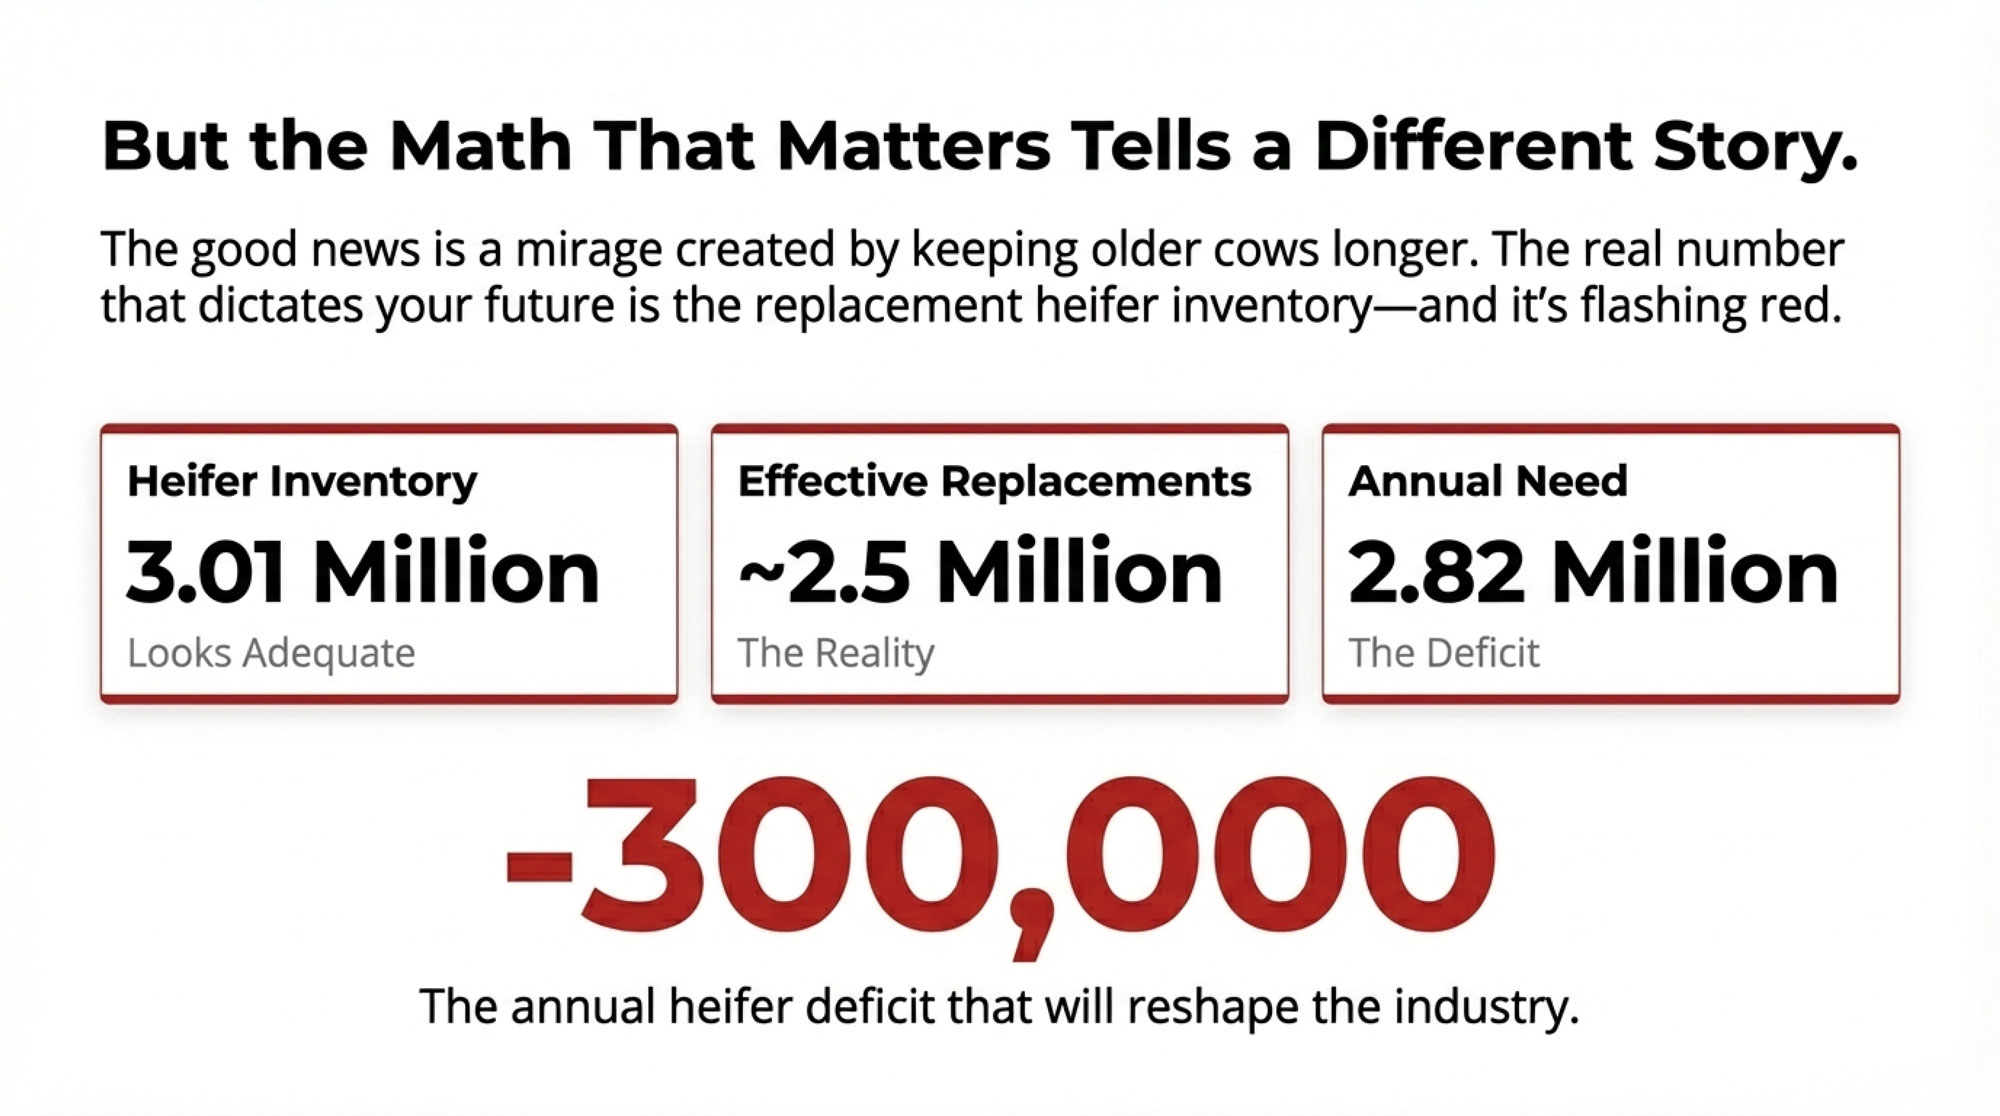
Executive Summary: The U.S. dairy industry’s 3 million replacement heifers look adequate—until you run the math. Biological losses reduce effective replacements to 2.5 million against 2.82 million needed, creating a 300,000-head deficit that determines who’s milking cows in 2028. This shortage traces directly to 2023’s margin crisis, when 50-60% of operations made individually rational decisions to breed beef genetics, creating a collective supply constraint. Recent production gains (+2% component-adjusted) mask this reality through delayed culling—essentially borrowing from future herd health to meet current demand. Producers face a critical 90-day convergence: breeding decisions made through March 2025 determine 2028 herds (a 30-month development cycle), while Q1 contract negotiations lock in multi-year positioning before processor leverage shifts mid-year. Three strategic paths remain viable—premium genetics targeting $300K-600K component premiums, commodity-scale operations, or planned exits that maximize 2027-2028 peak values—but only for farms committing to strategy before leverage evaporates. Delay means accepting substantially weaker competitive positioning.

The dairy production numbers coming out of USDA through fall 2024 have been encouraging—milk production trending up around 1% year-over-year, with component-adjusted growth looking even better at close to 2%. For those of us who’ve weathered some brutal margin pressure, volatile feed costs, and the ongoing industry consolidation, those figures feel like validation that our strategic shifts toward higher per-cow productivity and better component yields are finally paying dividends.

But there’s another number in those same USDA cattle inventory reports that tells a fundamentally different story about where we’re headed. And honestly, it’s the number that keeps me up at night more than any production statistic: we’re looking at around 3 million replacement heifers in the pipeline, and when you account for the biological realities of heifer development—the mortality, the breeding failures, the time lag—that number gets tight. Real tight.

Here’s what I mean by that.

The Fast Facts: Where We Stand Right Now

MetricCurrent EstimateRequired for StabilityStatus
Total US Dairy Herd9.4 Million Cows9.4 Million CowsNeutral
Replacement Heifer Inventory3.01 Million (Jan 2024)2.82 Million MinimumTight
Effective Replacements (After Losses)~2.5 Million2.82 MillionDeficit
Annual Heifer Mortality10-12% (300,000-360,000 head)Critical Loss
Breeding Failures5-8% (150,000-240,000 head)Critical Loss

Source: USDA NASS Cattle Inventory (January 2024); Penn State Extension; University of Wisconsin dairy economists

The Replacement Math Most Folks Aren’t Running

Let’s walk through the fundamentals here, because this is where the whole story starts to come together.

The U.S. dairy herd sits at roughly 9.4 million cows right now—that’s straight from USDA’s latest numbers. And if you’ve been in this business for any length of time, you know the biological reality: you need to replace somewhere between 25 and 30% of your herd annually just to maintain stable numbers.

That’s not bad management. That’s just dairy farming.

Cows age out, reproductive issues happen, injuries occur, and diseases strike. Penn State Extension puts typical culling rates at 25-35% annually, and Wisconsin Extension says 28-32% is common. It’s simply the nature of keeping a productive milking herd.

So do the math with me here: maintaining 9.4 million cows means you need somewhere between 2.35 and 2.82 million replacement heifers every year. Not to grow. Not to expand into new markets or add another parlor. Just to stay even.

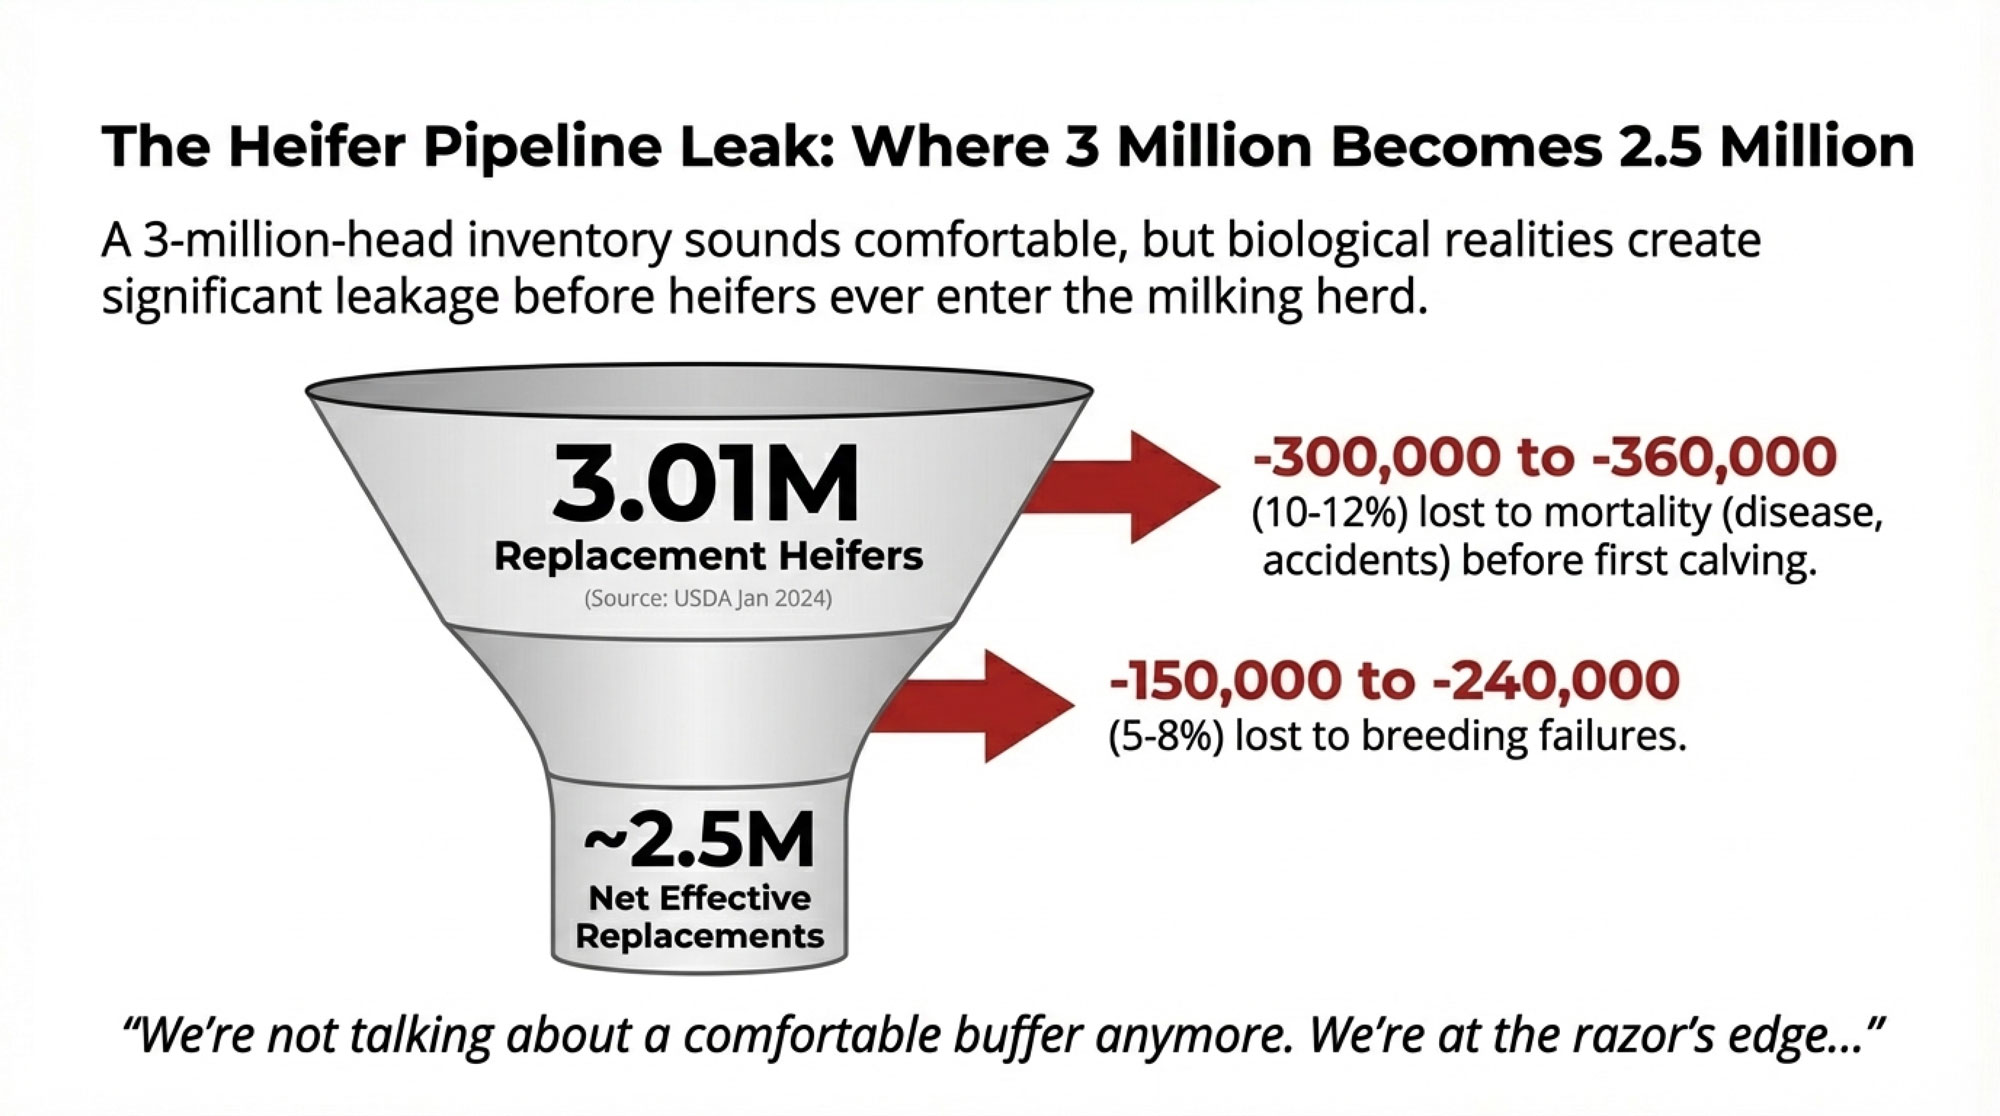
The Heifer Pipeline Leakage: Where 3 Million Becomes 2.5 Million

Now, looking at USDA’s January 2024 cattle inventory—the most recent complete data we’ve got—we’re seeing about 3.01 million dairy replacement heifers of all ages. That sounds comfortable at first glance. Maybe even pretty good compared to where we need to be.

But here’s where the biological constraints start biting us.

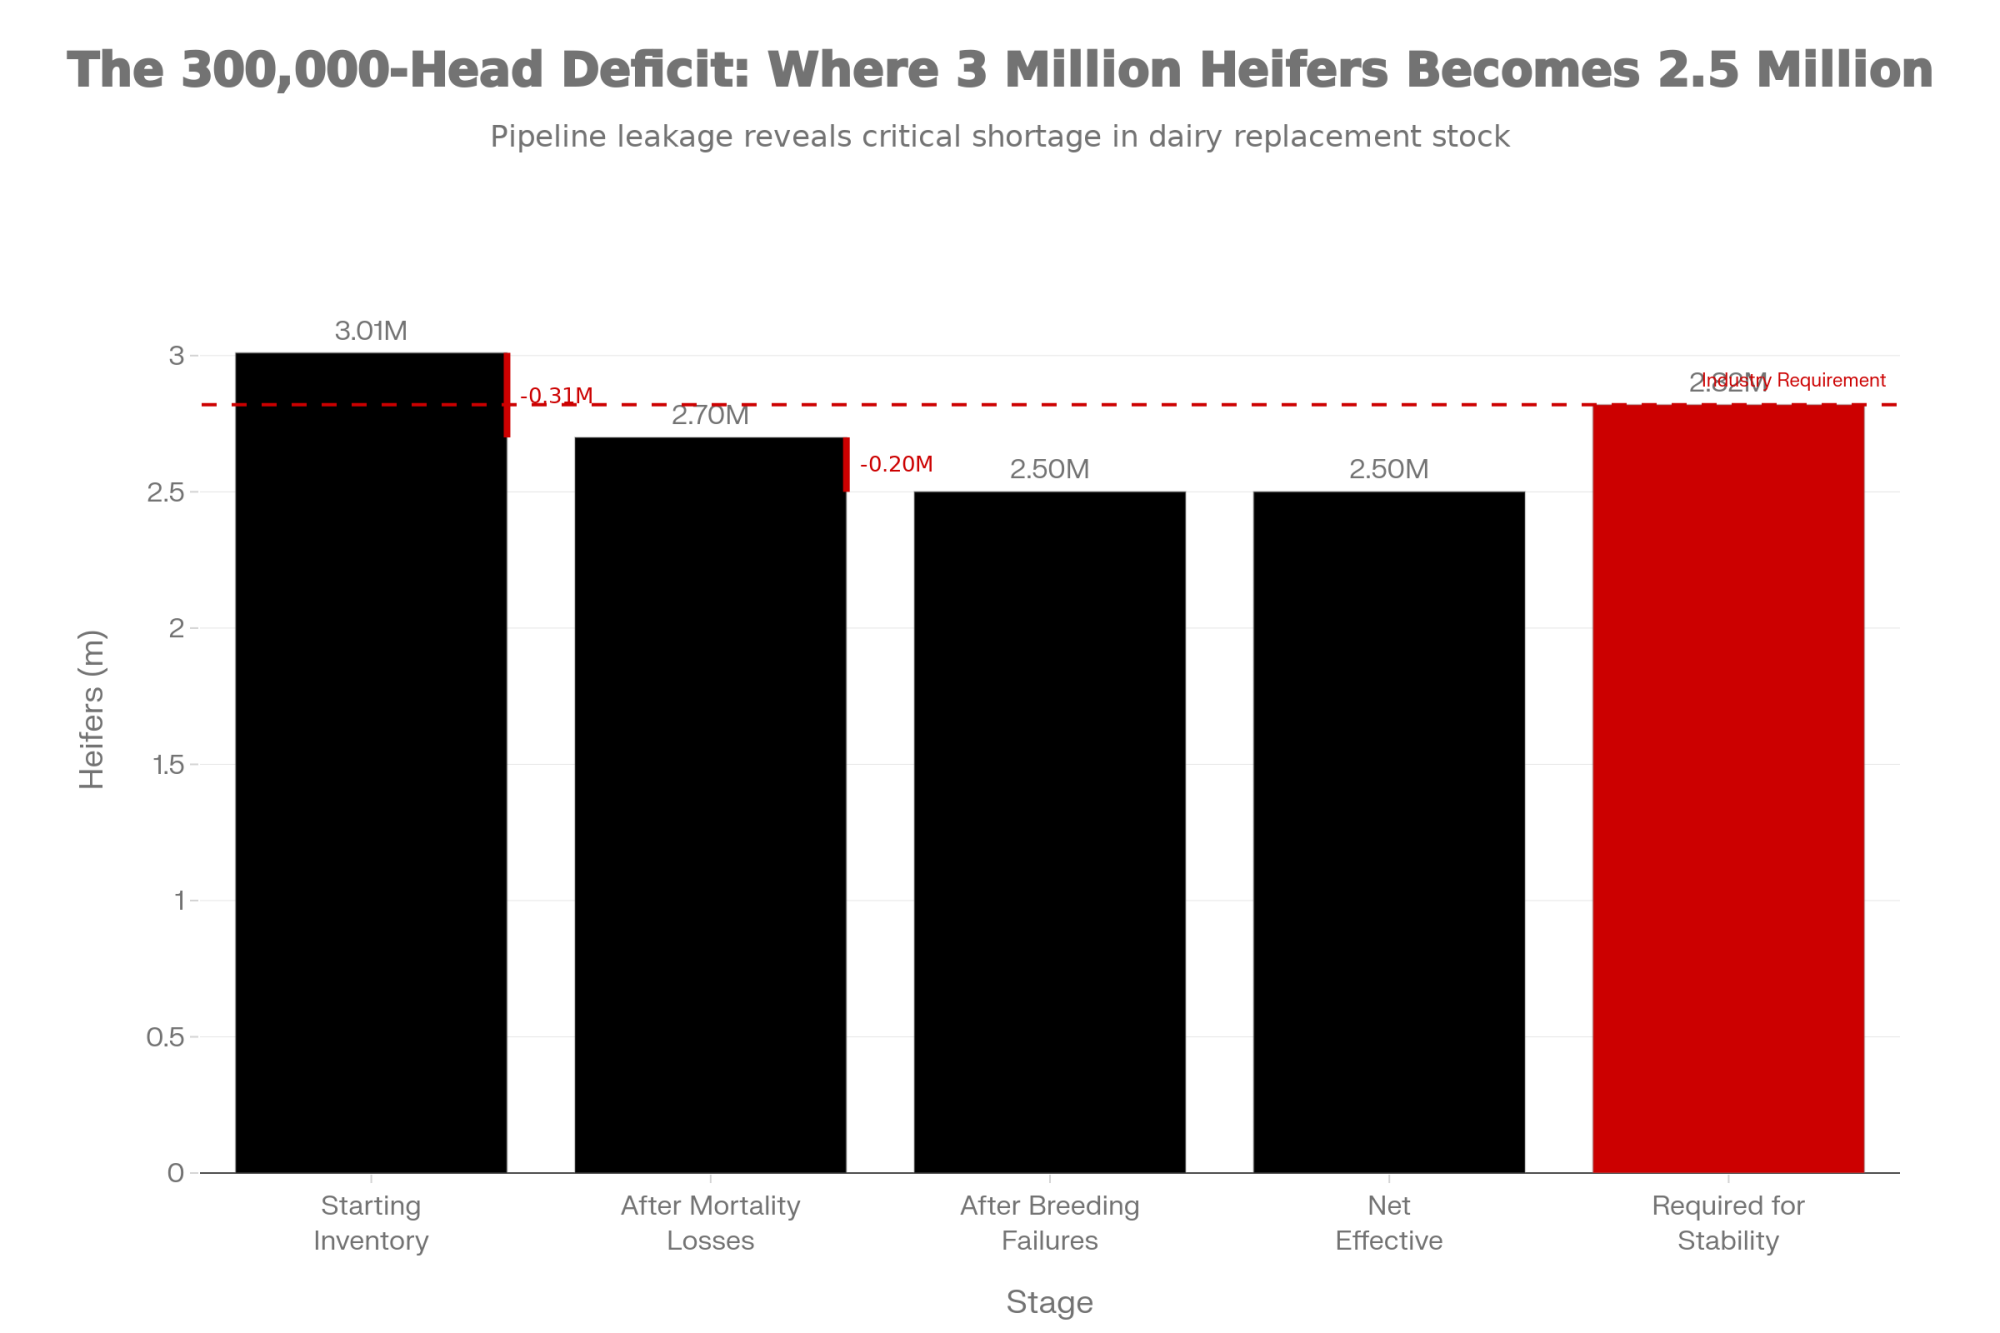
The Pipeline Breakdown:

  • Starting inventory: 3.01 million replacement heifers (USDA Jan 2024)
  • Minus mortality losses (10-12%): -300,000 to -360,000 heifers lost to disease, accidents, developmental issues before first calving
  • Minus breeding failures (5-8%): -150,000 to -240,000 heifers that never successfully breed within acceptable timeframes
  • Net effective replacements: ~2.5 million heifers actually entering milking herds
  • Industry requirement: 2.35 to 2.82 million for herd maintenance
  • Buffer remaining: Essentially zero

Research from Wisconsin, Penn State, Cornell—pretty much every land-grant university that studies this—consistently shows that 10-12% of heifers don’t make it to first calving. We lose them to scours as calves, respiratory disease as weanlings, accidents, and developmental issues. The USDA’s own National Animal Health Monitoring System studies peg pre-weaning mortality around 5%, with another 5 to 7% lost between weaning and first calving.

“We’re not talking about a comfortable buffer anymore. We’re at the razor’s edge, with very little room for regional variation, disease outbreaks, or any of the hundred other things that can go sideways in livestock production.”

Then you’ve got breeding failures. And this is where I think a lot of optimistic projections fall short. Heifer conception rates typically run 55 to 65% per service according to the research, and while most heifers get bred successfully within a couple of services, you’re still looking at 5 to 8% that never successfully breed within acceptable timeframes. That’s another 150,000 to 240,000 heifers gone from productive use.

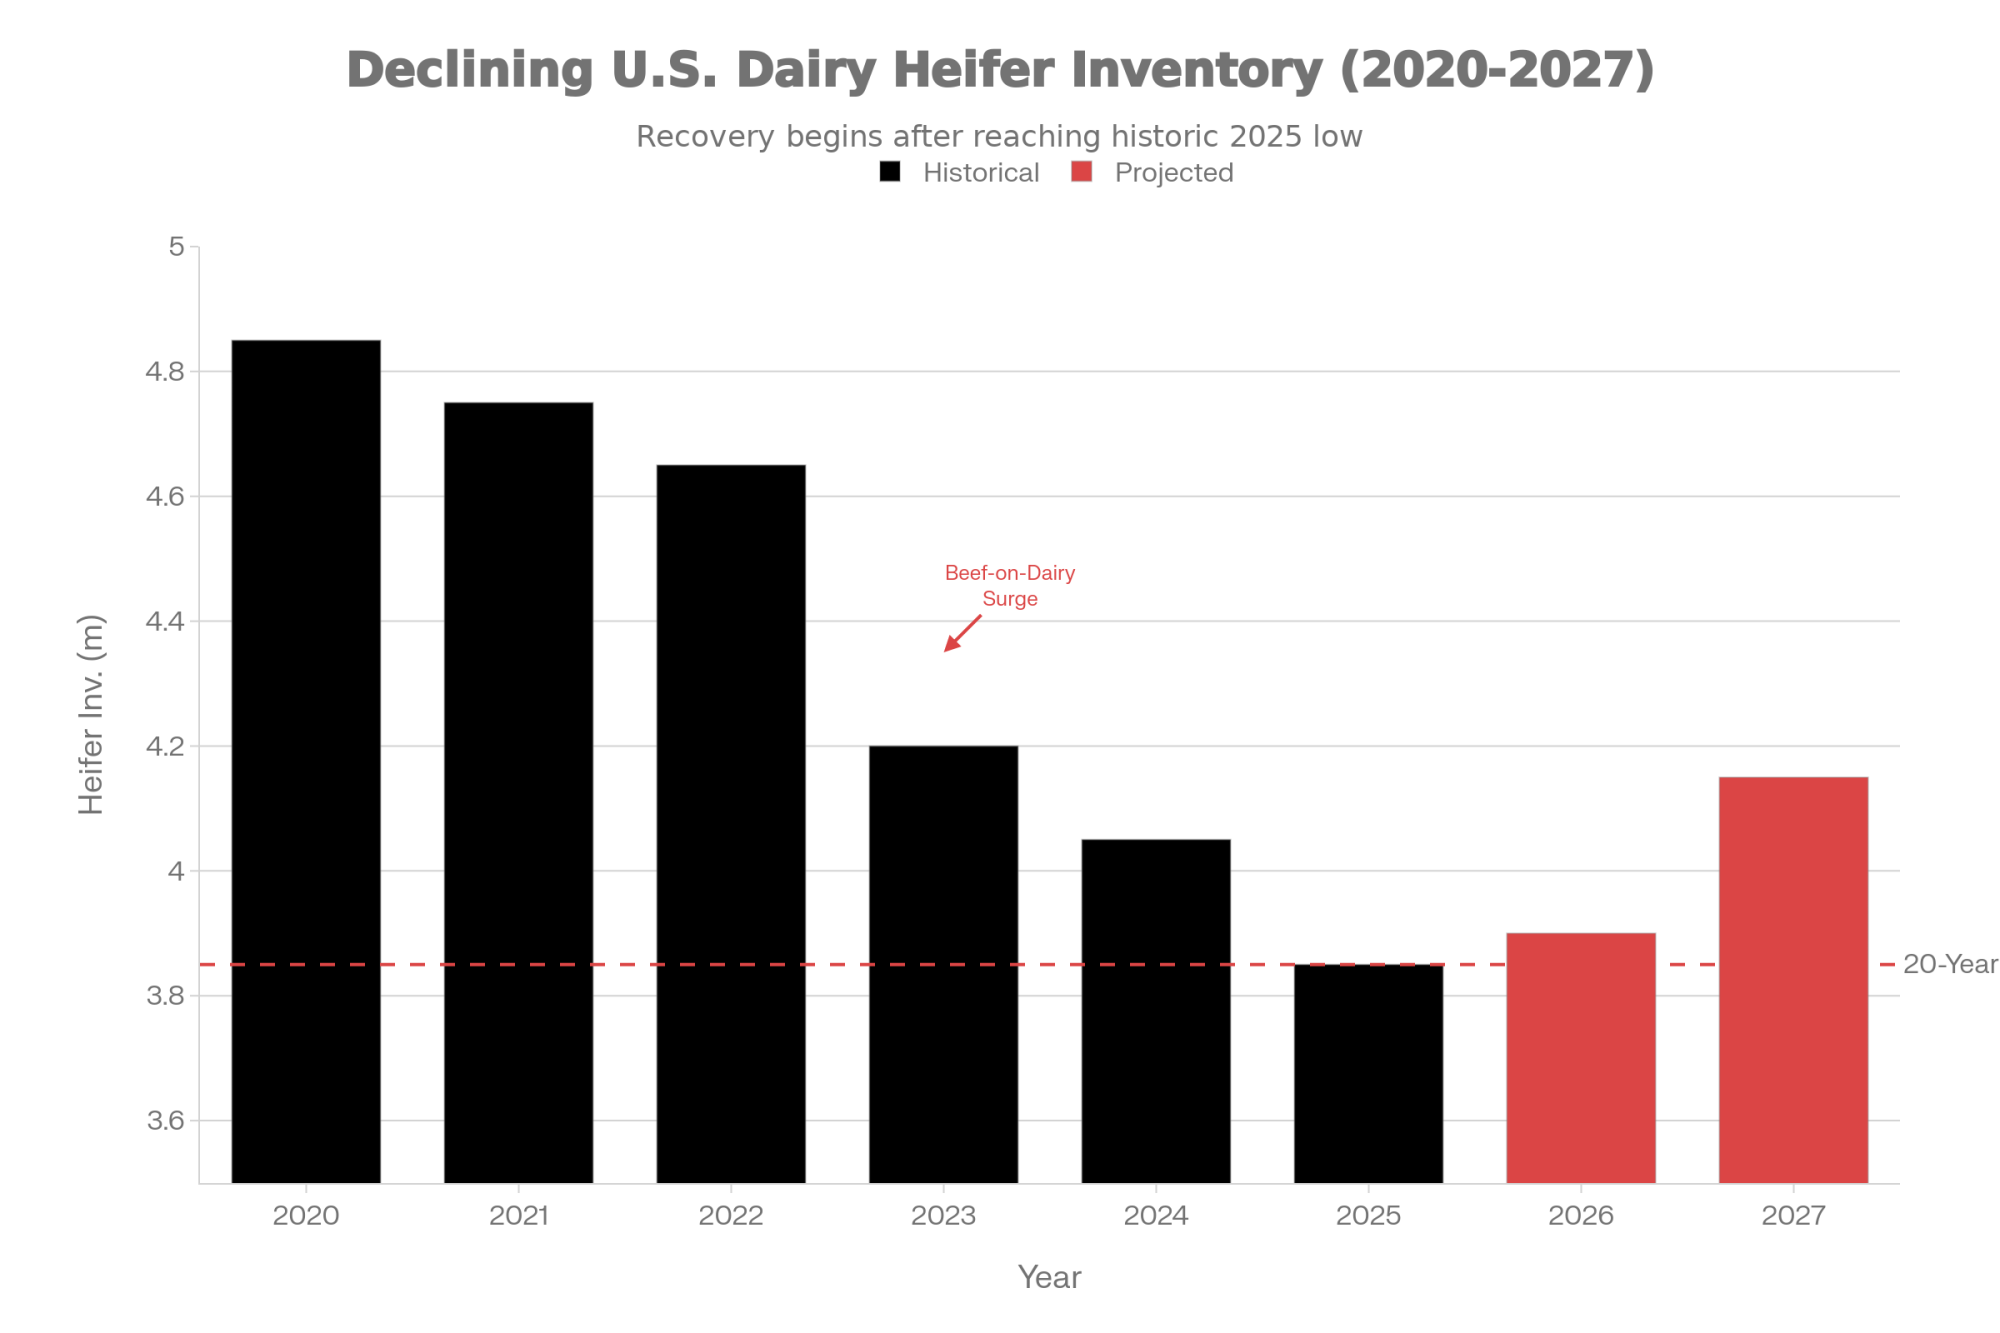
The 2025-2026 Outlook Gets Tighter

And here’s what makes this particularly concerning: CoBank’s agricultural economists—folks who study dairy markets for a living—are projecting that the heifer pipeline will continue to drop through 2025 before we see any meaningful recovery. They’re not expecting things to turn around until late 2026 or even 2027.

When the January 2025 inventory numbers come out in a few weeks, most industry watchers I talk to expect to see that replacement heifer number down even further from where we were in 2024.

Where That Production Growth Really Came From

This brings us back to those encouraging production numbers, and I think it’s worth looking at what’s actually driving them. Because if the replacement heifer supply is this constrained, how are we still seeing production gains?

The answer—and you’ve probably noticed this on your own operation—is that we’re keeping older cows in production longer than we normally would. A lot longer, in some cases.

Delayed Culling: Borrowing From Tomorrow’s Herd Health

USDA’s data through 2024 shows dairy producers culled significantly fewer cows compared to 2023—we’re talking hundreds of thousands fewer culls across the industry. These are animals that, under normal circumstances, with adequate replacement availability, would’ve been sold or culled due to age, declining production, or health challenges. Instead, they’re staying in the barn because we simply don’t have enough young, high-producing replacements to take their place.

Dr. Marin Bozic—he’s a dairy economist many of you probably know from his market analysis work—has pointed out in his reports that this strategy has a definite shelf life. You can delay culling for a period, especially when milk prices justify keeping lower-producing cows. But eventually, and we’re seeing this now in some herds, the biological realities catch up. Older cows are more likely to develop metabolic disease, mastitis, and reproductive failure. Your herd’s overall efficiency starts degrading, and those production gains you achieved by maintaining more cows start reversing on you.

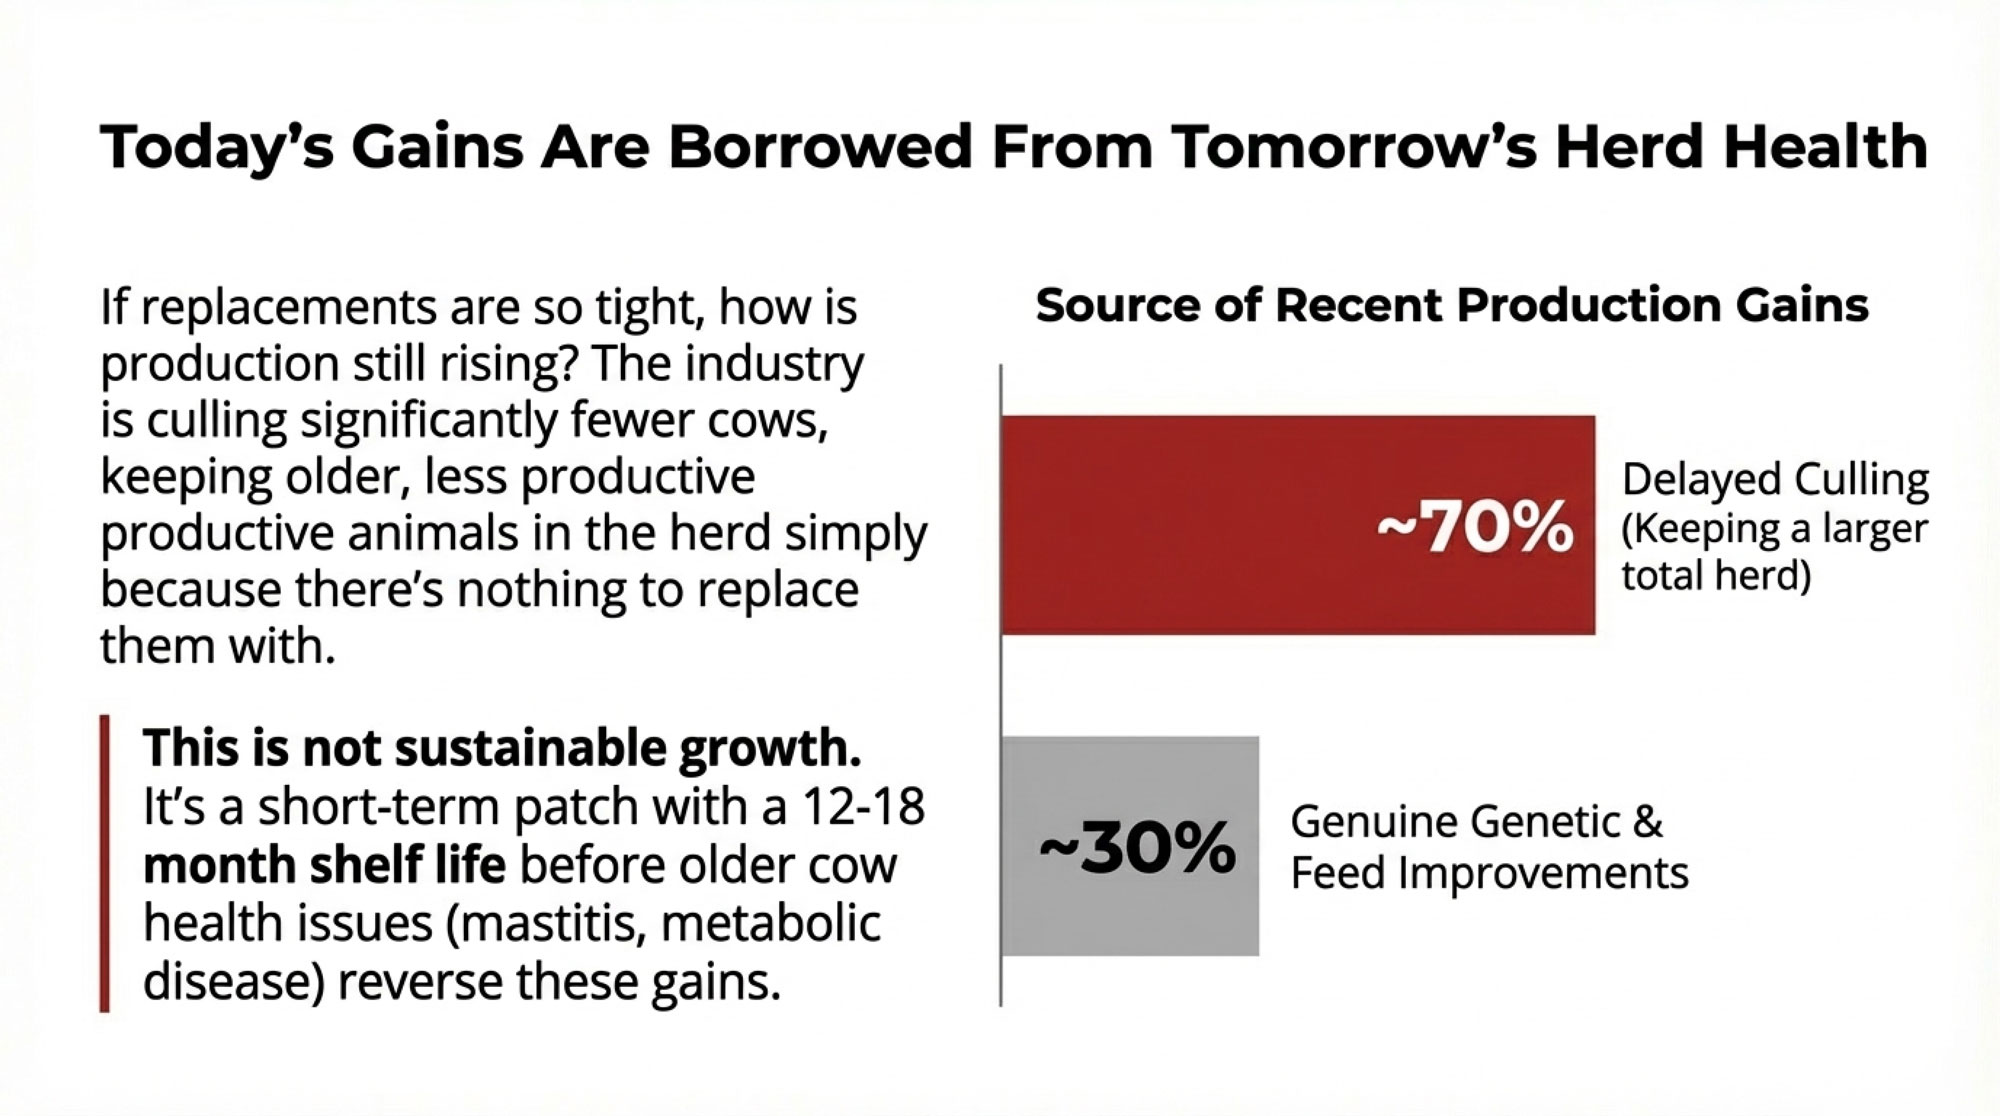
Production Gain Breakdown (Industry Analysis):

  • Economists estimate ~30% from genuine improvements (better component genetics, genomic selection, improved feed efficiency)
  • ~70% from delayed culling (maintaining larger total cow inventory by extending productive lives)

And that’s not sustainable growth. That’s borrowing from tomorrow’s herd health to hit today’s production targets.

How We Got Here: The Beef-on-Dairy Decision

The heifer shortage we’re dealing with now didn’t just appear out of nowhere. It’s the direct consequence of the breeding decisions most of us made two to three years ago—decisions that made perfect economic sense at the time but created the industry-wide squeeze we’re feeling now.

When the Math Favored Beef Genetics

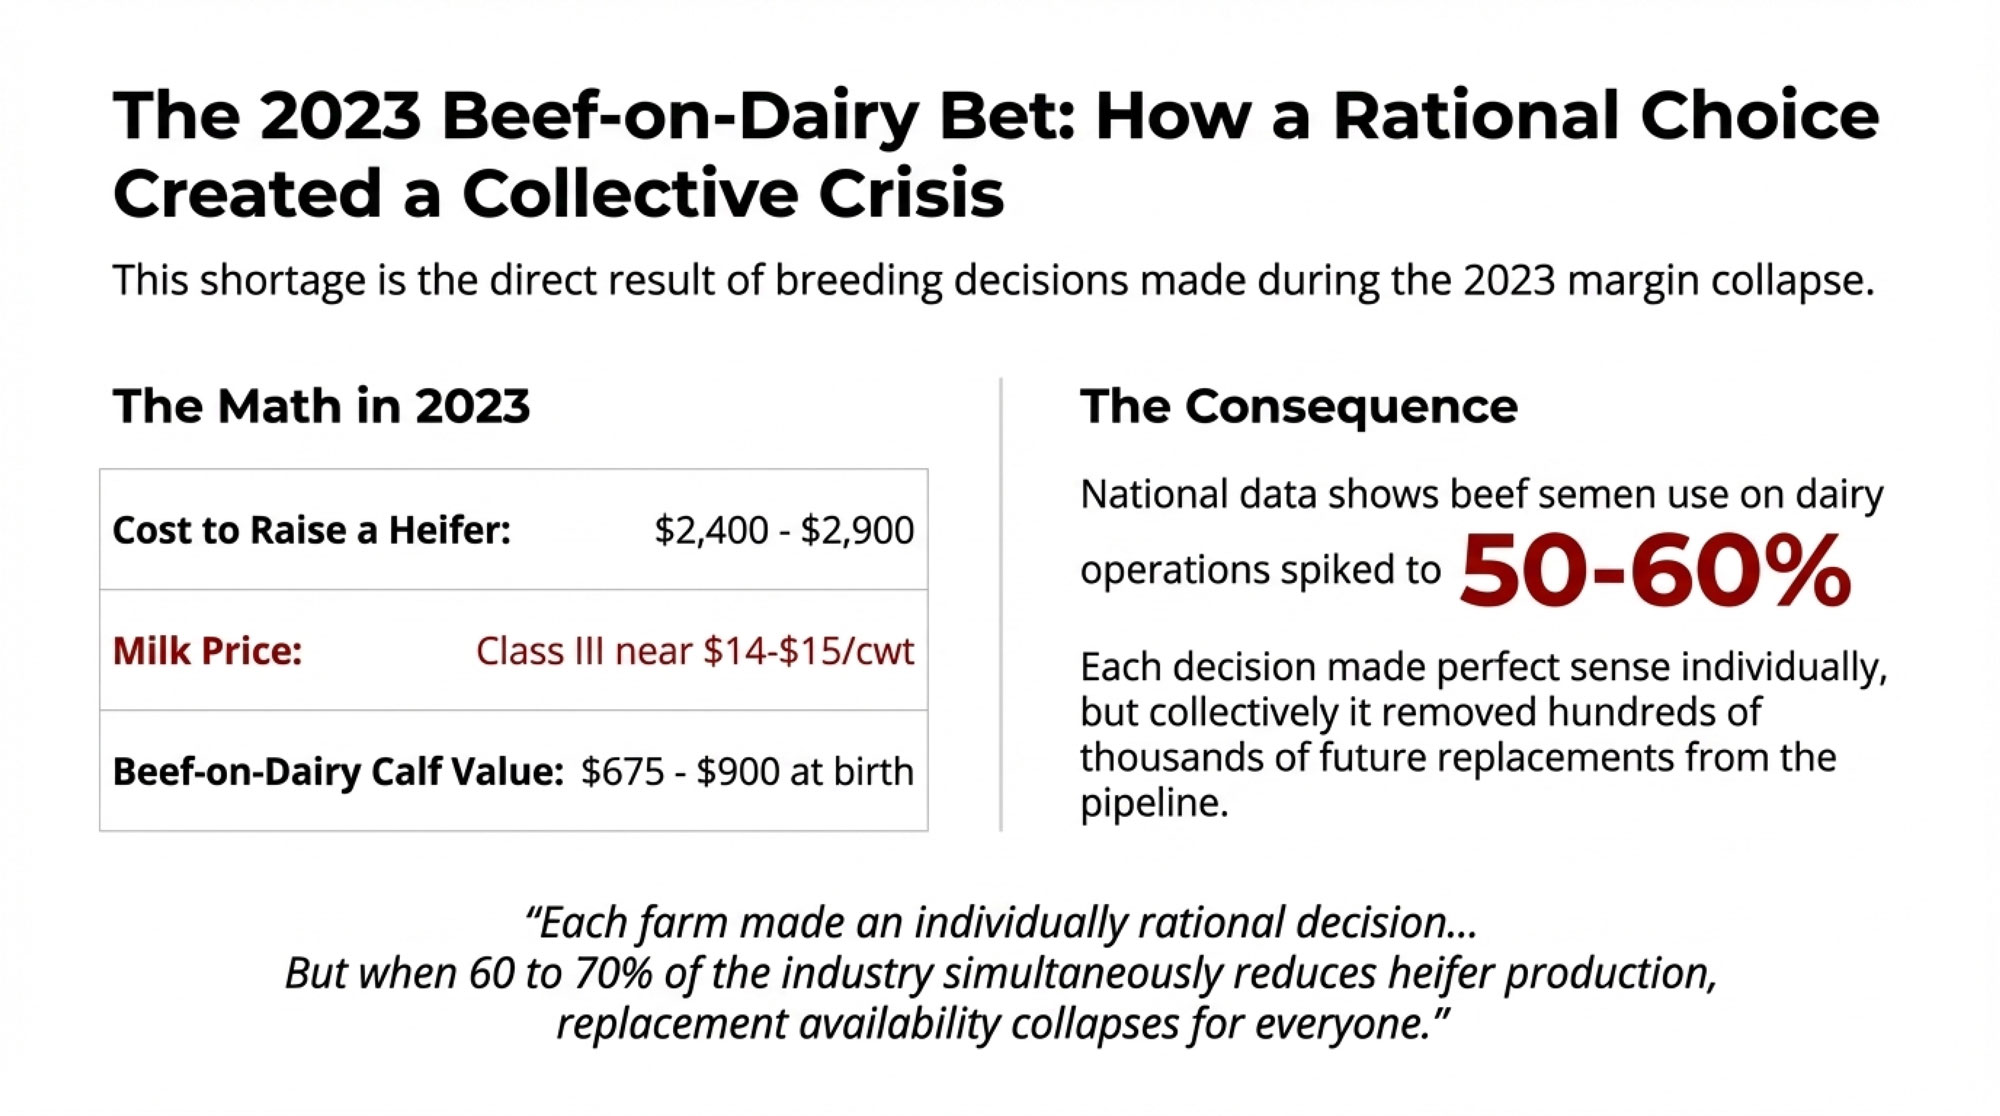
Do you remember where milk prices were in 2023? I mean, Class III hit lows near $14 to $15 per hundredweight in some months. Absolutely catastrophic margins for most operations. And at the same time, you’re looking at $2,400 to $2,900 to raise a replacement heifer from birth to first calving—that’s what the university budgets were showing. Penn State’s numbers, Wisconsin’s enterprise budgets, they all penciled out in that range.
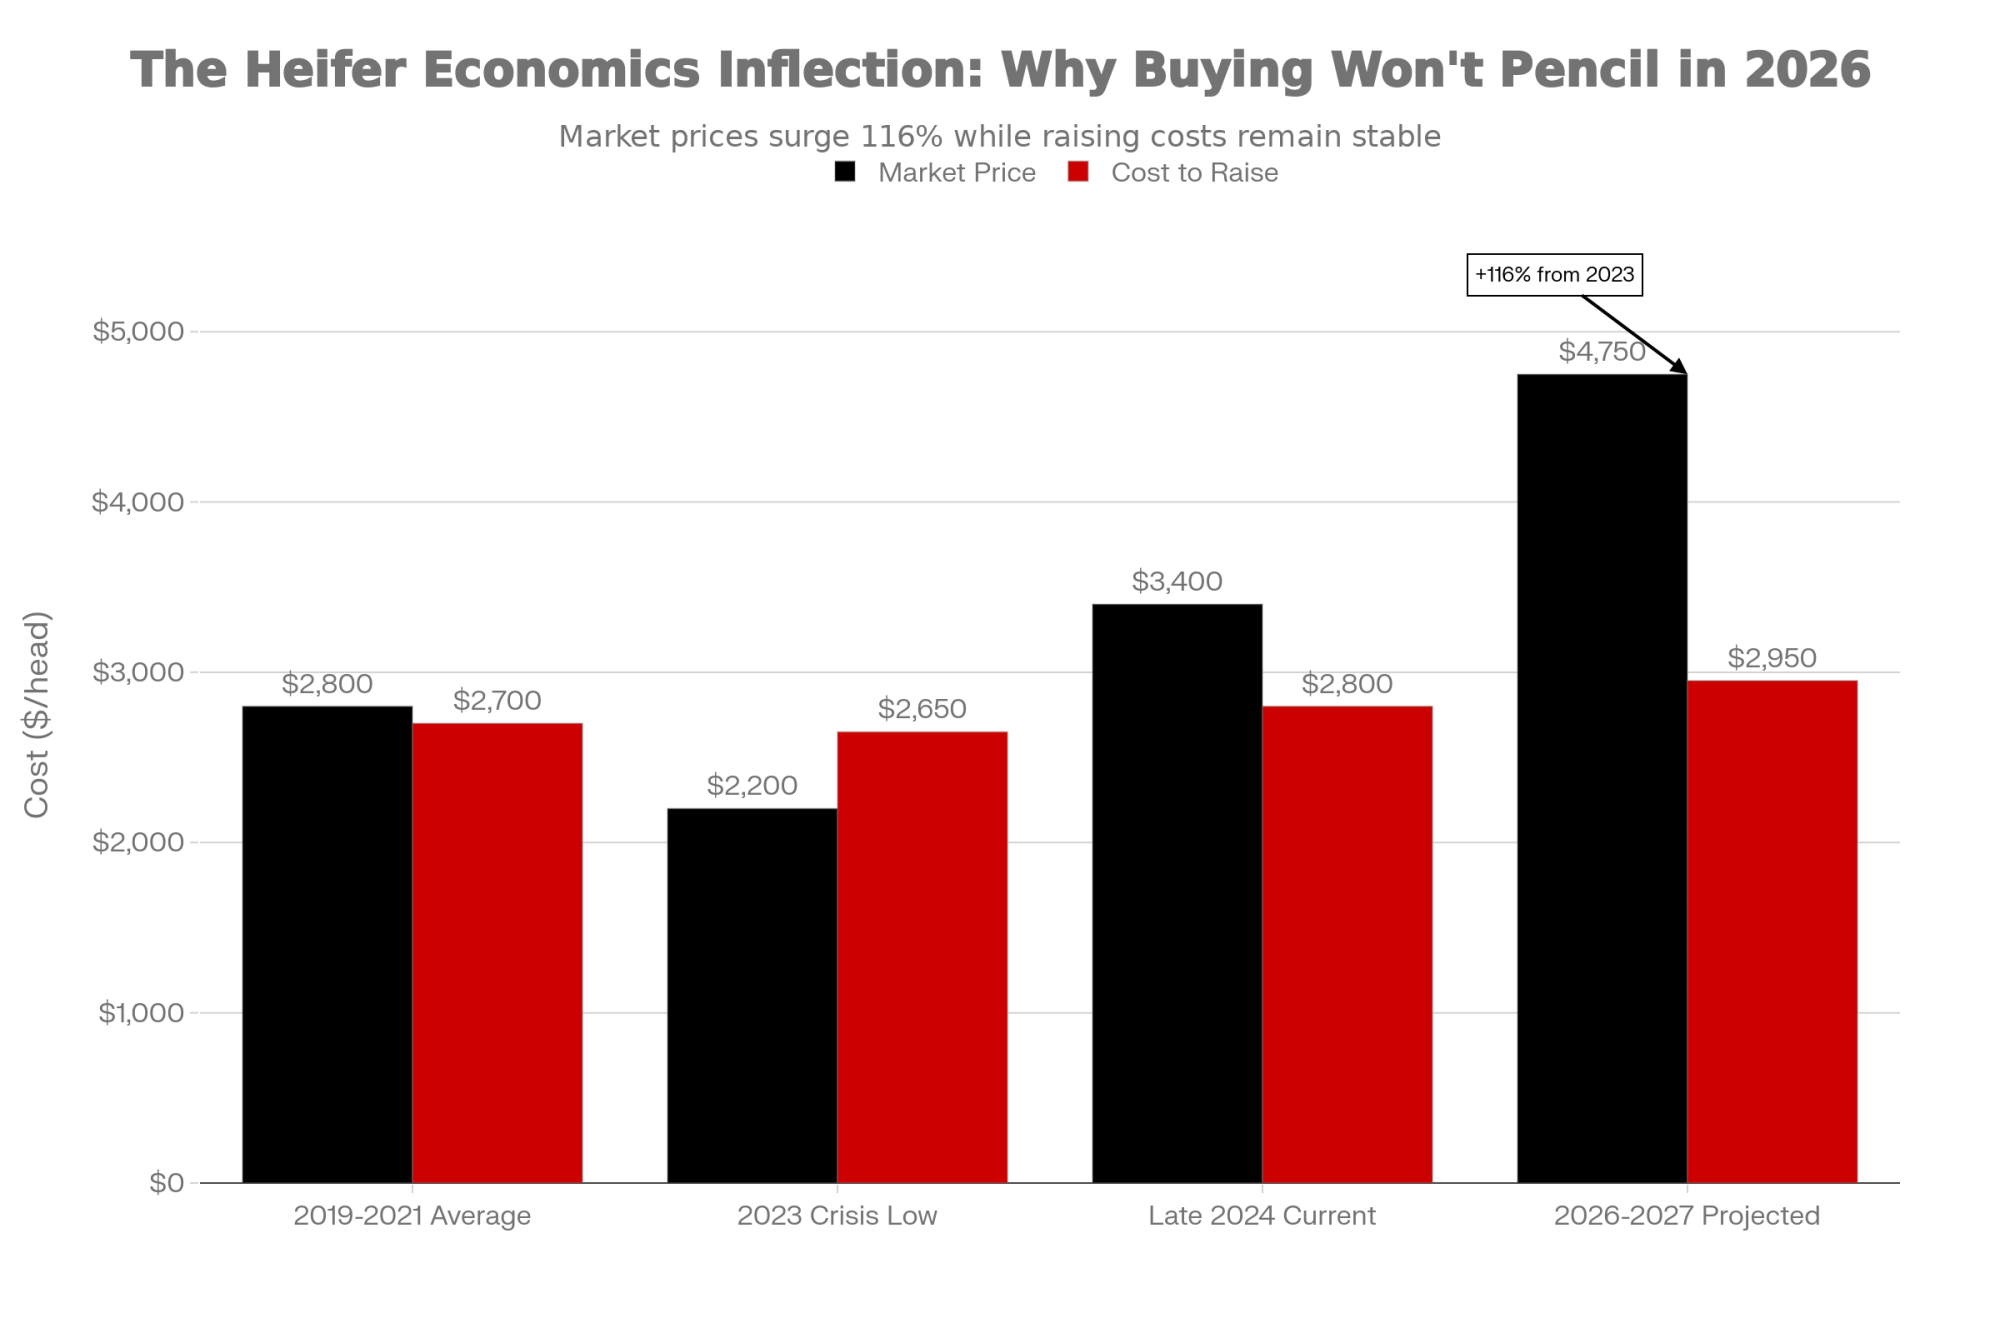
Economic Factor2023 Crisis PeriodLate 2024 Current2026-2027 Projected
Beef-Dairy Calf Sale Value$675-900 per calf$725-950 per calf$800-1,100 per calf
Dairy Heifer Replacement Cost (2023)$2,000-2,500 (buying cheaper)
Dairy Heifer Replacement Cost (2024)$2,800-4,000 (buying costly)$4,500-5,000 (prohibitive)
Cost to Raise Own Heifer$2,400-2,650$2,700-2,900$2,850-3,100
Annual Calf Revenue (500 cows, 75% beef)$160K-180K$165K-195K$180K-220K

Meanwhile, beef-on-dairy breeding was offering an attractive alternative that a lot of us took advantage of:

  • Breed lower-ranking dairy cows to beef semen
  • Sell calves for $675 to $900 within days of birth
  • Buy replacement heifers from the market when needed at $2,000 to $2,500 (2023 pricing)

The math clearly favored beef-breeding, especially if you were watching cash flow. And it worked. Really well, actually, in the short term.

The Collective Impact Nobody Was Tracking

But here’s what happened at the industry level, and this is where nobody was really tracking the collective impact: National Association of Animal Breeders data through 2023 shows beef semen usage on dairy operations increased to somewhere around 50 to 60% of total breedings.

That’s a massive shift from historical patterns where we were breeding maybe 80 to 90% dairy genetics. Each one of those breeding decisions—multiply it across thousands of farms all making similar calls—meant one fewer potential replacement heifer entering the pipeline 30 months later.

“Each farm made an individually rational decision based on their economics. But when 60 to 70% of the industry simultaneously reduces heifer production, replacement availability collapses for everyone.”

The cumulative effect is what we’re seeing now. Hundreds of thousands of additional beef-on-dairy calves were produced compared to historical patterns. Those are animals that would’ve been dairy replacements, now permanently out of our genetic pipeline.

And what’s interesting—Penn State Extension folks have pointed this out in their recent analyses—is that this represents what economists call a tragedy of the commons. Each farm made an individually rational decision based on their economics. But when 60 to 70% of the industry simultaneously reduces heifer production, replacement availability collapses for everyone. Including the farms that kept breeding dairy genetics through the tight times.

The Regional Story: Why Some Areas Kept Breeding Dairy

Not everyone followed the beef-on-dairy path, though, and the regional variation tells you a lot about the structural factors at play here.

USDA’s state-level data shows Pennsylvania maintained or slightly increased replacement heifer inventory through 2024, while most of the country was reducing numbers. Wisconsin held relatively stable. Meanwhile, the big Western dairies in California, Texas, and Idaho saw significant heifer reductions.

Scale Makes the Difference

I’ve been talking with lenders, extension specialists, and economists across different regions, trying to understand what explains this split, and a few things have become pretty clear.

Farm scale makes a real difference. Pennsylvania’s dairy sector—according to their Center for Dairy Excellence reports—averages around 90 to 100 cows per farm. Compare that to the national average, which is pushing 350 to 380 cows.

Capital Requirements by Herd Size:

  • 95-cow operation: $67,000 to $81,000 annually for heifer raising (manageable with multi-generational equity)
  • 500-cow operation: $360,000 to $435,000 annually for adequate replacement raising (became nearly impossible during the 2023 margin collapse)

The Pasture Advantage

Geography matters, too, and folks sometimes overlook this. Regions with established pasture systems—Pennsylvania, upstate New York, parts of Wisconsin—have what turns out to be a substantial cost advantage for heifer raising.

Heifer Raising Cost Comparison:

  • Pasture-based systems: ~$1,336 per head
  • Confinement systems: ~$1,919 per head
  • Cost advantage: 43% difference driven by reduced feed costs, lower facility investment, and less labor intensity

Source: Penn State Extension, University of Wisconsin, Cornell dairy management research

So Pennsylvania farmers could raise their own replacements for less than market purchase prices even when beef-breeding looked economically superior to everyone else. The pasture advantage is structural—it doesn’t go away when milk prices improve.

Custom Heifer Raising Infrastructure

Pennsylvania and Wisconsin also developed something most other regions just don’t have: sophisticated custom heifer-raising operations. These are specialized businesses that contract with dairy farmers to raise heifers through the non-productive phase. When cash got tight in 2023, being able to contract out heifer raising at $1,900 to $2,100 per animal provided flexibility that regions without this infrastructure simply couldn’t access.

Here’s an important point the Wisconsin specialists emphasize: this wasn’t necessarily Pennsylvania farmers being smarter or more strategic than everyone else. They had structural advantages—lower scale requirements, existing pasture systems, access to custom raising—that made maintaining dairy breeding economically feasible when others couldn’t justify it.

Region/SystemCost per HeadPrimary Cost DriverHeifer Inventory Trend (2023-24)
Pennsylvania (Pasture)$1,336Low feed costsStable/Up
Wisconsin (Pasture)$1,425Pasture + custom raisingStable
Midwest (Confinement)$1,850Facility investmentDown 8-12%
Western US (Confinement)$1,919Labor + facility costsDown 15-18%
Texas/Southwest (Confinement)$1,975Heat stress + facilityDown 12-15%

The Component Gains: Real Progress on a Narrowing Base

Those component numbers from USDA through 2024 deserve a closer look, especially given what’s happening with the genetic foundation underlying them.

The Impressive Gains Are Real

The gains are real. Absolutely real:

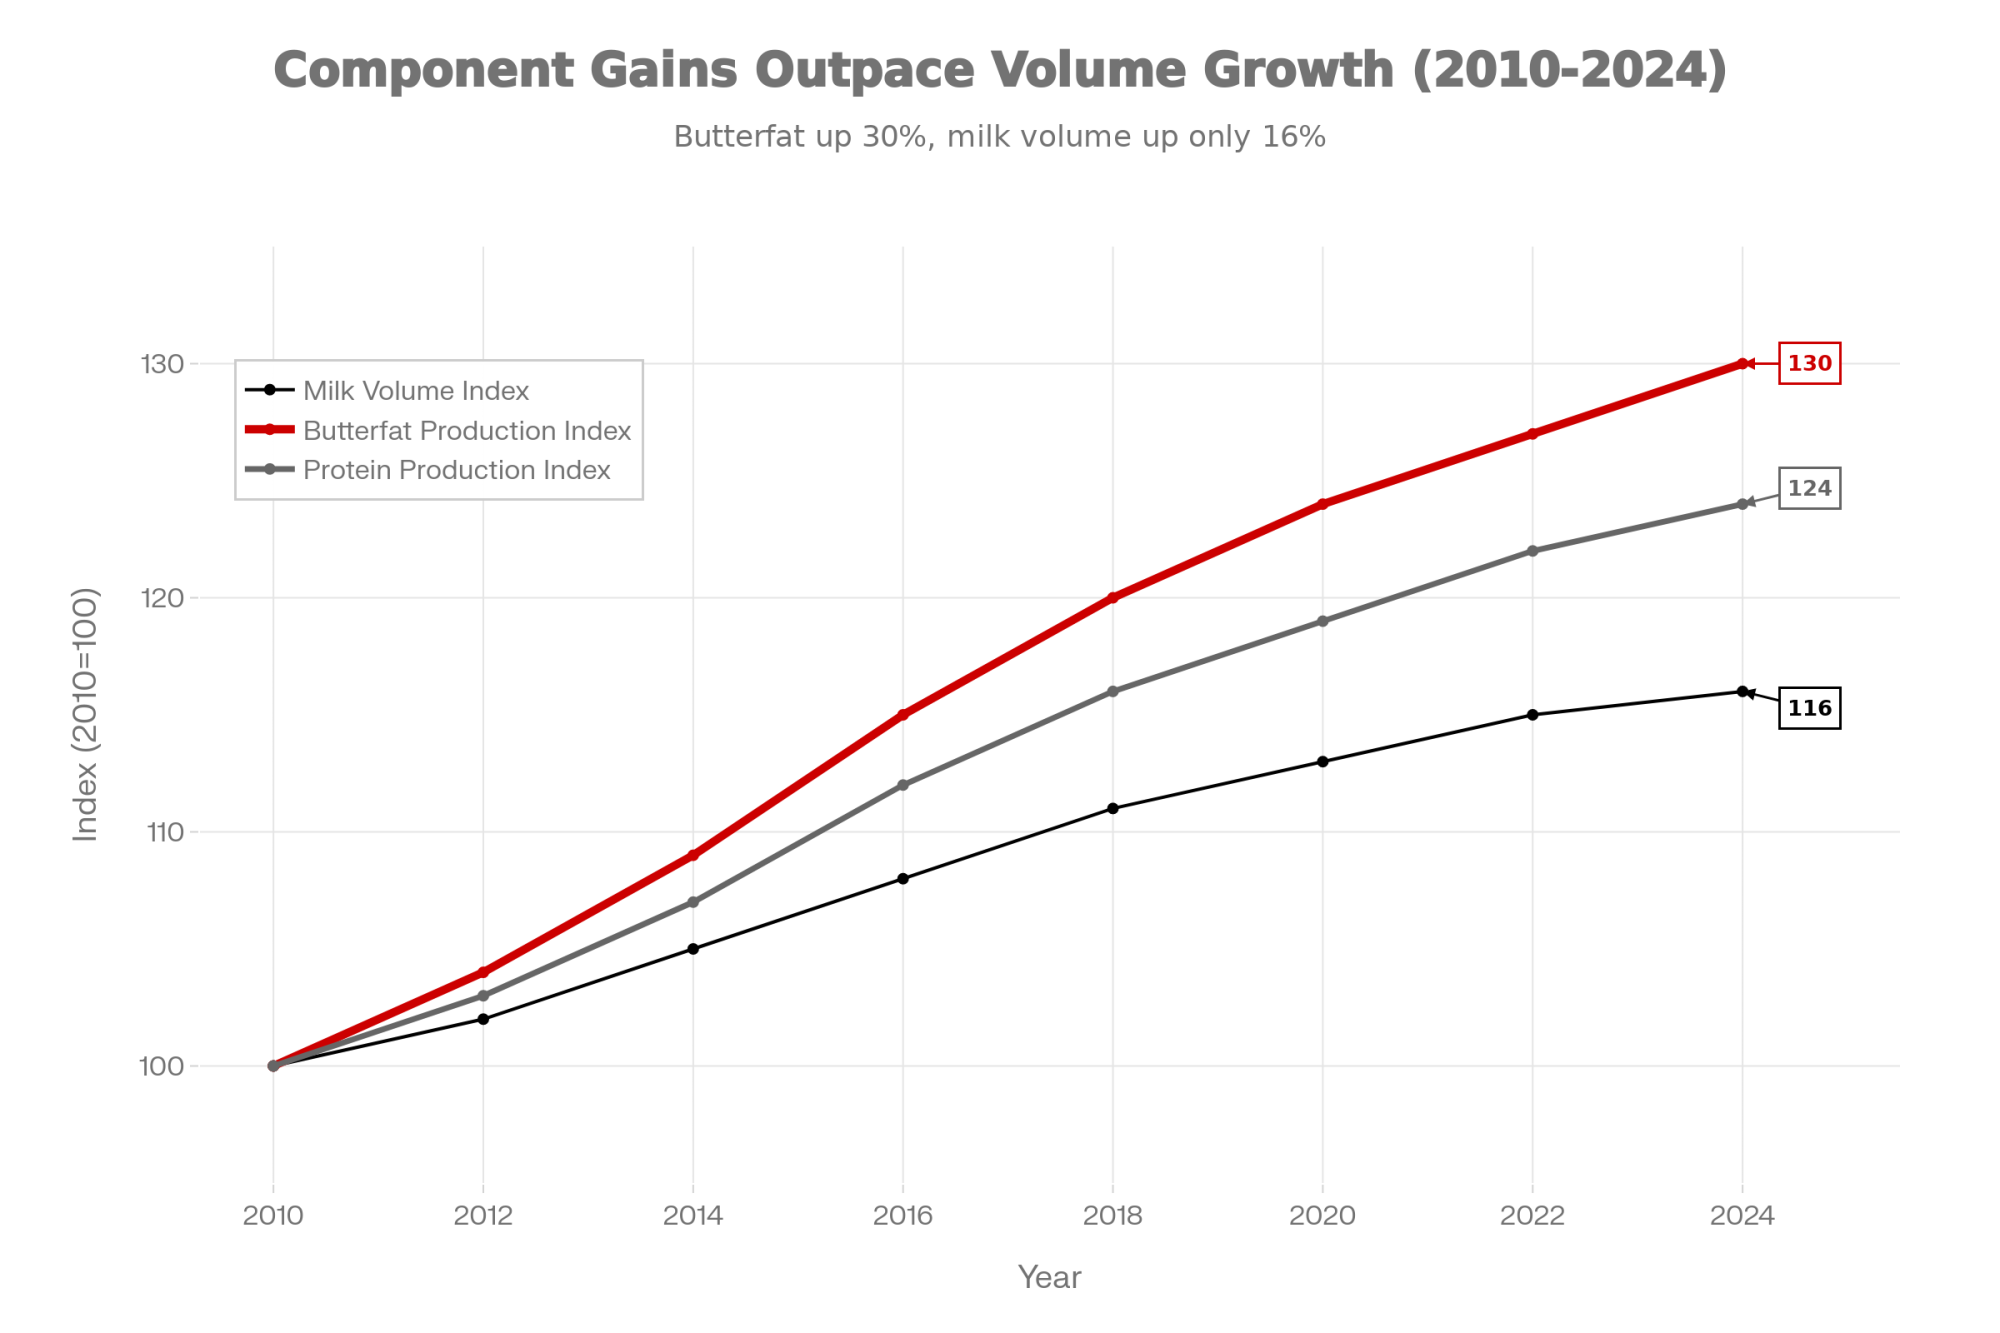
  • Butterfat production: Up ~30% since 2010 (milk volume grew only 15-16%)
  • Protein production: Up 23-24% over the same period
  • Current national averages: ~4.2% butterfat, ~3.3% protein (both record territory)

The Council on Dairy Cattle Breeding’s 2024 genetic evaluations show substantial base changes in butterfat in Holsteins compared to just five years ago. This represents genuine genetic progress driven by genomic selection, improved breeding strategies, and the industry’s intense focus on component traits.

And that focus makes economic sense—Multiple Component Pricing puts roughly 90% of your milk check value on butterfat and protein rather than volume.

But the Genetic Base Is Narrowing

But here’s what concerns the geneticists when you talk to them about long-term sustainability: the genetic base enabling this progress is simultaneously contracting because of those beef-on-dairy breeding patterns we just discussed.

When 50 to 60% of your dairy breedings are going to beef genetics, you’re systematically removing potential dairy females from the breeding population. Those aren’t just your bottom-tier animals, either. They’re your “genetically lower-ranking” cows within each herd, sure, but they’re still above-average dairy cattle compared to historical standards.

Dr. Kent Weigel at Wisconsin—he’s published extensively on breeding strategies over the years—has noted in his research that maintaining genetic diversity while pursuing component gains requires balancing selection intensity with population size. What we’re seeing now, with maybe 30% of farms maintaining intensive dairy genetics while 70% breed primarily to beef, creates what he calls a “two-tier genetic system” that could persist for years.

“Population geneticists call this ‘peak selection intensity.’ You get temporary acceleration in the traits you’re selecting for because you’re working with a smaller, more intensely selected population. But that acceleration isn’t indefinitely sustainable.”

The Processing Side: What Happens When Plants Realize Growth Isn’t Coming

While we were all managing heifer inventories and breeding decisions based on individual farm economics, the processing sector was making massive capital commitments based on very different assumptions about future milk supply.

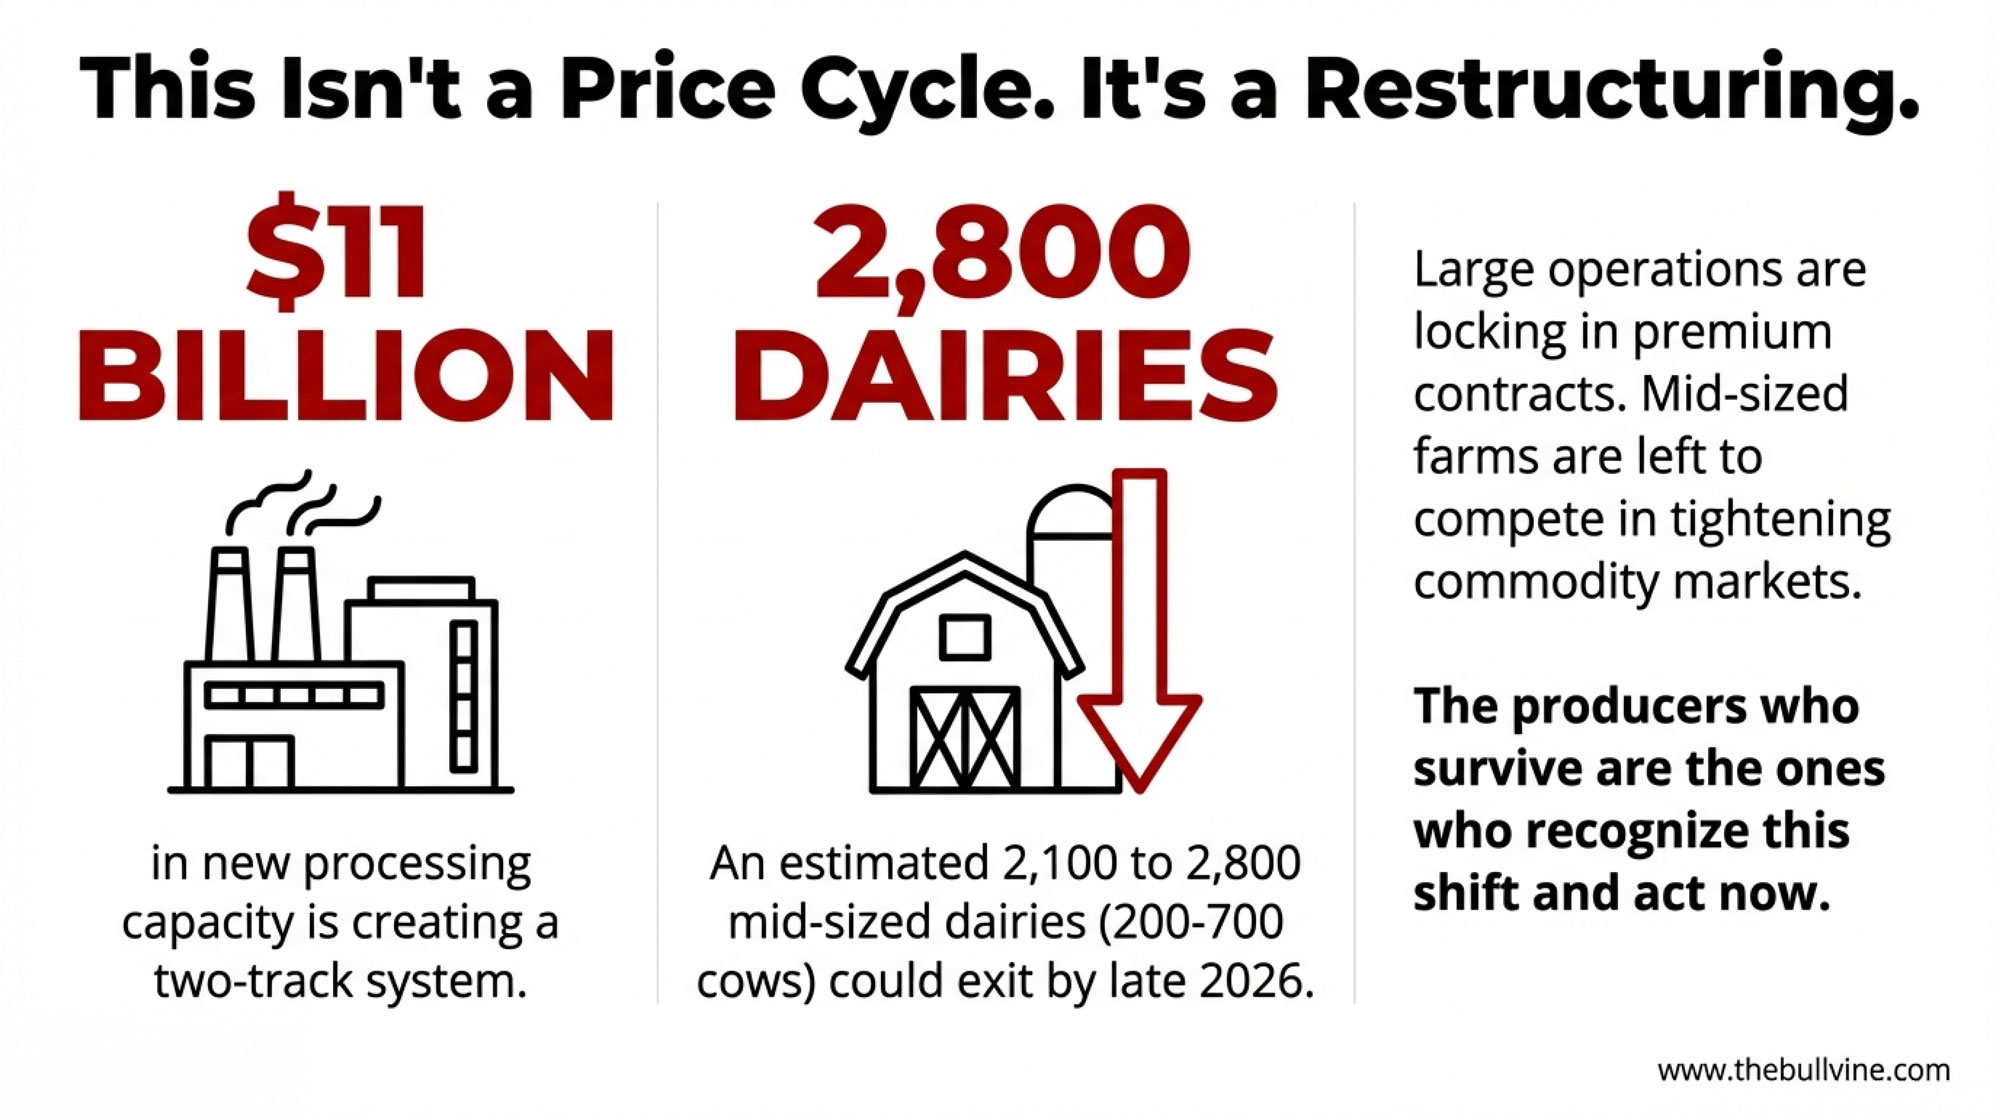
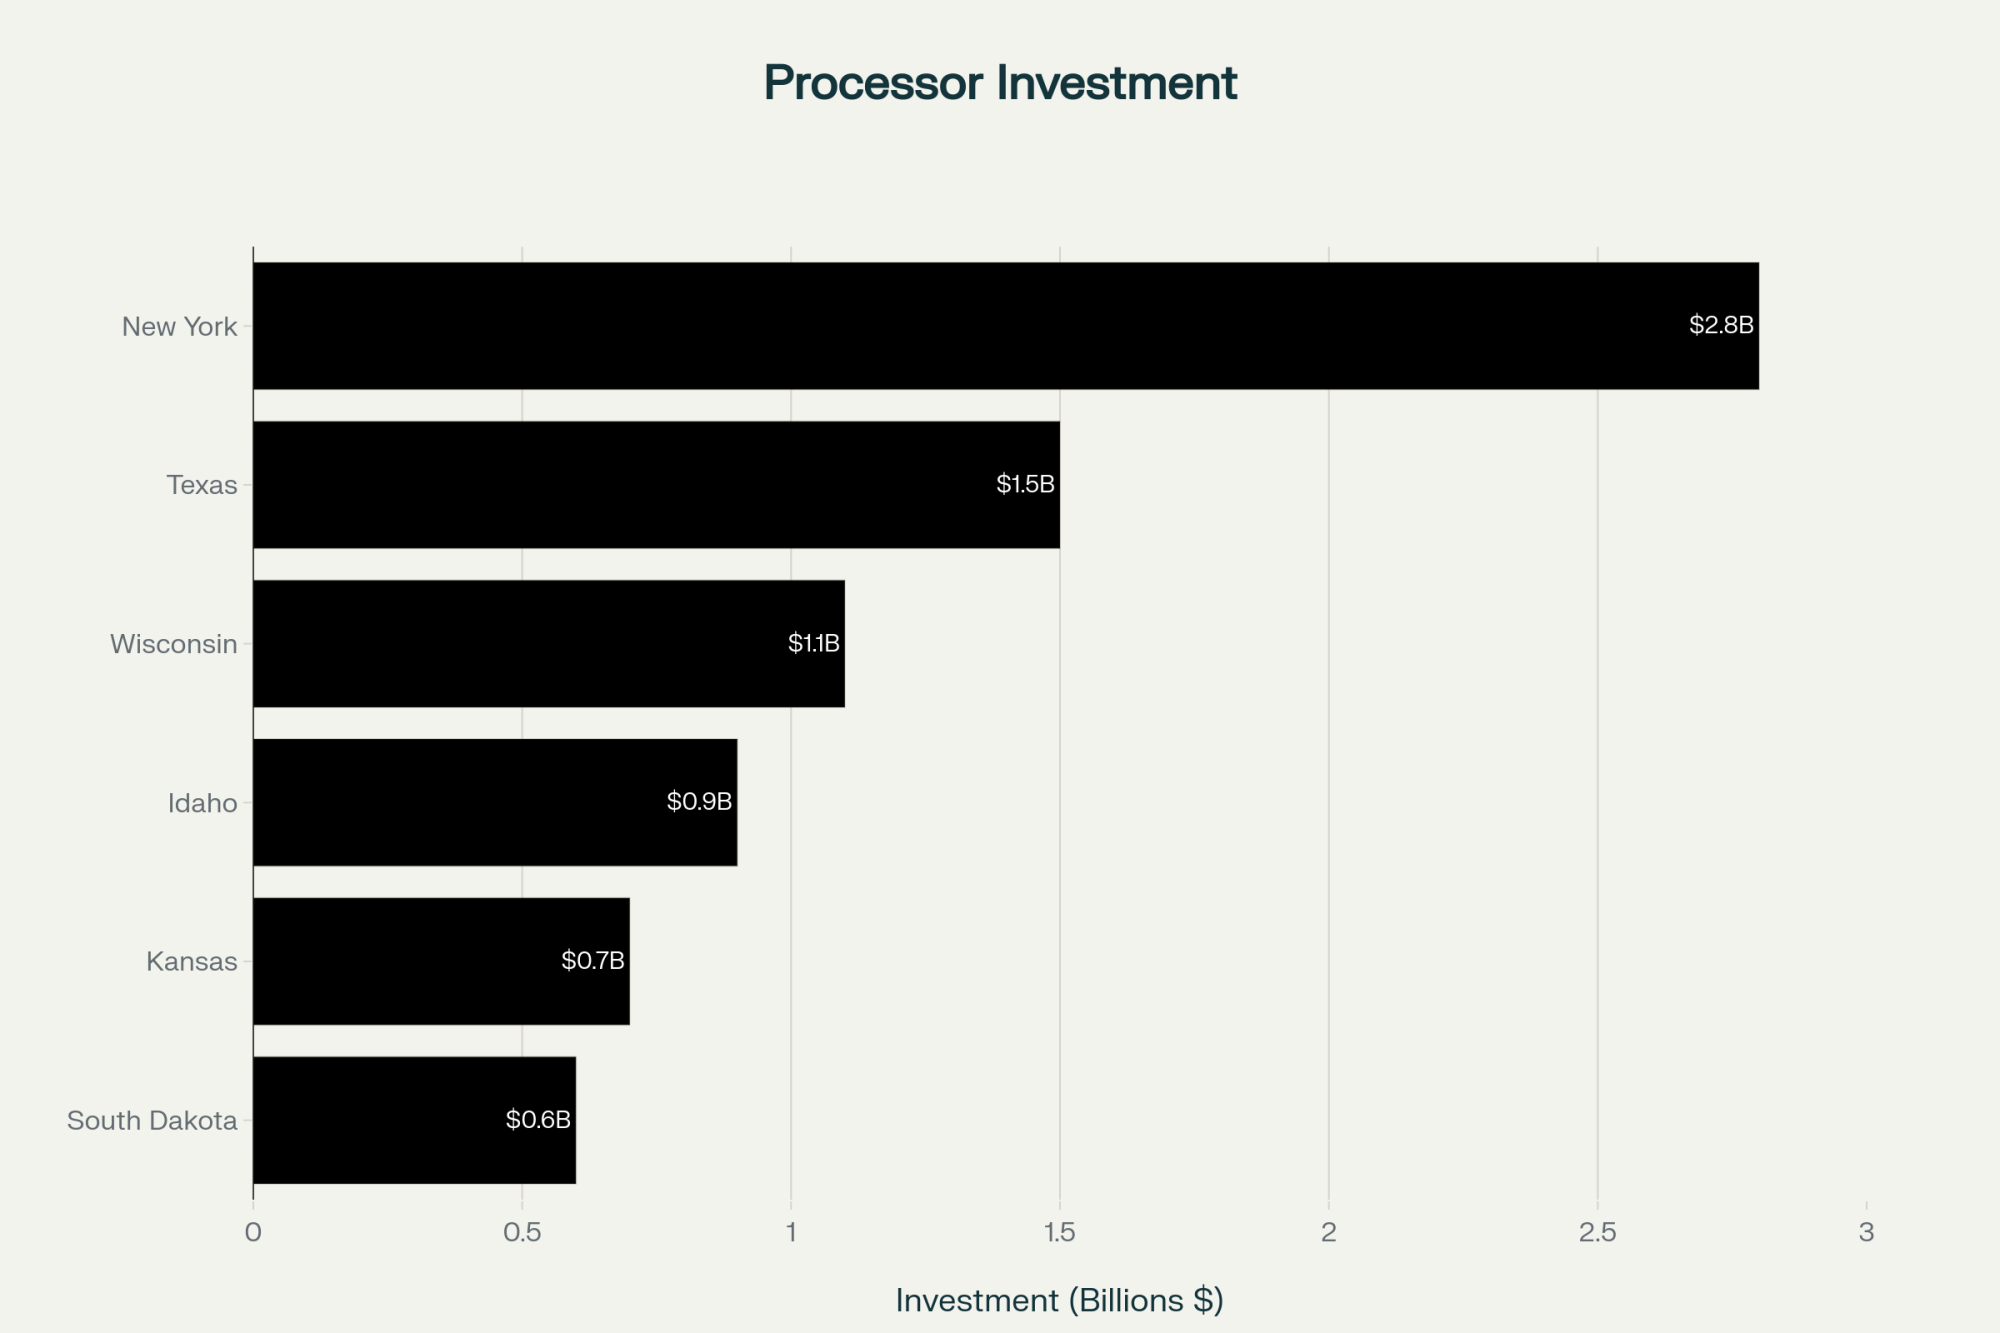
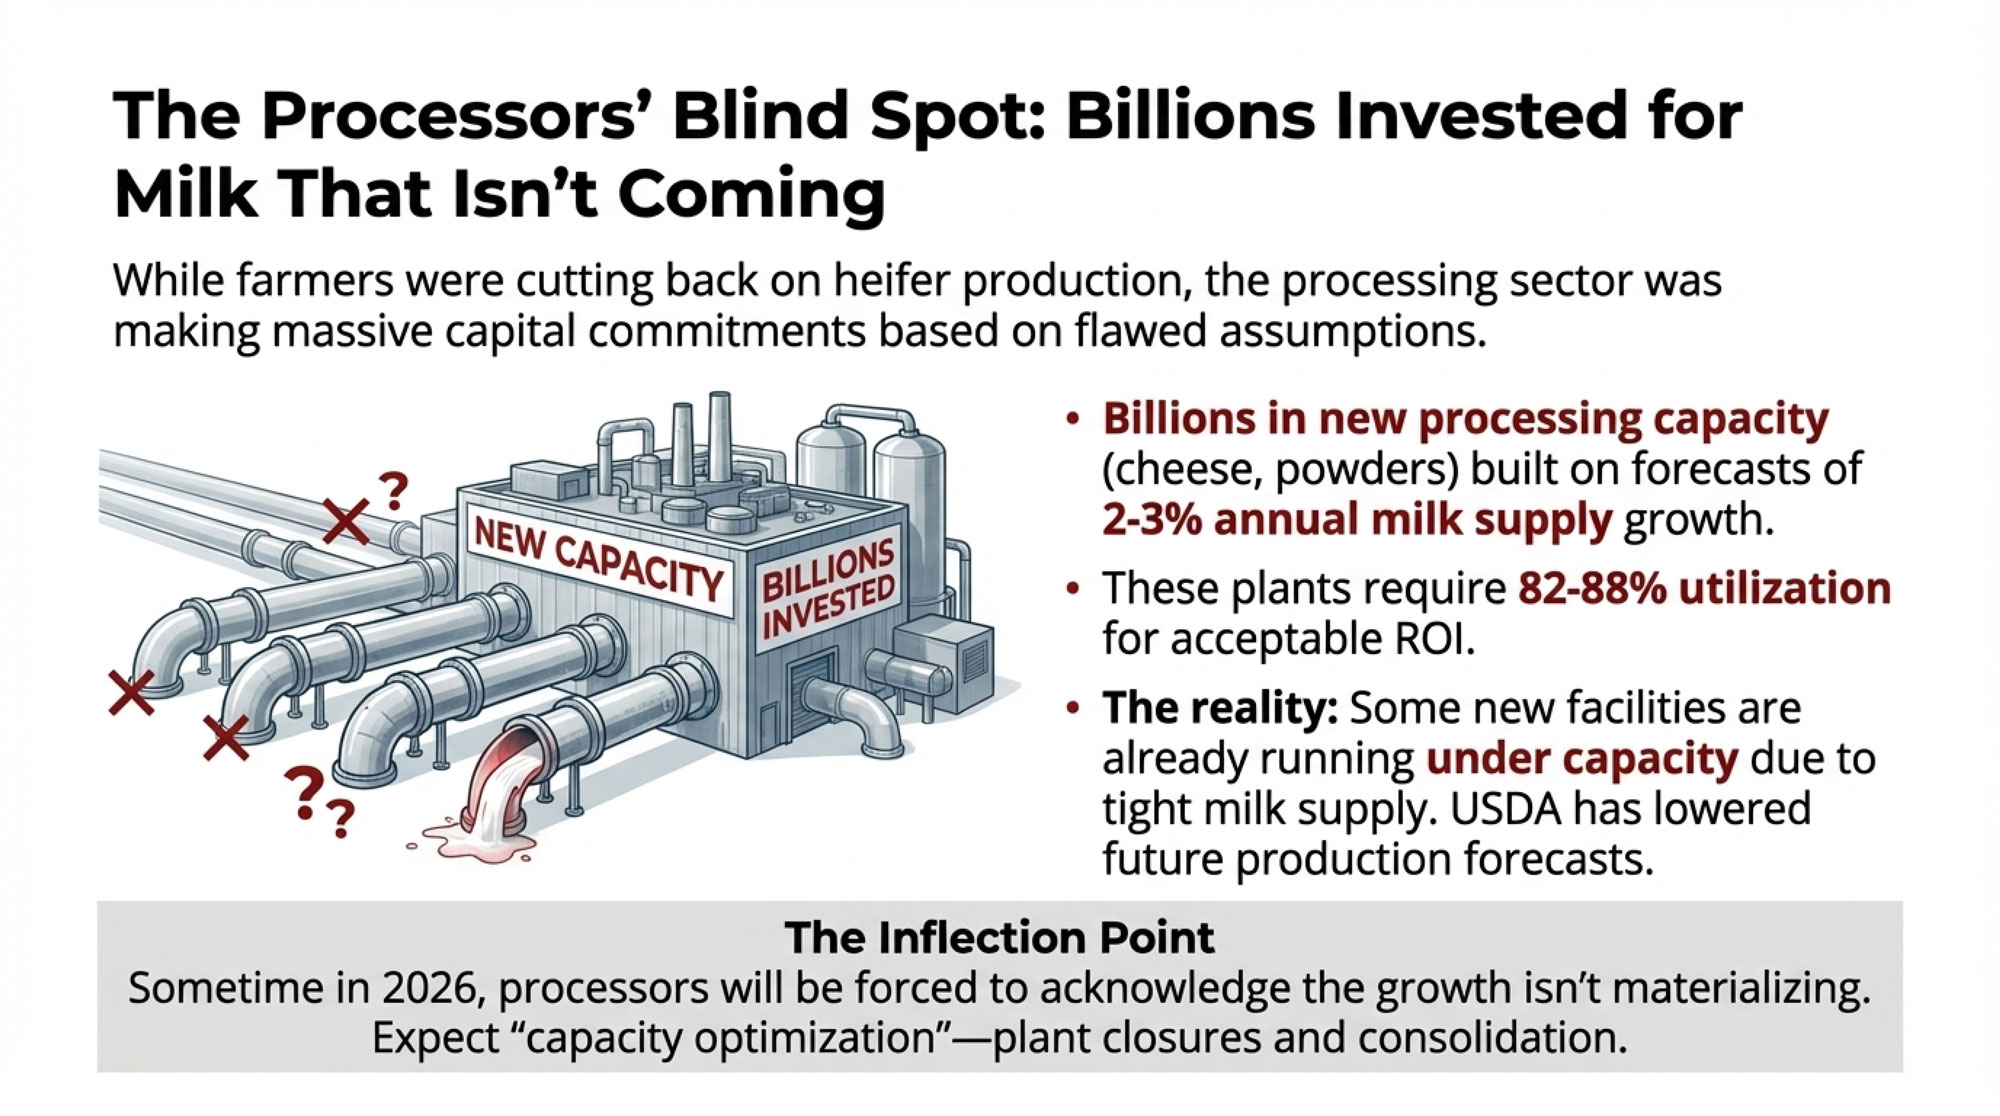
Billions Invested on 2-3% Growth Assumptions

Trade publications and industry reports through 2024 document several billion dollars in new dairy processing capacity either announced or under construction—most of it concentrated in cheese and milk powder production. You’ve got major projects in Kansas, Texas, Michigan, Wisconsin, and other core dairy regions.

These plants were financed through USDA Rural Development loans and private investment, based on forecasts of 2-3% annual growth in milk production. That’s been the historical assumption for feasibility studies.

Processing Plant Economics:

  • Required utilization: 82-88% of design capacity for acceptable ROI
  • Typical $500M cheese plant capacity: 1.8 billion pounds annually
  • Below-target utilization impact: Fixed costs spread across lower volume = compressed profitability per pound

The 2026 Inflection Point

Current reality appears to be telling a different story, though this isn’t widely published data. Industry observers watching the processing sector suggest some newer facilities are running at lower utilization rates than their models projected, constrained by available milk supply in their procurement areas.

And USDA’s most recent forecasts, released in late 2024, lowered its milk production expectations going forward despite projecting continued per-cow yield improvements. That’s essentially an admission that herd-size constraints are binding.

So what happens when processors start realizing the milk growth they financed their expansions around isn’t materializing? Industry folks watching processor earnings calls and capital markets are suggesting we might see an inflection point sometime in 2026. When you get multiple quarters showing milk production growth in the 0 to 2% range rather than the 3 to 4% that plant economics require, processor guidance is going to feature some significant adjustments.

Some analysts are already anticipating what they’re calling “capacity optimization”—industry-speak for plant closures, consolidation, and scaled-back operations.

Your Strategic Window: The Next 90 Days Matter

For producers reading these market signals, we’re looking at a compressed timeline for some critical decisions.

Why 90 Days? The Biology and the Contracts

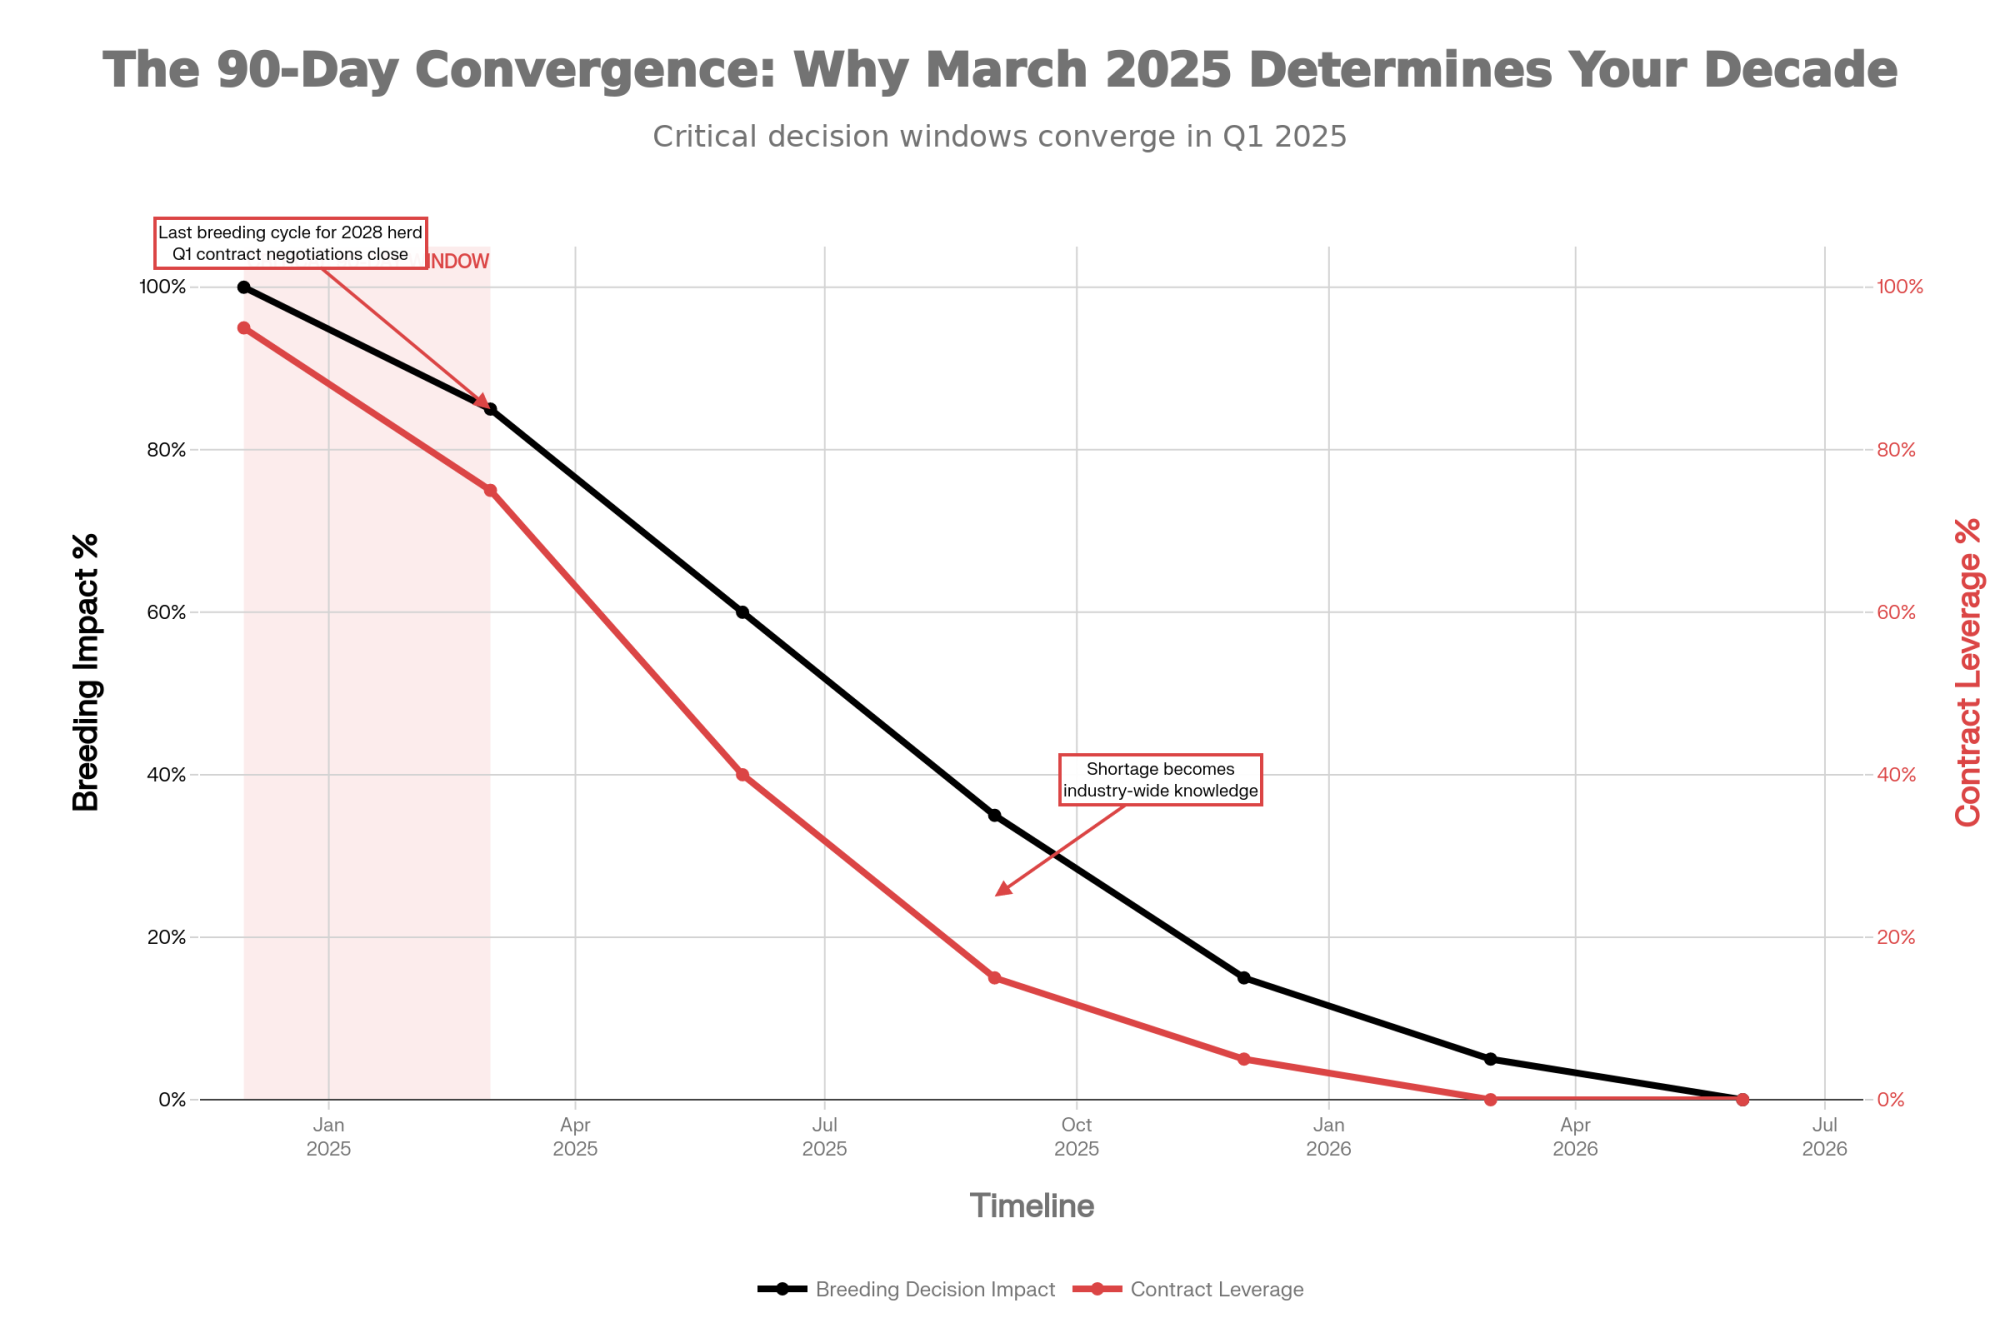
Here’s why the next 90 days—roughly late December 2024 through March 2025—are so critical:

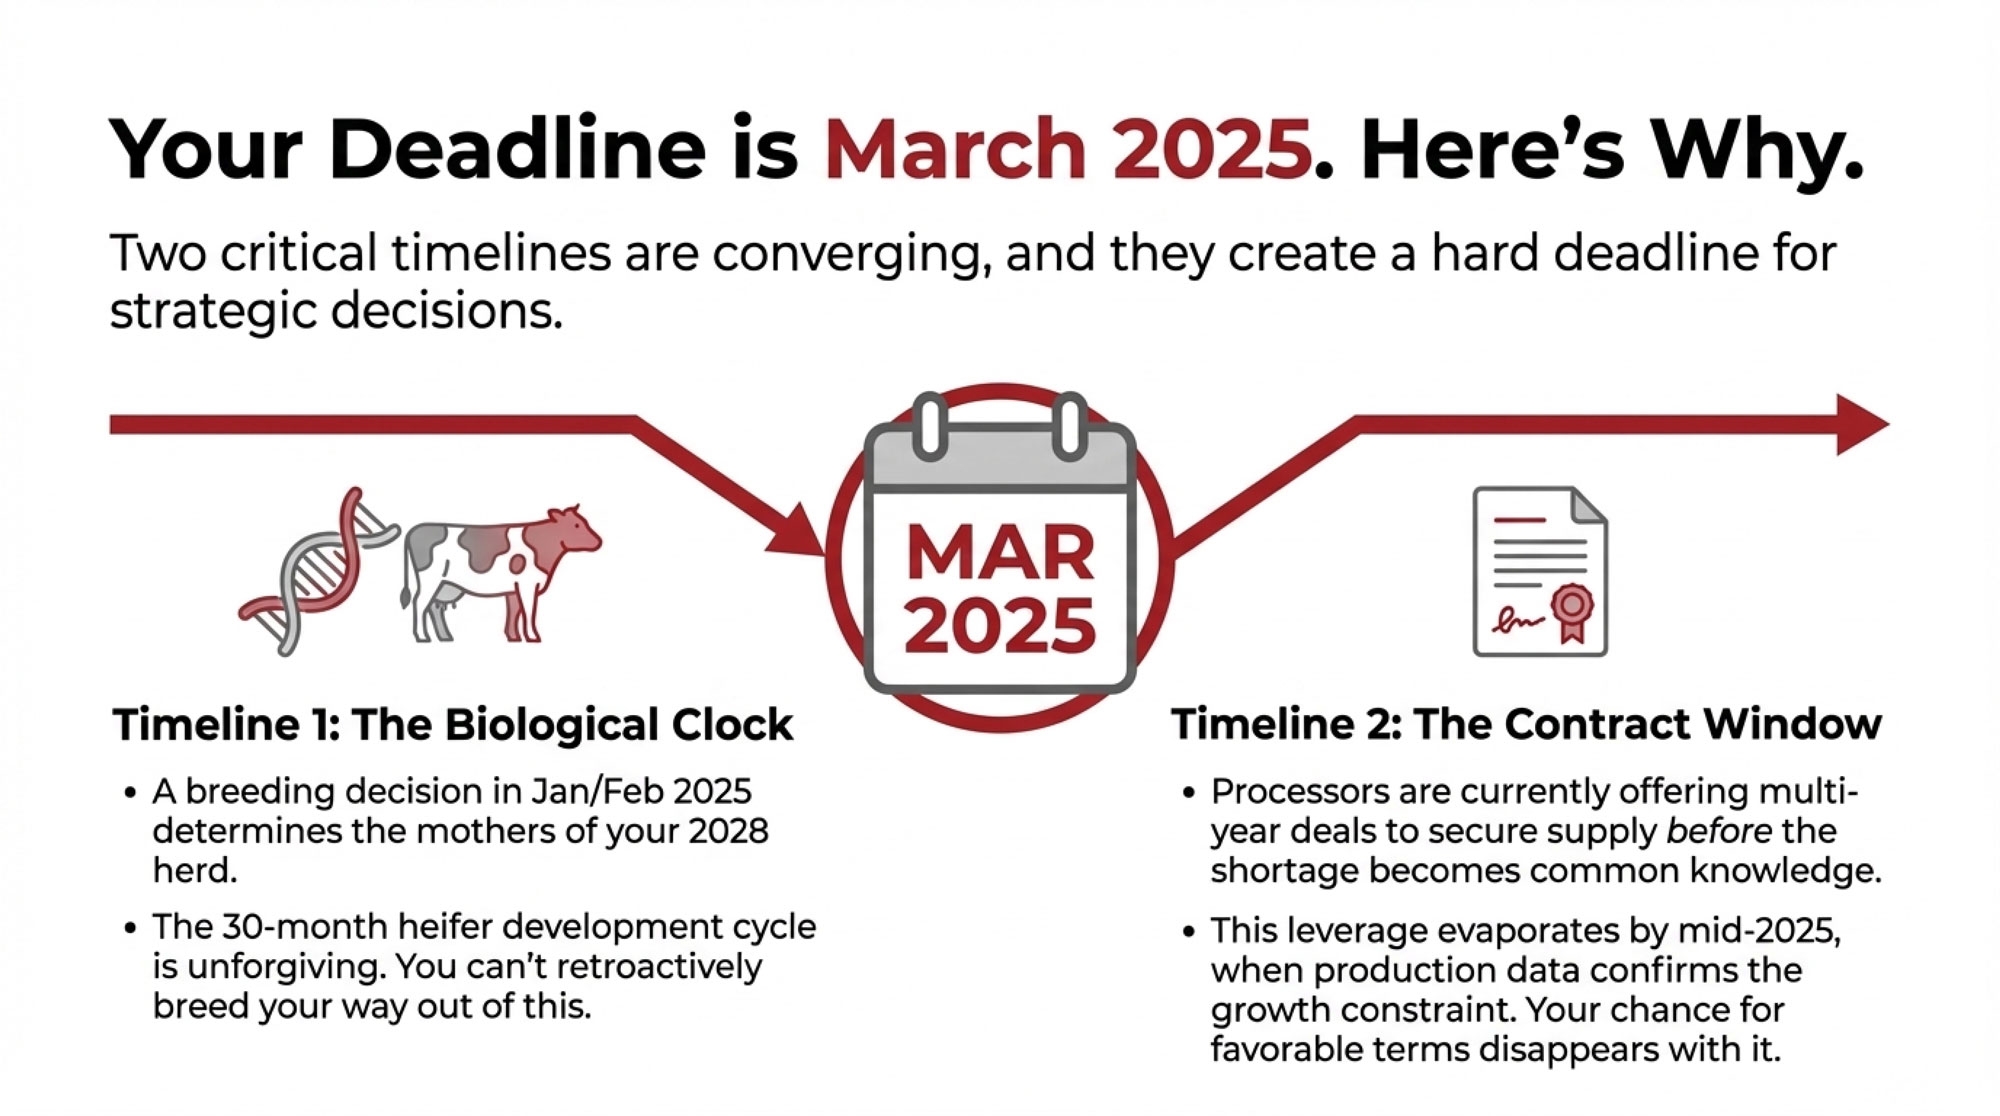
The Biological Reality: The 30-month heifer development cycle means breeding decisions you make between now and spring 2025 determine which cows become the mothers of your 2028 replacement heifers. A heifer bred in January 2025 calves in October 2025, and her heifer calf (if you breed dairy genetics) doesn’t freshen until spring 2028.

The Contract Window: Milk contracts for 2025-2027 are currently being negotiated. Processors are offering multi-year deals with premium component pricing while they’re uncertain about future supply. That negotiating leverage shifts dramatically by mid-2025 when production data confirms the heifer shortage is constraining growth.

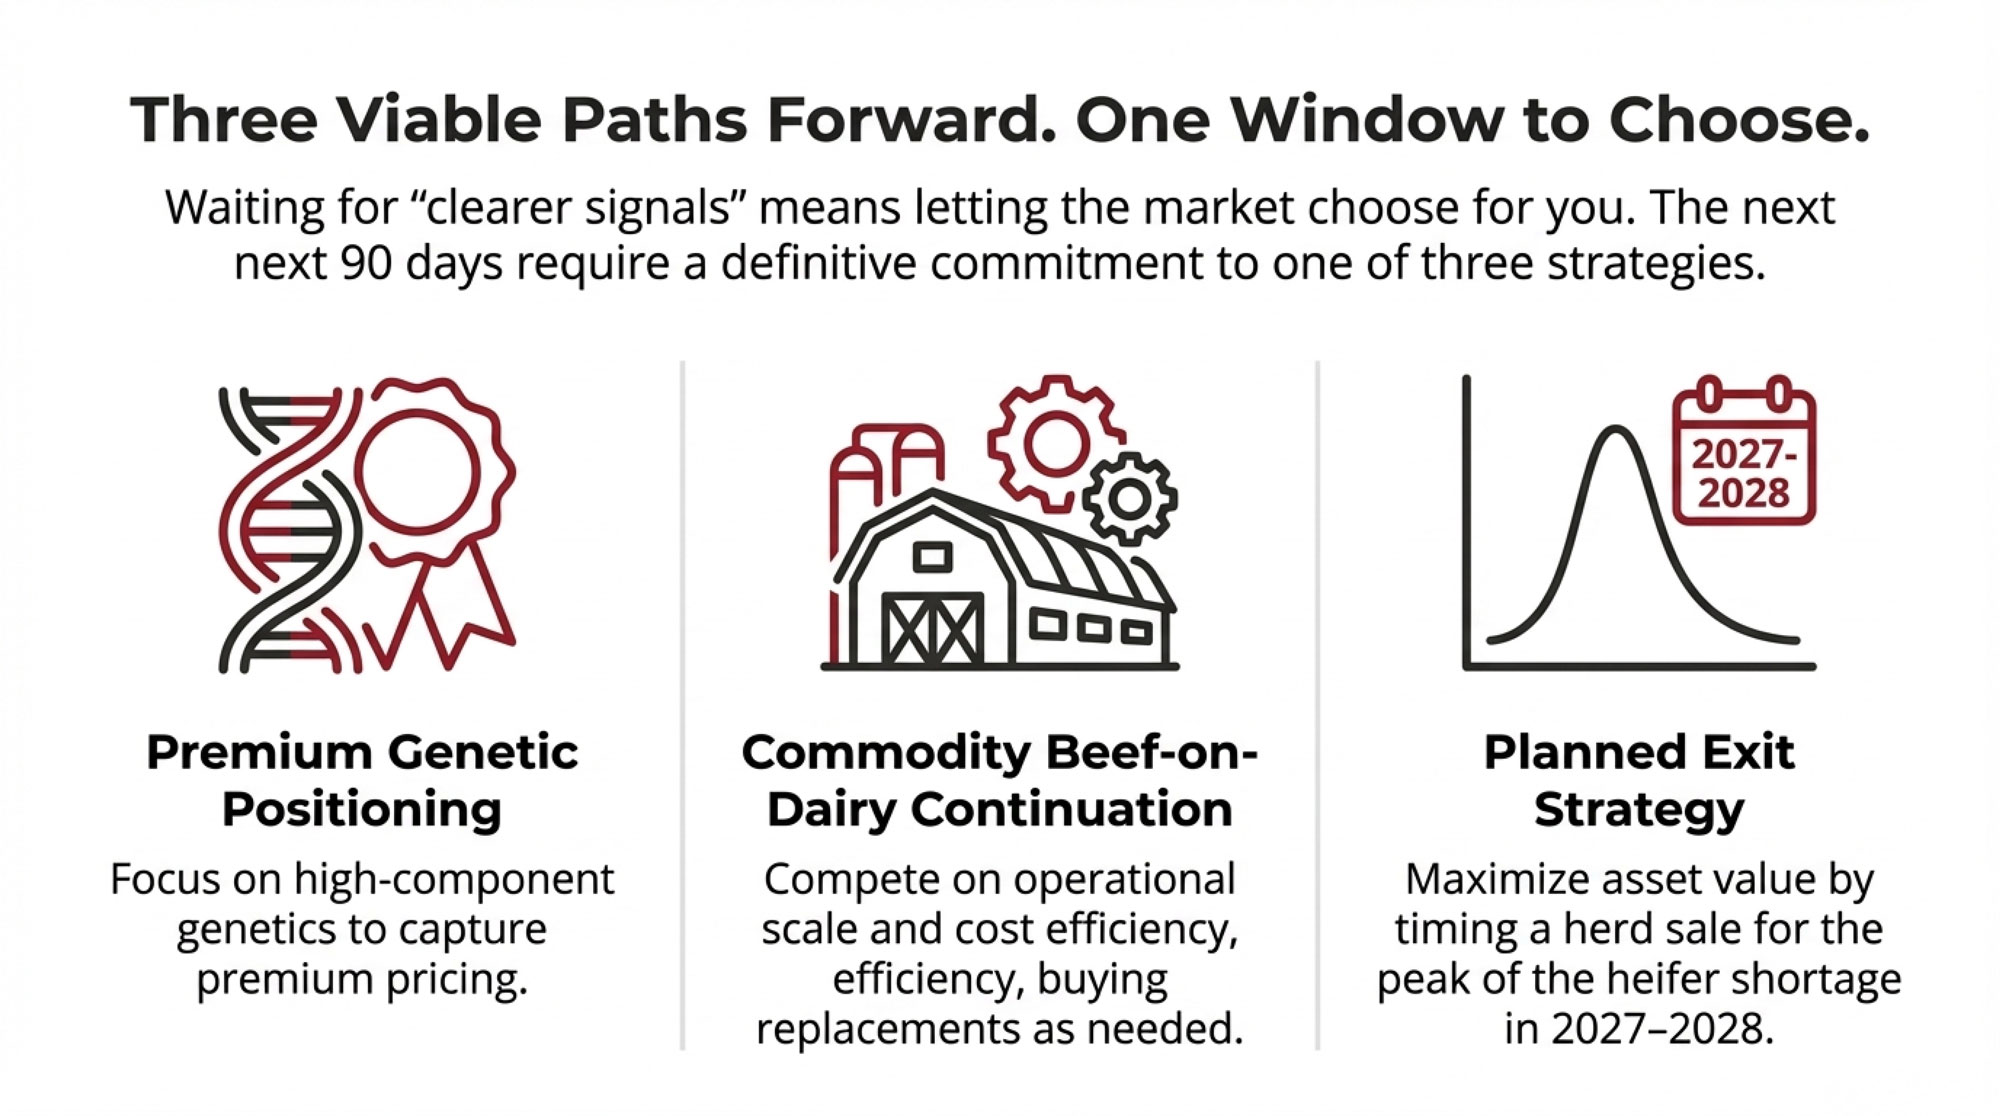
Three Viable Paths Forward

Let me walk through what I see as roughly three viable paths forward. Each requires some level of commitment in the next 90 days.

StrategyAnnual InvestmentReplacement Source2026-2028 Revenue ImpactRisk Level
Premium Genetic Positioning$25K-35K (semen + testing)Raise own (150-200/yr)+$300K-600K (component premiums)Medium (genetics execution)
Commodity Beef-on-Dairy$0-5K (maintaining current)Purchase market ($3,400-4,750)Commodity pricing (no premium)High (replacement cost escalation)
Planned Exit (Peak Value)$2K-8K (maximize beef revenue)Minimize/phase out+$450K-750K (peak herd sale)Low (planned timeline)

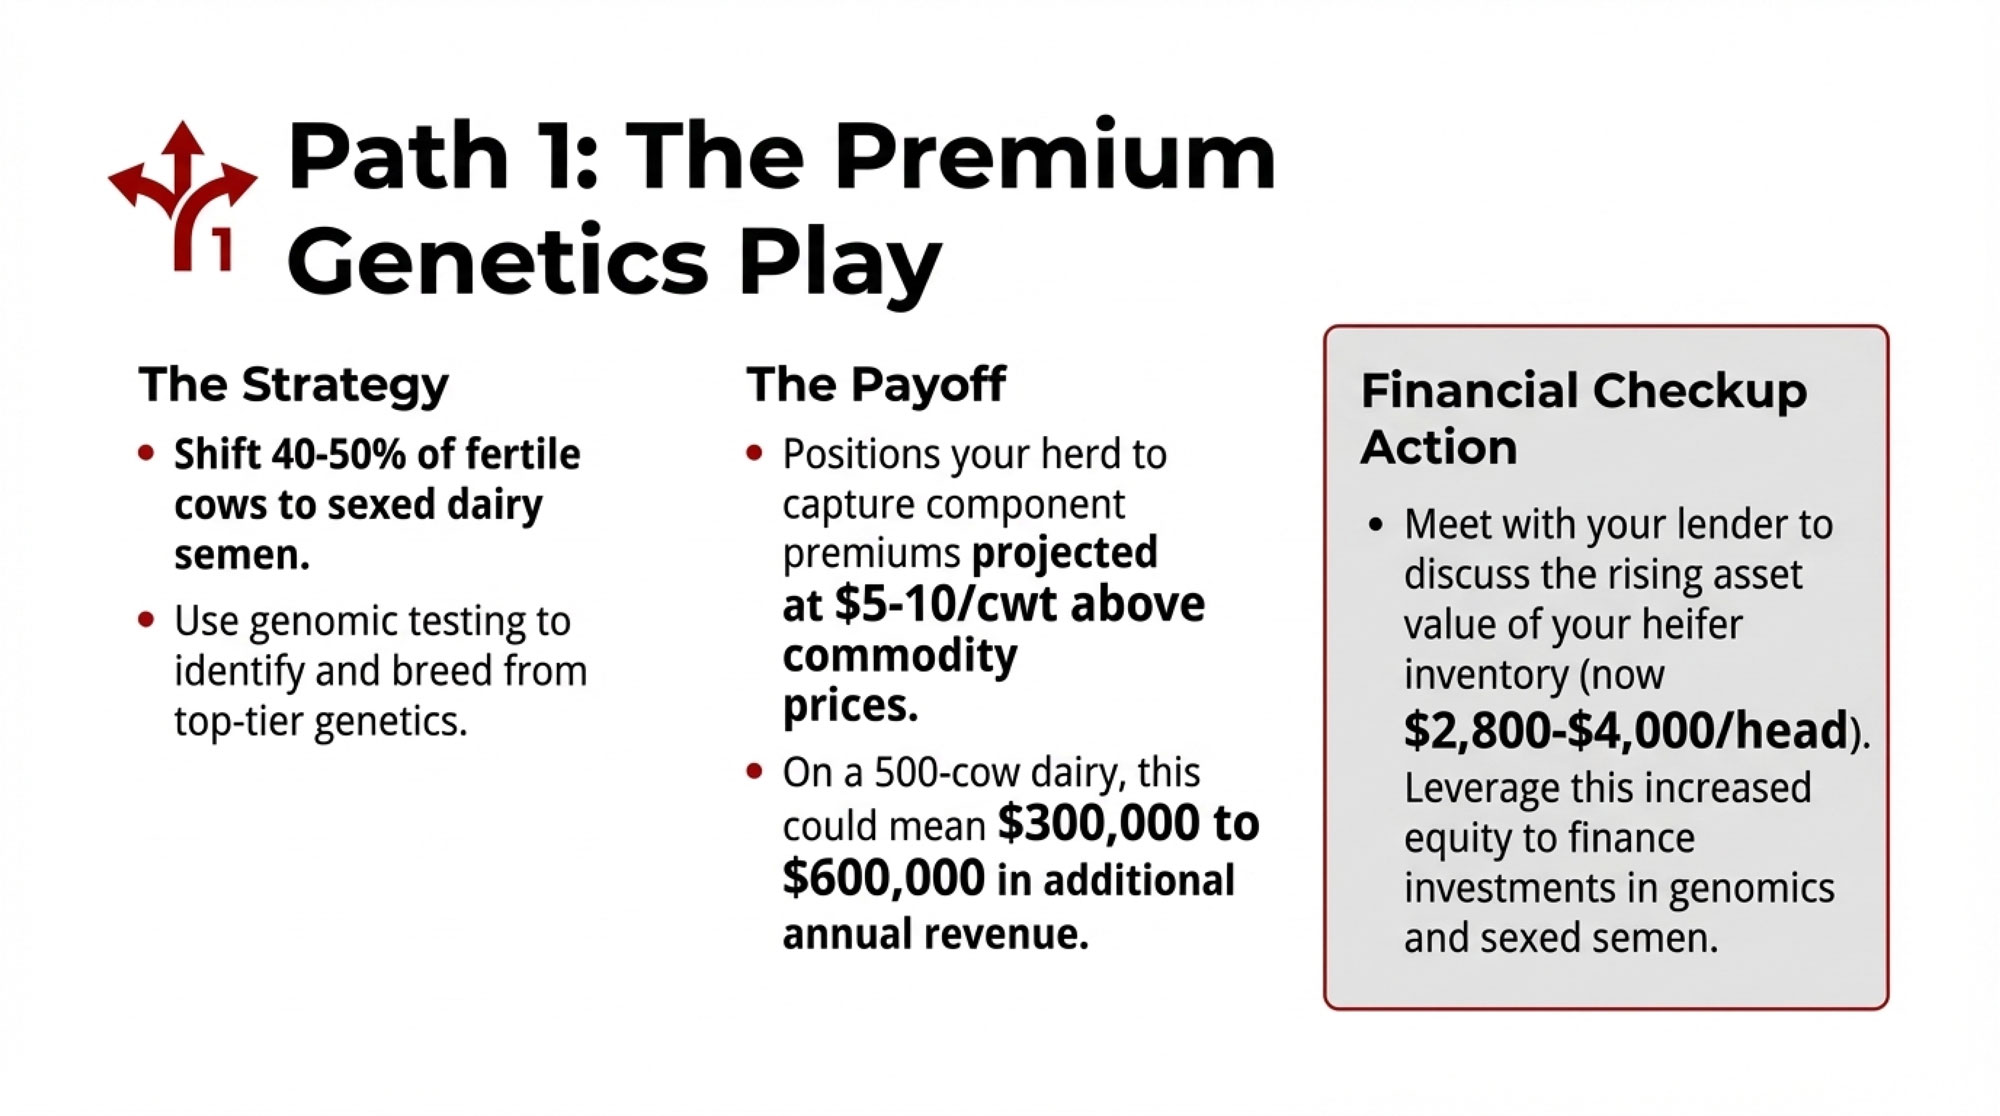
Path 1: Premium Genetic Positioning

The Strategy:

  • Shift 40-50% of fertile cows to sexed dairy semen
  • Implement genomic testing to identify the top genetics
  • Target 150-200 high-quality replacement heifers annually

The Investment:

  • Annual cost: $25,000 to $35,000 for semen and testing
  • Positions you for component premiums, analysts project could reach $5-10/cwt above commodity pricing in the coming years
  • On a 500-cow operation producing 12 million pounds: potential $300,000 to $600,000 additional annual revenue using conservative mid-range premium estimates

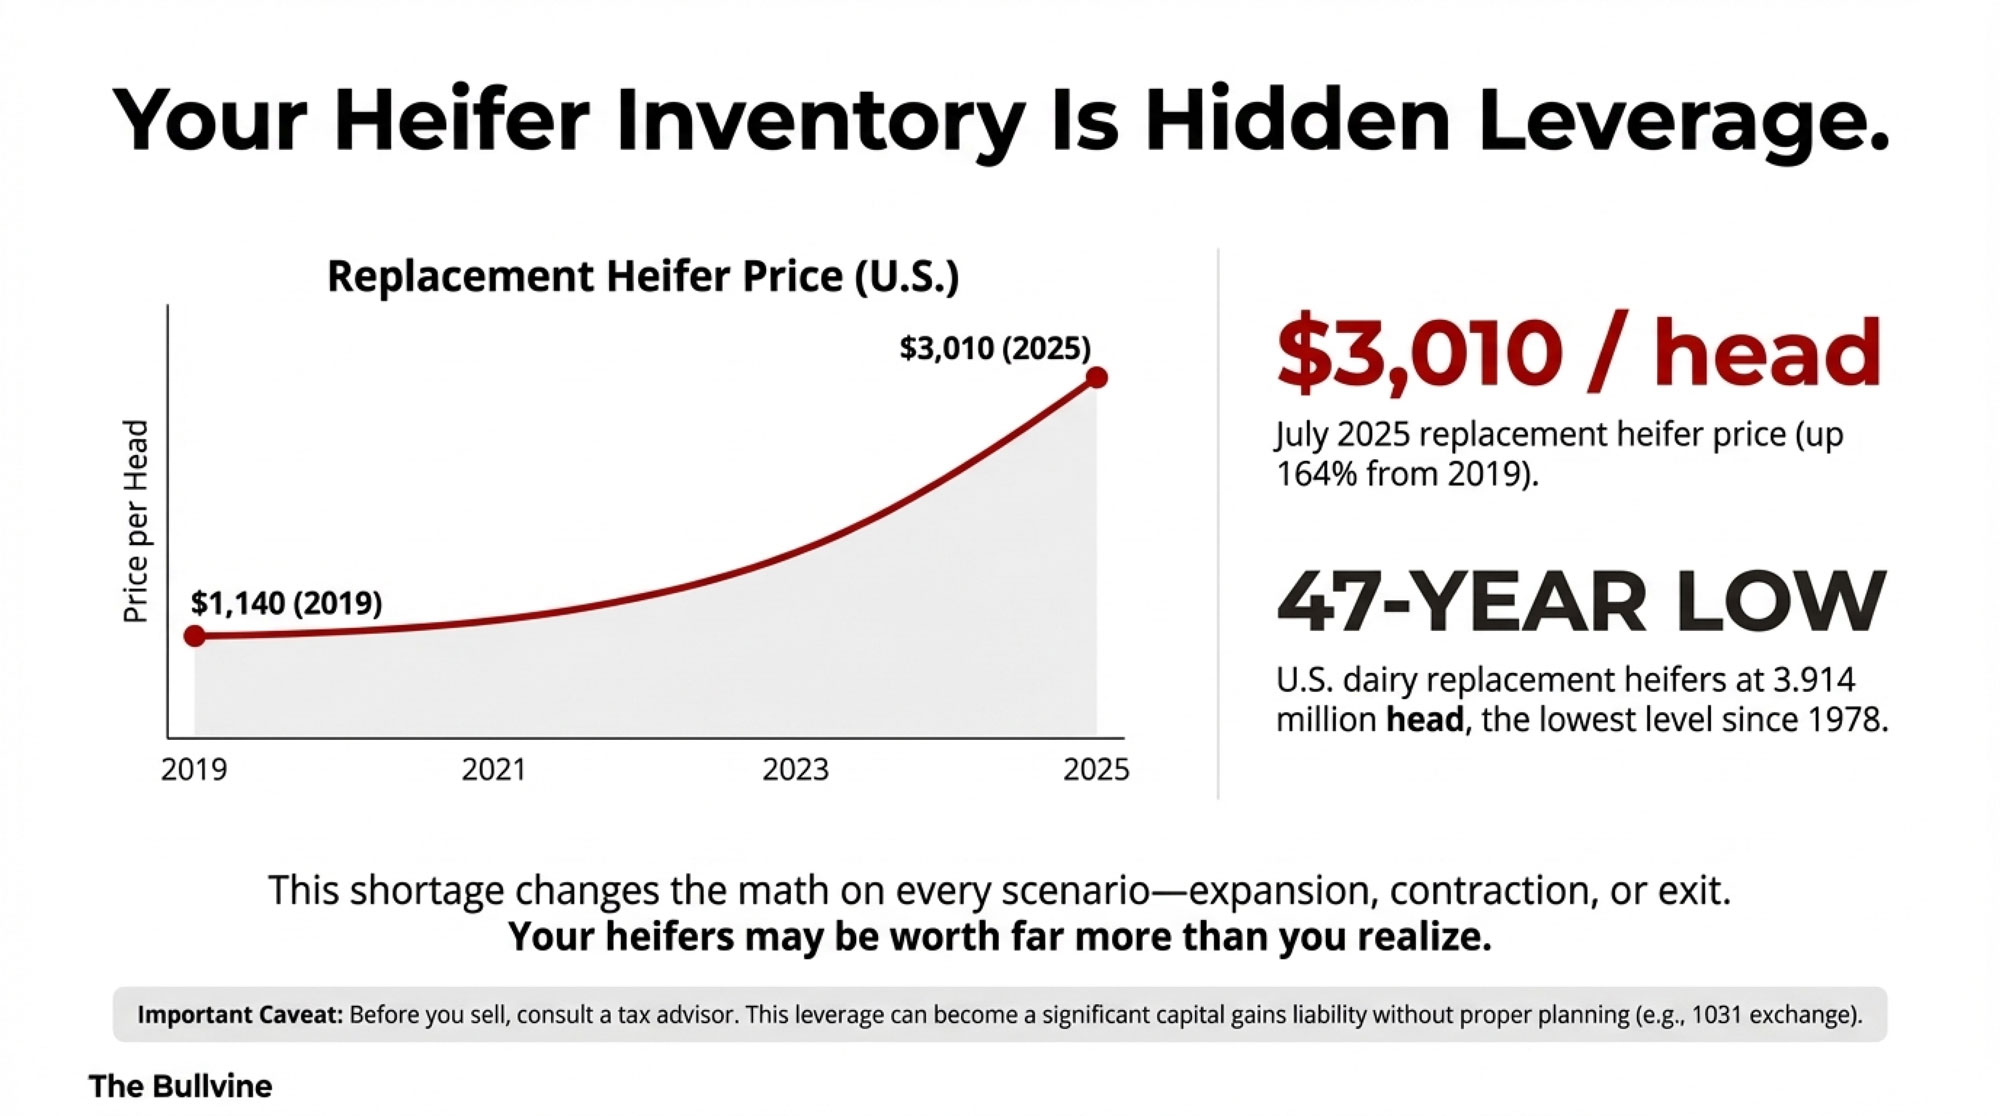
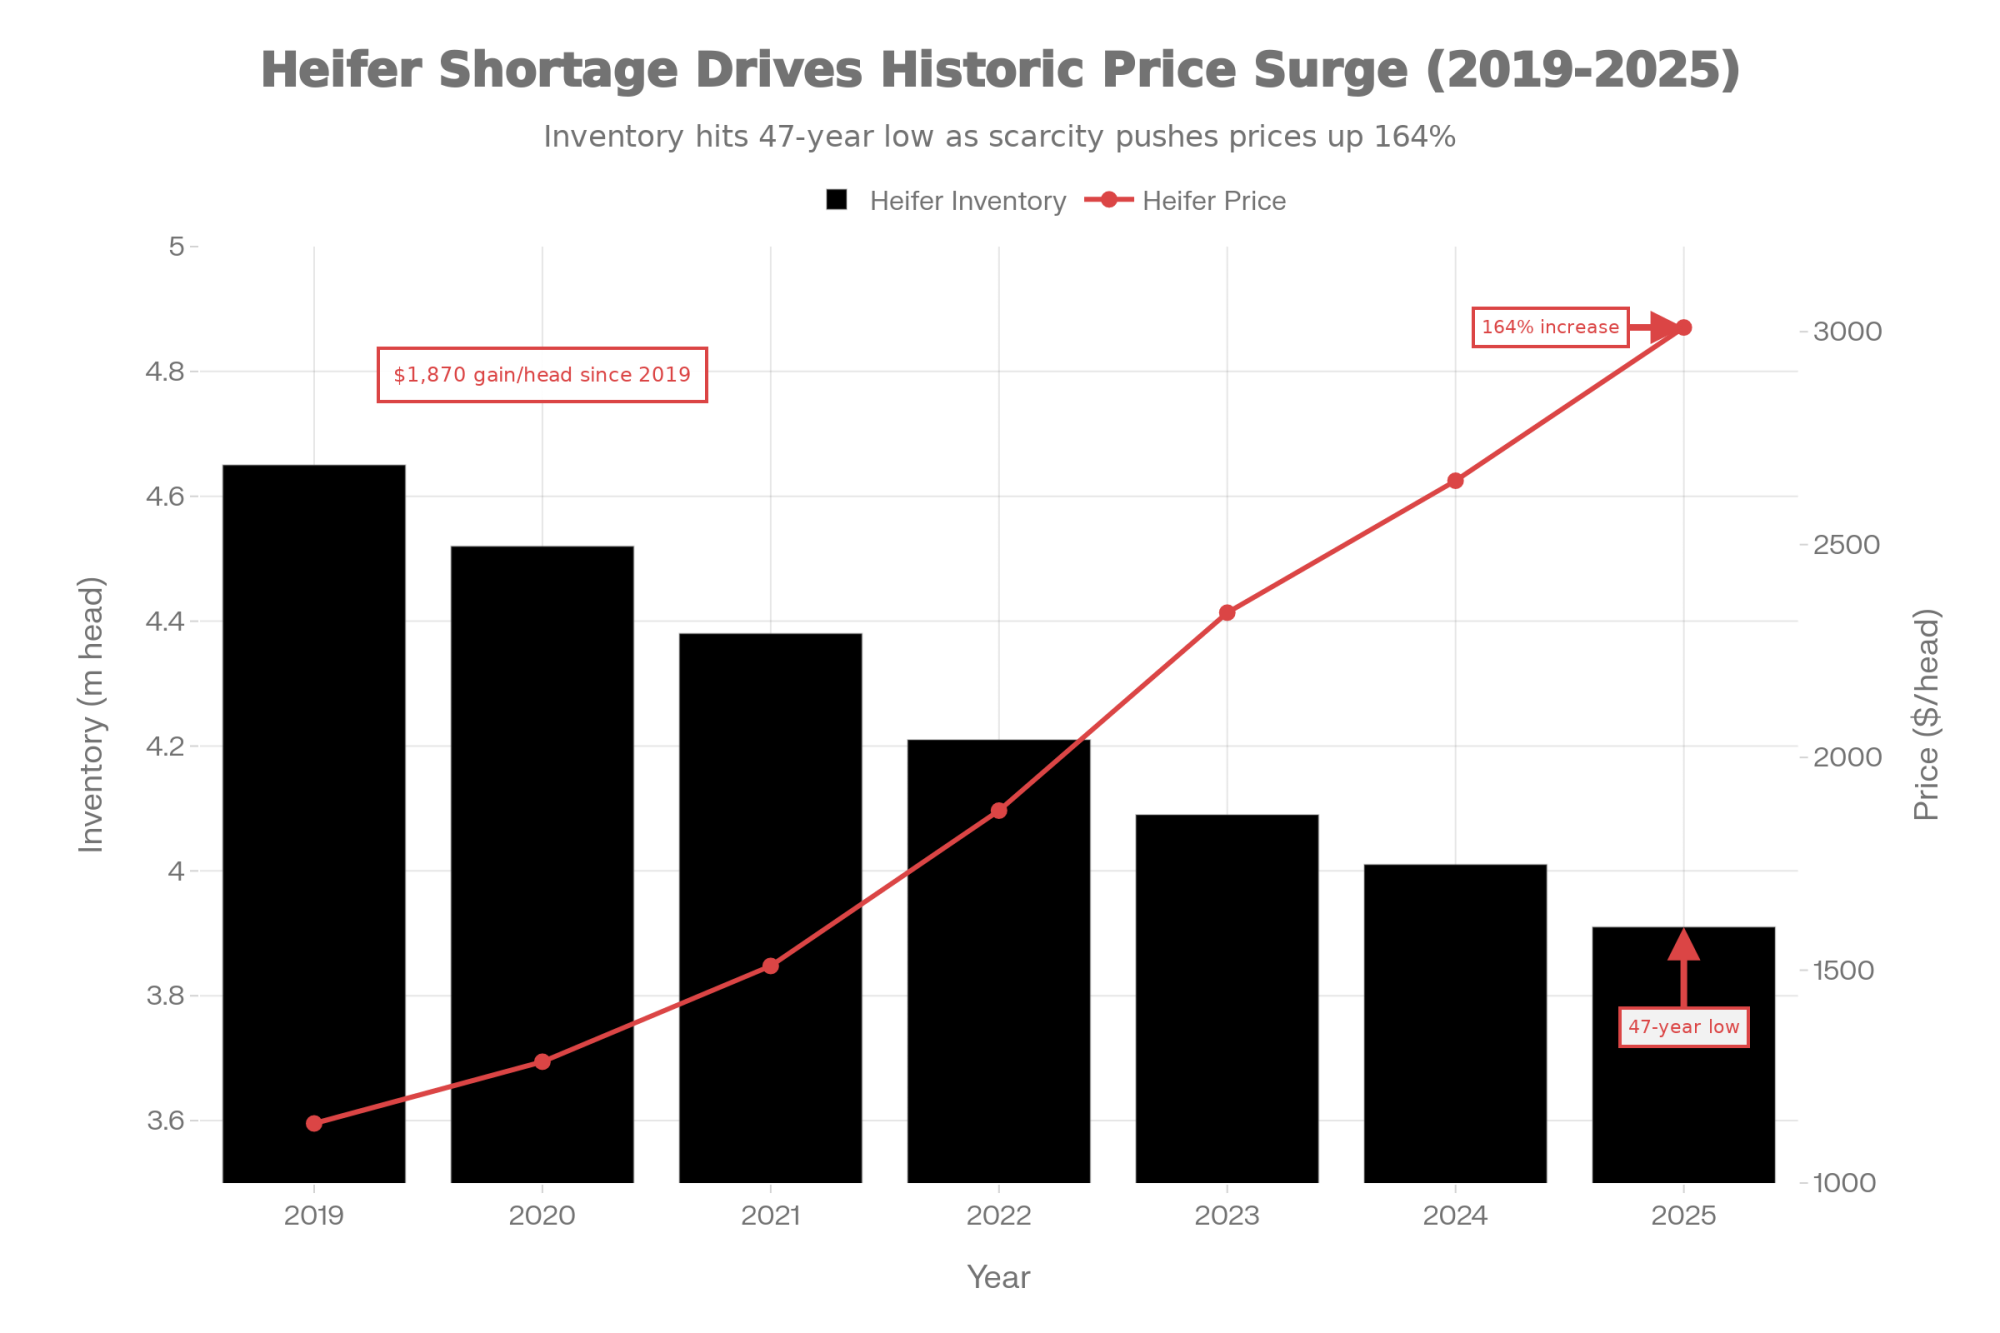
Financial Checkup Action: Meet with your lender specifically to discuss the rising asset value of your heifer inventory (currently $2,800-4,000 per head and climbing). Many operations can leverage this increased equity to finance genomic testing programs and investments in sexed semen without taking on significant additional debt.

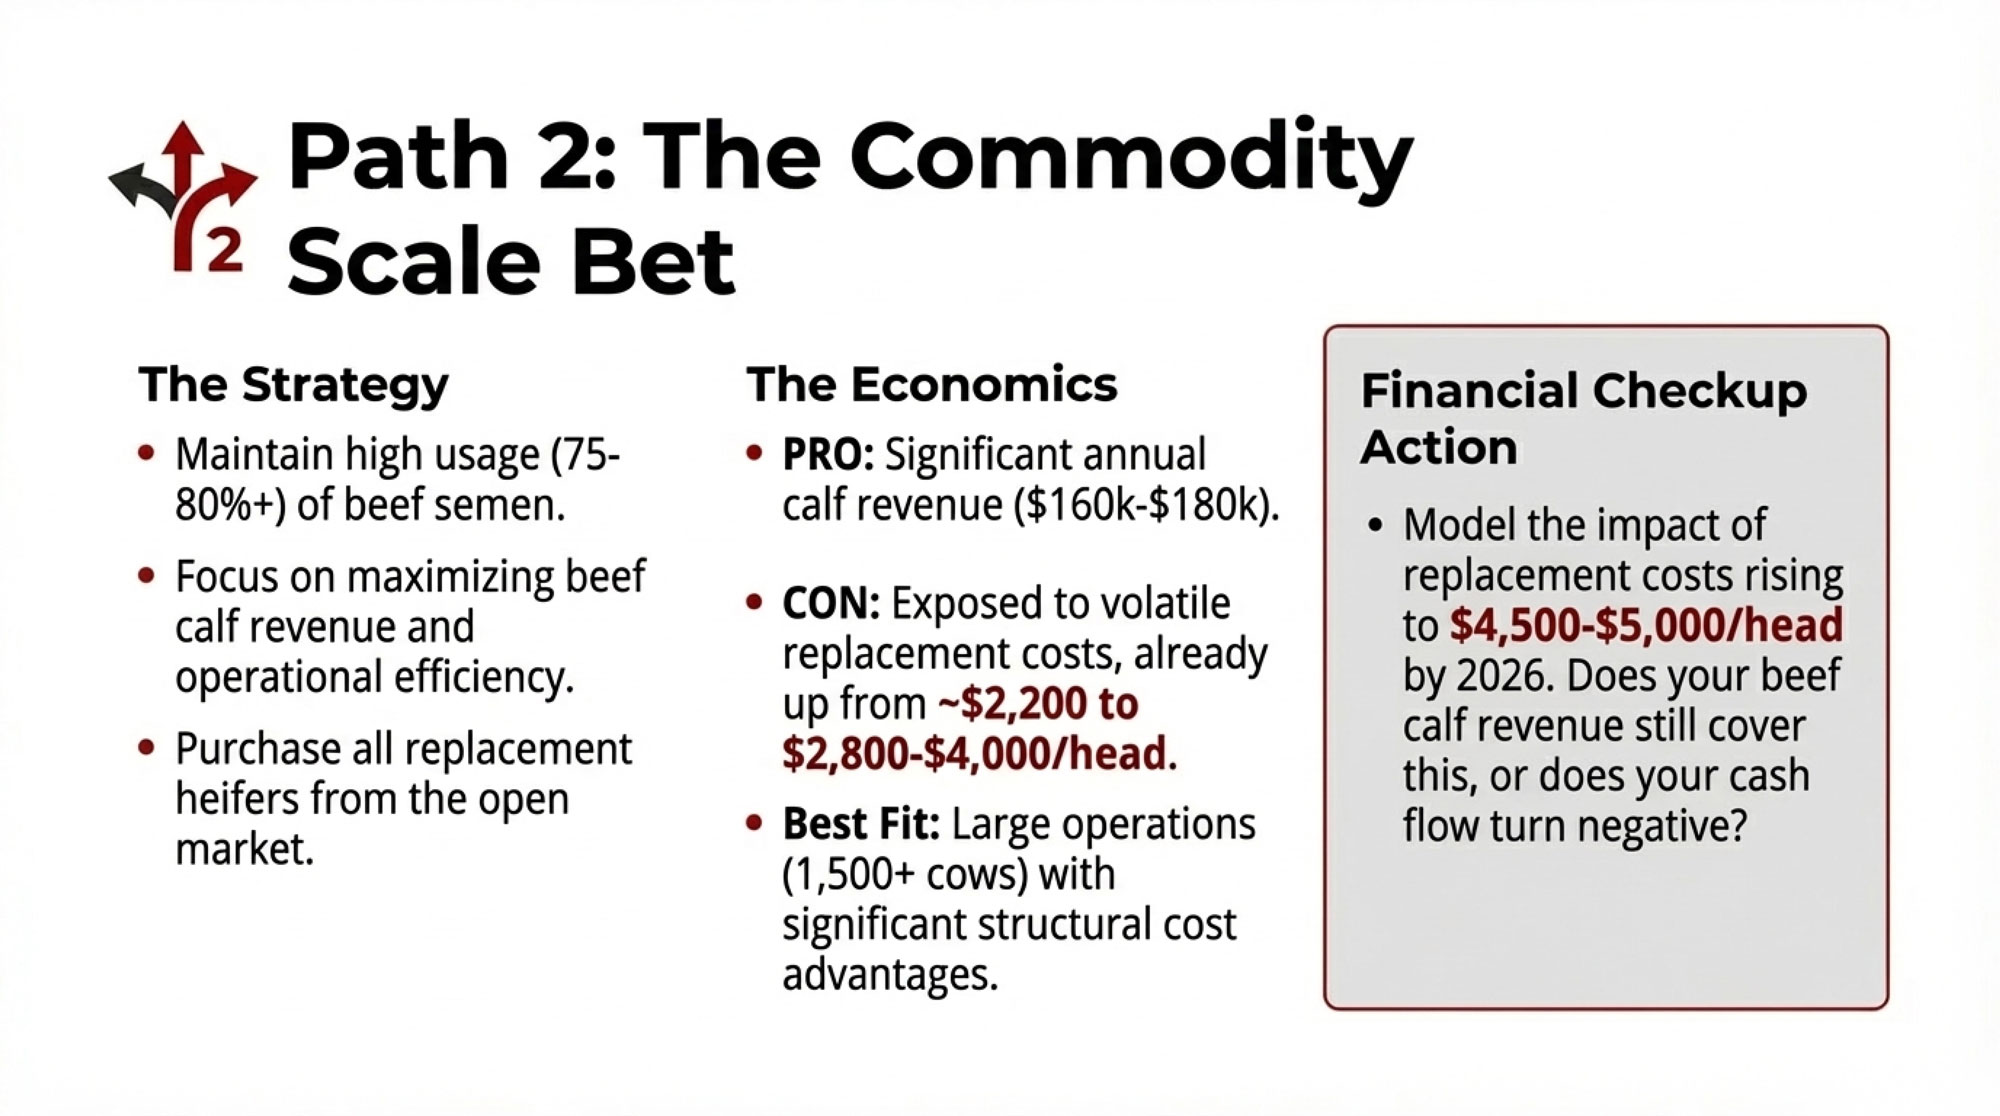
Path 2: Commodity Beef-on-Dairy Continuation

The Strategy:

  • Maintain current breeding patterns (75-80% beef semen)
  • Purchase replacements from the market as needed
  • Compete on cost efficiency and operational scale

The Economics:

  • Annual calf revenue: $160,000 to $180,000 based on current beef-dairy calf markets
  • Replacement purchase costs: $2,800-4,000 per head (current market, up from $2,000-2,500 in 2023)
  • Locks into commodity pricing structures without premium component access
  • Best fit: larger operations (1,500+ cows) with structural cost advantages

Financial Checkup Action: Work with your lender to model the impact of rising replacement heifer costs on your cash flow. If replacements continue climbing to $4,500-5,000 per head (as some project for 2026-2027), calculate whether beef calf revenue still pencils out favorably versus raising your own.

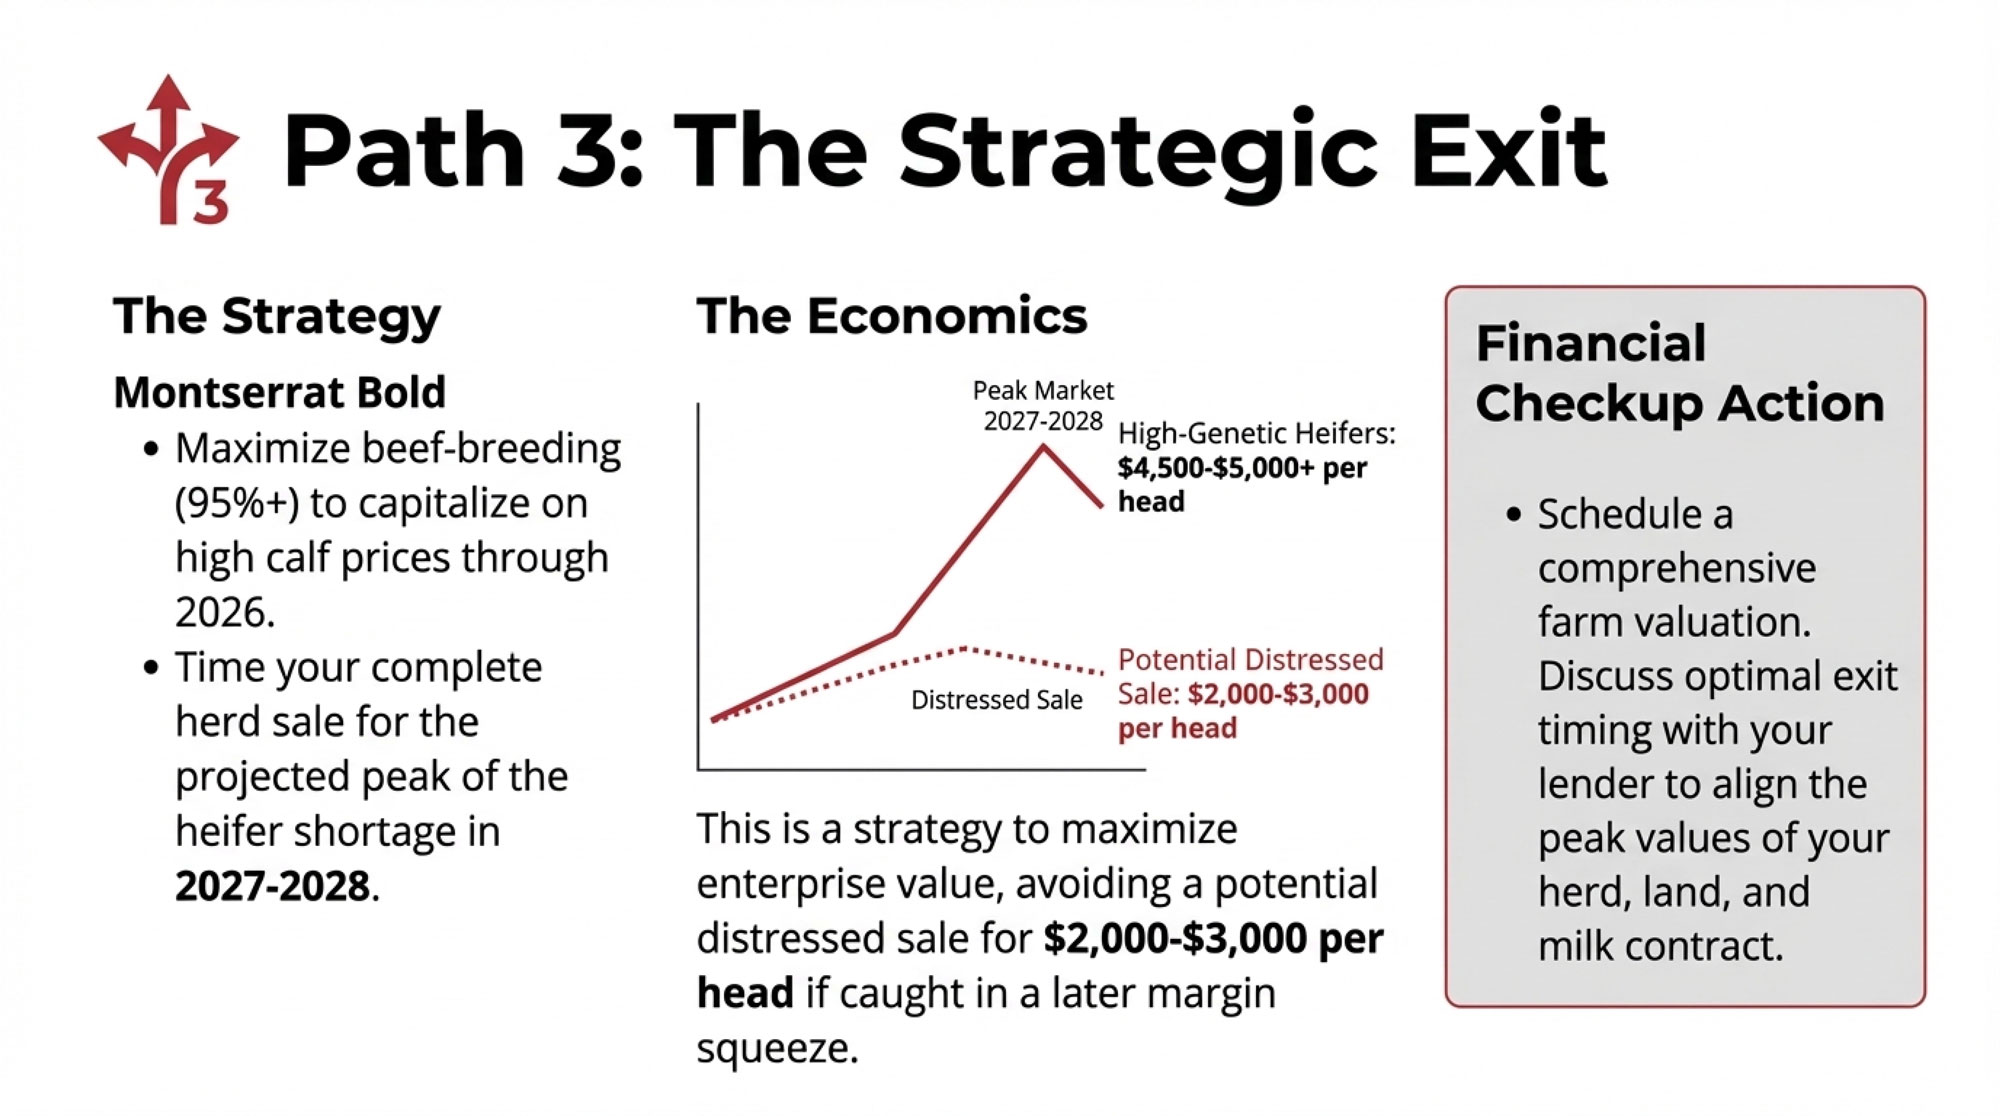
Path 3: Planned Exit Strategy

The Strategy:

  • Maximize beef-breeding (95%+ beef semen) through 2025-2026
  • Capitalize on elevated calf prices
  • Time herd sale for 2027-2028, when heifer genetics values are projected to peak

The Economics:

  • Current replacement heifer market: $2,800 to $4,000 per head, depending on genetics and stage
  • Projected 2027-2028 peak: Potentially $4,500-5,000+ per head as shortage intensifies
  • Compare to potential distressed sales if caught in a margin squeeze: $2,000-3,000 per head
  • Capital redeployment options: service businesses for dairy farmers, land development, genetics operations, agritourism

Financial Checkup Action: Schedule a comprehensive farm valuation with your lender and discuss optimal exit timing. Your heifer inventory, land, facilities, and milk contract all have peak value windows. Understanding when those align—likely 2027-2028 based on market projections—helps you maximize enterprise value rather than being forced into a distressed sale.

The Contract Negotiation Window Is Open Now

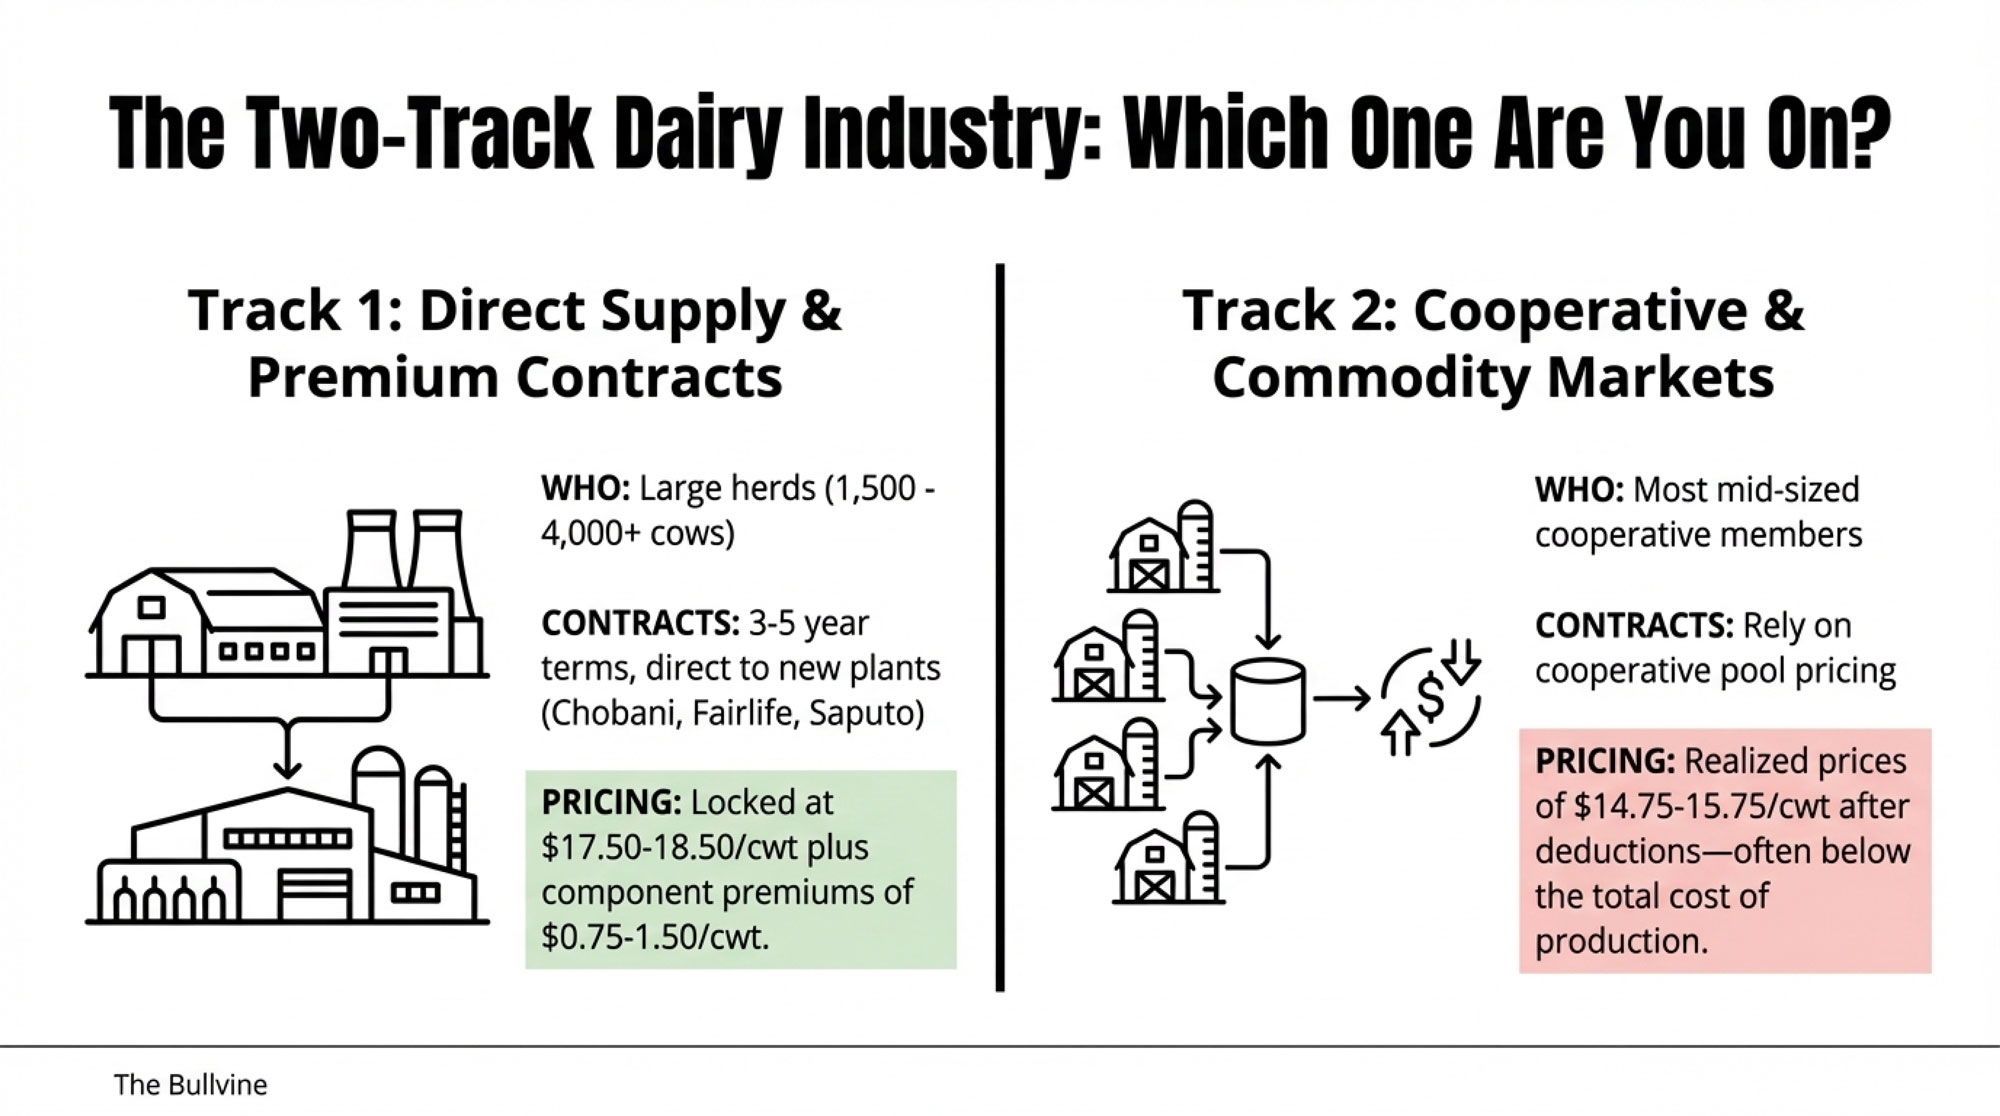
Milk contract negotiations matter more right now than they have in years. Processors are offering multi-year contracts—3 to 5 years—with locked base pricing and component premium structures. These offers are driven by processor uncertainty about future milk availability. They’re trying to secure supply commitments before the shortage becomes industry-wide common knowledge and their negotiating leverage disappears.

What Producers Are Negotiating (Q4 2024 – Q1 2025):

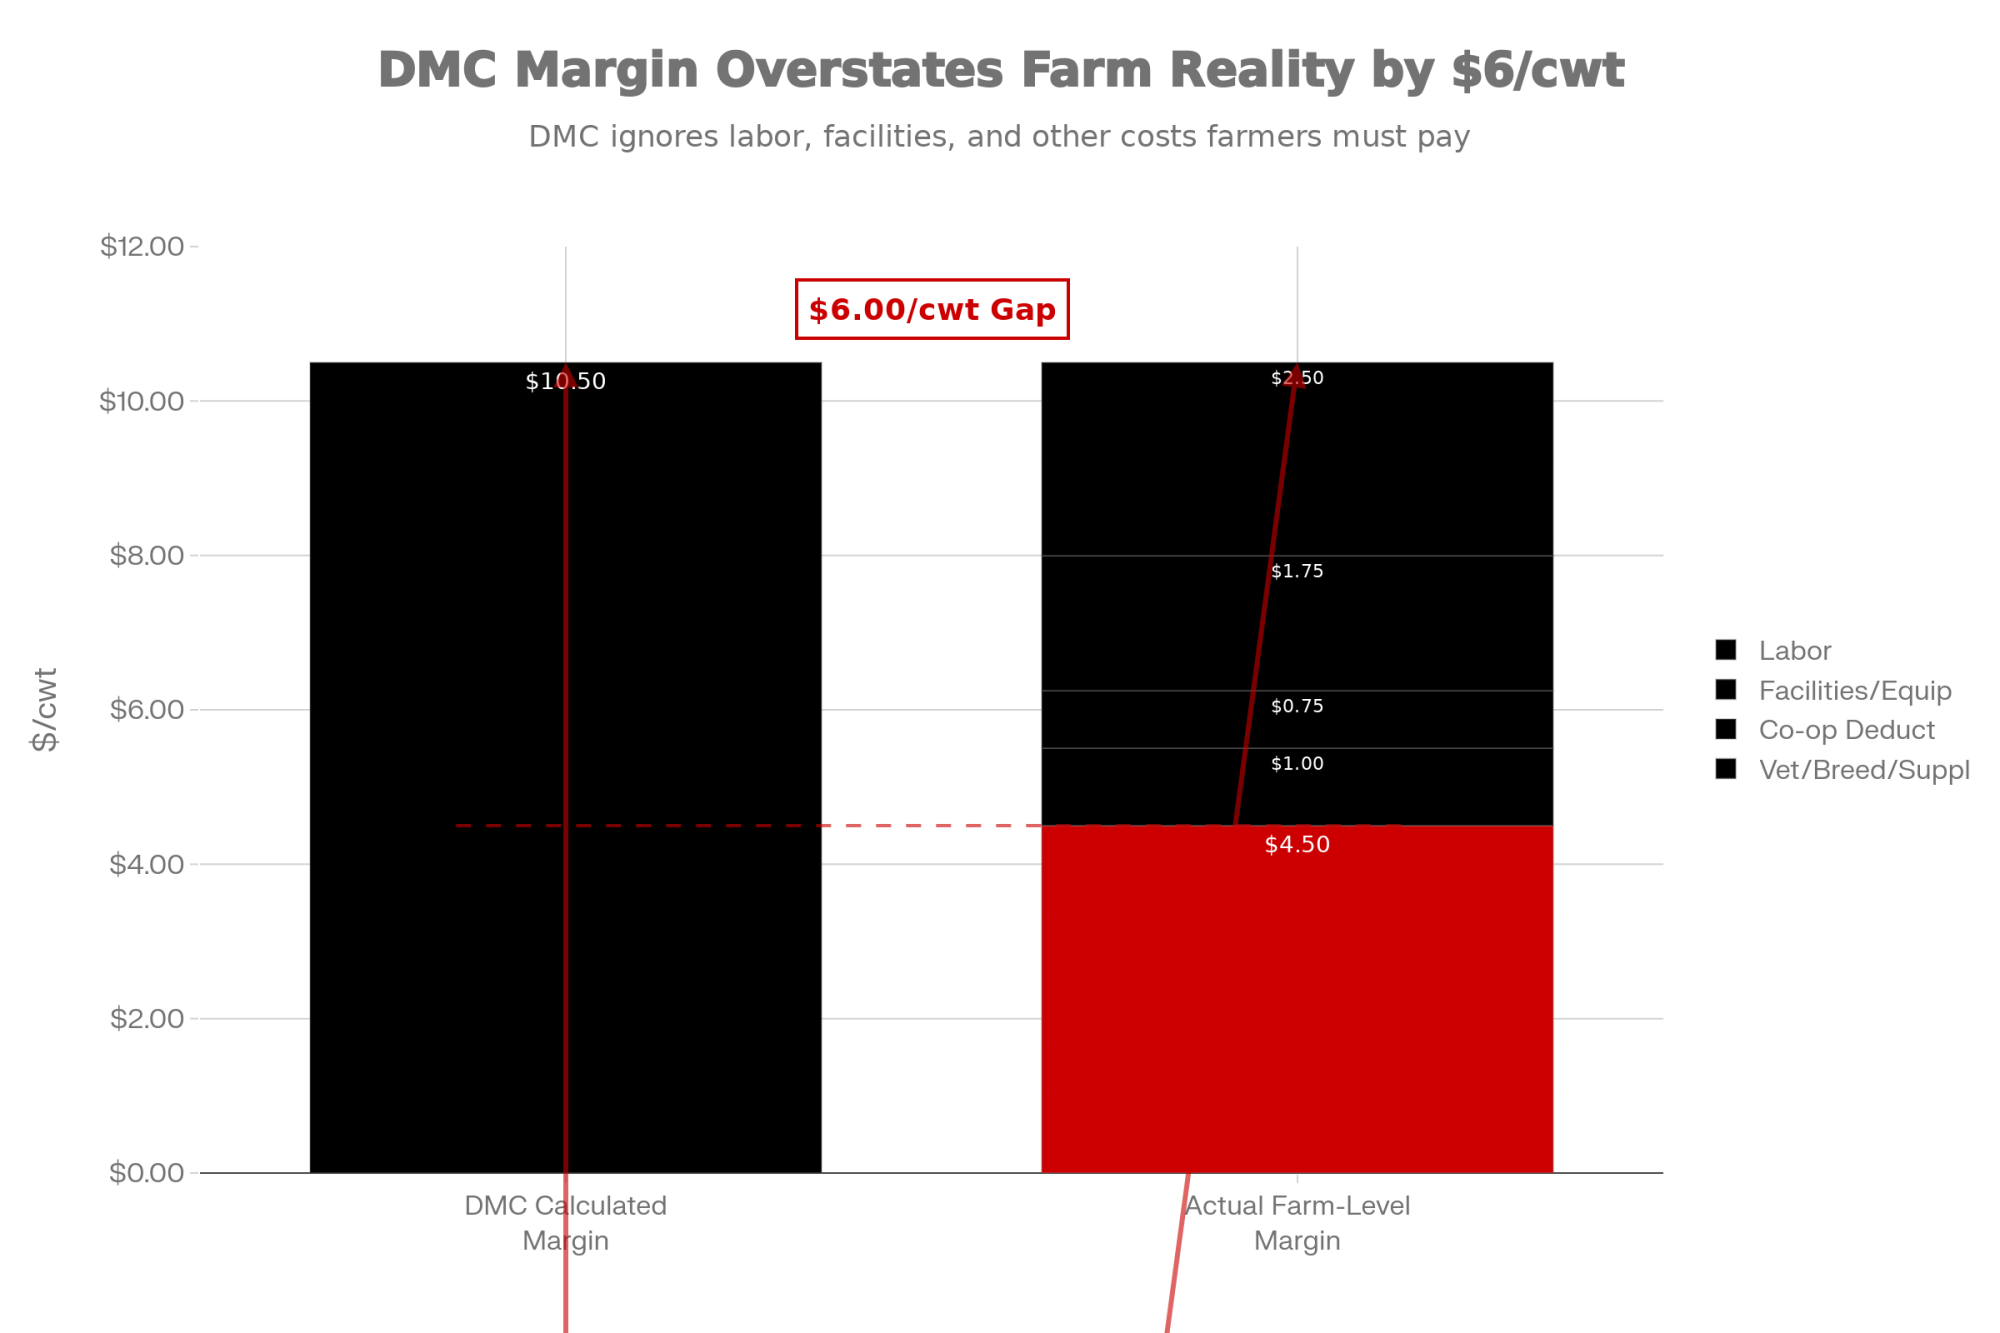
  • Base pricing: Contracts being offered in the $17.50 to $18.50 per hundredweight range
  • Component premiums: $1.25 to $1.50 per hundredweight for high-testing milk (varies by processor)
  • Liability caps: Negotiate caps at one year’s milk revenue or $2.5 million maximum (unlimited liability clauses are becoming standard; insurance runs $50,000+ annually for mid-size operations)

By mid-2026, when production data confirms the heifer shortage is constraining growth, that leverage shifts dramatically. Farms locking in favorable terms in early 2025 will have substantial advantages over those accepting spot pricing or shorter contracts six months later, when terms probably worsen.

Contract ElementQ1 2025 Window (NOW)Q3 2025 ProjectedAdvantage
Base Milk Price ($/cwt)$17.50-18.50$16.80-17.80$0.70-1.00/cwt HIGHER
Component Premium ($/cwt)$1.25-1.50$0.85-1.15$0.35-0.40/cwt HIGHER
Contract Length Available3-5 years1-2 years2-3 years LONGER
Liability Cap TermsNegotiable ($2.5M cap)Unlimited (standard)Caps still possible
Processor LeverageLOW – Need supply commitmentsHIGH – Shortage confirmedProducer has power NOW

What This Means Going Forward

The biological reality here is pretty unforgiving. You can’t breed your way out of a heifer shortage retroactively. A heifer born today doesn’t freshen for 30 months. Decisions you make in the next 90 days determine your herd composition through 2027 and 2028. Operations waiting for “better conditions” or “clearer signals” will find their strategic options have narrowed substantially by mid-2025.

The Industry Is Bifurcating

The industry is splitting into distinct segments:

  • Premium component producers accessing specialized markets
  • Mega-dairies (1,500+ cows) competing on cost efficiency
  • A shrinking middle ground (500-700 cows) with limited competitive advantages

Farms making intentional choices about which segment to compete in have better odds than those maintaining status quo operations, hoping market conditions improve on their own.

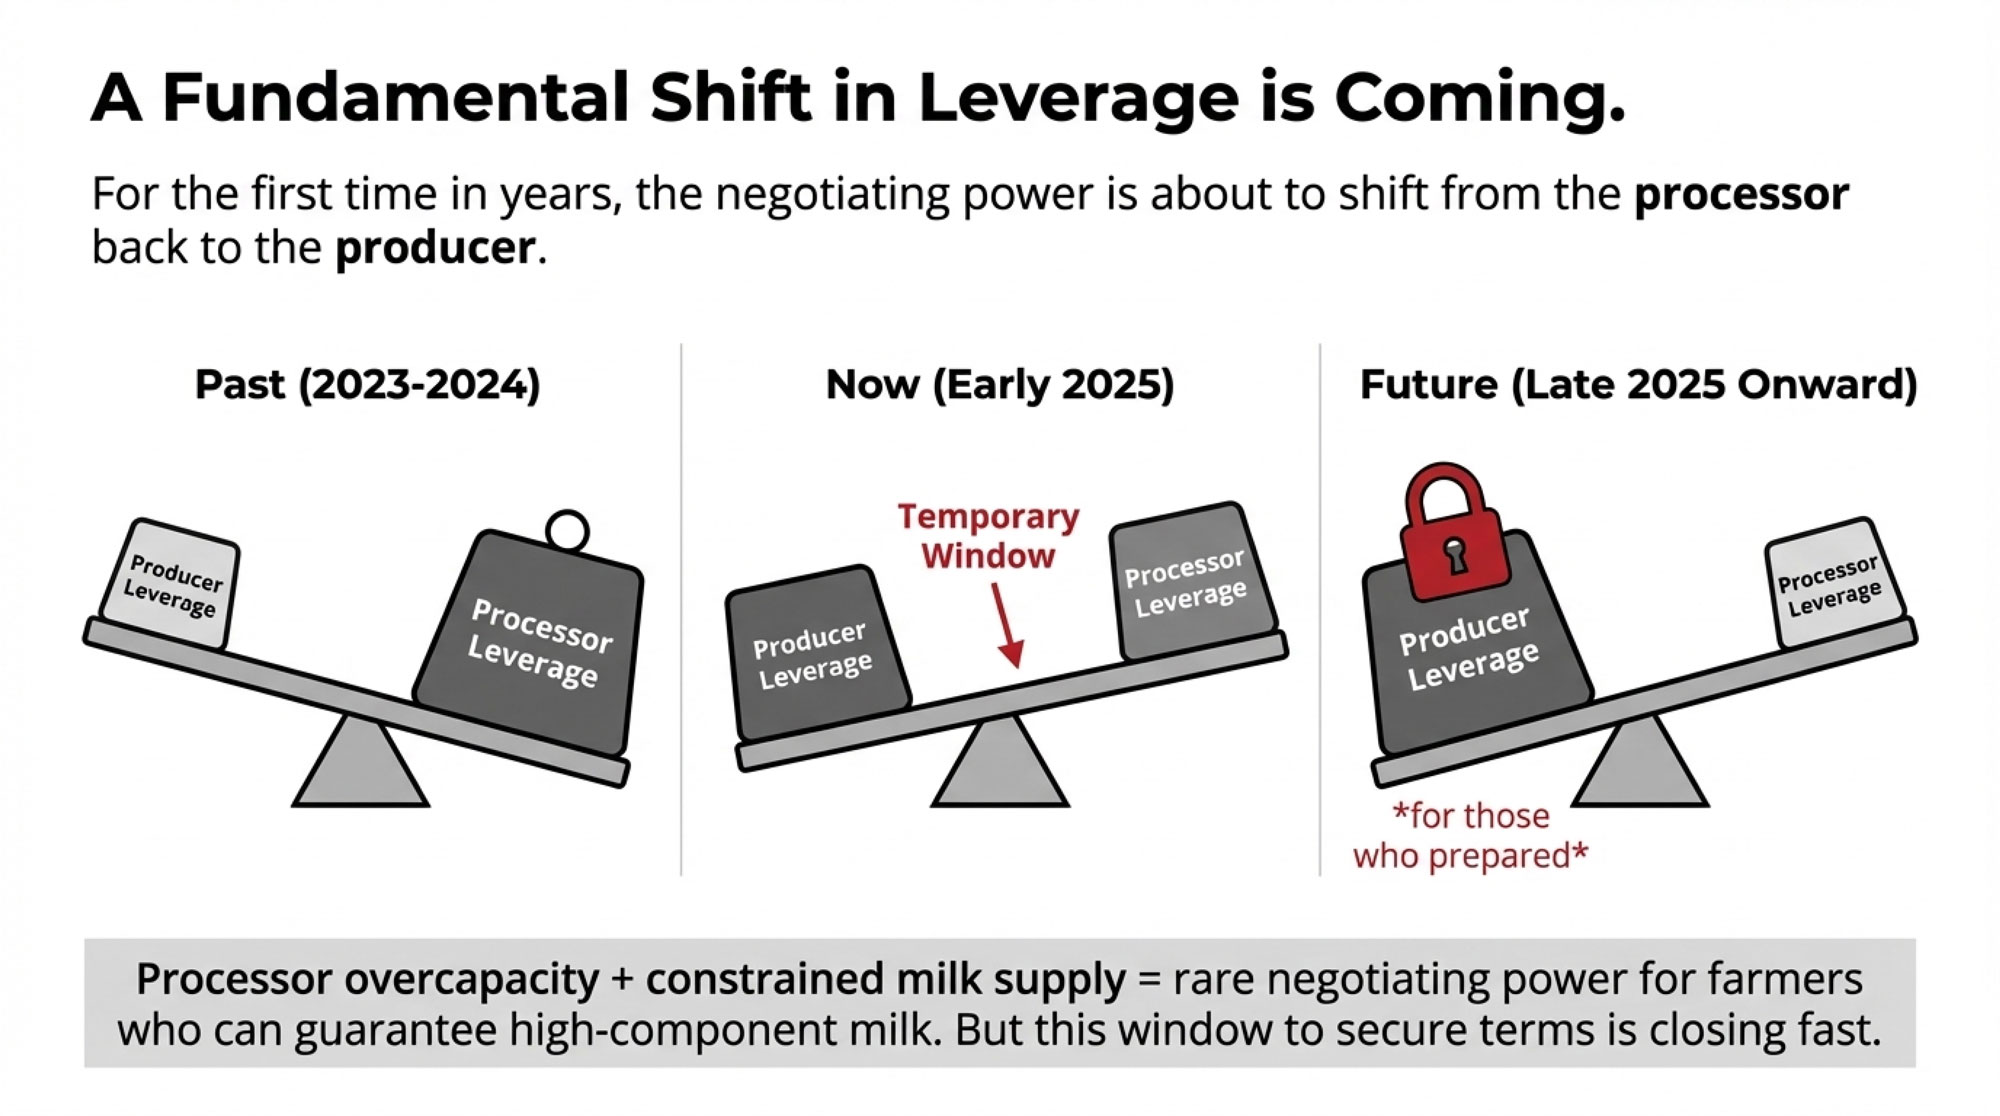
The Temporary Leverage Window

Processor dynamics are creating unusual leverage for producers right now, but it’s temporary. Processing overcapacity combined with a tight milk supply creates rare negotiating power for dairy farmers willing to commit supply. But that window is open for only a limited time. Multi-year contracts with component premiums locked at current rates may represent opportunities that won’t be available once market realities become widely understood.

Genetic Investment Pays Differently Now

Component pricing puts 90% of your milk check value on butterfat and protein. Farms maintaining or enhancing dairy genetics through this shortage period—even at higher short-term cost—are positioning for substantial premiums when processing demand exceeds available supply of high-component milk.

Resources to Help You Decide

If you’re working through these decisions, extension resources can help:

  • Penn State Extension: Heifer raising cost calculators, enterprise budgets
  • Wisconsin’s Center for Dairy Profitability: Genomic selection ROI tools, contract analysis templates
  • Cornell’s dairy management program: Financial modeling for strategic path comparison

These tools are generally free or low-cost, and they’re worth using before you commit to a direction.

The Bottom Line

Recent production numbers tell an encouraging story about where the industry has been. But the heifer inventory numbers reveal something different about where we can realistically go. For those of us making decisions that’ll determine our operations’ viability through the rest of this decade, understanding that difference—and acting on it in the next few months—probably matters more than any single month’s production data.
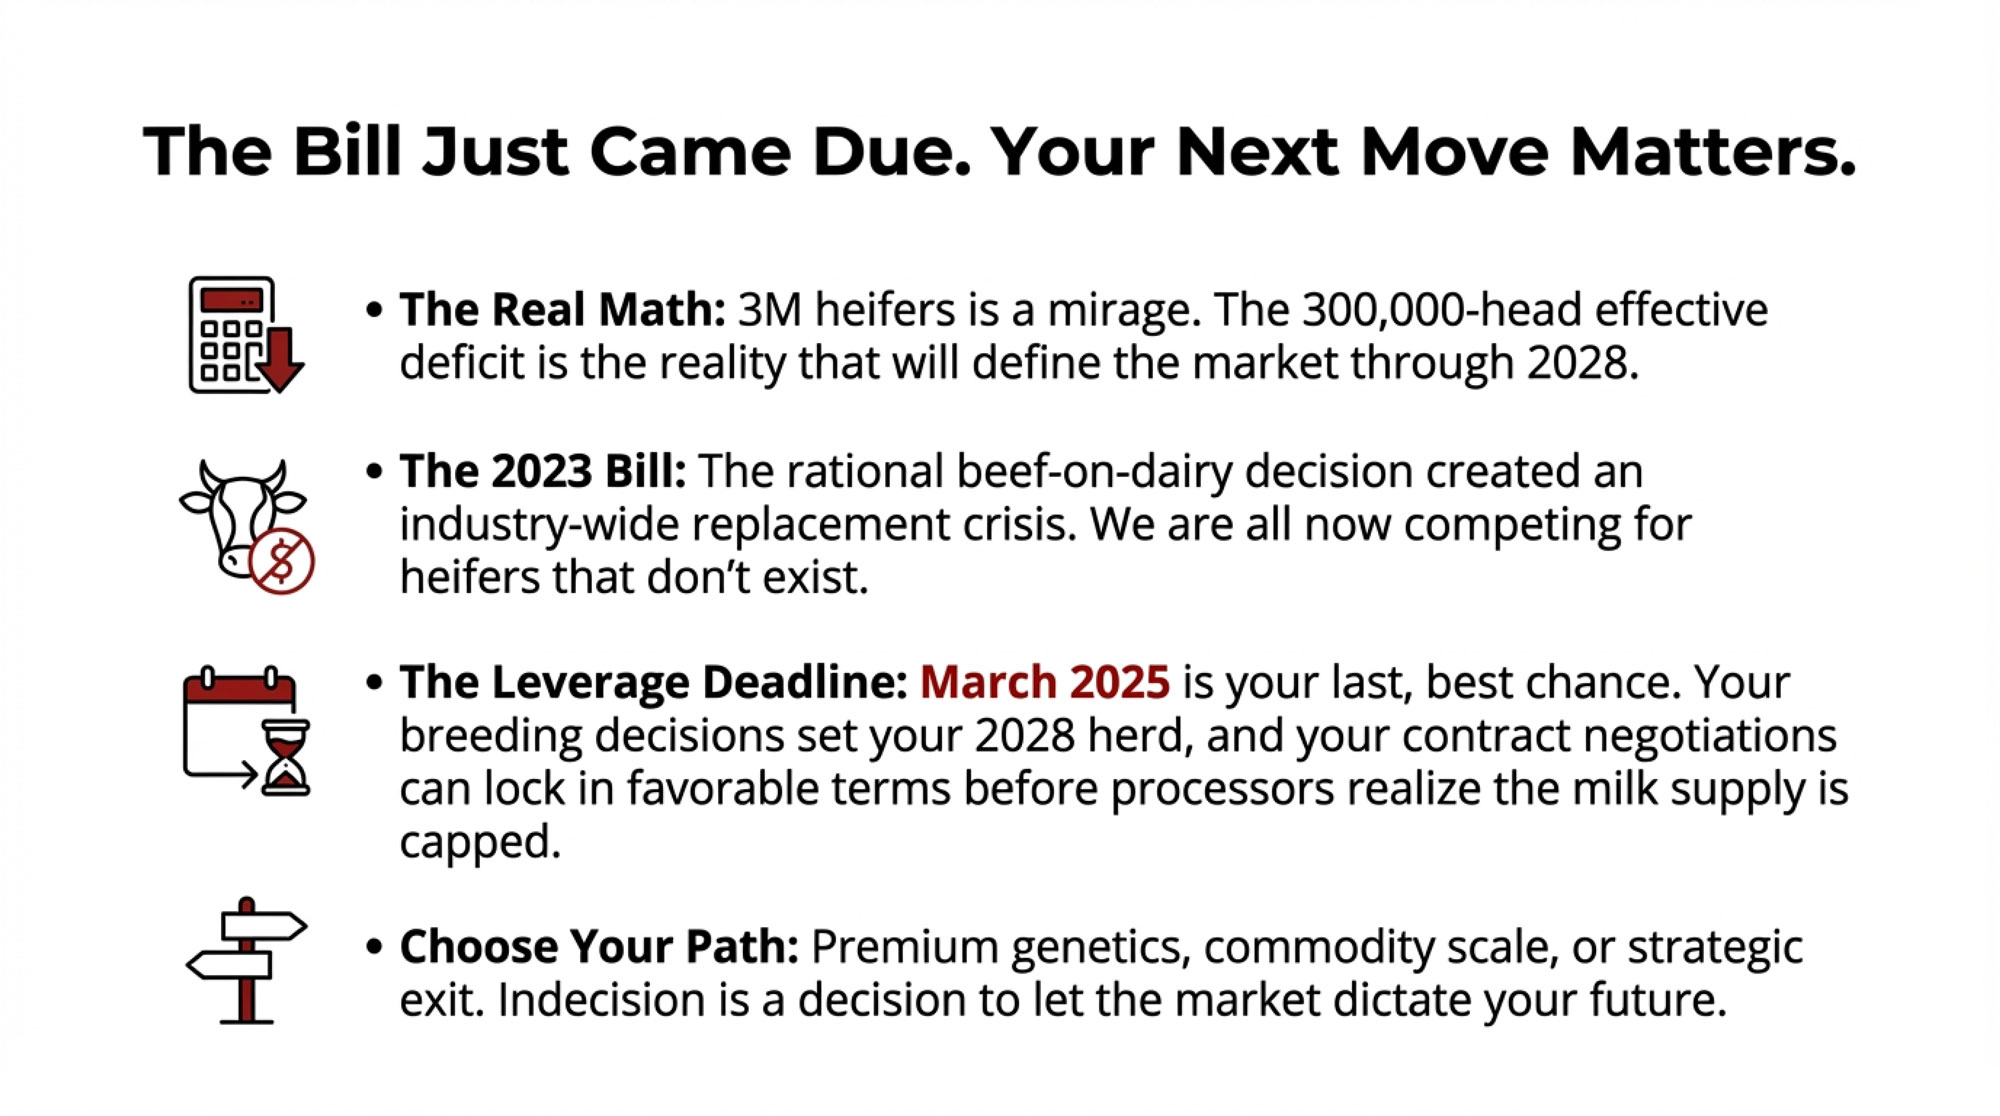
Key Takeaways:

  • The Math That Matters: 3M Heifers → 2.5M Actual Replacements — Mortality and breeding failures eliminate 500,000 head before production. Industry needs 2.82M to maintain the current herd. That 300K shortfall determines who’s still milking in 2028.
  • The Beef-on-Dairy Bill Just Came Due — In 2023, 50-60% of farms made the rational call to breed beef genetics. That 30-month lag is now hitting—and we’re all competing for replacements that don’t exist.
  • Current Production Is Borrowed From Future Herd Health — Today’s 2% gains come from delaying culls, not improving genetics. This strategy has 12-18 months before older cow health issues force the reversal you can’t afford.
  • 90-Day Convergence: March 2025 Is Your Leverage Deadline — Breeding decisions now determine your 2028 herd composition. Contract negotiations now lock multi-year pricing. Both windows close when processors realize supply is tight—likely Q3 2025.
  • Three Paths Forward, One Window to Choose — Premium genetics: target $300K-600K in component premiums. Commodity scale: maximize beef calf revenue, buy replacements. Strategic exit: time sale for 2027-2028 peak. Decision deadline: March 2025.

Complete references and supporting documentation are available upon request by contacting the editorial team at editor@thebullvine.com.

Learn More

The Sunday Read Dairy Professionals Don’t Skip.

Every week, thousands of producers, breeders, and industry insiders open Bullvine Weekly for genetics insights, market shifts, and profit strategies they won’t find anywhere else. One email. Five minutes. Smarter decisions all week.

NewsSubscribe
First
Last
Consent

Your Lender’s Already Doing the Math: The 45-Day Survival Guide for Mid-Sized Dairy Operations

With $11 billion in new processing capacity reshaping the industry and loan renewals looming, the decisions you make before February will echo for years

EXECUTIVE SUMMARY: Your lender is already running the numbers on your 2026 renewal—and if you haven’t done the same math, you’re starting from behind. With Class III futures stuck in the mid-$15s and real production costs running $19-21/cwt, the margins that looked workable 18 months ago have evaporated for many mid-sized operations. This isn’t a typical price cycle. It’s an industry restructuring: $11 billion in new processing capacity is creating a two-track system where large operations lock in premium contracts while mid-sized farms compete in tightening commodity markets. Heifer inventories have hit a 47-year low, genetic indexes have shifted hard toward components, and analysis suggests 2,100-2,800 dairies in the 200-700 cow range could exit by late 2026. But exit isn’t inevitable for those who move now. The producers who’ll still be milking in 2030 are making decisions this month: locking in risk protection, aligning genetics with where the premiums are heading, and walking into their banker’s office with a plan—not waiting to be handed one.

There’s a conversation happening in bank offices and kitchen tables across dairy country right now, and it deserves more attention than it’s getting. Drawing on exit-rate data and economic analysis from sources like UW-Madison’s Center for Dairy Profitability, the pattern suggests somewhere between 2,100 and 2,800 mid-sized dairy operations could leave the industry by the end of 2026. We’re talking farms running 200 to 700 cows—operations that, in many regions, still form the backbone of rural dairy communities.

What strikes me about this moment is how many of the farms facing pressure aren’t the ones you’d expect. I talked with a producer in central Wisconsin running 400 cows—solid genetics, modern parlor, experienced management team. On paper, everything looks right. Yet he’s facing the same margin squeeze as operations half his size. These aren’t dairies with obvious management problems or run-down facilities. Many are well-run operations with experienced owners who’ve weathered tough cycles before.

The difference this time feels structural. And understanding that distinction matters quite a bit for anyone figuring out their next move.

The Financial Conversations Already Underway

If you’re preparing for a January loan renewal, your lender’s probably already started their internal review. What’s particularly noteworthy is how the debt service coverage ratio has become the defining metric in these conversations.

Here’s what I’m generally seeing in terms of how lenders sort operations: A DSCR above 1.25 usually means straightforward renewal—your file moves through without much scrutiny. Between 1.0 and 1.25, you’re in monitoring territory. Renewal’s likely, but expect closer attention and perhaps some questions about your forward plan. Drop below 1.0, and restructuring discussions typically begin. Below 0.85? That’s when exit conversations often follow.

Quick Reference: DSCR Threshold Guide

Your DSCRWhat It Typically MeansYour Next Step
Above 1.25Standard renewal likelyDocument your forward plan anyway
1.0 – 1.25Monitoring status; closer scrutinyPrepare detailed 2026 projections
Below 1.0Restructuring discussions likelyInitiate conversation proactively
Below 0.85Exit planning often beginsExplore all options with the advisor

Why does this matter right now? Because the window between comfortable and concerning has narrowed considerably.

Tom Kriegl spent roughly 30 years with UW-Madison’s Center for Dairy Profitability, and he’s seen these cycles play out many times. The reality is that conversations change pretty quickly once you cross that 1.0 threshold. Lenders aren’t looking to push anyone out—that’s not the goal—but they have risk parameters they need to work within. The earlier a producer engages in that conversation, the more options tend to be available.

Here’s the uncomfortable truth: farms are sliding across these thresholds faster than anyone predicted—and most don’t realize it until their banker calls first. Mark Stephenson, who directs dairy policy analysis at UW-Madison, has observed that margins have compressed faster than many producers anticipated. Farms that looked comfortable 18 months ago are finding themselves in very different territory.

The math behind this is pretty unforgiving. With Class III futures for early 2026 trading in the mid-$15 range on the CME, and FINBIN data showing direct production costs around $16.25-16.43/cwt—with total costs including overhead running $19-21/cwt depending on operation size and efficiency—there’s essentially nothing left for debt service after covering basic costs for many mid-sized operations. While $19-21/cwt is the benchmark, your specific ‘lifestyle cost’ and ‘unpaid labor’ are the silent killers of your DSCR.

Checklist for Your Banker Meeting

Before you sit down for that loan renewal conversation, make sure you can answer these questions:

  • [ ] What’s your actual cost of production per hundredweight? (Include everything—labor, family living, depreciation)
  • [ ] What’s your current DSCR, and what was it 12 months ago?
  • [ ] What percentage of your 2026 production is forward-contracted or covered by DRP?
  • [ ] What are your bulk tank components, and how do they compare to premium thresholds?
  • [ ] What’s your breeding program producing—volume or components?
  • [ ] Do you have a written 12-month action plan addressing margin pressure?
  • [ ] What’s your heifer inventory worth at current replacement prices ($3,010/head)?

Walk in with these numbers ready. Your lender will respect the preparation—and you’ll have better leverage in the conversation.

Why Your DMC Margin Doesn’t Match Your Checkbook

One thing that keeps coming up in conversations with producers is the disconnect between what their Dairy Margin Coverage statements show and what their checkbooks tell them. This isn’t a knock on the program—DMC was designed as a baseline safety net, and it’s served that purpose well for many operations. But understanding its limitations matters right now.

Here’s the issue. The DMC formula calculates margin as milk price minus feed costs, with feed costs limited to corn, soybean meal, and alfalfa hay, based on USDA Agricultural Marketing Service prices. Penn State’s extension dairy team has analyzed how much this approach misses in terms of actual operating expenses.

Labor costs generally run $2.00-3.00/cwt, depending on herd size and region—that’s not in the DMC calculation at all. Neither are facility and equipment costs, which add another $1.50-2.00/cwt. Then you’ve got cooperative deductions running maybe fifty cents to a dollar per hundredweight, plus the accumulated weight of utilities, vet bills, breeding costs, supplies… it adds up fast.

Danny Munch, an economist with the American Farm Bureau Federation, put it plainly in a recent interview: when crop prices are low, the DMC formula using those low prices “makes the milk margin under the DMC program look really high, and none of the triggers over that $9.50 margin are triggered.”

So when recent DMC calculations show margins above $10.50/cwt, the actual farm-level margin after everything might be $3.50-4.50/cwt. That’s the number that determines whether you renew or restructure. And trust me—your banker’s already calculated it. The gap between those two figures explains much of the frustration I’m hearing from producers who feel the safety net isn’t quite reaching them.

The Two-Track Dairy Industry: Where Does Your Operation Fit?

Here’s something I think we need to talk about directly: we’re watching more of a two-track industry develop, and which track you end up on will largely be shaped by decisions made in the next 12-18 months.

The International Dairy Foods Association reported in October that processors have invested a record $11 billion in new and expanded manufacturing capacity across 19 states—more than 50 individual building projects between 2025 and early 2028. That’s an enormous bet on American dairy’s future, and it signals real confidence in the sector’s long-term prospects.

But here’s what I find myself thinking about: much of this new capacity is being tied directly to large, consistent milk suppliers. In many cases, those are very large dairies with direct supply relationships. Now, cooperatives remain major owners and partners in processing—that’s important to note—but the pattern many of us see emerging is one in which the largest operations have greater direct access to premium outlets.

On one track, you’ve got large operations, typically running 1,500 to 4,000-plus cows, positioning themselves with direct supply contracts to these new facilities. Chobani broke ground in April 2025 on a $1.2 billion, 1.4 million-square-foot plant in Rome, New York. Coca-Cola announced a $650 million Fairlife facility in Webster back in 2023. Saputo’s expansion in Barron, Wisconsin, continues to add capacity. These processors need consistent, high-component milk in large volumes, and they’re signing multi-year agreements with operations that can deliver it.

What do those contracts look like? Based on conversations with cooperative leaders and industry contacts, we’re often seeing locked pricing in the $17.50-18.50/cwt range, with component premiums of $0.75-1.50/cwt for elevated butterfat and protein, plus quality bonuses for meeting specifications. Three- to five-year terms that provide real planning certainty.

The second track is everyone else—and that’s where most cooperative members find themselves. The remaining operations selling through cooperatives or spot markets at whatever price commodity trading sets. For many of these farms, realized prices of $14.75-15.75/cwt after deductions fall below the total cost of production.

Contract FeatureTrack 1: Large Operations with Direct Processor SupplyTrack 2: Mid-Sized Operations via Cooperative Commodity Markets
Typical Herd Size1,500 – 4,000+ cows200 – 700 cows
Base Price ($/cwt)$17.50 – $18.50 (locked multi-year)$14.75 – $15.75 (commodity-linked, variable)
Component Premiums$0.75 – $1.50/cwt for >4.0% butterfat, >3.3% protein$0.15 – $0.40/cwt (varies widely by co-op)
Contract Term3 – 5 years with pricing certaintyMonth-to-month or annual; minimal forward visibility
Quality Bonuses$0.25 – $0.50/cwt for meeting specifications (SCC, bacteria)Included in base or minimal additional
Realized Price After Deductions$18.50 – $20.25/cwt$14.75 – $15.75/cwt
Processor RelationshipDirect supply agreements with Chobani, Fairlife, Saputo, etc.Cooperative pools with multiple commodity buyers
Volume RequirementHigh; consistent large volume requiredFlexible; but no guaranteed premium outlet access

Now, I’m not saying cooperatives are failing their members—many co-ops have invested heavily in component-focused processing and are building strong relationships with premium buyers. But I am saying that some cooperatives have been more aggressive than others in positioning for this new reality, and their members are starting to see different outcomes as a result.

We explored some of these dynamics in our recent piece on the Lactalis 270-farm cuts—and the pattern holds: the dairies surviving aren’t necessarily the biggest, but they’re the ones who positioned earliest

What Cooperative Members Should Be Asking

For the majority of mid-sized operations shipping through cooperatives, the important question is this: What is your cooperative doing to position members for premium markets?

The good news is that some cooperatives have made significant moves. Land O’Lakes has invested substantially in butter capacity and component-focused products. Dairy Farmers of America has expanded its cheese processing operations across multiple regions. Several regional cooperatives in the Upper Midwest have built relationships with specialty cheese manufacturers that pay meaningful component premiums to their members. These are real examples of cooperatives adapting to where value is heading.

But not every cooperative has moved at the same pace. Edge Dairy Farmer Cooperative has been vocal about the need for federal milk pricing reform, and NMPF continues working on federal order modernization. The debate about how cooperatives should adapt is very much alive in the industry right now.

Questions worth raising at your next meeting or in conversations with your field rep:

  • Component premiums: Does your cooperative offer meaningful premiums for high-component milk, or is pricing still primarily volume-based? What are the actual qualification thresholds, and how do they compare to what direct-supply operations are reportedly getting?
  • Processing investments: Has your cooperative invested in component-focused processing capacity, or is it primarily in fluid milk and commodity manufacturing?
  • Premium program access: What percentage of member milk is currently going to premium outlets versus commodity markets? Is that number increasing or decreasing?
  • Forward pricing options: What risk management tools does the cooperative offer, and how do they compare to Dairy Revenue Protection or other alternatives?
  • Equity timeline: For operations considering exit, what’s the realistic timeline and process for equity redemption—not just the official policy, but what’s actually happening?

The producers I’ve talked with who feel most confident about their cooperative relationship are the ones asking these questions in board meetings, not just accepting the quarterly newsletter. If your cooperative leadership can’t give you straight answers, that’s worth knowing.

47-Year Heifer Shortage: Hidden Leverage for Mid-Sized Dairies

Here’s something that doesn’t get enough attention in these financial discussions: we’re looking at replacement heifer numbers we haven’t seen in nearly half a century.

USDA’s January 2025 Cattle report puts dairy replacement heifers at 3.914 million head—the lowest level since 1978. That’s a 47-year low, and this matters quite a bit if you’re thinking about herd management decisions right now.

CoBank’s August 2025 analysis projects heifer inventories will shrink by an estimated 800,000 head over the next two years before beginning to rebound in 2027. The primary driver? Beef-on-dairy breeding trends that, you probably know this already, have fundamentally changed how many operations approach their breeding programs. The economics made sense when beef-cross calves were commanding substantial premiums—and for many operations, they still do. But the cumulative effect on replacement availability is now showing up in a meaningful way.

What this means for you: dairy replacement heifer prices have soared to historic levels, reaching $3,010 per head in July 2025—a 164% jump from the April 2019 figure of $1,140. I spoke with a Northeast producer last month who’s postponing an expansion specifically because heifer acquisition costs have thrown off his entire capital plan. For operations considering growth, that’s a significant barrier. For those considering exit strategies… well, your heifer inventory may be worth considerably more than you realize. Before you sell into this historic heifer market, consult your tax advisor; that ‘hidden leverage’ can quickly turn into a significant capital gains liability if not handled via a 1031 exchange or debt retirement strategy.

It’s worth noting that this heifer shortage creates a natural floor under herd liquidation decisions. Even if a producer decides to exit, the replacement economics make it attractive for other operations to absorb those animals rather than let them go to beef markets. That’s worth factoring into your decision.

The Genetics Game Has Changed—Are You Playing the Right One?

This is where I want to get specific, because genetics is where mid-sized operations can actually compete—if they’re making the right breeding decisions.

The Council on Dairy Cattle Breeding implemented major changes to the Net Merit index in April 2025, and the shifts tell you exactly where the industry is heading. According to USDA-ARS documentation on the 2025 revision, the emphasis on butterfat increased from 27% to nearly 32%, while protein emphasis dropped from about 20% to 13%. Feed efficiency emphasis jumped significantly, with Feed Saved moving from 12% to nearly 18% of the index.

Here’s what that means in plain language: bulls that looked like the right choice five years ago may not match where the money is today.

The demand side has shifted substantially. For roughly 30 years, breeders focused heavily on protein content. But now there’s strong demand for higher-fat cheese, Greek yogurt, and premium ice creams. Fat in milk isn’t considered a negative anymore—it’s where the premiums are.

The result? Holstein Association USA staff have noted in industry interviews that genetic trends for milk, fat, and protein production are extremely favorable, and that average herd butterfat has increased toward 4% as breeders respond to higher-value fat markets.

Trait CategoryNet Merit Emphasis (Pre-April 2025)Net Merit Emphasis (April 2025 Revision)ChangeWhy It Matters for Your Milk Check
Butterfat %27%32%+5 pointsGreek yogurt, premium ice cream, high-fat cheese demand; premiums now $0.75-1.50/cwt for >4.0% butterfat
Protein %20%13%-7 pointsStill valuable, but market shifted toward fat; protein premiums plateaued
Feed Saved (Efficiency)12%18%+6 pointsAt $16.25/cwt feed costs, efficiency directly impacts margin; most overlooked trait
Milk Volume (lbs)~24%~22%-2 pointsVolume without components = commodity pricing; less emphasis reflects market reality
Health & Fertility Traits~17%~15%-2 pointsStill important but slightly de-emphasized relative to production efficiency
Overall Base Change2020 baseline2025 baseline45-lb butterfat rollback, 30-lb protein rollbackLargest genetic base change in Holstein history; your “average” bulls are now above-average

If you’re still selecting bulls primarily based on TPI or NM$ without considering the component breakdown, you might be optimizing for yesterday’s market.

For operations selling into cheese markets—which is where most of the premium processor demand is heading—Cheese Merit (CM$) deserves serious consideration. It places more weight on protein yield and milk quality traits that affect cheese production. Fluid Merit (FM$) emphasizes volume and butterfat for fluid milk operations, while Grazing Merit (GM$) focuses on fertility and adaptability for pasture-based systems. 

The practical question: What’s your bulk tank butterfat running right now? If you’re at 3.7% and premium contracts require 4.0%, that’s not a gap you can close with feed changes alone. That’s a breeding program shift that takes 18-24 months to show up in the tank. Which means the decisions you make right now determine your position in the component in 2027.

A CoBank dairy economist noted that when CDCB reset its genetic base in April 2025, Holsteins experienced the largest base change in their history—a 45-pound rollback in butterfat and a 30-pound rollback in protein. That’s substantial genetic progress that’s already showing up in bulk tanks across the country for operations that positioned early.

Chad Dechow, who’s been studying dairy cattle genetics at Penn State for more than two decades, wrote in Hoard’s Dairyman that these component gains represent “unprecedented” genetic progress. The question isn’t whether genetic progress is real—it is. The question is whether your breeding program is capturing it, or whether you’re paying for yesterday’s genetics while your neighbors cash tomorrow’s premiums.

Regional Dynamics Worth Noting

One thing I should mention: these pressures don’t hit every region the same way, and the solutions vary accordingly.

In Wisconsin and Minnesota, you’ve got different cooperative structures and processor relationships than in the Southwest. Many Midwest producers report that their cooperative relationships—while perhaps not offering the premium pricing of direct processor contracts—provide stability and market access that shouldn’t be undervalued in uncertain times.

California’s regulatory environment and water costs create their own distinct challenges. I’ve talked with producers in the Central Valley who are navigating pressures that simply don’t exist in other regions—environmental compliance costs, groundwater restrictions, labor market dynamics. Their calculations look quite different.

The Northeast, with new processing capacity coming online in New York, presents both opportunity and competitive pressure. Operations positioned to supply these facilities may find themselves with options that didn’t exist two years ago. Others may feel squeezed by changing milk shed dynamics.

What works in one region may not translate directly to another. The fundamentals I’m describing apply broadly, but the specific options available to any individual operation depend heavily on local processor relationships, cooperative membership, and regional market access. That’s worth keeping in mind as you evaluate your own situation.

Global Market Headwinds

And then there’s what’s happening internationally—because global markets affect domestic prices more than many producers realize.

Rabobank’s analysis shows China’s whole milk powder imports have essentially collapsed—from a 2018-2022 average of 670,000 metric tons down to just 430,000 metric tons in 2023. While data for 2024 and 2025 are still developing, the USDA’s December World Agricultural Supply and Demand Estimates don’t offer much hope for a recovery in 2026.

Why is this significant? When major importers pull back, that surplus milk has to go somewhere—and it often ends up pressuring domestic commodity markets. The U.S. dairy industry has become increasingly export-dependent over the past decade, creating opportunities in good times and exposure when global demand softens.

This builds on what we’ve seen in previous cycles, though the scale of China’s domestic production growth adds a new dimension. Chinese dairy production has expanded significantly, reducing their import needs in ways that may prove structural rather than cyclical. That’s something worth watching as you think about longer-term market positioning.

What’s Working for Operations That Are Gaining Ground

Talking with producers and advisors who are navigating this successfully, a few common threads keep emerging. These aren’t silver bullets—every operation is different—but they’re worth considering.

Risk management positioning stands out. Operations that locked forward contracts on 40-60% of their 2026 milk production during the third and fourth quarters of this year—when prices were more favorable—have built meaningful protection. Tools such as Dairy Revenue Protection, cooperative forward contracting programs, and managed futures strategies are attracting serious attention from mid-sized operations that historically avoided them.

The arithmetic works out clearly: say you’ve got a 500-cow dairy producing around 15 million pounds annually—that’s roughly 150,000 cwt if you’re running good production. If you locked 50% of that at $17.50/cwt while spot prices drop to $15.50/cwt, your blended realized price comes out around $16.50/cwt. On that volume, you’re looking at roughly $150,000 in protected margin compared to selling everything at spot. Not enough to transform a struggling operation, but meaningful—and potentially the difference between a straightforward renewal conversation and a difficult one.

The Path Forward

So, where does this leave the mid-sized producer facing a January loan renewal? A few thoughts, offered with the recognition that every operation’s situation is unique.

  • Know your numbers cold. Not just your DMC margin, but your actual cost of production, including every line item—labor, repairs, depreciation, family living, debt service. Your banker certainly will. Walking into that conversation with a clear-eyed understanding of your breakeven and your path to profitability changes the dynamic considerably.
  • Explore risk management now. If you haven’t looked at forward contracting or Dairy Revenue Protection for 2026 production, the window is closing. Talk to your cooperative, your risk management advisor, or your extension specialist this week—not next month. Even partial coverage changes your risk profile in ways lenders recognize.
  • Get your genetics aligned. Pull your bull lineup and look at the component breakdown—not just TPI or NM$, but fat and protein PTAs specifically. If you’re selling into cheese markets, Cheese Merit deserves a hard look. If your bulk tank is running below 4.0% butterfat, you need to understand why and whether your breeding program is moving you in the right direction.
  • Engage your lender proactively. Don’t wait for your banker to start the conversation. If you’re anywhere near that 1.0 DSCR threshold, being proactive about discussing your situation—with documentation showing how you’re addressing challenges—puts you in a much stronger position than waiting to react. Lenders appreciate producers who demonstrate awareness and planning, even when the numbers are tight.

Resources for Further Planning

  • FINBIN benchmarking datafinbin.umn.edu — Compare your cost of production against regional benchmarks
  • DMC decision toolsfsa.usda.gov/dmc — Current margin calculations and program information
  • Dairy Revenue Protection: Contact your crop insurance agent or visit rma.usda.gov
  • CDCB genetic toolsuscdcb.com — Merit index details and trait information
  • Extension support: Your state’s land-grant university extension service offers one-on-one consultations with a dairy specialist. In Wisconsin, contact the Center for Dairy Profitability at UW-Madison. In Pennsylvania, reach out to Penn State Extension’s dairy team. In New York, Cornell PRO-DAIRY provides similar support. Most states have dedicated dairy extension specialists—a quick search for “[your state] dairy extension” will connect you with local expertise.

The Bottom Line

The producers who come through this transition in strong shape won’t be the ones who waited to see how things played out. They’ll be the ones who moved thoughtfully—but moved first. For those willing to adapt—to get serious about risk management, genetics, and understanding where your cooperative fits in this changing landscape—there’s a path through this. But it requires honest assessment, timely action, and a willingness to ask good questions of the people and organizations you’re working with.

KEY TAKEAWAYS

  • Your banker’s already running the numbers. If your DSCR is approaching 1.0, start the conversation now—waiting until they call means fewer options.
  • This isn’t a downturn—it’s a restructuring. $11 billion in new processing capacity is sorting the industry into two tracks: premium contracts for large suppliers, commodity pricing for everyone else. Know which track you’re on.
  • Your heifer inventory is hidden leverage. At $3,010/head and a 47-year supply low, replacement value changes the math on every scenario—expansion, contraction, or exit.
  • Genetics have pivoted to components. Has your program? Net Merit 2025 pushed butterfat emphasis to 32%. If your tank runs 3.7% while premiums start at 4.0%, you’re leaving money in the bulk tank.
  • The producers still milking in 2030 are making moves now. Lock in risk protection, realign your genetics, and walk into your lender’s office with a plan—not waiting to be handed one.

Complete references and supporting documentation are available upon request by contacting the editorial team at editor@thebullvine.com.

Learn More

The Sunday Read Dairy Professionals Don’t Skip.

Every week, thousands of producers, breeders, and industry insiders open Bullvine Weekly for genetics insights, market shifts, and profit strategies they won’t find anywhere else. One email. Five minutes. Smarter decisions all week.

NewsSubscribe
First
Last
Consent

The Triple Cushion Trap: Why 2025’s Strong Margins Won’t Save You in 2026

Three things propping up your dairy. All temporary. The window to reposition closes in weeks, not months.

Executive Summary: Three temporary forces are keeping mid-size dairies profitable: beef-on-dairy premiums, cheap feed, and strong margins. All three face pressure by late 2026. Here’s the structural problem underneath: the U.S. herd has grown to 9.58 million head—highest since 1993—while only 2.5 million heifers are expected to calve in 2025, the lowest in 22 years of USDA tracking. Producers are stretching the cow productive life to cover the gap. That strategy has a ceiling, and we’re approaching it. When the cushions deflate, operations with costs above $20/cwt face margin compression that could erase six figures annually. The window to act—contract review, strategic herd adjustment, revenue diversification—is weeks, not months.

Something unusual is happening in U.S. dairy right now. Mid-size operations are stacking up real financial advantages from multiple directions at once—beef-on-dairy premiums, cheaper feed, and risk management support all landing in the same year. We haven’t seen this kind of alignment since around 2014.

That’s the good news.

Here’s what should concern you: three temporary economic cushions are masking a structural transformation that will reshape this entire industry. The producers who understand what’s actually happening—and position now—will come out ahead. Those who don’t may find out the hard way that 2025’s profits were a trap.

The Three Cushions (And Why They Won’t Last)

Cushion #1: Beef-on-Dairy Revenue

The beef-cross breeding revolution has fundamentally changed calf economics. Market experts like Mike North of Ever.Ag report some beef-on-dairy calves bringing close to $1,000 just a few days after birth—a world away from the often double-digit prices traditional dairy bull calves have brought in many markets over the years.

For a 500-cow operation running a meaningful percentage of beef breedings, that’s tens of thousands of dollars in additional annual revenue that simply didn’t exist five years ago.

“Those beef calves are paying my property taxes and then some.” — Wisconsin dairy producer

Why do these premiums exist? Simple supply and demand. USDA’s January 2025 Cattle Inventory Report shows total cattle at 86.7 million head—the lowest since 1951. Beef cows were at about 27.9 million, the fewest since 1961. When feeder cattle supplies are this tight, dairy-beef crosses fill a real gap.

The part that can sneak up on you: Canadian and U.S. cattle market outlooks in 2025 point to the early stages of beef herd rebuilding, with some analysts expecting modest beef cow number increases to start showing up in 2026. When that happens, feeder prices will likely soften. Your high-value beef calves may not stay quite so high-value.

Cushion #2: Cheap Feed

What’s encouraging on the cost side: USDA’s August 2025 DMC calculations showed feed costs at $9.38 per hundredweight—the lowest since October 2020. Corn’s been averaging around $4.00 per bushel based on the USDA’s recent estimates. That puts feed at roughly 45% of the milk check versus the 50-55% range that usually squeezes margins hard.

As recent USDA-based reports have highlighted, premium alfalfa has ranged from about $175 per ton in Idaho to around $380 per ton in Pennsylvania, depending on region and quality. If you’re in a favorable feed region, you’re feeling some real breathing room right now.

What could change: Any return to $5.00-plus corn—and remember, we saw that as recently as 2022—would add meaningful cost back to your operation. For a mid-size dairy, we’re talking six figures in additional annual expense. Weather remains the wildcard nobody can predict.

Feed costs are low—until they aren’t. Corn at $4.00/bushel in 2025 feels stable, but the 2021–22 spike above $6.50 cost a 350-cow operation over $120,000 in additional annual expense. The window to build working capital reserves closes fast when everyone realizes the risk at the same time.

Cushion #3: DMC Payments

Dairy Margin Coverage provided solid support through 2024 and into early 2025. With margins now above the $9.50 trigger at standard coverage levels, payments have become more intermittent.

Worth remembering: DMC is insurance, not income. When margins compress, the safety net helps—but it won’t save an operation that’s structurally unprofitable at the cost levels it’s running.

The Paradox: How Do You Grow a Herd While Running Out of Replacements?

Here’s what should keep you up at night.

The U.S. dairy herd has grown to about 9.58 million head according to the USDA’s October 2025 Milk Production Report—the highest since 1993. Meanwhile, replacement heifer inventory has fallen to 3.914 million head, the lowest since 1978.

The Replacement Crisis: Record Herd, Historic Low Heifers

And the number that really matters: only 2.5 million heifers are projected to calve in 2025—the lowest in the 22-year history of USDA tracking this metric.

The math doesn’t work long-term. Producers everywhere are extending cow productive life to cover the gap—keeping older, proven cows in the milking string rather than cycling through replacements. USDA reports replacement cow prices up 29% year-over-year to $2,660 per head in January 2025.

That strategy has a ceiling. We’re approaching it.

Real Numbers From a Working Operation

Meet “Heartland Family Dairy”—a composite I’ve put together based on conversations with producers across Wisconsin and Pennsylvania. 350 cows, second-generation, parents approaching retirement.

MetricTheir Numbers
Milk revenue$1.65 million/year at $20.50/cwt
Beef-cross calf revenue$35,000-40,000
Operating costs$20.48/cwt
Annual debt service$175,000
Working capital6-8 weeks

On paper, they’re breaking even. The cushions are keeping them viable.

The question: What happens when beef premiums slip? When feed costs spike? When milk prices compress?

If multiple cushions deflate at once—and that’s entirely plausible for 2026-2027—operations running costs above $20/cwt are going to feel real pressure. The kind of pressure that forces hard decisions.

The Benchmarks That Separate Survivors From Everyone Else

Jason Karszes, the dairy farm management specialist with Cornell University’s PRO-DAIRY program, has been studying profitability patterns for years. His finding that sticks with me most:

A well-managed 150-cow dairy in the top profitability quartile often earns more annual profit than a poorly-managed 500-cow dairy in the bottom quartile—sometimes by $100,000 or more.

Scale matters. Management matters more. That’s actually encouraging if you think about it.

Where Do You Stand?

Survivor ZoneDanger Zone
Operating costs below $18.50/cwtOperating costs above $20.00/cwt
Labor efficiency 50+ cows/FTEBelow 45 cows/FTE
Production 26,000+ lbs/cowBelow 24,000 lbs
Cull rates 30-33%Above 38%
Debt-to-asset below 50%Above 60%
Working capital 6+ monthsBelow 3 months

Component optimization matters too. USDA’s November 2025 data shows butterfat at $1.71 per pound, protein at $3.01 per pound. Butterfat has come down from the highs we saw in late 2023, but current component prices still reward higher butterfat and protein performance. Top-component herds consistently see a noticeably higher milk check per cow than herds running average components—money that doesn’t depend on base milk price.

Performance TierButterfat %Protein %Annual Revenue/Cow
Average herd3.80%3.05%$4,510
Above-average herd4.10%3.25%$4,685
Top-quartile herd4.40%3.50%$4,875

Operations hitting these benchmarks can weather significant margin compression. Those falling short face difficult decisions regardless of herd size. That’s the terrain we’re all working with now.

Three Moves to Make Before Year-End

The coming weeks offer a window for strategic repositioning. Here’s what I’m hearing from advisors, lenders, and producers who’ve navigated tough cycles before.

Move #1: Get Your Milk Contract Reviewed

Cost: $1,500-$3,000 for a professional review. ROI: Avoiding liability exposure that could cost you many times that amount.

Before December 31, verify:

  • Written volume guarantees with clear pricing formulas
  • Liability caps at reasonable levels
  • Termination provisions with 60-90 day notice minimums
  • Whether coordinating with neighbors creates negotiating leverage

Verbal understandings don’t hold up when things get tight. An agricultural attorney familiar with dairy contracts will spot issues you’ll miss.

Move #2: Run the Numbers on Strategic Herd Reduction

This feels counterintuitive. Hear me out.

Cull cow prices are near record levels—USDA-based forecasts suggest 2025 average prices around $145 per cwt, following a record annual average near $127 per cwt in 2024. Replacement heifers averaging $2,660 per head. A 400-cow operation reducing to 300 head can generate substantial cull revenue while improving per-cow profitability and labor efficiency.

A producer in Pennsylvania described it to me as “right-sizing rather than downsizing.” She dropped from 280 to 220 cows. Net income actually improved because labor costs fell faster than revenue.

This isn’t a retreat. It’s repositioning—setting yourself up to rebuild selectively when heifer prices moderate, probably sometime in 2027-2028 if current trends continue.

Move #3: Diversify Revenue Streams

Operations capturing additional value through beef genetics contracts, component premiums, and quality programs are building resilience that pure commodity producers don’t have.

Options worth exploring:

  • Direct relationships with feeders for documented-genetics calves (premium pricing for known sires and health records)
  • Component value pricing from processors paying separately on butterfat and protein
  • Quality premiums through SCC management and milk quality certifications

For Heartland Family Dairy, executing two of these three moves could shift their position from “surviving on cushions” to “sustainable regardless of market conditions.”

The Performance Factor Nobody Talks About

Here’s something the spreadsheets miss: you can’t manage a 500-cow herd effectively if you’re burning out.

Research led by Dr. Andria Jones-Bitton at the University of Guelph has documented that farmers experience significantly elevated stress, anxiety, depression, and burnout compared to the general population. The 3 a.m. payment worries, the strain on marriages, the guilt about whether to encourage the kids toward this business or away from it—this isn’t just personal. It’s a management problem.

Burned-out operators make worse decisions. They miss the cull that should have happened. They defer maintenance. They don’t catch the fresh cow problem early enough. Mental health directly impacts the benchmarks that determine whether your operation survives.

The business case for planned transitions: Farm transition specialists consistently report that families who plan their exits while they still have equity and control over timing preserve significantly more wealth than those forced into distressed sales. The difference can be substantial.

Both staying and exiting can be the right choices. The wrong choice is drifting into a decision you didn’t make.

The Industry in 2030

The direction is reasonably clear, even if the exact numbers aren’t. Continued consolidation. Larger operations are capturing a larger share of production. Southwest and Northern Plains are gaining ground. Traditional dairy regions in the Upper Midwest and Northeast are under ongoing pressure.

Operations that can consistently cash flow in the high teens per hundredweight generally have far more flexibility than those needing $20-plus milk just to break even—especially in a more volatile pricing environment.

Bottom Line

For operations committed to long-term dairy:

  • Audit costs against survivor benchmarks. Sub-$18.50/cwt is the target.
  • Get contracts reviewed before year-end
  • Build 12-18 months working capital
  • Run the strategic herd reduction numbers

For operations weighing options:

  • Strong cull prices and land values favor orderly transitions now
  • Have the succession conversation before a crisis forces it
  • December 2025 positioning beats mid-2026

For everyone:

  • The industry is restructuring, not just cycling
  • Decisions made in the next few months shape outcomes for years
  • Make an active choice before circumstances choose for you

The cushions won’t last. The question isn’t whether the industry restructures—it’s whether you’ll be positioned favorably when it does.

For families like Heartland Family Dairy, the next few months matter more than usual. The decisions aren’t easy. But they’re a lot easier to make while you still have choices.

“Heartland Family Dairy” is a composite based on producer conversations across Wisconsin, Pennsylvania, and other traditional dairy regions. Financial scenarios reflect real conditions facing mid-size operations in late 2025. Work with your own advisors for decisions specific to your situation.

Key Takeaways 

  • Three cushions. All temporary. Beef premiums, cheap feed, and strong margins—all face pressure by late 2026
  • The paradox nobody’s solving: Biggest U.S. herd since 1993. Fewest heifers to calve in 22 years. The math has an expiration date.
  • Know your cost. Operations above $20/cwt face real pressure when cushions deflate. Where do you stand?
  • Three moves before December 31: Contract review. Herd right-sizing numbers. Component premium strategy.
  • Weeks, not months. Reposition now while you still have choices—or react later when you don’t.

Complete references and supporting documentation are available upon request by contacting the editorial team at editor@thebullvine.com.

Learn More:

The Sunday Read Dairy Professionals Don’t Skip.

Every week, thousands of producers, breeders, and industry insiders open Bullvine Weekly for genetics insights, market shifts, and profit strategies they won’t find anywhere else. One email. Five minutes. Smarter decisions all week.

NewsSubscribe
First
Last
Consent

Weekly Global Dairy Market Recap Dec 15th, 2025: The “Wall of Milk” vs. The Heifer Shortage (Why 2025 is Different)

Every major dairy region is producing more milk—at the exact same time. That almost never happens. And prices are showing it.

Executive Summary: The world is awash in milk. The U.S., Europe, New Zealand, and South America are all growing production simultaneously—a rare alignment that almost never occurs and has crushed the Global Dairy Trade index by 4.3%, with butter plunging 12.4% in a single auction. U.S. cheese exports are setting records, yet spot cheddar sits at just $1.35/lb; America has become the world’s bargain supplier. RaboResearch analysts don’t see meaningful price recovery through 2026, given relentless production growth. But here’s the structural twist worth watching: CoBank reports dairy heifer inventories at 20-year lows, with an 800,000-head deficit baked into the system from beef-on-dairy breeding decisions made in 2022-2023. Biology may ultimately accomplish what price signals haven’t. For farmers navigating this extended trough, the priorities are clear: cost control, component premiums, and cash reserves.

2025 Dairy Market Outlook

Something unusual is happening across the global dairy landscape right now—every major milk-producing region on earth is growing production at the same time. That almost never happens. And it’s reshaping price expectations heading into 2026.

Typically, when American parlors are running full, New Zealand deals with drought. When Europe expands, South American margins collapse. But as we close out 2025, that natural counterbalancing act has broken down entirely—and the market is feeling it.

“Milk output is growing in all key exporting regions, which is not common,” explained Lucas Fuess, senior dairy analyst at RaboResearch, in a December 2025 analysis. “Typically, at least one part of the world is dealing with a limiting factor that is reducing milk growth—either weather, disease, margins, or something else. Now, the U.S., EU, New Zealand, and South America are all seeing growth—simultaneously.” 

What this means practically is that the usual relief valves aren’t working. When everyone’s producing, someone has to buy—and right now, demand simply isn’t keeping pace.

For the first time since 2018, all four major exporting regions are growing production simultaneously. Historically, drought in New Zealand or margin collapse in South America provided natural relief valves. Not this time. South America’s relentless 3.2% growth (red line) combined with New Zealand’s seasonal surge is flooding global markets—and that’s before we factor in the U.S. becoming the world’s discount cheese supplier. 

Global Dairy Trade: What the December Numbers Show

The Global Dairy Trade price index fell 4.3% at the most recent auction, with most product categories posting declines. Butter took the hardest hit—down 12.4% in a single event. Only cheddar (+7.2%), lactose (+4.2%), and buttermilk powder (+1.8%) managed gains. 

While the headline GDT index dropped 4.3%, the December auction revealed massive divergence: butter collapsed 12.4% in a single event, extending a five-month slide from May highs, while cheddar actually firmed +7.2%. This matters because it signals where global buyers see value—and where they don’t.

What strikes me about these numbers is the divergence between commodities. Butter has been sliding since May, when it reached five-year highs. Meanwhile, cheddar actually firmed at the latest auction. That kind of split tells you something important about how global buyers are thinking—they’re not avoiding dairy, they’re just getting selective about where they source it and what they’re buying.

Why U.S. Butter Became the World’s Bargain in 2025

Here’s something that deserves more attention: U.S. butter prices have sat well below European and New Zealand prices throughout all of 2025. That gap created an opportunity that global buyers noticed—and acted on.

“The US butter price has been well below the EU and NZ price throughout all of 2025,” Fuess noted. “This has driven global buyers to procure product from the US instead of other regions to recognize the value in US product.” 

John Hallo, procurement business partner at Maxum Foods, offered additional context on the New Zealand correction: “New Zealand pricing had been running at a premium from the USA/EU for four months, so I could argue their price was overinflated. Along with peak season supply of NZ fat, we have inevitably seen the correction.” 

The practical implication? That American price advantage is narrowing as global prices converge downward. Farmers who’ve been benefiting indirectly from strong export demand should watch these spreads closely heading into 2026.

U.S. Dairy Exports 2025: Record Cheese Volumes Meet Softening Spot Prices

The American export picture presents an interesting paradox. CME spot cheddar blocks closed the week of December 8-12 at $1.35 per pound, with butter averaging $1.4785/lb. Class III futures for December settled around $15.88/cwt, with Class IV hovering in the mid-$13s—hardly inspiring numbers for the milk check. (Daily Dairy Report, December 12, 2025)

And yet, U.S. cheese exports are having a record year. September shipments jumped 35% year-over-year, putting year-to-date volume at 453,076 metric tonnes. That’s already more cheese shipped abroad in nine months than in any full calendar year except 2024. The U.S. Dairy Export Council projects we’ll likely top 600,000 MT for the full year. (USDEC, December 11, 2025)

What I find telling is that we’re moving record cheese volumes at the exact moment spot prices are hitting 18-month lows. That disconnect reveals how global buyers think—they’re responding to relative value, not absolute price levels. When an American product is cheap compared to alternatives, they buy American. Simple as that.

U.S. cheese exports are on track to exceed 600,000 MT in 2025—a record—while spot cheddar sits at $1.35/lb, down nearly 30% from mid-2024 peaks. This isn’t competitive excellence; it’s competitive desperation. Global buyers are choosing American cheese because we’re cheap, not because we’re better. 

Katie Burgess, dairy market advising director with Ever.Ag raised an important concern at the Oregon Dairy Farmers Convention earlier this year: “If we can’t get the cheese exported, and we’re making a lot of it, it means we’re going to need to eat a lot more cheese.” 

What University Research Is Showing About Milk Solids

Leonard Polzin, dairy markets and policy outreach specialist at the University of Wisconsin-Madison, has been tracking something important: production efficiency gains are outpacing headline milk volume. Despite modest total production growth, calculated milk solids production has increased more substantially because butterfat and protein tests keep climbing. (UW Extension Farms, 2025 Dairy Situation and Outlook)

For context, back in 2020, the average butterfat test was 3.95% and the protein test was 3.181%. Today’s tests are running notably higher than usual. This matters because it means the industry can meet demand for milk solids more quickly than raw production numbers suggest—processors get more usable product per hundredweight than they did five years ago. 

Additionally, UW-Madison research highlights that Federal Milk Marketing Order reforms taking effect are expected to decrease the All Milk Price by approximately $0.30/cwt, with a more pronounced impact on Class III prices. (UW Extension Farms, February 2025) That’s not a dramatic hit, but it’s another headwind for margins already under pressure.

The Heifer Constraint Nobody’s Talking About Enough

Here’s what makes the current situation genuinely unusual: despite soft milk prices, there’s a structural ceiling on how fast production can actually grow. Talk to producers across the Upper Midwest, and you hear the same story—replacement heifers are scarce and expensive.

According to CoBank’s August 2025 sector analysis, U.S. dairy replacement heifer supplies have fallen to their lowest levels in twenty years. The research projects heifer inventories will shrink by approximately 800,000 head over the next two years before beginning to recover in 2027. (CoBank/Wisconsin Ag Connection, August 2025)

CoBank’s research reveals an 800,000-head deficit already baked into the system—the direct result of beef-on-dairy breeding decisions made during 2022-2023’s high beef prices. Here’s what makes this genuinely different: even if milk prices doubled tomorrow, you can’t breed your way out of a heifer shortage when the calves weren’t born three years ago. 

That 800,000-head deficit is already baked into the system based on breeding decisions made during 2022 and 2023 when beef-on-dairy crossbreeding surged. Biology dictates timing here—you can’t simply buy your way out of a heifer shortage when the calves weren’t born.

What this means practically: even if milk prices rose tomorrow and every producer wanted to expand, the replacement animals aren’t there to support rapid growth. It’s one reason why the supply response to current low prices may be slower than historical patterns would suggest—and why some analysts see eventual price support emerging from the supply side rather than demand.

The Bullvine Breeder’s Takeaway

The 800,000-head heifer deficit changes the math on your genetic inventory. Here’s what that means for breeding decisions:

  • Your heifer pen is now a gold mine. Verified high-genomic females will likely command premium prices through 2026 as processors compete for milk to fill new capacity.
  • Stop culling lightly. With replacements at 20-year lows, that “marginal” cow might be worth keeping for one more lactation.
  • Inventory as asset class. Heifers are no longer just a cost center—they’re increasingly liquid assets in a supply-constrained market.
  • Rethink beef-on-dairy. If you swung 70%+ to beef semen in 2023, review your genetic strategy immediately. The market is signaling a need for replacement purity, and premiums for verified dairy replacements are likely within 12 months.

European Dairy 2025: Less Milk, More Cheese

The EU situation offers its own set of complexities. USDA GAIN reports forecast milk deliveries at 149.4 million metric tonnes in 2025—down 0.2% from 2024. Low farmer margins, environmental regulations, and disease outbreaks continue pushing smaller producers out. 

But here’s the nuance that matters: European processors are deliberately prioritizing cheese over butter and powder. EU cheese production is forecast to rise 0.6% to 10.8 million metric tonnes, even with less total milk available. They’re making a strategic choice about where to allocate their milk supply—and cheese is winning. 

For American producers competing in export markets, this means European cheese will remain a competitive threat even as their overall milk production contracts.

New Zealand and Fonterra: Strong Collections, Cautious Outlook

New Zealand’s dairy sector continues performing well, though Fonterra’s latest forecast signals caution about where prices are heading. The cooperative narrowed its 2025/26 farmgate milk price range from NZ$9.00-$11.00 per kgMS down to NZ$9.00-$10.00 per kgMS in late November, with the midpoint dropping from NZ$10.00 to NZ$9.50. (Fonterra, November 25, 2025)

At the same time, Fonterra increased its milk collection forecast for the 2025/26 season from 1,525 million kgMS to 1,545 million kgMS—reflecting strong on-farm production conditions. Season-to-date collections through October were running 3.8% above last season. (Fonterra Global Dairy Update, November 2025)

CEO Miles Hurrell noted the cooperative has seen strong milk flows this season, “both in New Zealand and other milk-producing nations,” resulting in seven consecutive price drops at recent Global Dairy Trade events. Fonterra’s cooperative structure provides some insulation from spot-market volatility that investor-owned processors don’t enjoy, but its price guidance suggests it’s not expecting quick relief from current conditions.

China: Modest Import Recovery on the Horizon

After a brutal 17% decline in dairy imports through the first eight months of 2024, Rabobank forecasts Chinese dairy imports will improve by 2% year-on-year in 2025. Chinese farmgate milk prices have fallen to near 10-year lows, forcing herd reductions and farm exits that are constraining domestic supply. (Tridge/Rabobank, November 2024)

That said, a 2% increase helps at the margins but won’t fully absorb the global surplus on its own. The AHDB notes that most import growth is expected in the latter half of 2025 as domestic stocks weaken. (AHDB, February 2025) It’s a positive signal, not a rescue.

Feed Costs 2025: The One Clear Bright Spot

There’s genuinely good news on the cost side. March corn futures settled around $4.405/bu in mid-December, while January soybean meal closed near $302/ton. These represent meaningful relief for ration costs heading into 2026.

The catch—and there’s always a catch—is that feed savings don’t help if milk revenue falls faster. Margins are being compressed from the revenue side right now, not the cost side. Strong feed conversion efficiency and component production matter more than ever when the milk check is lean.

Cost/Revenue ComponentMid-2024 AverageDec 2025 AverageChange per Cow/Year
Corn ($/bu)$4.85$4.41-$96 (savings)
Soybean Meal ($/ton)$365$302-$142 (savings)
Total Feed Cost per Cow/Year$3,420$3,182-$238 (savings)
Milk Price per Cwt (Class III avg)$18.20$15.88-$522 (loss)
Annual Milk Revenue per Cow$4,368$3,811-$557 (loss)
Net Margin Impact (Revenue – Feed)-$319 per cow

The Price Signal That Hasn’t Triggered Supply Response

What farmers are finding, according to Fuess, is that milk prices simply haven’t dropped far enough to trigger the supply response markets typically need.

“Milk prices have declined in the US, but total dairy farmer income likely remains higher than the cost of production for most farmers, meaning there has not yet been a strong enough price signal to tell farmers to cull cows or cut production.” 

This creates a frustrating dynamic. Prices are low enough to hurt, but not low enough to force the contraction that would eventually support recovery. We may be stuck in this uncomfortable middle ground for a while—though the heifer shortage could ultimately do what price signals haven’t.

2026 Dairy Price Outlook: What Analysts Are Watching

Both Rabobank and Maxum Foods expect Europe to slip into a meaningful contraction next year, which should help ease the current oversupply.

“For the EU, there is a lag in falling farmgate price and reduction in milk production,” Hallo explained. “Coming off the back of good market conditions for farmers, the farms still produce good quantities despite falling commodity prices. This may look to correct itself mid-2026.” 

For U.S. producers, Fuess offered a more sobering assessment: “While volatility is never gone from the market, it is unlikely that US milk prices will see significant growth in 2026 due to the continually growing production.” 

Practical Considerations for Your Operation

Every farm faces different circumstances, but several themes emerge from the current market environment:

  • Cost management becomes your primary lever. With corn affordable and milk prices soft, feed efficiency and labor productivity matter enormously. Every dollar saved drops directly to the bottom line. This isn’t the time for sloppy ration management or deferred maintenance.
  • Component premiums over raw volume. High-protein, high-butterfat milk commands better prices at most plants. The Pennsylvania Dairy Producer Survey found that “increasing milk components” ranked among the highest-rated priorities across the state’s dairies in 2025. (Center for Dairy Excellence/Penn State Extension, 2025 Survey Results)Chasing volume into a surplus market amplifies the problem for everyone.
  • Beef-on-dairy revenue remains strong. With beef prices at historic highs, strategic terminal breeding can supplement dairy income while managing replacement inventory. The sustained strength in beef has made this supplementary income stream increasingly important to overall farm profitability—though it’s worth remembering that heavy beef breeding during 2022-2023 contributed to the heifer shortage now constraining expansion. 
  • Build cash reserves for an extended trough. Futures markets suggest sub-$16 Class III and sub-$14 Class IV through early 2026. That’s not a dip—that’s a prolonged soft period. Make sure your balance sheet can absorb six more months of tight margins, because the market isn’t signaling quick relief.

One important caveat: margin pressures vary significantly by region and operation size. Upper Midwest operations face different feed cost structures than Western dry-lot dairies, and component premiums differ by processor. What works for a 150-cow grazing operation in Vermont won’t necessarily apply to a 3,000-cow confinement dairy in Texas. Consult your nutritionist, your lender, and your local extension economist about your specific situation.

The Bottom Line

The global dairy market is sending a clear message: there’s more milk than buyers need right now, and sustained low prices will likely be required to rebalance supply and demand. Some analysts believe we’re approaching a floor. History suggests inflection points are notoriously difficult to call.

What’s interesting is that biology may ultimately accomplish what price signals haven’t—the 800,000-head heifer deficit documented by CoBank creates a hard ceiling on expansion that capital alone can’t override. By 2027, when $10 billion in new processing capacity needs filling, the cows to supply it may simply not exist.

Operations focused on efficiency, component quality, and cost discipline will be best positioned to weather this period—and to capitalize when conditions eventually turn.

Margin StrategyEstimated Impact per Cow/YearImplementation DifficultyWorks Best ForWhat this means
Component premium focus+$180-$320MediumAll herd sizes“Non-negotiable. Volume into a surplus is suicide.”
Feed efficiency optimization+$140-$220Low-MediumHerds >100 cows“Low-hanging fruit. Audit your ration immediately.”
Strategic beef-on-dairy+$250-$400LowHerds with replacement flexibility“Beef prices won’t save you, but they’ll soften the blow.”
Heifer inventory as asset+$150-$500HighHerds with genomic programs“Your heifer pen is now a gold mine. Stop culling verified genetics.”
Cash reserve buildingN/A (protects survival)MediumAll farms“Six months operating capital. Non-negotiable for 2026.”
Cull rate discipline+$80-$180LowHerds facing heifer shortage“That ‘marginal’ cow is worth one more lactation.”

Editor’s Note: Market data in this analysis comes from CME Group, Global Dairy Trade platform, USDA FAS reports, University of Wisconsin-Madison Extension, Penn State Extension, CoBank sector research, and industry analyst commentary from RaboResearch, Maxum Foods, and Ever.Ag (December 2025). National and regional averages may not reflect your specific operation’s circumstances. Feed and milk prices vary significantly by region, management practices, and market access.

Key Takeaways

  • Rare synchronized surplus: U.S., Europe, New Zealand, and South America are all growing milk production simultaneously—a phenomenon that almost never occurs and is crushing prices globally
  • December market snapshot: GDT index down 4.3%, butter plunged 12.4% in one auction, spot cheddar at $1.35/lb, Class III futures hovering near $15.88/cwt
  • America’s export paradox: U.S. cheese exports are setting records precisely because we’ve become the world’s cheapest supplier—though that advantage narrows as global prices converge
  • The 800,000-head constraint: Dairy heifer inventories have hit 20-year lows; this structural deficit from beef-on-dairy breeding may eventually limit supply when price signals alone haven’t
  • 2026 outlook and action items: RaboResearch sees no meaningful recovery until European contraction mid-year; prioritize cost control, component premiums, and cash reserves to weather an extended trough

Complete references and supporting documentation are available upon request by contacting the editorial team at editor@thebullvine.com.

Learn More:

The Sunday Read Dairy Professionals Don’t Skip.

Every week, thousands of producers, breeders, and industry insiders open Bullvine Weekly for genetics insights, market shifts, and profit strategies they won’t find anywhere else. One email. Five minutes. Smarter decisions all week.

NewsSubscribe
First
Last
Consent

The $11 Billion Reality Check: Why Dairy Processors Are Banking on Fewer, Bigger Farms

The math is brutal: At $11.55/cwt margins, your 350-cow dairy bleeds $20K monthly. Here’s why processors still invest billions.

EXECUTIVE SUMMARY: American dairy is witnessing an unprecedented paradox: processors are investing $11 billion in expansion while margins have collapsed to $11.55/cwt, forcing 2,100-2,800 farms toward exit by 2026. The explanation is stark—processors have pre-secured 70-80% of future milk supply through exclusive contracts with mega-dairies, banking on industry consolidation from 26,000 to 15,000 farms. Current economics make this inevitable: mid-sized operations lose $20,000 monthly while 3,000-cow dairies maintain profitability through $4-5/cwt scale advantages that management excellence cannot overcome. A severe heifer shortage (357,000 fewer in 2025) ensures these dynamics persist regardless of price recovery, creating a biological ceiling on expansion. Farmers face three critical deadlines—May 2026 for viability assessment, August 2026 for processor clarity, and December 2026 as the final repositioning window. This transformation differs fundamentally from previous cycles: no government intervention is coming, traditional recovery mechanisms don’t exist, and the structural changes are permanent.

dairy farm consolidation

I was reviewing the October USDA milk production report with a group of producers, and we all noticed the same paradox. We’re producing 18.7 billion pounds of milk—up 3.9% from last year—yet margins have compressed from $15.57 to $11.55 per hundredweight since spring. Meanwhile, processors are committing approximately $11 billion to major new facilities through 2028.

One producer from central Pennsylvania put it perfectly: “How does massive processor expansion make any sense when we can barely cover feed costs?”

After months of analyzing this disconnect—visiting operations from the Central Valley to Vermont, reviewing research from land-grant universities, tracking processor announcements—what’s emerging is a fundamental restructuring of American dairy. This goes beyond typical market cycles into something more permanent, and understanding these shifts has become essential for strategic planning.

The Margin Meltdown: From Surviving to Drowning in 15 Months – Dairy margins collapsed 26% since September 2024, dropping from $15.57/cwt to just $11.55/cwt. For a 350-cow operation producing 6 million pounds annually, that’s $240,000 in lost income—enough to wipe out equipment budgets and force impossible decisions at kitchen tables across dairy country

Key Numbers Shaping Our Industry

Before we dive deeper, here are the metrics that matter most for operational planning:

Production & Margins:

  • Milk production: 18.7 billion pounds (October 2025, +3.9% year-over-year)
  • Current margins: $11.55/cwt (down from $15.57 in September 2024)
  • National herd: 9.35 million cows (highest since 1993)
  • Production per cow: 1,999 lbs/month (24 major states)

Processor Investment:

  • Total commitment: approximately $11 billion
  • Major new facilities through 2028
  • Supply commitments: 70-80% already locked through contracts

Heifer Shortage:

  • Current inventory: down 18% from 2018
  • Replacement cost: $3,000-4,000+ (previously $1,700-2,100)
  • 2025 shortage: 357,000 fewer heifers
  • 2026 shortage: 438,000 fewer heifers

Industry Projections:

  • Expected exits: 2,100-2,800 farms by end-2026
  • Exit rate: 7-9% of current operations
  • Most affected: 200-700 cow operations

The Production Paradox: Regional Perspectives

The latest USDA data shows we’re milking 9.35 million cows nationally—the highest count since 1993. But the story varies dramatically by region, and that variation matters for understanding what’s ahead.

Michigan operations are achieving a remarkable production of 2,260 pounds per cow per month. A producer near Lansing recently told me their herd’s averaging 95 pounds daily with consistent butterfat levels above 3.8%. That’s exceptional management paired with strong genetics.

Texas presents another fascinating case. They’re running 699,000 head now—the most since 1958—with production up 11.8% year-over-year. The panhandle operations I visited in September have adapted dry lot systems that work remarkably well in their climate, though water access remains a growing concern.

But regional differences create vastly different economic realities. A Wisconsin producer I work with regularly—running 300 cows with excellent grazing management—calculated that they’re facing approximately $240,000 less income than in September 2024. That’s based on their 6 million pounds annual production at current margins. For context, that’s their entire equipment replacement budget for the next three years.

Meanwhile, when I visited Tulare County last month, the 3,000-cow operations there are weathering margin compression better. Their operating costs run $4-5 per cwt lower than Midwest mid-size farms—not through better management, but through scale efficiencies in feed procurement, labor utilization, and infrastructure amortization.

The international dimension adds another layer. European production bounced back strongly in September—up 4.3% according to Eurostat data. France increased by 5.8%, Germany by 5%, and the Netherlands jumped by 6.9% despite their nitrate restrictions. A dairy economist colleague in Amsterdam tells me Dutch producers are maximizing production before additional environmental regulations take effect in 2026. This surge is pressuring our export markets precisely when domestic demand remains sluggish.

Understanding Processor Strategy: The View from Industry

The $11 billion processor investment initially seems counterintuitive. Why expand when farm margins are collapsing? The answer becomes clearer when examining specific projects and their strategic positioning.

Chobani’s $1.2 billion Rome, New York, facility—their largest investment to date—will process 12 million pounds daily upon full operation. That volume could come from about 40 mid-size farms, or more realistically, from 3-4 mega-dairies with guaranteed supply contracts.

During a recent industry meeting in Chicago, a procurement manager from a major processor (who requested anonymity) shared their perspective: “We’re not building for today’s milk market. We’re positioning for 2030 when global demand exceeds supply and premium products command higher margins.”

Walmart’s strategy offers another angle. Their third milk plant in Robinson, Texas, opens in 2026, continuing their vertical integration push. Based on standard industry practices and Walmart’s previous facility operations, these supply commitments typically extend for a minimum of 5-7 years.

The geographic clustering is noteworthy. Hilmar’s Dodge City facility and Leprino’s Lubbock plant—both processing 8 million pounds daily—are positioned in regions with concentrated mega-dairy operations and favorable logistics for export markets.

CoBank’s August analysis reveals that processors have already secured 70-80% of the required milk supply through long-term contracts, predominantly with operations milking 2,000+ cows. This pre-commitment strategy represents a departure from historical reliance on the spot market.

Follow The Money: Where Processors Are Building Your Replacement – New York leads with $2.8 billion (Chobani’s $1.2B Rome plant, Fairlife’s $650M facility), while Texas adds $1.5 billion targeting mega-dairy regions. This geographic clustering reveals processor strategy: invest near concentrated large operations with guaranteed supply. If your state isn’t on this map, ask yourself why

Ben Laine from Rabobank articulated this shift well during a recent webinar: “Companies aren’t investing hundreds of millions without secured supply. The relevant question for producers is whether they’re included in these long-term arrangements.”

The global context drives processor confidence. The International Dairy Federation’s April report projects a potential 30-million-ton global milk shortage by 2030, while even conservative IFCN estimates suggest a 6-10 million ton deficit. Chinese import data reinforces this outlook—cheese imports up 13.5%, whole milk powder up 41% through September, according to USDA Foreign Agricultural Service tracking.

There’s also an unexpected shift in demand for GLP-1 medications. With 30 million Americans now using these drugs, according to IQVIA’s pharmaceutical data, consumption patterns are changing dramatically. Whey protein demand increased 38% among users, while cheese and butter consumption declined 7.2% and 5.8% respectively. For processors with flexible infrastructure, this creates opportunities in high-margin protein products.

The Heifer Shortage: A Constraint Years in the Making

The replacement heifer situation deserves careful attention because it represents a multi-year constraint on expansion regardless of price improvements.

Current inventory sits 18% below 2018 levels according to CoBank’s analysis. At a recent sale in Fond du Lac, Wisconsin, quality springer heifers brought $4,500—compared to $2,200 for similar genetics five years ago. A producer from Idaho mentioned paying $4,800 for exceptional genetics last month.

The Perfect Storm: Vanishing Heifers, Exploding Prices – Since 2018, dairy heifer inventory plummeted 18% to a 47-year low of 3.91 million head while prices rocketed 50% to $3,010—with top genetics fetching $4,500. This biological ceiling locks the industry into its current structure until 2027, regardless of milk price recovery. Expansion is now mathematically impossible for most operations

The shortage—357,000 fewer heifers in 2025, rising to 438,000 fewer in 2026—stems from rational individual decisions that create collective constraints. When beef-on-dairy calves bring $1,400-1,600 while raising a replacement costs $2,800-3,200, the economics are clear.

A California dairyman running 1,500 cows told me they went 80% beef-on-dairy in 2023-2024. “At those prices, it was irresponsible not to,” he explained. Even traditionally conservative Midwest operations shifted 40-50% of breedings to beef genetics.

Dr. Kent Weigel from UW-Madison’s dairy science department frames it well: “Producers made financially sound individual choices that collectively created a demographic cliff for the industry.”

The regional impacts vary significantly. Idaho’s expanding operations are aggressively bidding for available heifers, driving prices higher across the West. Pennsylvania’s smaller farms face a different challenge—they simply can’t compete financially for limited replacement inventory.

This creates a biological ceiling on expansion that price signals alone can’t overcome. Even if milk prices reached $20 per cwt tomorrow, most operations couldn’t expand without available replacements.

Historical Context: Why This Cycle Differs

Having worked through previous downturns, the current situation presents unique characteristics worth examining.

The 2009 crisis saw milk prices crash from $24 to $8.80 per cwt—a devastating 63% decline. But Congress responded with $3.5 billion in direct support, and USDA purchased 379 million pounds of milk powder to stabilize markets. Those interventions, combined with natural supply adjustments, enabled recovery within 18-24 months.

The 2015-2016 downturn followed a different pattern. Without direct payments, the industry relied on market forces. Global weather challenges and China’s growing imports eventually tightened supply, supporting price recovery by 2017-2018.

Today’s environment lacks these recovery mechanisms. Current USDA policy emphasizes market solutions over intervention. The Dairy Margin Coverage program triggers only at $9.50 per cwt—well below current margins of $11.55. Even when triggered, coverage caps at 5 million pounds annually, providing limited support for larger operations.

More significantly, processor supply commitments through 2030-2034 have pre-allocated market access in ways that didn’t exist during previous cycles. A Northeast cooperative board member recently described this as “musical chairs where the music has already stopped for many producers.”

Dr. Andrew Novakovic from Cornell’s dairy program observes that, unlike previous downturns with natural recovery mechanisms, “this transformation represents structural reorganization that doesn’t self-correct through normal market cycles.”

Scale Economics: The Widening Gap

The economic disparities between operation sizes have widened beyond what management excellence can overcome. Data from the University of Minnesota’s FINBIN system and USDA surveys reveals striking differences.

A typical Wisconsin 350-cow operation incurs costs of around $20.85 per cwt, with fixed costs accounting for 38% of that total. Compare that to a 3,000-cow Texas panhandle operation at $16.16 per cwt with only 25% fixed costs. That $4.69 difference translates to roughly $394,000 annually—often the difference between profit and loss.

The Unbridgeable Cost Gap: Why Scale Now Determines Survival – Mid-size operations hemorrhage $4.69/cwt more than mega-dairies—a $394,000 annual disadvantage that excellent management cannot overcome. While 350-cow Wisconsin farms struggle at $20.85/cwt, 3,000-cow Texas operations cruise at $16.16/cwt. This isn’t about farming better; it’s about farming bigger, and processors are betting accordingly with their $11 billion investment

Interestingly, California’s mid-size operations (500-750 cows) achieve competitive costs around $17-18 per cwt through different strategies. They utilize more contracted labor, which provides flexibility during margin compression despite higher hourly costs.

Beyond direct operating expenses, scale creates compounding advantages. Large Idaho operations negotiate feed contracts at $0.50-1.00 per cwt below spot prices. Labor efficiency reaches $183 per cow annually, compared with $343-514 for Northeast mid-size farms. A robotic milking system costs $83 per cow to amortize at a 3,000-head scale but $714 at a 350-head scale.

Dr. Christopher Wolf from Cornell captures this reality: “We’ve moved beyond management quality as the primary determinant of success. Structural economics now dominate, where excellent managers at smaller scales face insurmountable cost disadvantages.”

Processor Relationships: The New Reality

The evolution of processor-producer relationships represents a fundamental shift that many producers haven’t fully grasped.

Modern facilities require 5-12 million pounds per day from consolidated sources, typically through 5-10-year exclusive agreements. A central Pennsylvania producer recently shared their experience: offered a premium for exclusive supply but required a commitment to all production through the decade’s end—no spot sales, no price shopping during market spikes.

These contracts include strict confidentiality provisions, creating information asymmetry. While processors map regional supply commitments years in advance, individual producers lack visibility into capacity allocation. Your neighbor might have secured long-term access while you’re still assuming spot markets will continue.

The timing matters critically. Major processors locked supply agreements in 2023-2024 when planning current expansions. Producers now recognizing tightening access are discovering capacity is already committed through 2030.

Several New York producers mentioned their long-standing processor relationships—some spanning 30+ years—are being “reassessed” for 2026. That’s industry language for supply consolidation toward larger operations.

Community Impacts: Beyond the Farm Gate

The projected 2,100-2,800 farm exits by end-2026 create ripple effects throughout rural communities. The Center for Dairy Profitability at UW-Madison developed these projections based on current exit rates and economic pressures.

Consider Marathon County, Wisconsin, with approximately 180 dairy farms. An 8% exit rate means 14-15 operations closing. Each supports an ecosystem—equipment dealers, nutritionists, veterinarians, feed suppliers—all of which are losing revenue simultaneously.

Projection show that 40% of Northeast dairy equipment dealers will consolidate or close by 2027, as demand drops by 30%. The implications extend beyond sales to parts availability, service expertise, and technology support for remaining operations.

Veterinary services face particular challenges. The American Association of Bovine Practitioners projects service reductions of 15-25% in dairy regions. Northern Minnesota already has one large-animal practice serving five counties. When economic forces drive further consolidation, emergency coverage becomes problematic.

School districts in dairy-dependent counties could lose 5% of their property tax base. That translates to program cuts, route consolidations, and reduced educational opportunities for rural youth.

Bob Cropp, from the University of Wisconsin, quantifies what we’re losing: “These exits represent approximately 74 million farmer-years of accumulated expertise. That knowledge—built through generations of problem-solving and adaptation—cannot be quickly replaced.”

Decision Framework: Practical Steps Forward

Based on extensive discussions with financial advisors, producers, and industry analysts, here’s a framework for evaluating your operation’s position.

Immediate Assessment Priorities:

Calculate true operating costs, including family labor at market value. Many operations undervalue owner labor, distorting profitability assessments. If 80-hour weeks at zero value keep you “profitable,” that’s not sustainable.

Working capital should be at least 25% of annual revenue. Wisconsin’s Farm Credit offices recommend a 30% allocation given current volatility. Debt-to-asset ratios above 60% limit refinancing flexibility according to multiple ag lenders.

Most critically, seek clarity from milk buyers about 2026-2027 commitments. Vague responses or deferrals suggest capacity is already allocated elsewhere. February 2026 represents a critical deadline for securing clarity.

Warning Signals to Monitor:

Subtle changes often precede major shifts. Processors asking about “future plans” after years of routine relationships are assessing supplier consolidation options. Lenders requesting earlier reviews or suggesting consultants have identified concerning trends in your financials.

Regional consolidation patterns matter. Multiple exits within six months indicate accelerated structural change rather than normal attrition.

Critical Timeline:

May 2026: Assess whether operations can sustain through late 2026 without margin improvement. August 2026: Processor commitments and regional consolidation patterns become clear. December 2026: Final window for strategic repositioning before options significantly narrow

The 18-Month Decision Gauntlet: Three Deadlines That Determine Your Farm’s Future – May 2026: Assess if you can survive the year. August 2026: Know if processors want your milk. December 2026: Your last window to act deliberately. Miss these deadlines, and circumstances will decide your fate—not you. Processors and mega-dairies already know the 2030 structure; sharing information with neighbors is your only counterweight

Strategic Paths for Different Situations

Based on current operations, successfully navigating these challenges:

Strong fundamentals (positive cash flow, manageable debt, processor commitment): Focus on operational efficiency over expansion. Build reserves during any margin improvements. Avoid major capital investments without secured long-term processor agreements. An Idaho producer recently canceled planned parlor expansion despite available capital due to uncertain processor signals.

Structural challenges (tight cash flow, high debt, uncertain processor access): Consider neighbor consolidation to achieve viable scale. Three New York operations recently merged to create an 1,800-cow enterprise—complicated but preferable to individual failure.

Premium market transitions require time and capital. Organic certification takes three years. Grass-fed requires an appropriate land base. A2 genetics need development time. These aren’t immediate solutions.

Exit timing matters if that’s your path. Current cattle values ($3,000-4,000 for quality animals) and strong farmland prices create windows that may narrow if exits accelerate.

Universal recommendations: Maximize Dairy Margin Coverage despite current margins above trigger levels—premiums typically run $0.10-0.20 per cwt for basic protection. Document monthly production costs rather than quarterly estimates. Develop relationships with multiple milk buyers, even with satisfactory current arrangements in place.

Emerging Market Forces: The GLP-1 Factor

Dairy ProductConsumption ChangePrimary User Group
Cheese-7.2%General Users
Butter-5.8%General Users
Ice Cream-5.5%General Users
Milk/Cream-4.7%General Users
Yogurt High-Protein+38.0%Fitness Focus
Whey Protein+41.0%Fitness Focus

Looking Forward: Industry Implications

What we’re experiencing transcends normal market cycles into fundamental restructuring. The convergence of processor pre-positioning, heifer constraints, and widening scale economics creates permanent rather than temporary change.

Operational excellence remains necessary but insufficient. A well-managed 350-cow Pennsylvania operation faces structural disadvantages that exceptional management cannot overcome when competing against 3,000-cow Texas operations with locked processor contracts.

Time-limited decision windows define positioning for 2027-2030. Information asymmetry—where processors and mega-operations understand supply commitments while smaller producers operate in the dark—compounds the challenges. Traditional crisis recovery mechanisms no longer exist in the current market structure.

The central question isn’t management quality but structural positioning within emerging industry architecture. For many operations, honestly assessing this question—though difficult—enables deliberate choices rather than outcomes driven by circumstance.

The dairy industry will certainly continue producing milk. Whether individual operations participate in that future, and in what form, depends on decisions made within current windows. What’s encouraging is that informed decisions still influence outcomes despite powerful structural forces.

Regional collaboration strengthens individual positions. Sharing information, comparing strategies, and coordinating responses—even when processors prefer confidentiality—creates collective strength. This remains our industry, even as it transforms more rapidly than many anticipated.

The path forward requires accepting new realities while maintaining the innovative spirit that has always characterized American dairy. Those who adapt deliberately rather than reactively will find opportunities within structural change. The key is acting on information rather than hope, making strategic choices rather than letting circumstances decide.

Key Takeaways:

  • The game has changed permanently: Processors invested $11 billion betting on 15,000 farms by 2030, pre-locking 70-80% of milk supply with mega-dairies—if you lack a long-term contract, you’re competing for scraps
  • Scale economics are now destiny: A 350-cow farm bleeds $20,000 monthly at current margins while 3,000-cow operations profit—this isn’t poor management, it’s structural disadvantage
  • Biological ceiling locks in consolidation: With 357,000 fewer heifers and beef-on-dairy economics, expansion is impossible for 2-3 years, regardless of price recovery
  • Three deadlines determine your fate: May 2026 (viability assessment), August 2026 (processor commitment), December 2026 (final repositioning)—decide deliberately, or circumstances will decide for you
  • Information asymmetry is real: While you see falling milk checks, processors and mega-farms already know the 2030 industry structure—sharing information with neighboring farms is your only counterweight

Complete references and supporting documentation are available upon request by contacting the editorial team at editor@thebullvine.com.

Learn More:

The Sunday Read Dairy Professionals Don’t Skip.

Every week, thousands of producers, breeders, and industry insiders open Bullvine Weekly for genetics insights, market shifts, and profit strategies they won’t find anywhere else. One email. Five minutes. Smarter decisions all week.

NewsSubscribe
First
Last
Consent
Send this to a friend