Archive for dairy processor contracts

The $125‑Million Recall Precedent: How the 2025 Formula Crisis Exposes Dairy’s Contract and Milk Cheque Risk

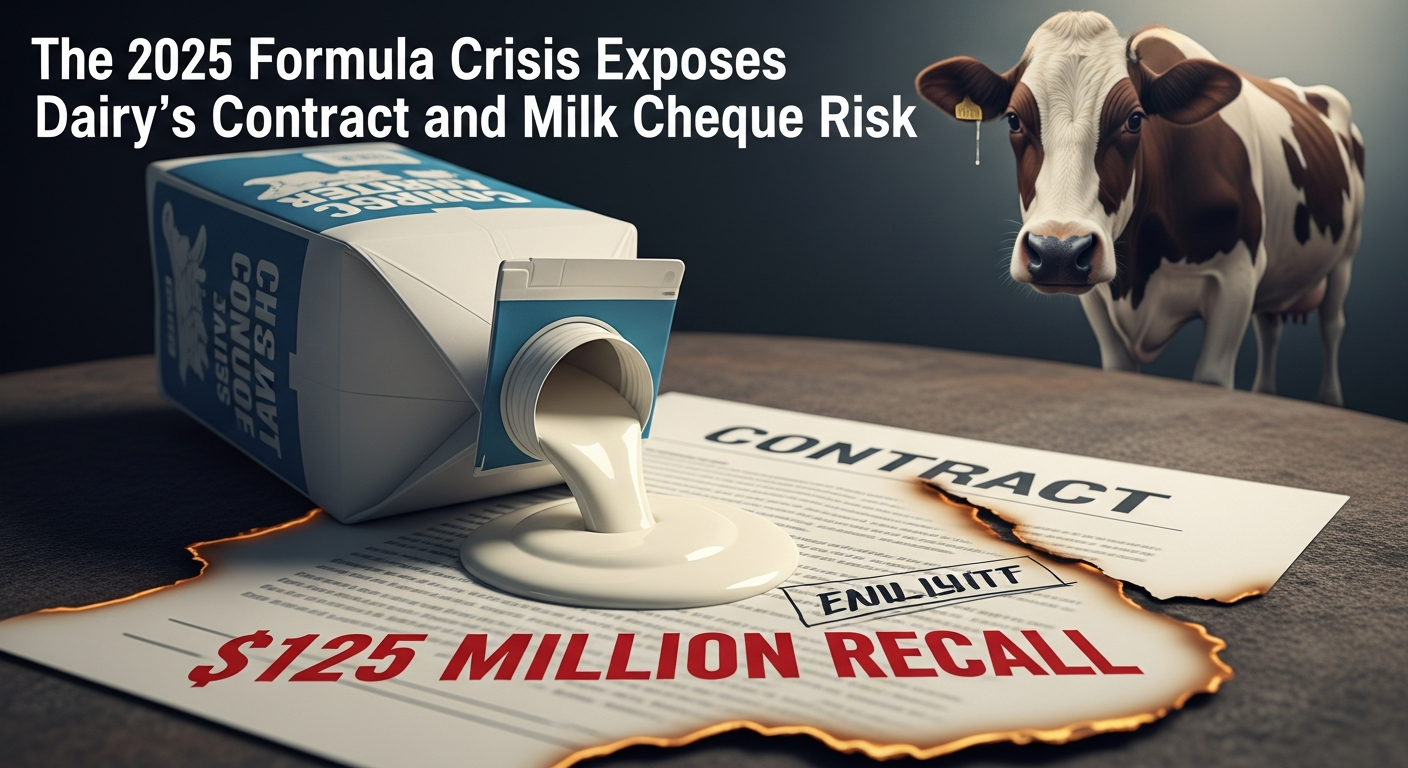
Your yogurt or formula plant adds ‘low‑risk’ ingredients after pasteurization. The last time it went wrong, it ended up at €134M. What’s your plan?

Executive Summary: A single “low‑risk” ingredient has just turned into a high‑stakes stress test for dairy’s whole value chain. Cereulide‑contaminated ARA oil from Cabio Biotech forced Nestlé, Danone, Lactalis, and Hochdorf into recalls across 60+ countries and pushed EFSA to set the first‑ever toxin limits for infant formula. For producers, the clearest warning sign is still the Fonterra–Danone case, where a precautionary recall that never sickened anyone ended in roughly €134 million in damages and a hit to earnings, even as the co‑op insisted the farmgate milk price was unchanged. This time, the contamination is real, regulators are reacting in real time, and processors face higher verification and compliance costs that can squeeze plant investment, premiums, and long‑term contract terms. Herds whose milk feeds yogurt, fortified milk, and formula lines are most exposed, because those products depend on post‑pasteurization ingredients like oils, cultures, and vitamin blends supplied by a small group of global players. The article lays out five concrete moves to cut ingredient and recall risk — plus specific questions you can take to your co‑op manager or field rep to understand how much of your milk cheque depends on what happens after pasteurization.

If you’re supplying milk to any plant that makes yogurt, specialty cheese, fortified fluid milk, or export‑grade powder, the 2025–26 infant formula crisis isn’t just someone else’s problem. It’s a live stress test of the ingredient supply chain your milk flows through — and the contracts your revenue depends on.

Since late November 2025, four major manufacturers — Nestlé, Danone, Lactalis, and Hochdorf — have pulled infant formula off shelves in more than 60 countries after cereulide, a heat‑stable toxin produced by certain Bacillus cereusstrains, was detected in ARA oil traced to Cabio Biotech, a Wuhan‑based supplier. The French Agriculture Ministry identified Cabio as the producer of the contaminated ARA oil, though the company has said it sent products for independent testing and plans to publish the results. Hochdorf Swiss Nutrition AG recalled 10,000 packs of a Bimbosan goat milk product on January 13, 2026, as a precautionary measure after confirming that ARA oil from the same supplier had been processed in small quantities at its facility. 

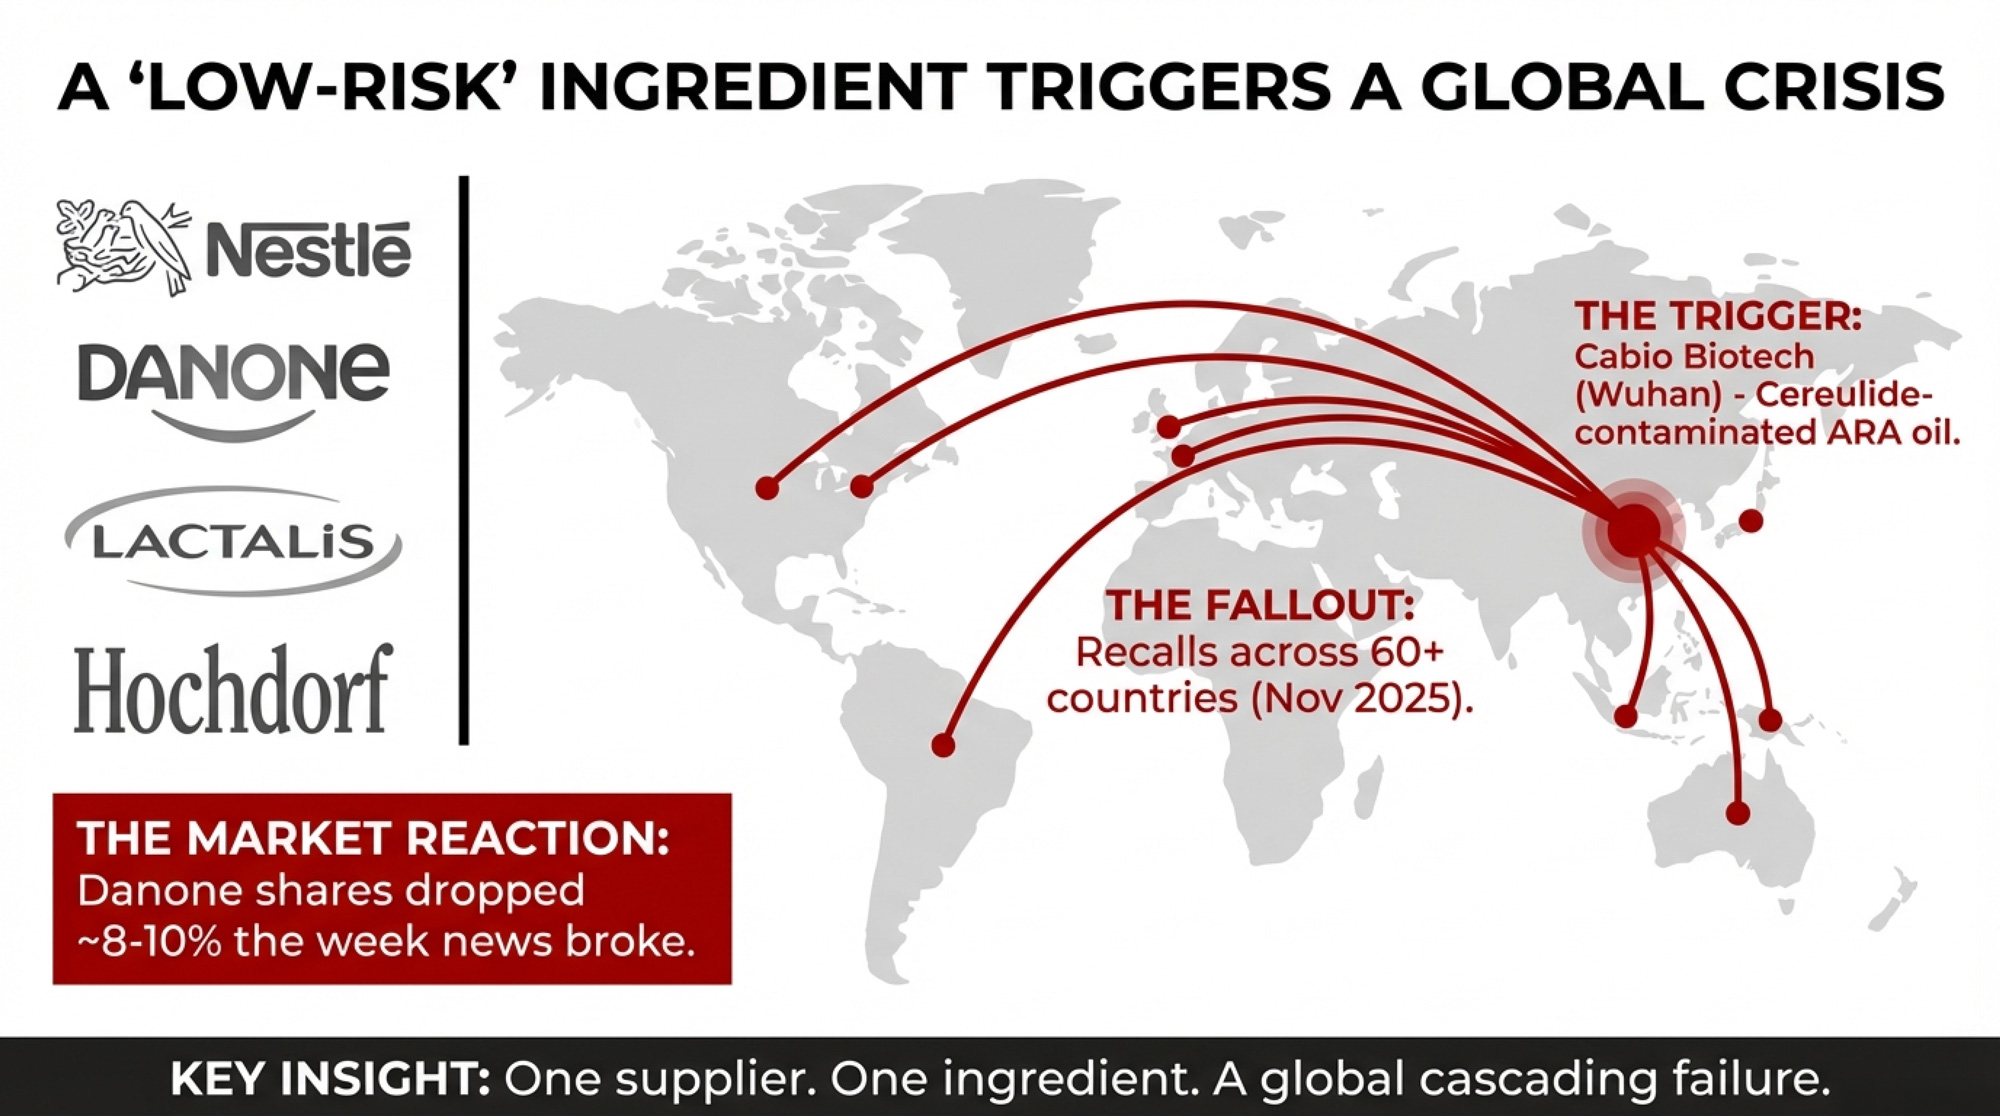
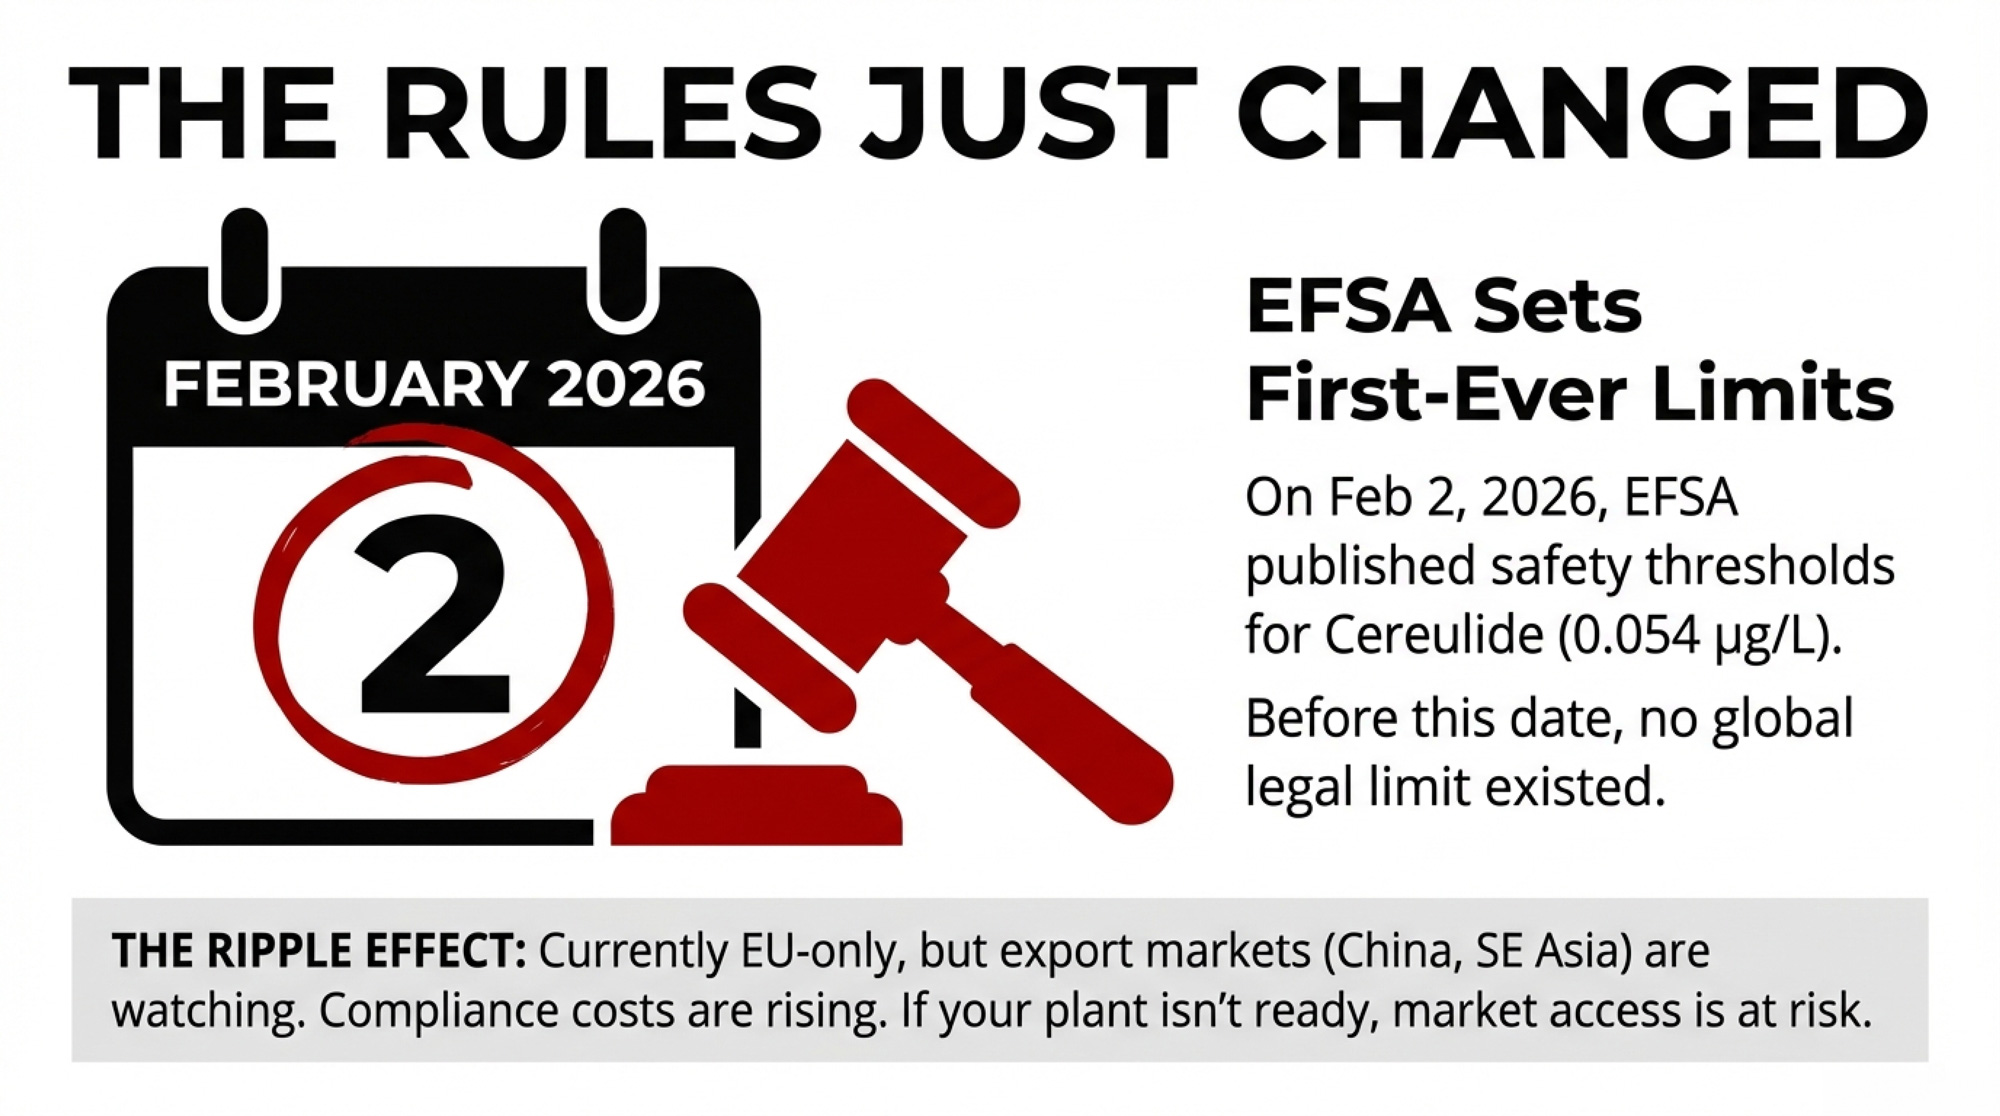
France has opened investigations into two infant deaths, though authorities have stressed that no causal link to the recalled formula has been scientifically established. Danone shares dropped as much as 12% intraday during the worst of the late‑January sell‑off, with cumulative declines of roughly 8–10% over the week the news broke. And on February 2, 2026, EFSA published the first‑ever safety thresholds for cereulide in infant formula — 0.054 μg/L for standard formula and 0.1 μg/L for follow‑on — because until that moment, no legal limit existed anywhere. 

Nestlé said recalled batches represent less than 0.5% of its annual group sales. That sounds small — until you remember the Fonterra precedent. 

The Fonterra Precedent: Recalls Cost Real Money

In August 2013, Fonterra issued a precautionary recall of its WPC80 whey protein concentrate due to suspected contamination with Clostridium botulinum. The fear turned out to be unfounded. No one got sick. But Danone, which used WPC80 in its Nutricia baby formula plants across Asia, pulled the product from eight markets and sued. 

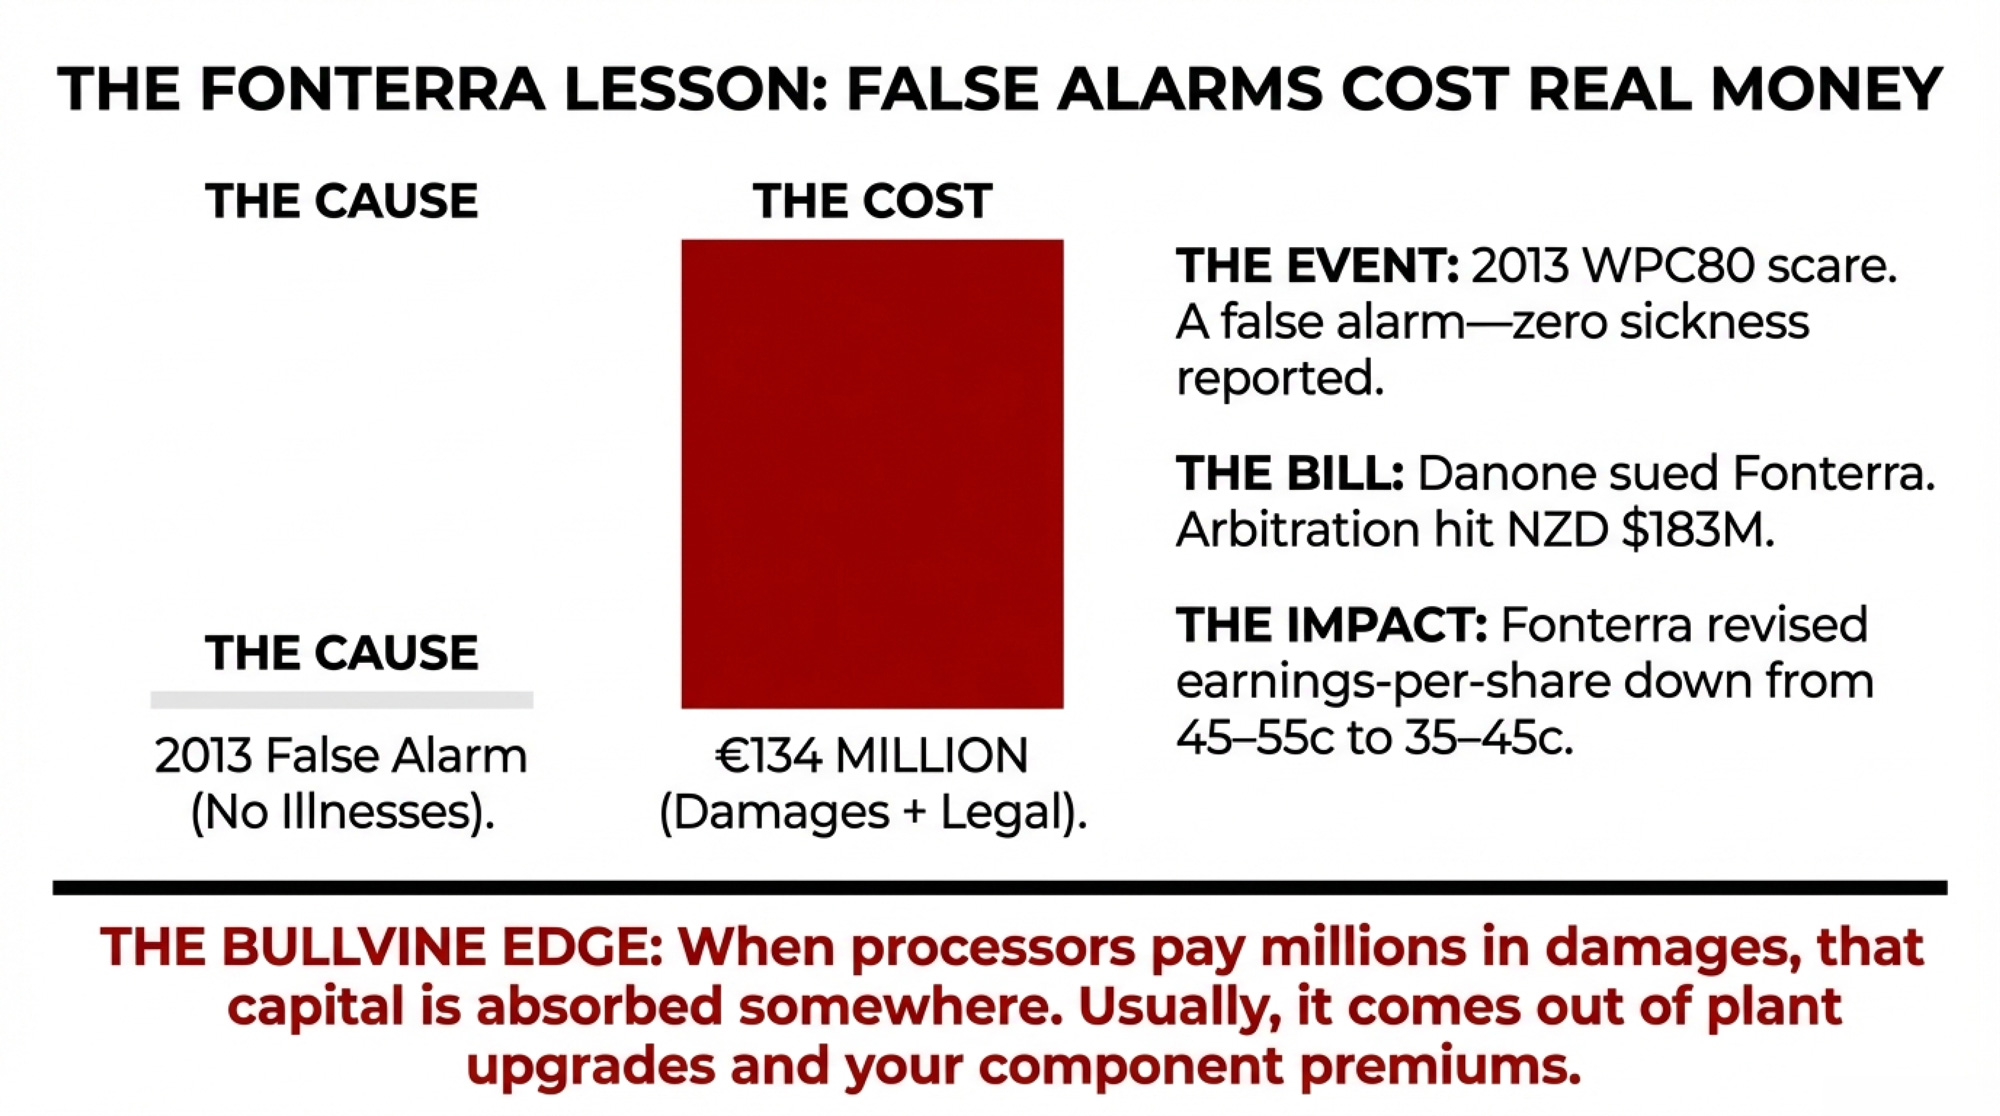
Danone sought hundreds of millions in damages, with claims reported at various stages ranging from €200 million to €370 million. The arbitration tribunal in Singapore ruled in November 2017 that Fonterra must pay NZD $183 millionin recall costs. Danone’s counsel, Simpson Thacher, later stated that the total, including interest and legal costs, reached €134 million — roughly US$165 million

Fonterra told the market the decision had “no impact on the forecast Farmgate Milk Price”. But it also revised its FY17/18 earnings‑per‑share forecast downward — from 45–55 cents to 35–45 cents — partly citing the arbitration. That capital is absorbed somewhere. Plant upgrades deferred. Component premiums that could have been more competitive. 

CEO Theo Spierings said the co‑op was “disappointed that the arbitration tribunal did not fully recognise the terms of our supply agreement with Danone, including the agreed limitations of liability”. 

That was for a scare that turned out to be nothing. The current cereulide situation involves real toxin detections, confirmed product contamination at multiple manufacturers, active government investigations, and a named supplier — Cabio Biotech — at the center of a root‑cause analysis still underway. 

Why Cereulide Sits Outside Most HACCP Plans

The root problem wasn’t dirty raw milk or a failed pasteurizer. It was a “clean,” high‑value oil ingredient in sealed containers, classified as low‑risk in standard HACCP protocols, and added after the main heat step. Industry experts are already recommending that ARA oil be upgraded from “low‑risk” to “high‑risk” to intensify scrutiny. 

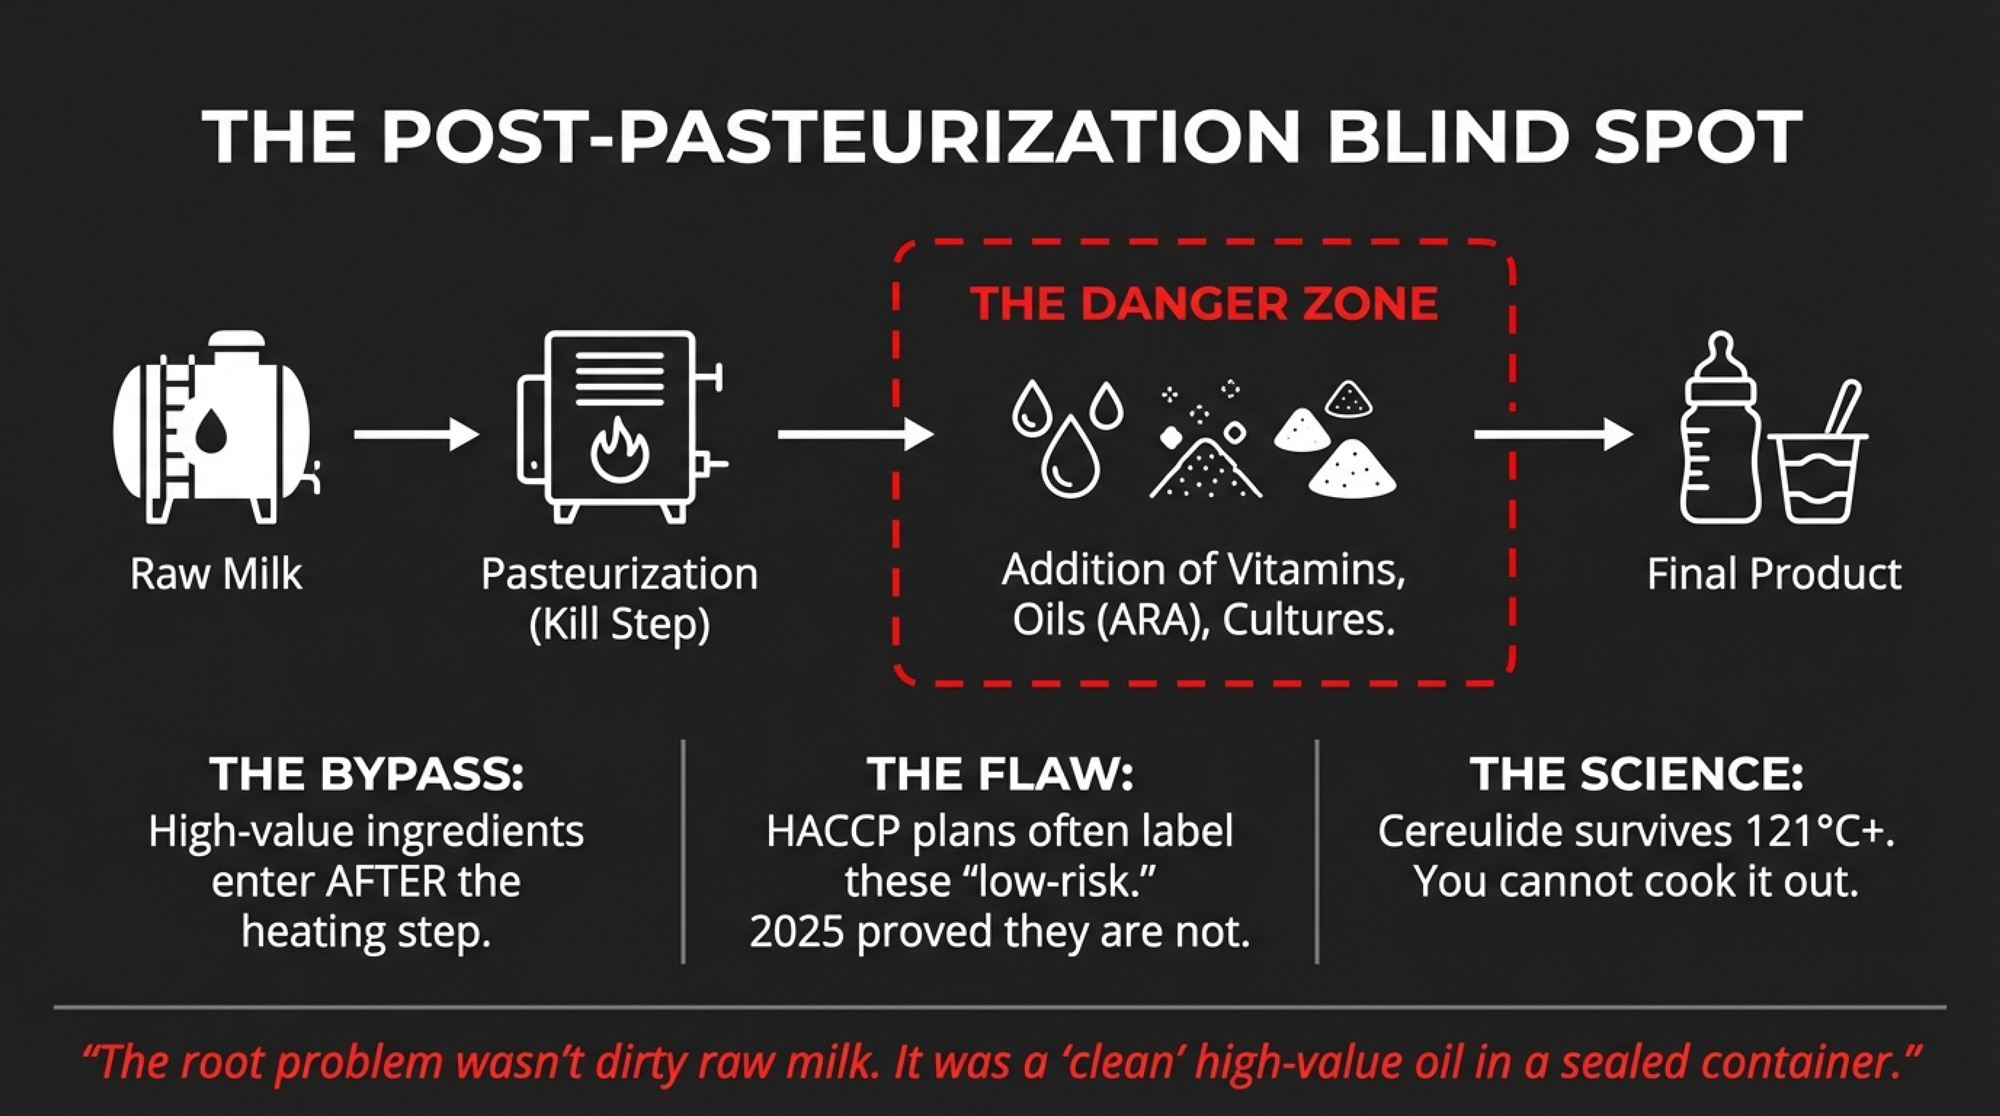
Cereulide is extremely heat‑stable. A 2024 technical brief from the Food Research Institute at the University of Wisconsin–Madison documents that it can withstand temperatures around 121–126°C in oily matrices — well above standard pasteurization and many UHT processes. A 2021 Applied and Environmental Microbiology study by Walser and colleagues showed that when cow’s milk fat content rose from 0.5% to 50%, the proportion of cereulide in the lipid phase climbed from 13.3% to 78.6%. It concentrates in fat, and there’s no practical way to remove it once it’s there. 

Professor Monika Ehling‑Schulz of the University of Vienna, who co‑developed the ISO detection method, shared that the core problem is the absence of established reference doses — “Nobody knows what this ‘low’ concentration actually means, because the limit has not been defined yet”. Marcel Zwietering, professor of food microbiology at Wageningen University, told the same outlet that the most likely scenario is B. cereus growing and producing cereulide during or before oil production, not in the oil itself — meaning the contamination occurs upstream and hitches a ride into the dairy plant. 

EFSA’s new acute reference dose of 0.014 μg/kg body weight for infants is the first regulatory benchmark anywhere. But it applies only within the EU, and only to infant formula for now. Cereulide remains “largely unregulated outside the bloc”. No equivalent limits exist for yogurt, enriched milk, or any other dairy category in any market. 

Your Plant’s Post‑Pasteurization Blind Spot

Bring this into your plant. Whether it’s a yogurt operation in Wisconsin, a drinking‑yogurt line in Ontario, a Lactalis UHT facility in Brazil, an enriched‑milk plant in Western Europe, or a powder site on New Zealand’s South Island, the pattern looks the same. 

Raw milk gets standardized, pasteurized, and cooled. Then a stack of ingredients is added after the kill step: starter cultures, probiotic blends, vitamin premixes, microencapsulated oils such as DHA and ARA, fruit preparations, flavours, stabilizers, and bioprotective cultures. Every one of those additions jumps past pasteurization. And most HACCP plans classify them as low‑risk — exactly how ARA oil was classified before this crisis blew up. 

Ingredient categoryTypical use in dairy linesContamination impact if compromisedOverall recall & contract risk*
Microencapsulated oils (ARA/DHA)Infant formula, enriched milk, yogurt drinksSystemic recall across brands and countriesVery High
Vitamin & mineral premixesFortified milk, pediatric formulasWide lot‑to‑lot spread, hard to detect in plantHigh
Starter & probiotic culturesYogurt, cheese, fermented drinksProduct spoilage, off‑flavours, some safety riskMedium
Fruit preparations & flavoursYogurt, desserts, drinking yogurtsLocalized recalls, limited to flavoured SKUsLow–Medium

One contaminated ingredient from one supplier — Cabio Biotech — cascaded through four multinational manufacturers and 60+ countries in weeks. If your plant’s cultured or fortified lines depend on similar post‑pasteurization ingredients sourced from the same small pool of global suppliers, you’re exposed to the same structural risk across different product categories. That’s true whether your milk ships to a Fonterra site in Canterbury or a Conaprole plant in Uruguay. 

What EFSA’s Outbreak Data Add to the Picture

There’s a broader signal worth watching. EFSA’s 2023 foodborne outbreak report showed that cases linked to the “milk and milk products” food group increased by 392 compared to 2022 — an 84.1% jump. Hospitalizations rose by 30, up 57.7% year‑over‑year. 

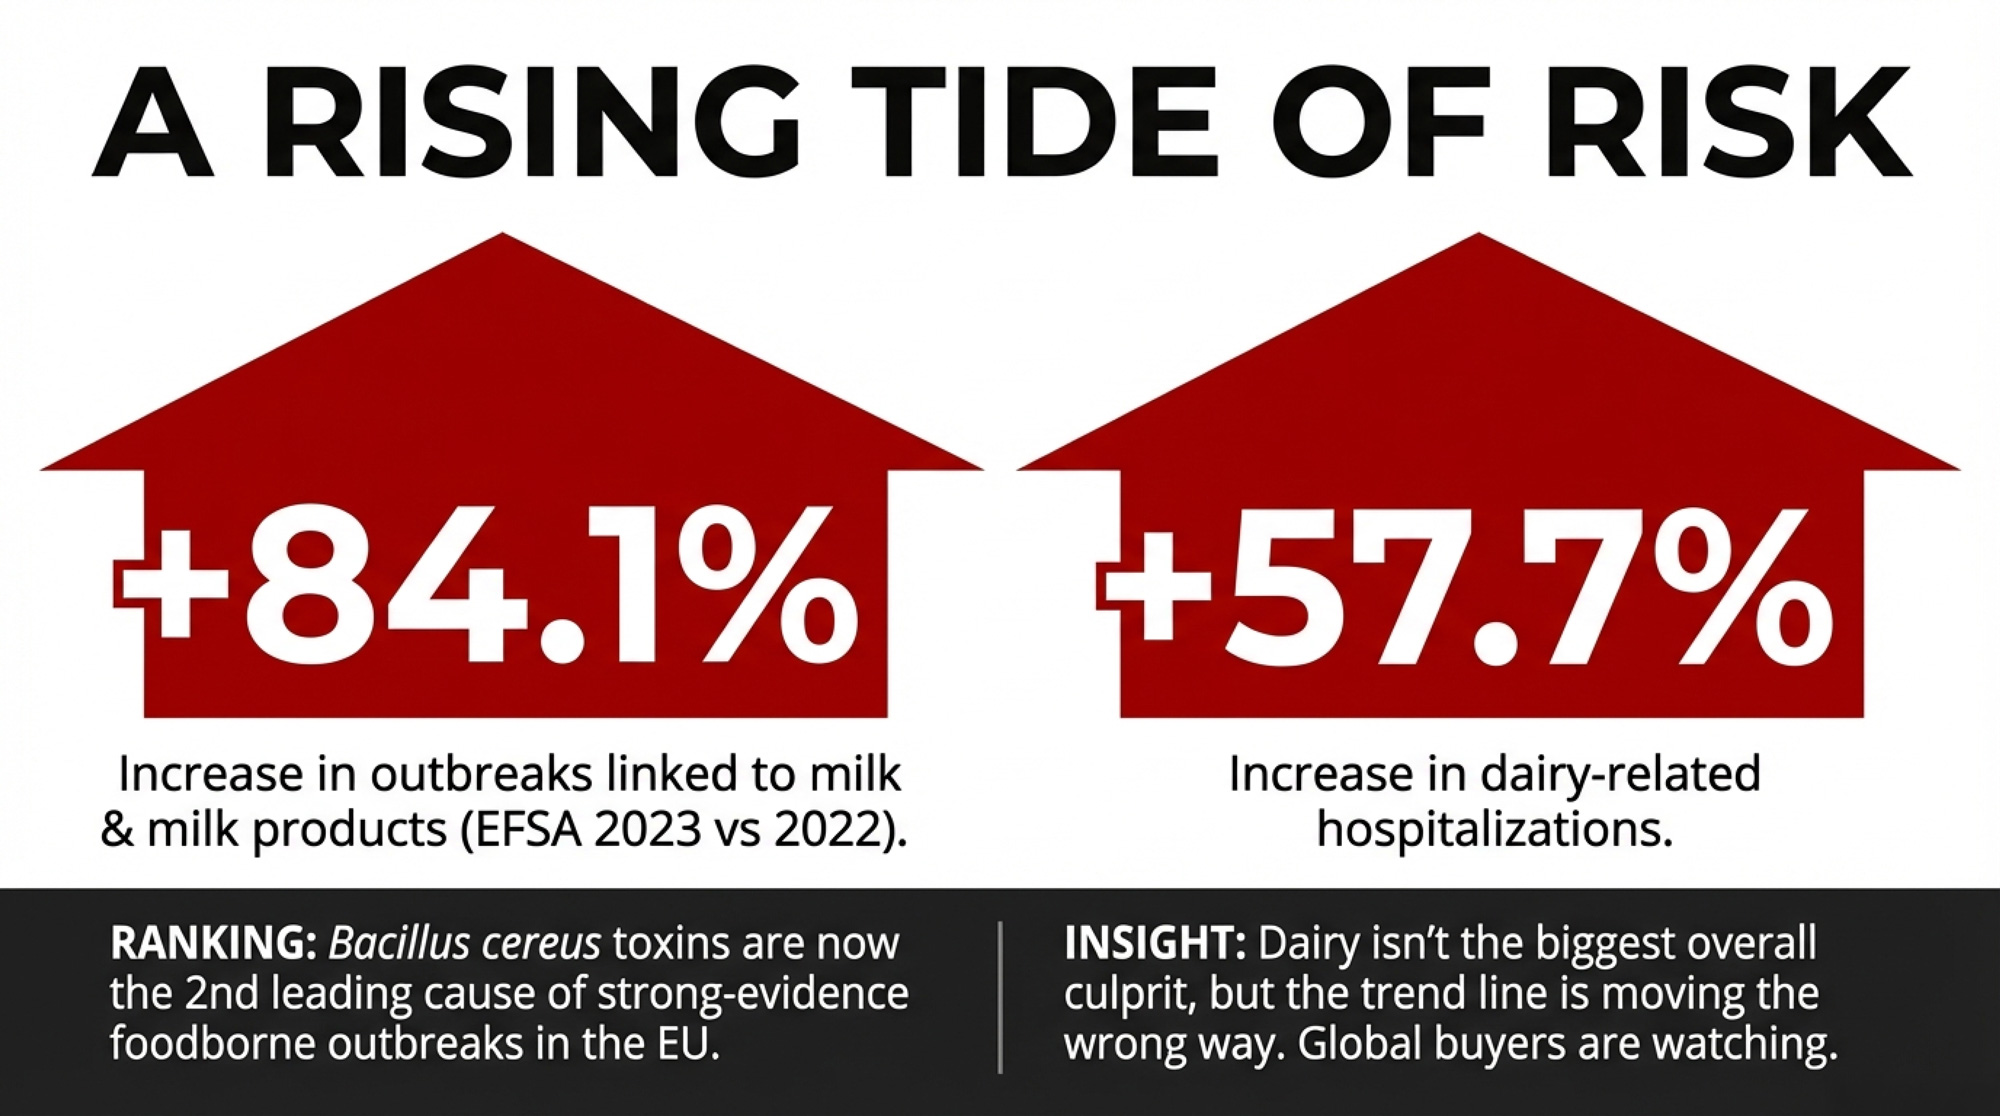
One large norovirus outbreak in Germany involving dairy desserts drove most of that spike — 538 of 858 strong‑evidence cases in this food group. Dairy was far from the biggest overall source of foodborne illness in 2023; multi‑ingredient foods, meat, eggs, and fish still dominated. But Bacillus cereus toxins ranked second among the leading causes of strong‑evidence foodborne outbreaks across all EU foods that year. And EU outbreak numbers influence how global buyers and retailers think about dairy risk everywhere — including your export markets. 

Dairy may not be the biggest culprit in the outbreak data. But the trend line is moving in the wrong direction, which makes the following steps table-stakes for any operation shipping into high‑value or export‑facing lines.

5 Moves to Cut Dairy Ingredient and Recall Risk

You’re not going to solve global toxicology from the parlour. But there are concrete steps that shift the math.

  1. Reclassify post‑pasteurization ingredients as high‑risk by default. If an ingredient is fermentation‑derived and added after the last heat step, it belongs in your hazard analysis as a distinct, high‑scrutiny line item — not buried under “low‑risk dry ingredients.” Industry experts are already recommending this for ARA oil specifically. 
  2. Ask your suppliers harder questions. “Are you GFSI‑certified?” is table stakes. What matters now: “Do you test finished lots for emetic B. cereus or cereulide? Which methods? What changed in your program after the 2025–26 recalls?” If you’re on a co‑op board, this is a fair question for your plant management team.
  3. Write change‑notification clauses into specs and contracts. Require suppliers to notify you before shifting production to a different facility, changing a critical raw‑material source, or receiving a regulatory finding. That won’t prevent contamination, but it gives you a window to ratchet up verification before a lot of high‑value milk gets committed.
  4. Build in independent verification testing where margins justify it. Certificates of analysis show you what the supplier tested for. For post‑pasteurization ingredients that support a big share of your premium lines, periodic independent testing — especially when onboarding a new supplier — adds a layer that COAs don’t. The FDA’s October 2024 BAM method for quantitative cereulide analysis gives labs a standardized protocol. 
  5. Avoid putting all your ingredient risk on one supplier. This crisis traces to a single ARA oil supplier — Cabio Biotech — that fed four multinational manufacturers. Qualifying at least two sources for each critical post‑pasteurization ingredient costs some volume discount and logistics simplicity — but eliminates the single point of failure. Most serious herds already think this way about forage and semen. Apply the same logic upstream. 

What This Means for Your Operation

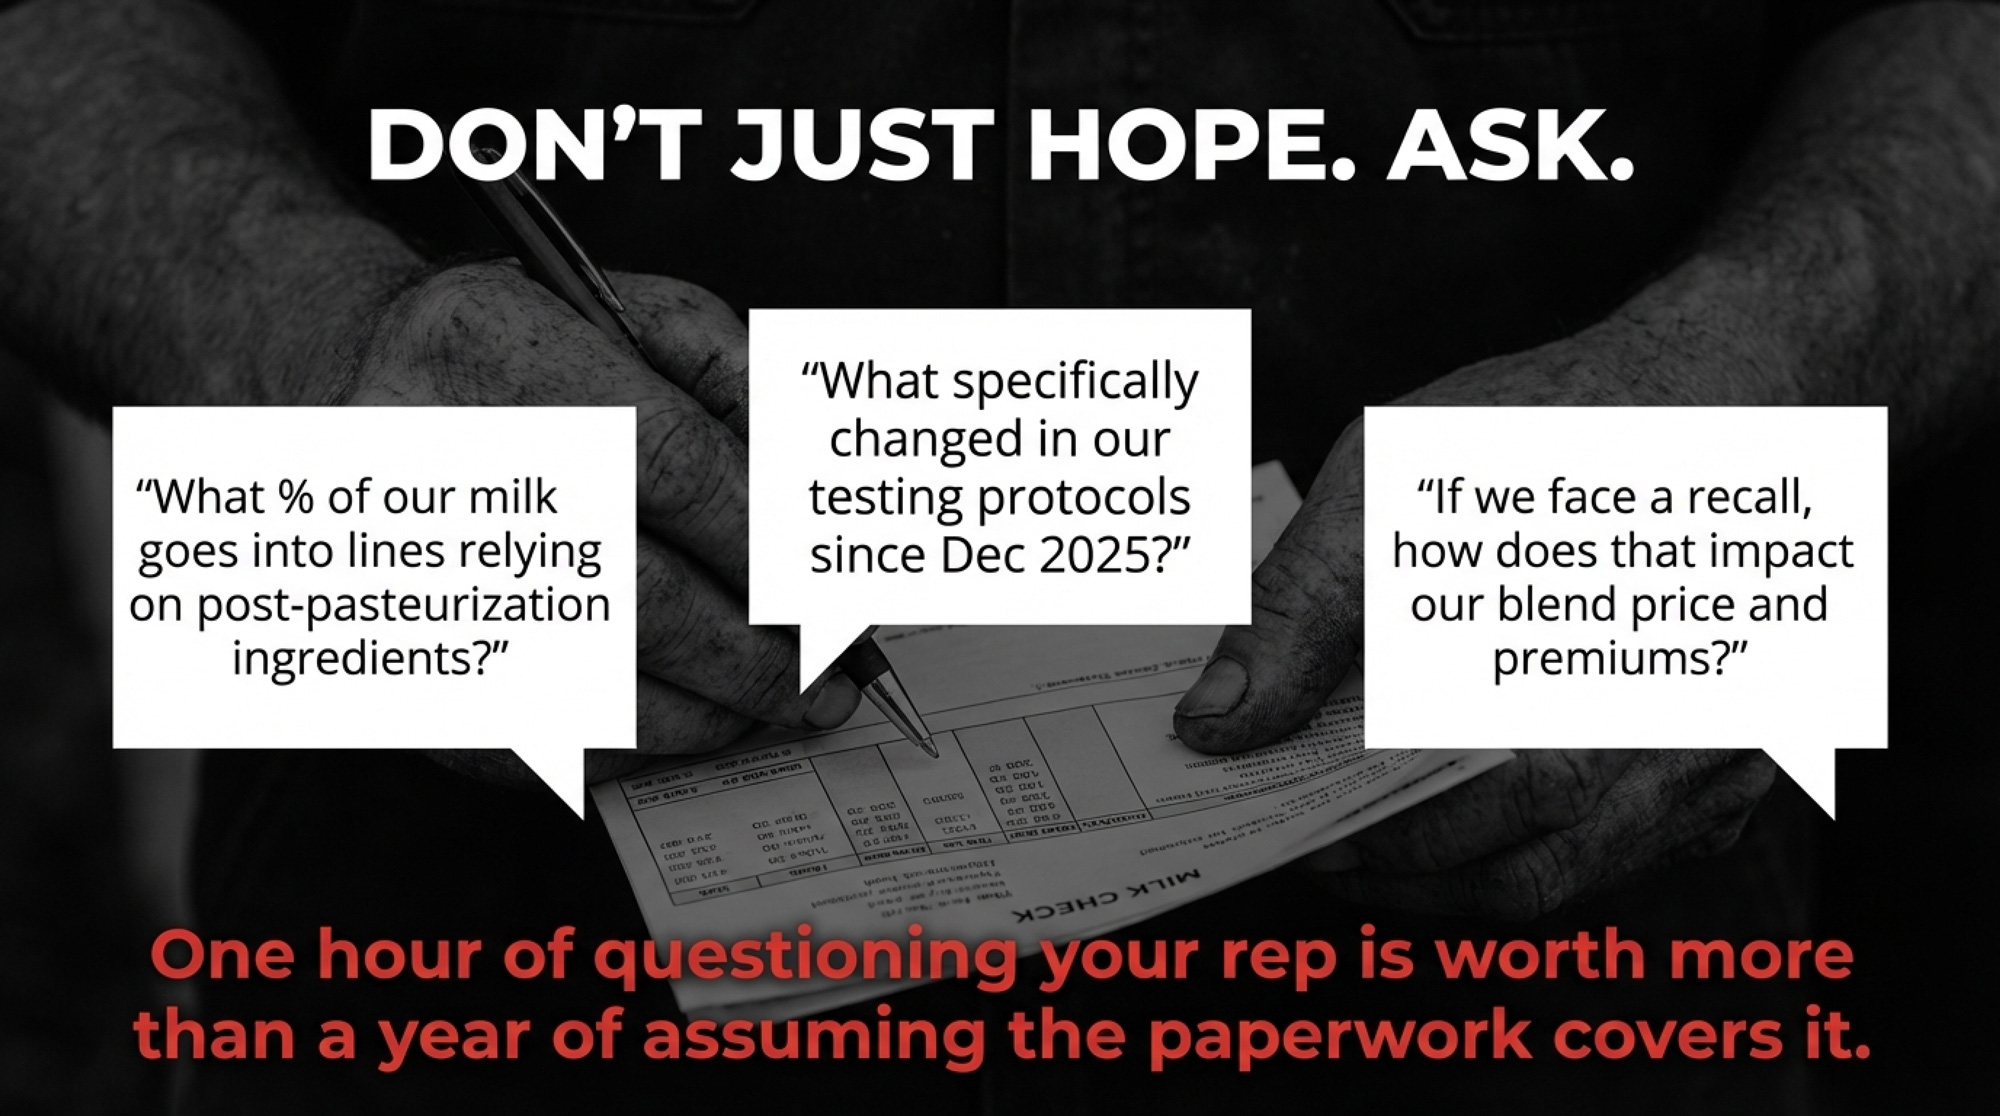
  • Ask your co‑op manager, field rep, or dairy company liaison — whatever the title is in your market — one question first: “What proportion of our milk goes into lines that rely on ingredients added after pasteurization?” Whether you’re supplying a processor in Ontario, shipping into a facility in southern Brazil, or delivering to a Fonterra collection point in the Waikato, this is the starting point. If you don’t know the answer, that’s the first gap to close. 
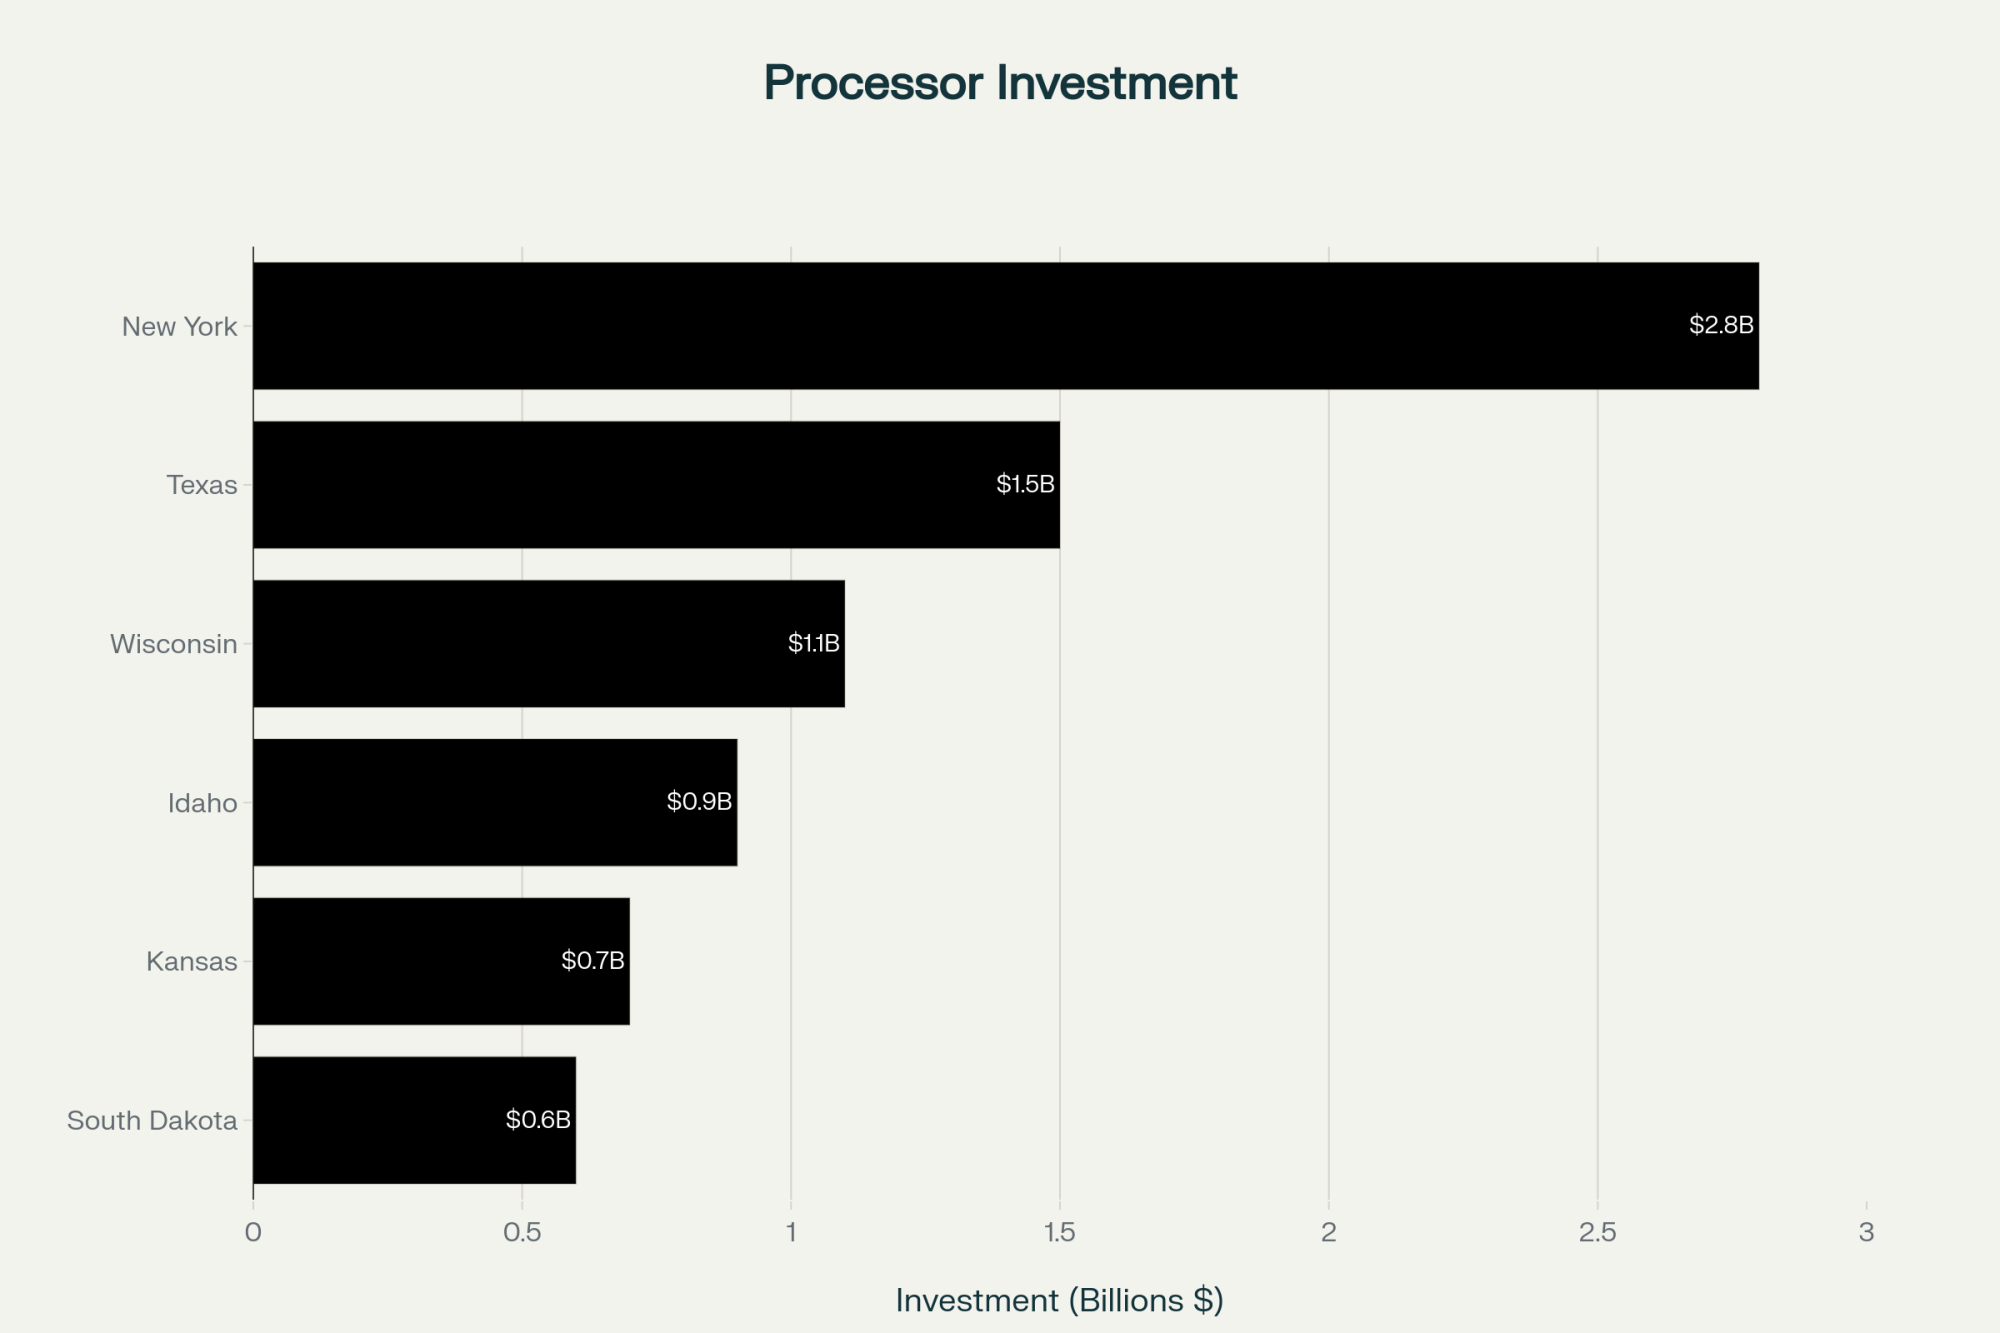
  • Ask what changed post‑recall: “Since the cereulide infant formula situation, what concrete changes have we made in how we qualify and monitor ingredient suppliers?” If the answer is “nothing yet,” that’s a signal — and it applies equally to a plant in Idaho and one in Minas Gerais or Victoria.
  • Understand your contract exposure. Fonterra’s arbitration payout — ultimately reaching an estimated €134 million, including interest and costs — stemmed from an unfounded scare. If your processor absorbs a real recall, what happens to plant investment, premium payments, and long‑term contract terms? Run the question out loud at your next producer meeting — whether that’s a DFC town hall, a Fonterra supplier session, or a co‑op AGM in Latin America. 
  • If your milk mainly feeds commodity powder and cheddar, the exposure is different but not zero. Plants with large value‑added sidelines can see margin pressure from those lines spill over into the commodity pool. Ask: “If our premium lines paused for a quarter, what would that do to our blend price?”
  • Watch the regulatory calendar. EFSA’s new cereulide thresholds are EU‑only and infant‑formula‑only for now. But when EU regulators move, export markets take notice — including the buyers that Argentina, Uruguay, New Zealand, and Australia depend on in North Africa, Southeast Asia, and China. If similar limits expand to other dairy categories, compliance and testing costs fall on processors and, eventually, on milk prices. Worth tracking wherever you farm. 
Herd profile & milk destinationShare of milk in value‑added lines (%)Baseline blend price (CAD/hl)Estimated impact on blend price if premium lines pause 1 quarter (CAD/hl)Margin impact per cow per quarter (CAD, 40 L/cow/day)
High‑value herd – yogurt, formula, enriched milk heavy7090‑7.50‑225
Mixed herd – cheese, powder, some cultured & fortified lines4080‑3.00‑90
Commodity‑leaning herd – powder & cheddar focus1572‑1.00‑30
Export‑exposed herd – strong infant formula & UHT linkages6088‑6.00‑180

Key Takeaways

  • The 2025–26 infant formula crisis exposed a structural gap — post‑pasteurization ingredients classified as low‑risk — that exists in yogurt, enriched milk, and cultured‑product plants through which your milk flows. ARA oil from one supplier, Cabio Biotech, cascaded through four manufacturers and 60+ countries. 
  • The Fonterra–Danone precedent shows the real financial cost: an estimated €134 million in total recall damages from a scare that turned out to be nothing. The current situation involves real contamination, real regulatory action, and active investigations. 
  • EFSA’s February 2, 2026, cereulide thresholds are the first legal benchmark anywhere in the world. More categories and more jurisdictions may follow. Your processor’s readiness for that shift affects your pay price, your premiums, and your long‑term contract stability. 
  • The single most useful thing you can do right now: find out what share of your milk goes into lines that depend on post‑pasteurization ingredients, and ask what your plant changed in its ingredient qualification program since December 2025.

The Bottom Line

The producers who come through shocks like this in decent shape are the ones who asked the uncomfortable questions before the answers showed up on a recall notice. That’s true on a 200‑cow operation in Quebec, a 2,000‑cow dry lot in the San Joaquin Valley, a pastoral herd in the Waikato, or a growing operation in Buenos Aires province. One hour at the kitchen table with your milk cheque and a few pointed questions is worth more than another year of assuming the paperwork has it covered.

Learn More

Complete references and supporting documentation are available upon request by contacting the editorial team at editor@thebullvine.com.

The Sunday Read Dairy Professionals Don’t Skip.

Every week, thousands of producers, breeders, and industry insiders open Bullvine Weekly for genetics insights, market shifts, and profit strategies they won’t find anywhere else. One email. Five minutes. Smarter decisions all week.

NewsSubscribe
First
Last
Consent

The $11 Billion Reality Check: Why Dairy Processors Are Banking on Fewer, Bigger Farms

The math is brutal: At $11.55/cwt margins, your 350-cow dairy bleeds $20K monthly. Here’s why processors still invest billions.

EXECUTIVE SUMMARY: American dairy is witnessing an unprecedented paradox: processors are investing $11 billion in expansion while margins have collapsed to $11.55/cwt, forcing 2,100-2,800 farms toward exit by 2026. The explanation is stark—processors have pre-secured 70-80% of future milk supply through exclusive contracts with mega-dairies, banking on industry consolidation from 26,000 to 15,000 farms. Current economics make this inevitable: mid-sized operations lose $20,000 monthly while 3,000-cow dairies maintain profitability through $4-5/cwt scale advantages that management excellence cannot overcome. A severe heifer shortage (357,000 fewer in 2025) ensures these dynamics persist regardless of price recovery, creating a biological ceiling on expansion. Farmers face three critical deadlines—May 2026 for viability assessment, August 2026 for processor clarity, and December 2026 as the final repositioning window. This transformation differs fundamentally from previous cycles: no government intervention is coming, traditional recovery mechanisms don’t exist, and the structural changes are permanent.

dairy farm consolidation

I was reviewing the October USDA milk production report with a group of producers, and we all noticed the same paradox. We’re producing 18.7 billion pounds of milk—up 3.9% from last year—yet margins have compressed from $15.57 to $11.55 per hundredweight since spring. Meanwhile, processors are committing approximately $11 billion to major new facilities through 2028.

One producer from central Pennsylvania put it perfectly: “How does massive processor expansion make any sense when we can barely cover feed costs?”

After months of analyzing this disconnect—visiting operations from the Central Valley to Vermont, reviewing research from land-grant universities, tracking processor announcements—what’s emerging is a fundamental restructuring of American dairy. This goes beyond typical market cycles into something more permanent, and understanding these shifts has become essential for strategic planning.

The Margin Meltdown: From Surviving to Drowning in 15 Months – Dairy margins collapsed 26% since September 2024, dropping from $15.57/cwt to just $11.55/cwt. For a 350-cow operation producing 6 million pounds annually, that’s $240,000 in lost income—enough to wipe out equipment budgets and force impossible decisions at kitchen tables across dairy country

Key Numbers Shaping Our Industry

Before we dive deeper, here are the metrics that matter most for operational planning:

Production & Margins:

  • Milk production: 18.7 billion pounds (October 2025, +3.9% year-over-year)
  • Current margins: $11.55/cwt (down from $15.57 in September 2024)
  • National herd: 9.35 million cows (highest since 1993)
  • Production per cow: 1,999 lbs/month (24 major states)

Processor Investment:

  • Total commitment: approximately $11 billion
  • Major new facilities through 2028
  • Supply commitments: 70-80% already locked through contracts

Heifer Shortage:

  • Current inventory: down 18% from 2018
  • Replacement cost: $3,000-4,000+ (previously $1,700-2,100)
  • 2025 shortage: 357,000 fewer heifers
  • 2026 shortage: 438,000 fewer heifers

Industry Projections:

  • Expected exits: 2,100-2,800 farms by end-2026
  • Exit rate: 7-9% of current operations
  • Most affected: 200-700 cow operations

The Production Paradox: Regional Perspectives

The latest USDA data shows we’re milking 9.35 million cows nationally—the highest count since 1993. But the story varies dramatically by region, and that variation matters for understanding what’s ahead.

Michigan operations are achieving a remarkable production of 2,260 pounds per cow per month. A producer near Lansing recently told me their herd’s averaging 95 pounds daily with consistent butterfat levels above 3.8%. That’s exceptional management paired with strong genetics.

Texas presents another fascinating case. They’re running 699,000 head now—the most since 1958—with production up 11.8% year-over-year. The panhandle operations I visited in September have adapted dry lot systems that work remarkably well in their climate, though water access remains a growing concern.

But regional differences create vastly different economic realities. A Wisconsin producer I work with regularly—running 300 cows with excellent grazing management—calculated that they’re facing approximately $240,000 less income than in September 2024. That’s based on their 6 million pounds annual production at current margins. For context, that’s their entire equipment replacement budget for the next three years.

Meanwhile, when I visited Tulare County last month, the 3,000-cow operations there are weathering margin compression better. Their operating costs run $4-5 per cwt lower than Midwest mid-size farms—not through better management, but through scale efficiencies in feed procurement, labor utilization, and infrastructure amortization.

The international dimension adds another layer. European production bounced back strongly in September—up 4.3% according to Eurostat data. France increased by 5.8%, Germany by 5%, and the Netherlands jumped by 6.9% despite their nitrate restrictions. A dairy economist colleague in Amsterdam tells me Dutch producers are maximizing production before additional environmental regulations take effect in 2026. This surge is pressuring our export markets precisely when domestic demand remains sluggish.

Understanding Processor Strategy: The View from Industry

The $11 billion processor investment initially seems counterintuitive. Why expand when farm margins are collapsing? The answer becomes clearer when examining specific projects and their strategic positioning.

Chobani’s $1.2 billion Rome, New York, facility—their largest investment to date—will process 12 million pounds daily upon full operation. That volume could come from about 40 mid-size farms, or more realistically, from 3-4 mega-dairies with guaranteed supply contracts.

During a recent industry meeting in Chicago, a procurement manager from a major processor (who requested anonymity) shared their perspective: “We’re not building for today’s milk market. We’re positioning for 2030 when global demand exceeds supply and premium products command higher margins.”

Walmart’s strategy offers another angle. Their third milk plant in Robinson, Texas, opens in 2026, continuing their vertical integration push. Based on standard industry practices and Walmart’s previous facility operations, these supply commitments typically extend for a minimum of 5-7 years.

The geographic clustering is noteworthy. Hilmar’s Dodge City facility and Leprino’s Lubbock plant—both processing 8 million pounds daily—are positioned in regions with concentrated mega-dairy operations and favorable logistics for export markets.

CoBank’s August analysis reveals that processors have already secured 70-80% of the required milk supply through long-term contracts, predominantly with operations milking 2,000+ cows. This pre-commitment strategy represents a departure from historical reliance on the spot market.

Follow The Money: Where Processors Are Building Your Replacement – New York leads with $2.8 billion (Chobani’s $1.2B Rome plant, Fairlife’s $650M facility), while Texas adds $1.5 billion targeting mega-dairy regions. This geographic clustering reveals processor strategy: invest near concentrated large operations with guaranteed supply. If your state isn’t on this map, ask yourself why

Ben Laine from Rabobank articulated this shift well during a recent webinar: “Companies aren’t investing hundreds of millions without secured supply. The relevant question for producers is whether they’re included in these long-term arrangements.”

The global context drives processor confidence. The International Dairy Federation’s April report projects a potential 30-million-ton global milk shortage by 2030, while even conservative IFCN estimates suggest a 6-10 million ton deficit. Chinese import data reinforces this outlook—cheese imports up 13.5%, whole milk powder up 41% through September, according to USDA Foreign Agricultural Service tracking.

There’s also an unexpected shift in demand for GLP-1 medications. With 30 million Americans now using these drugs, according to IQVIA’s pharmaceutical data, consumption patterns are changing dramatically. Whey protein demand increased 38% among users, while cheese and butter consumption declined 7.2% and 5.8% respectively. For processors with flexible infrastructure, this creates opportunities in high-margin protein products.

The Heifer Shortage: A Constraint Years in the Making

The replacement heifer situation deserves careful attention because it represents a multi-year constraint on expansion regardless of price improvements.

Current inventory sits 18% below 2018 levels according to CoBank’s analysis. At a recent sale in Fond du Lac, Wisconsin, quality springer heifers brought $4,500—compared to $2,200 for similar genetics five years ago. A producer from Idaho mentioned paying $4,800 for exceptional genetics last month.

The Perfect Storm: Vanishing Heifers, Exploding Prices – Since 2018, dairy heifer inventory plummeted 18% to a 47-year low of 3.91 million head while prices rocketed 50% to $3,010—with top genetics fetching $4,500. This biological ceiling locks the industry into its current structure until 2027, regardless of milk price recovery. Expansion is now mathematically impossible for most operations

The shortage—357,000 fewer heifers in 2025, rising to 438,000 fewer in 2026—stems from rational individual decisions that create collective constraints. When beef-on-dairy calves bring $1,400-1,600 while raising a replacement costs $2,800-3,200, the economics are clear.

A California dairyman running 1,500 cows told me they went 80% beef-on-dairy in 2023-2024. “At those prices, it was irresponsible not to,” he explained. Even traditionally conservative Midwest operations shifted 40-50% of breedings to beef genetics.

Dr. Kent Weigel from UW-Madison’s dairy science department frames it well: “Producers made financially sound individual choices that collectively created a demographic cliff for the industry.”

The regional impacts vary significantly. Idaho’s expanding operations are aggressively bidding for available heifers, driving prices higher across the West. Pennsylvania’s smaller farms face a different challenge—they simply can’t compete financially for limited replacement inventory.

This creates a biological ceiling on expansion that price signals alone can’t overcome. Even if milk prices reached $20 per cwt tomorrow, most operations couldn’t expand without available replacements.

Historical Context: Why This Cycle Differs

Having worked through previous downturns, the current situation presents unique characteristics worth examining.

The 2009 crisis saw milk prices crash from $24 to $8.80 per cwt—a devastating 63% decline. But Congress responded with $3.5 billion in direct support, and USDA purchased 379 million pounds of milk powder to stabilize markets. Those interventions, combined with natural supply adjustments, enabled recovery within 18-24 months.

The 2015-2016 downturn followed a different pattern. Without direct payments, the industry relied on market forces. Global weather challenges and China’s growing imports eventually tightened supply, supporting price recovery by 2017-2018.

Today’s environment lacks these recovery mechanisms. Current USDA policy emphasizes market solutions over intervention. The Dairy Margin Coverage program triggers only at $9.50 per cwt—well below current margins of $11.55. Even when triggered, coverage caps at 5 million pounds annually, providing limited support for larger operations.

More significantly, processor supply commitments through 2030-2034 have pre-allocated market access in ways that didn’t exist during previous cycles. A Northeast cooperative board member recently described this as “musical chairs where the music has already stopped for many producers.”

Dr. Andrew Novakovic from Cornell’s dairy program observes that, unlike previous downturns with natural recovery mechanisms, “this transformation represents structural reorganization that doesn’t self-correct through normal market cycles.”

Scale Economics: The Widening Gap

The economic disparities between operation sizes have widened beyond what management excellence can overcome. Data from the University of Minnesota’s FINBIN system and USDA surveys reveals striking differences.

A typical Wisconsin 350-cow operation incurs costs of around $20.85 per cwt, with fixed costs accounting for 38% of that total. Compare that to a 3,000-cow Texas panhandle operation at $16.16 per cwt with only 25% fixed costs. That $4.69 difference translates to roughly $394,000 annually—often the difference between profit and loss.

The Unbridgeable Cost Gap: Why Scale Now Determines Survival – Mid-size operations hemorrhage $4.69/cwt more than mega-dairies—a $394,000 annual disadvantage that excellent management cannot overcome. While 350-cow Wisconsin farms struggle at $20.85/cwt, 3,000-cow Texas operations cruise at $16.16/cwt. This isn’t about farming better; it’s about farming bigger, and processors are betting accordingly with their $11 billion investment

Interestingly, California’s mid-size operations (500-750 cows) achieve competitive costs around $17-18 per cwt through different strategies. They utilize more contracted labor, which provides flexibility during margin compression despite higher hourly costs.

Beyond direct operating expenses, scale creates compounding advantages. Large Idaho operations negotiate feed contracts at $0.50-1.00 per cwt below spot prices. Labor efficiency reaches $183 per cow annually, compared with $343-514 for Northeast mid-size farms. A robotic milking system costs $83 per cow to amortize at a 3,000-head scale but $714 at a 350-head scale.

Dr. Christopher Wolf from Cornell captures this reality: “We’ve moved beyond management quality as the primary determinant of success. Structural economics now dominate, where excellent managers at smaller scales face insurmountable cost disadvantages.”

Processor Relationships: The New Reality

The evolution of processor-producer relationships represents a fundamental shift that many producers haven’t fully grasped.

Modern facilities require 5-12 million pounds per day from consolidated sources, typically through 5-10-year exclusive agreements. A central Pennsylvania producer recently shared their experience: offered a premium for exclusive supply but required a commitment to all production through the decade’s end—no spot sales, no price shopping during market spikes.

These contracts include strict confidentiality provisions, creating information asymmetry. While processors map regional supply commitments years in advance, individual producers lack visibility into capacity allocation. Your neighbor might have secured long-term access while you’re still assuming spot markets will continue.

The timing matters critically. Major processors locked supply agreements in 2023-2024 when planning current expansions. Producers now recognizing tightening access are discovering capacity is already committed through 2030.

Several New York producers mentioned their long-standing processor relationships—some spanning 30+ years—are being “reassessed” for 2026. That’s industry language for supply consolidation toward larger operations.

Community Impacts: Beyond the Farm Gate

The projected 2,100-2,800 farm exits by end-2026 create ripple effects throughout rural communities. The Center for Dairy Profitability at UW-Madison developed these projections based on current exit rates and economic pressures.

Consider Marathon County, Wisconsin, with approximately 180 dairy farms. An 8% exit rate means 14-15 operations closing. Each supports an ecosystem—equipment dealers, nutritionists, veterinarians, feed suppliers—all of which are losing revenue simultaneously.

Projection show that 40% of Northeast dairy equipment dealers will consolidate or close by 2027, as demand drops by 30%. The implications extend beyond sales to parts availability, service expertise, and technology support for remaining operations.

Veterinary services face particular challenges. The American Association of Bovine Practitioners projects service reductions of 15-25% in dairy regions. Northern Minnesota already has one large-animal practice serving five counties. When economic forces drive further consolidation, emergency coverage becomes problematic.

School districts in dairy-dependent counties could lose 5% of their property tax base. That translates to program cuts, route consolidations, and reduced educational opportunities for rural youth.

Bob Cropp, from the University of Wisconsin, quantifies what we’re losing: “These exits represent approximately 74 million farmer-years of accumulated expertise. That knowledge—built through generations of problem-solving and adaptation—cannot be quickly replaced.”

Decision Framework: Practical Steps Forward

Based on extensive discussions with financial advisors, producers, and industry analysts, here’s a framework for evaluating your operation’s position.

Immediate Assessment Priorities:

Calculate true operating costs, including family labor at market value. Many operations undervalue owner labor, distorting profitability assessments. If 80-hour weeks at zero value keep you “profitable,” that’s not sustainable.

Working capital should be at least 25% of annual revenue. Wisconsin’s Farm Credit offices recommend a 30% allocation given current volatility. Debt-to-asset ratios above 60% limit refinancing flexibility according to multiple ag lenders.

Most critically, seek clarity from milk buyers about 2026-2027 commitments. Vague responses or deferrals suggest capacity is already allocated elsewhere. February 2026 represents a critical deadline for securing clarity.

Warning Signals to Monitor:

Subtle changes often precede major shifts. Processors asking about “future plans” after years of routine relationships are assessing supplier consolidation options. Lenders requesting earlier reviews or suggesting consultants have identified concerning trends in your financials.

Regional consolidation patterns matter. Multiple exits within six months indicate accelerated structural change rather than normal attrition.

Critical Timeline:

May 2026: Assess whether operations can sustain through late 2026 without margin improvement. August 2026: Processor commitments and regional consolidation patterns become clear. December 2026: Final window for strategic repositioning before options significantly narrow

The 18-Month Decision Gauntlet: Three Deadlines That Determine Your Farm’s Future – May 2026: Assess if you can survive the year. August 2026: Know if processors want your milk. December 2026: Your last window to act deliberately. Miss these deadlines, and circumstances will decide your fate—not you. Processors and mega-dairies already know the 2030 structure; sharing information with neighbors is your only counterweight

Strategic Paths for Different Situations

Based on current operations, successfully navigating these challenges:

Strong fundamentals (positive cash flow, manageable debt, processor commitment): Focus on operational efficiency over expansion. Build reserves during any margin improvements. Avoid major capital investments without secured long-term processor agreements. An Idaho producer recently canceled planned parlor expansion despite available capital due to uncertain processor signals.

Structural challenges (tight cash flow, high debt, uncertain processor access): Consider neighbor consolidation to achieve viable scale. Three New York operations recently merged to create an 1,800-cow enterprise—complicated but preferable to individual failure.

Premium market transitions require time and capital. Organic certification takes three years. Grass-fed requires an appropriate land base. A2 genetics need development time. These aren’t immediate solutions.

Exit timing matters if that’s your path. Current cattle values ($3,000-4,000 for quality animals) and strong farmland prices create windows that may narrow if exits accelerate.

Universal recommendations: Maximize Dairy Margin Coverage despite current margins above trigger levels—premiums typically run $0.10-0.20 per cwt for basic protection. Document monthly production costs rather than quarterly estimates. Develop relationships with multiple milk buyers, even with satisfactory current arrangements in place.

Emerging Market Forces: The GLP-1 Factor

Dairy ProductConsumption ChangePrimary User Group
Cheese-7.2%General Users
Butter-5.8%General Users
Ice Cream-5.5%General Users
Milk/Cream-4.7%General Users
Yogurt High-Protein+38.0%Fitness Focus
Whey Protein+41.0%Fitness Focus

Looking Forward: Industry Implications

What we’re experiencing transcends normal market cycles into fundamental restructuring. The convergence of processor pre-positioning, heifer constraints, and widening scale economics creates permanent rather than temporary change.

Operational excellence remains necessary but insufficient. A well-managed 350-cow Pennsylvania operation faces structural disadvantages that exceptional management cannot overcome when competing against 3,000-cow Texas operations with locked processor contracts.

Time-limited decision windows define positioning for 2027-2030. Information asymmetry—where processors and mega-operations understand supply commitments while smaller producers operate in the dark—compounds the challenges. Traditional crisis recovery mechanisms no longer exist in the current market structure.

The central question isn’t management quality but structural positioning within emerging industry architecture. For many operations, honestly assessing this question—though difficult—enables deliberate choices rather than outcomes driven by circumstance.

The dairy industry will certainly continue producing milk. Whether individual operations participate in that future, and in what form, depends on decisions made within current windows. What’s encouraging is that informed decisions still influence outcomes despite powerful structural forces.

Regional collaboration strengthens individual positions. Sharing information, comparing strategies, and coordinating responses—even when processors prefer confidentiality—creates collective strength. This remains our industry, even as it transforms more rapidly than many anticipated.

The path forward requires accepting new realities while maintaining the innovative spirit that has always characterized American dairy. Those who adapt deliberately rather than reactively will find opportunities within structural change. The key is acting on information rather than hope, making strategic choices rather than letting circumstances decide.

Key Takeaways:

  • The game has changed permanently: Processors invested $11 billion betting on 15,000 farms by 2030, pre-locking 70-80% of milk supply with mega-dairies—if you lack a long-term contract, you’re competing for scraps
  • Scale economics are now destiny: A 350-cow farm bleeds $20,000 monthly at current margins while 3,000-cow operations profit—this isn’t poor management, it’s structural disadvantage
  • Biological ceiling locks in consolidation: With 357,000 fewer heifers and beef-on-dairy economics, expansion is impossible for 2-3 years, regardless of price recovery
  • Three deadlines determine your fate: May 2026 (viability assessment), August 2026 (processor commitment), December 2026 (final repositioning)—decide deliberately, or circumstances will decide for you
  • Information asymmetry is real: While you see falling milk checks, processors and mega-farms already know the 2030 industry structure—sharing information with neighboring farms is your only counterweight

Complete references and supporting documentation are available upon request by contacting the editorial team at editor@thebullvine.com.

Learn More:

The Sunday Read Dairy Professionals Don’t Skip.

Every week, thousands of producers, breeders, and industry insiders open Bullvine Weekly for genetics insights, market shifts, and profit strategies they won’t find anywhere else. One email. Five minutes. Smarter decisions all week.

NewsSubscribe
First
Last
Consent

From Shutdown to Showdown: How Dairy’s 2026 Wake-Up Call Is Redefining Survival

What the End of Government Relief Really Meant—and How Smart Farms Are Turning Uncertainty Into Opportunity

EXECUTIVE SUMMARY: From Shutdown to Showdown: How Dairy’s 2026 Wake-Up Call Is Redefining Survival” details how the end of the government shutdown set the stage for a year of unprecedented challenge—and opportunity—in the dairy sector. Instead of relief marking the finish line, the reopening exposed new processor contract demands, profit headwinds from make allowance adjustments, and a high-stakes shift to protein-centric pricing, all verified through university extension findings and current market data. The article demonstrates how farms that capitalize on narrow timing windows, lean into peer networks, and embrace collaborative learning are gaining margin and flexibility amidst change. Practical checklists, region-specific examples, and expert-backed insights make it useful at the barn and the boardroom table alike. By weaving in both the pressures and pathways open to all sizes of operation, the story embodies The Bullvine’s commitment to presenting real decisions, not just headlines. In the end, it shows that survival—and success—are less about official relief and more about being prepared to adapt, connect, and strategize for what 2026 brings next.

Dairy Profit Strategy

You know, as much as we all soaked in the relief of those USDA payments and the delayed Milk Production reports this past fall, the lesson of the moment is clearer than ever: what matters most heading into 2026 is how quickly and thoughtfully we respond to the challenges—not just what help the government sends. What I’ve noticed—confirmed by producers in Wisconsin, Florida, and even out west—is that “relief” doesn’t make the difference for your bottom line. It’s how you move with the changing facts, the shifting contracts, and the farm realities in front of you.

Pull up a stool. Here’s how that’s actually playing out in barns, co-op meetings, and balance sheets, with credible trail markers for farms of all sizes.

Speed Kills (Complacency): Margins in the Data Gaps

What farmers are finding is that, in this climate, the winners are the ones ready to act. When the USDA’s October Milk Production report was missing for weeks, extension specialists and loan officers across the Midwest were fielding anxious calls. Herds that moved quickly—hedged milk at $17.35/cwt right after the report, or locked in feed at $4.10—wound up with $2,000-$2,500 more on every 500 cows compared to those who waited. CME and Wisconsin extension data both show how waiting for “certainty” can shrink margins before you even see the warning.

It’s not luck. It’s keeping your strategy loose, your phone handy, and your local data bookmarked. Fresh cow management, feed contracts, and market windows—they all demand being both alert and decisive, especially as 2026 approaches.

Make Allowance Leaks: When Efficiency Quietly Costs You

The Allowance Shift: June 2025 Make Allowance Increase Transfers ~$0.50/cwt from Producer Milk Checks to Processor Margins

Let’s lay out the dollars and cents. Thanks to FMMO make allowance changes last summer, about $82 million annually has shifted from producer checks into processor cost recovery, according to the American Farm Bureau and university research. That hits particularly hard for 400-600 cow herds in the Midwest, where $8,000-$15,000 in value quietly vaporized from family budgets in 2025 alone. While vertically integrated co-ops sometimes recoup some through patronage, for most, these quieter cost shifts are exactly what force new choices—do we hold, reinvest, cut inputs, or consider transitioning out?

The lesson? It’s time to double down on IOFC, watch every transition group closely, and look at every feed and labor line as a matter of survival, not just habit.

Premium Contracts: New Growth, New Hurdles

The Processor Divide: Expanded Capacity and Premium Contracts Favor Large Operations—Small Farms Face Component Quality Barriers Worth $4.40/cwt

Let’s get real about processor expansion. Yes, IDFA and DFO confirm $11 billion in new milk-processing capacity, but the “growth” headlines come with some fine print. Today’s direct contracts expect you to consistently deliver volume (often 1,000+ cows), protein over 3.2%, and sub-Grade A somatic cell counts.

Why the clampdown? Processors need stable, high-quality components to secure export and retail channels, invest in automation, and deliver on food safety for globally diverse buyers. UW reports and field officers say this shift is now woven into most new plant supplier specs.

It’s not all doom. Farms who began investing in butterfat genetics, precision feed systems, and herd data management years ago are fielding more calls, not fewer. Those focusing just on short-term barn expansion are finding that you can’t rush a protein curve or a culture of quality management. Extension and Minnesota case studies show that slow, steady moves—targeting milk components and recordkeeping upgrades first—put herds in the fast track for premium deals.

December’s 3.3% Rule: Protein as the Baseline

Speed Kills Complacency: How Quick Response to Market Data Translates to $1,400+ More Per 500 Cows

Here’s what’s interesting: this year’s biggest structural shift might be USDA’s new baseline for protein—up from 3.1% to 3.3% (USDA Final Rule). It’s been a long time coming, and peer-reviewed research had foreshadowed the change for several years. Genetics, feeding, and savvy fresh cow management have all nudged national averages upward. But it’s the local impacts—from blend checks to contract premiums—that hit home.

What does that mean practically? A 0.2% difference in protein, per 100 cows, adds up to $400-800 in annual check value, per the latest Midwest and Ontario extension data. Above 3.3%? You’re in the bonus column. Below? Now’s the time to pull out the ration notes and see where you can tweak, swap, or invest before the next round of pricing hits.

More importantly, more farms are opening up the books—digitizing records, crowdsourcing advice in peer groups, and trading input strategy tips without fear of “giving away secrets.” As more transition into 2026, collaborative learning is proving, in the field and in extension trials, to be a margin driver as real as any piece of steel.

Transition Planning: The Strongest Exit Isn’t Running—It’s Timing

One of the biggest takeaways this year is that transition can be a strength, not a sign of retreat. USDA NASS land reports peg the Midwest ground firmly above $25K/acre; extension planners increasingly help herds time “retirement” or partner transitions before the next storm hits. The real win? Leaving with financial options and the pride of calling the shot on your terms.

Herds still thinking big? UW and DFO studies show that the best results come when expansion is built on several years of component improvement and a fresh-cow strategy—not as a panic reaction to price. Dry lot and fresh group upgrades, pooled input efforts, and peer feedback show up again and again in success stories.

And for those holding steady, including herds in the 200-700 cow bracket, “optimization” is earning a new respect. Peer networks and beef-on-dairy strategies (with calves bringing $400-600, latest UMN data) are now front-line tools, and regular peer benchmarking is ensuring that the smartest changes don’t just sit on paper—they get put into practice.

Are You Fast Enough for 2026?

Pulling together farmer panels and co-op roundtables, it’s clear: being nimble, not just knowledgeable, is the new shield against margin loss. Extension economic analysis calls it “window management”—profits are made in these small, rapid openings, not in broad trends or after-the-fact decision meetings.

Facing Protein Gaps? Your Action Checklist

  • Bring three years of production and component records to a dairy-literate advisor. 
  • Model the value and cost of boosting protein (and the status quo if you don’t). 
  • Sit down with a local extension or farm business group—where are your best, region-specific levers hiding?
  • Use your peer network: tested approaches and hard-learned lessons are worth more than a new gadget.

So if there’s one sure thing heading into our “2026 wake-up call,” it’s that resources, relationships, and rapid response matter. Let’s keep those mugs full and the learning real—together, we’ll keep setting the pace for the next curve in dairy.

KEY TAKEAWAYS:

  • Farms that respond swiftly to new information—securing prices or input deals as data shifts—routinely outperform those waiting for a “clear signal.”
  • The new normal: Processor contracts and milk pricing now demand higher protein, stricter quality, and more documentation, making management upgrades and peer collaboration must-haves.
  • Smart transition planning—whether exiting, scaling, or realigning—can be a competitive edge, helping farm families lock in value rather than react to crises.
  • Operational resilience is increasingly about connecting with peer networks, bulk-buying alliances, and benchmarking tools—not just individual innovation.
  • For 2026, the most resilient farms will be those that adapt fastest to changing rules, seize learning opportunities, and stay proactive in their markets.

Complete references and supporting documentation are available upon request by contacting the editorial team at editor@thebullvine.com.

Learn More:

The Sunday Read Dairy Professionals Don’t Skip.

Every week, thousands of producers, breeders, and industry insiders open Bullvine Weekly for genetics insights, market shifts, and profit strategies they won’t find anywhere else. One email. Five minutes. Smarter decisions all week.

NewsSubscribe
First
Last
Consent
Send this to a friend