If you’re milking 300–600 cows, the real choice isn’t H‑2A or robots—it’s which math keeps you in business 10 years from now.
Executive Summary: If you’re running 300–600 cows, the biggest decision in front of you isn’t just H‑2A or robots—it’s what the labor math says about your next ten years. This piece digs into new USDA‑ERS, Rabobank, and university data to show why H‑2A rarely ends up “cheap,” how global cost gaps are shifting the ground under your feet, where robotic milking and targeted automation genuinely save labor, and how compliance risk fits into the picture. Along the way, it looks at real-world systems—from California dry lots to Wisconsin freestalls and Ontario mixed herds—to ground the numbers in the kind of operations you actually recognize. The article then lays out three honest paths for mid-size dairies: selective automation around bottlenecks, fully legal higher‑cost labor in exchange for stability, or a planned transition out of milking while you still control the terms. It finishes with a practical 30‑day checklist—know your true labor cost per cow and your multi‑year DSCR—so you can stop guessing and see which path really fits your farm.

If you sit down with a table of dairy folks this winter—whether it’s in Wisconsin, California’s Central Valley, or around eastern Ontario—you’ll hear the same three things come up over coffee: labor, margins, and what the next ten years really look like for that 300‑ to 600‑cow family operation. You know the look on people’s faces when the talk turns to “who’s going to milk these cows in five years?”—it’s the same in a lot of kitchen tables and vet trucks right now.
What’s interesting here is that two big storylines keep colliding almost immediately. One is the rapid growth of the H‑2A visa program, which economists at USDA’s Economic Research Service and Congressional analysts say has become a central labor pipeline for a big chunk of U.S. agriculture. The other is the steady march of automation—from collars and sort gates to full robotic milking—backed by university and peer‑reviewed research showing real changes in how labor is used on both small and large herds. Put those alongside the structural lift in global production costs that Rabobank’s dairy team has been documenting, and the real question for most dairies becomes, “Given our cost structure, our people, and what we want this farm to look like in ten years, do we lean into selective automation, formalize labor at a higher cost, or plan a controlled transition while we still have options?”
If you’re in that 300–600 cow bracket, this is the labor math that’s going to have a lot to say about whether you’re still milking in ten years.
How H‑2A got so big, so fast
Looking at this trend from thirty thousand feet, USDA economist Marcelo Castillo and his team did a deep dive on H‑2A for the journal Choices. They found that the U.S. Department of Labor certified employers to fill just under 372,000 seasonal farm jobs with H‑2A workers in fiscal year 2022—more than seven times the number in 2005 and roughly double what it was in 2016. That’s a huge structural shift in less than two decades.
And it’s not just that the program has grown; it’s who’s using it. Castillo’s work shows that around 12,200 employers were certified in 2022, but the top 5 percent—roughly 620 operations, each approved for 100 or more H‑2A workers—accounted for about two‑thirds of all certified jobs. Farm labor contractors alone supplied a large share of those positions. So, as many of us have seen, H‑2A has turned into a core labor tool for labor‑intensive crops, not a side program used by a handful of farms.
Dairy, by comparison, has mostly been watching from the sidelines. A big reason is baked into the design. H‑2A was built for “temporary or seasonal” work. Congressional Research Service reports spell that out clearly: by statute, year‑round industries like dairies, greenhouses, and many livestock operations don’t fit neatly into the current rules. Folks at American Farm Bureau Federation have said the same thing in interviews, pointing out that dairy, livestock, and greenhouse employers often can’t legally use H‑2A for the year‑round jobs they need filled.
Looking at this trend politically, pressure to change it is building. Dairy and meat industry leaders have pushed hard for access to year‑round H‑2A labor, and several recent immigration and farm labor proposals in Congress—including versions of the Farm Workforce Modernization Act and related efforts—have included provisions for limited year‑round H‑2A visas that would explicitly cover dairies and other non‑seasonal operations. Policy coverage into 2025 and early 2026 notes that these proposals would, if enacted, create capped pools of year‑round H‑2A positions and formally recognize dairy’s year‑round labor needs, but as of early 2026, they remain proposals rather than settled law. So the mix of hope and frustration producers feel—“Every politician says they understand dairy’s problem, but we still don’t have a year‑round fix”—is grounded in the current policy reality.
If you hop north into Ontario, the mechanics are different, but the flavor is similar. Canadian producers rely on the Temporary Foreign Worker Program and the Seasonal Agricultural Worker Program, and federal guidance makes it clear that those programs also come with strict requirements around approved housing, travel arrangements, and documentation. The tool names change across the border; the core challenge doesn’t. You can get legal, reliable labor, but it takes real money and real management.
H‑2A labor costs: it’s a lot more than an hourly wage
On the surface, H‑2A starts with one number: the Adverse Effect Wage Rate, or AEWR. That’s the minimum hourly wage you’re required to pay H‑2A workers in your state. USDA and CRS explain that AEWR is based on USDA’s Farm Labor Survey and, in many states, has moved into the mid‑ to high‑teens per hour, with some regions above that. American Farm Bureau government affairs staff have pointed out that, nationally, AEWR has jumped by roughly 20 percent over about five years, while revenue for many labor‑intensive crops hasn’t kept pace.
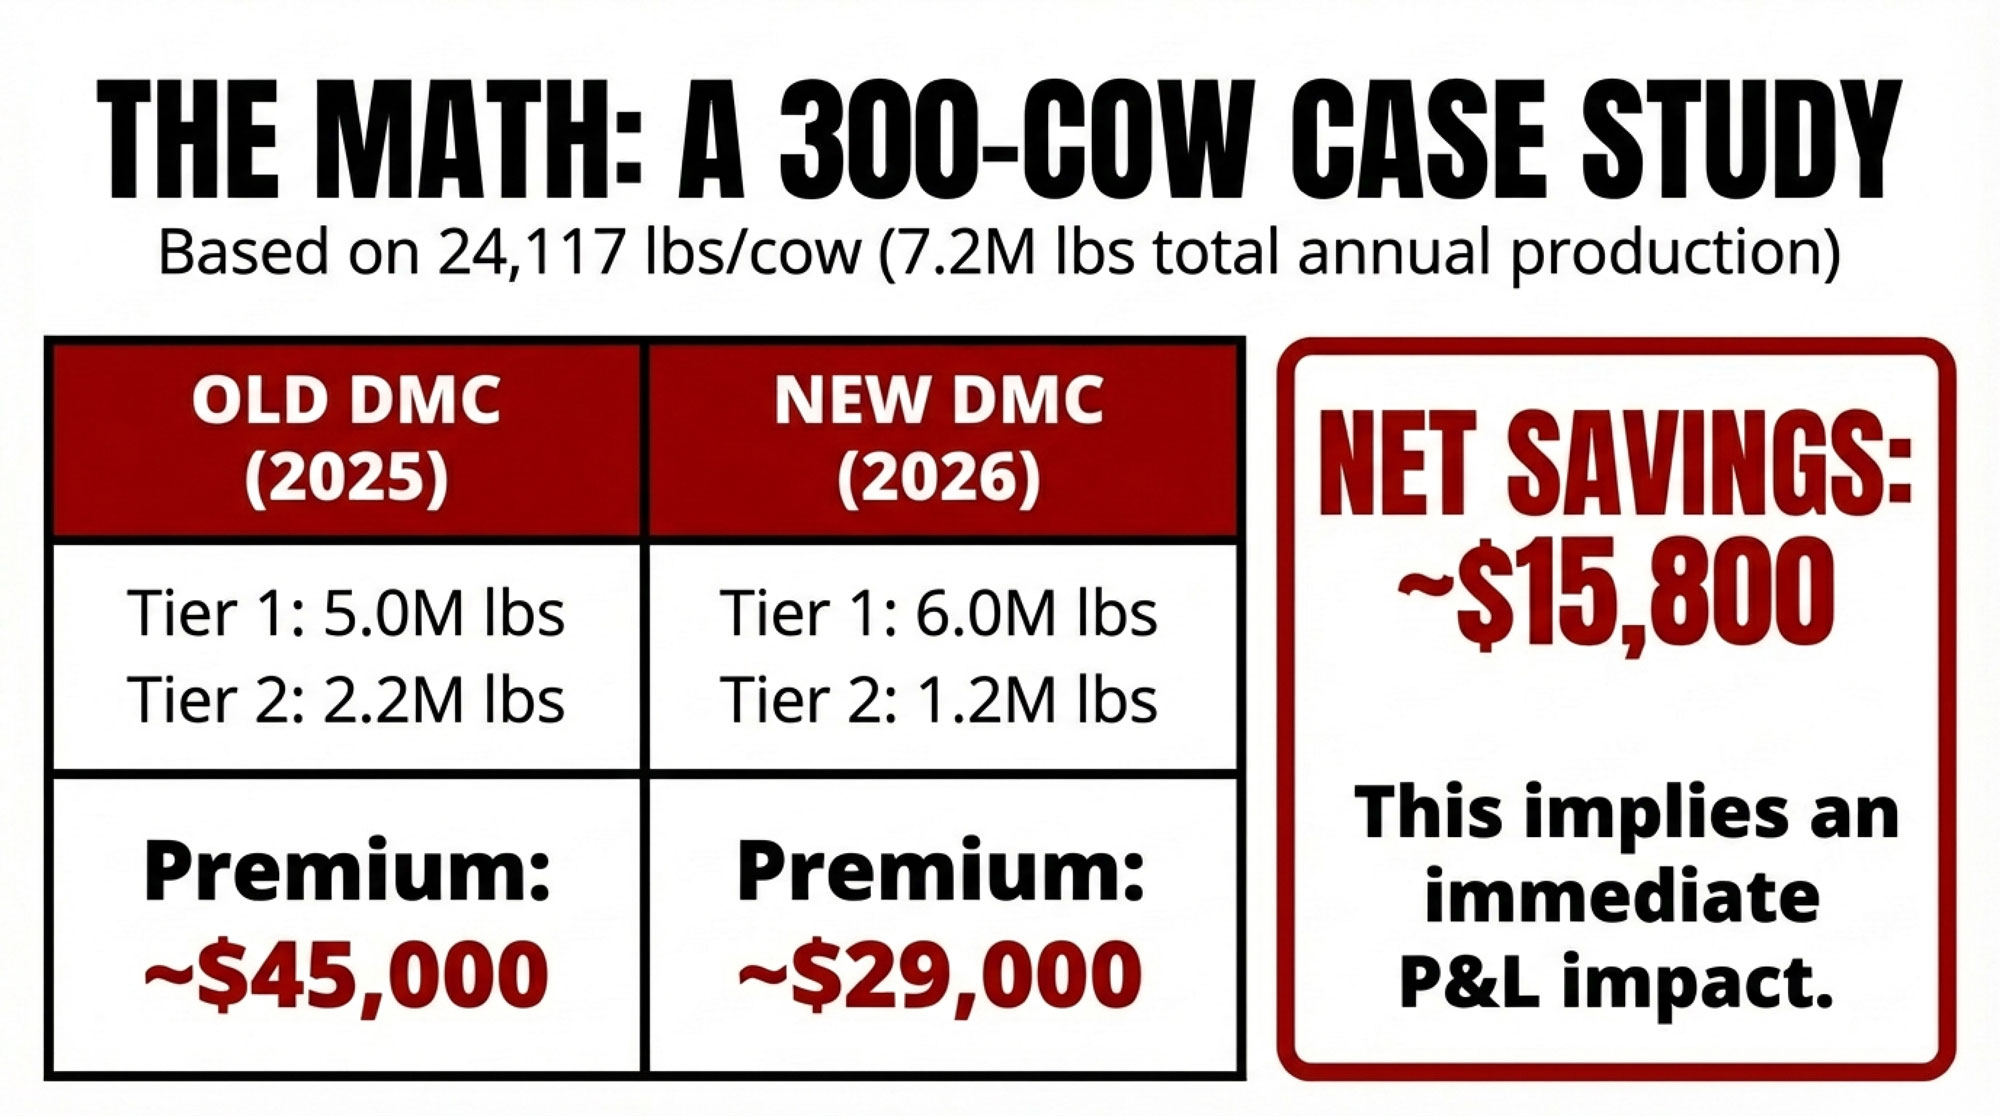
| Cost Category | Amount (USD) | % of Total |
|---|---|---|
| AEWR Wages (6 months @ $18.50/hr, ~1,080 hours) | $19,980 | 67.7% |
| Housing (on-farm or rental, utilities, maintenance) | $4,200 | 14.2% |
| Transportation (airfare, ground travel, visa) | $3,800 | 12.9% |
| Recruitment & Admin (legal, HR, processing fees) | $1,520 | 5.2% |
| Total Employer Cost | $29,500 | 100% |
But what I’ve found is that the hourly wage is only the tip of the iceberg.

Castillo’s ERS analysis emphasizes three big non‑wage buckets that matter just as much as the posted rate.
- Housing. Employers have to provide housing that meets specific federal and state standards at no cost to the worker. In practice, that often means building or renovating bunkhouses on‑farm or renting apartments in town, then paying for utilities, maintenance, and inspections. USDA’s own H‑2A assistance initiatives and Farmers.gov resources highlight housing as one of the biggest cost and compliance barriers.
- Transportation. H‑2A employers must pay for workers’ travel from their home country to the job site and back, and they’re responsible for daily transportation between housing and the farm. Congressional researchers list transportation costs as a major recurring expense across H‑2A employers.
- Recruitment and administration. Someone has to prepare job orders, manage consulate appointments, track wages and hours precisely, and maintain records for potential audits. Many farms either dedicate a staff member or hire an outside consultant or attorney. Employment experts interviewed by Brownfield describe the program as “complex” and “paperwork‑heavy,” which aligns with what many producers have encountered.
When Castillo’s team put numbers to a “typical” six‑month H‑2A contract, they estimated that wages alone came to about $19,500, and, once you add in minimum housing, transportation, and other non‑wage costs, total employer cost lands at least around $29,500 per worker. So the idea that foreign labor is “cheap” doesn’t hold up very well when you look at that full bill.
On several Midwestern and Northeastern dairies that have used H‑2A, the pattern is similar. Folks go into it thinking, “We’ll finally get cheap, reliable help,” and walk out saying, “We did get stability and legal peace of mind, but we paid more per worker than we expected once housing, travel, and compliance were counted.” For some operations, that trade—higher cost in exchange for stability—is worth it. For others, it just doesn’t pencil.
Why compliance has become a management job, not just paperwork
Even if you never touch H‑2A paperwork, labor compliance has drifted into the same category as mastitis control and fresh cow management: you can’t afford to ignore it.
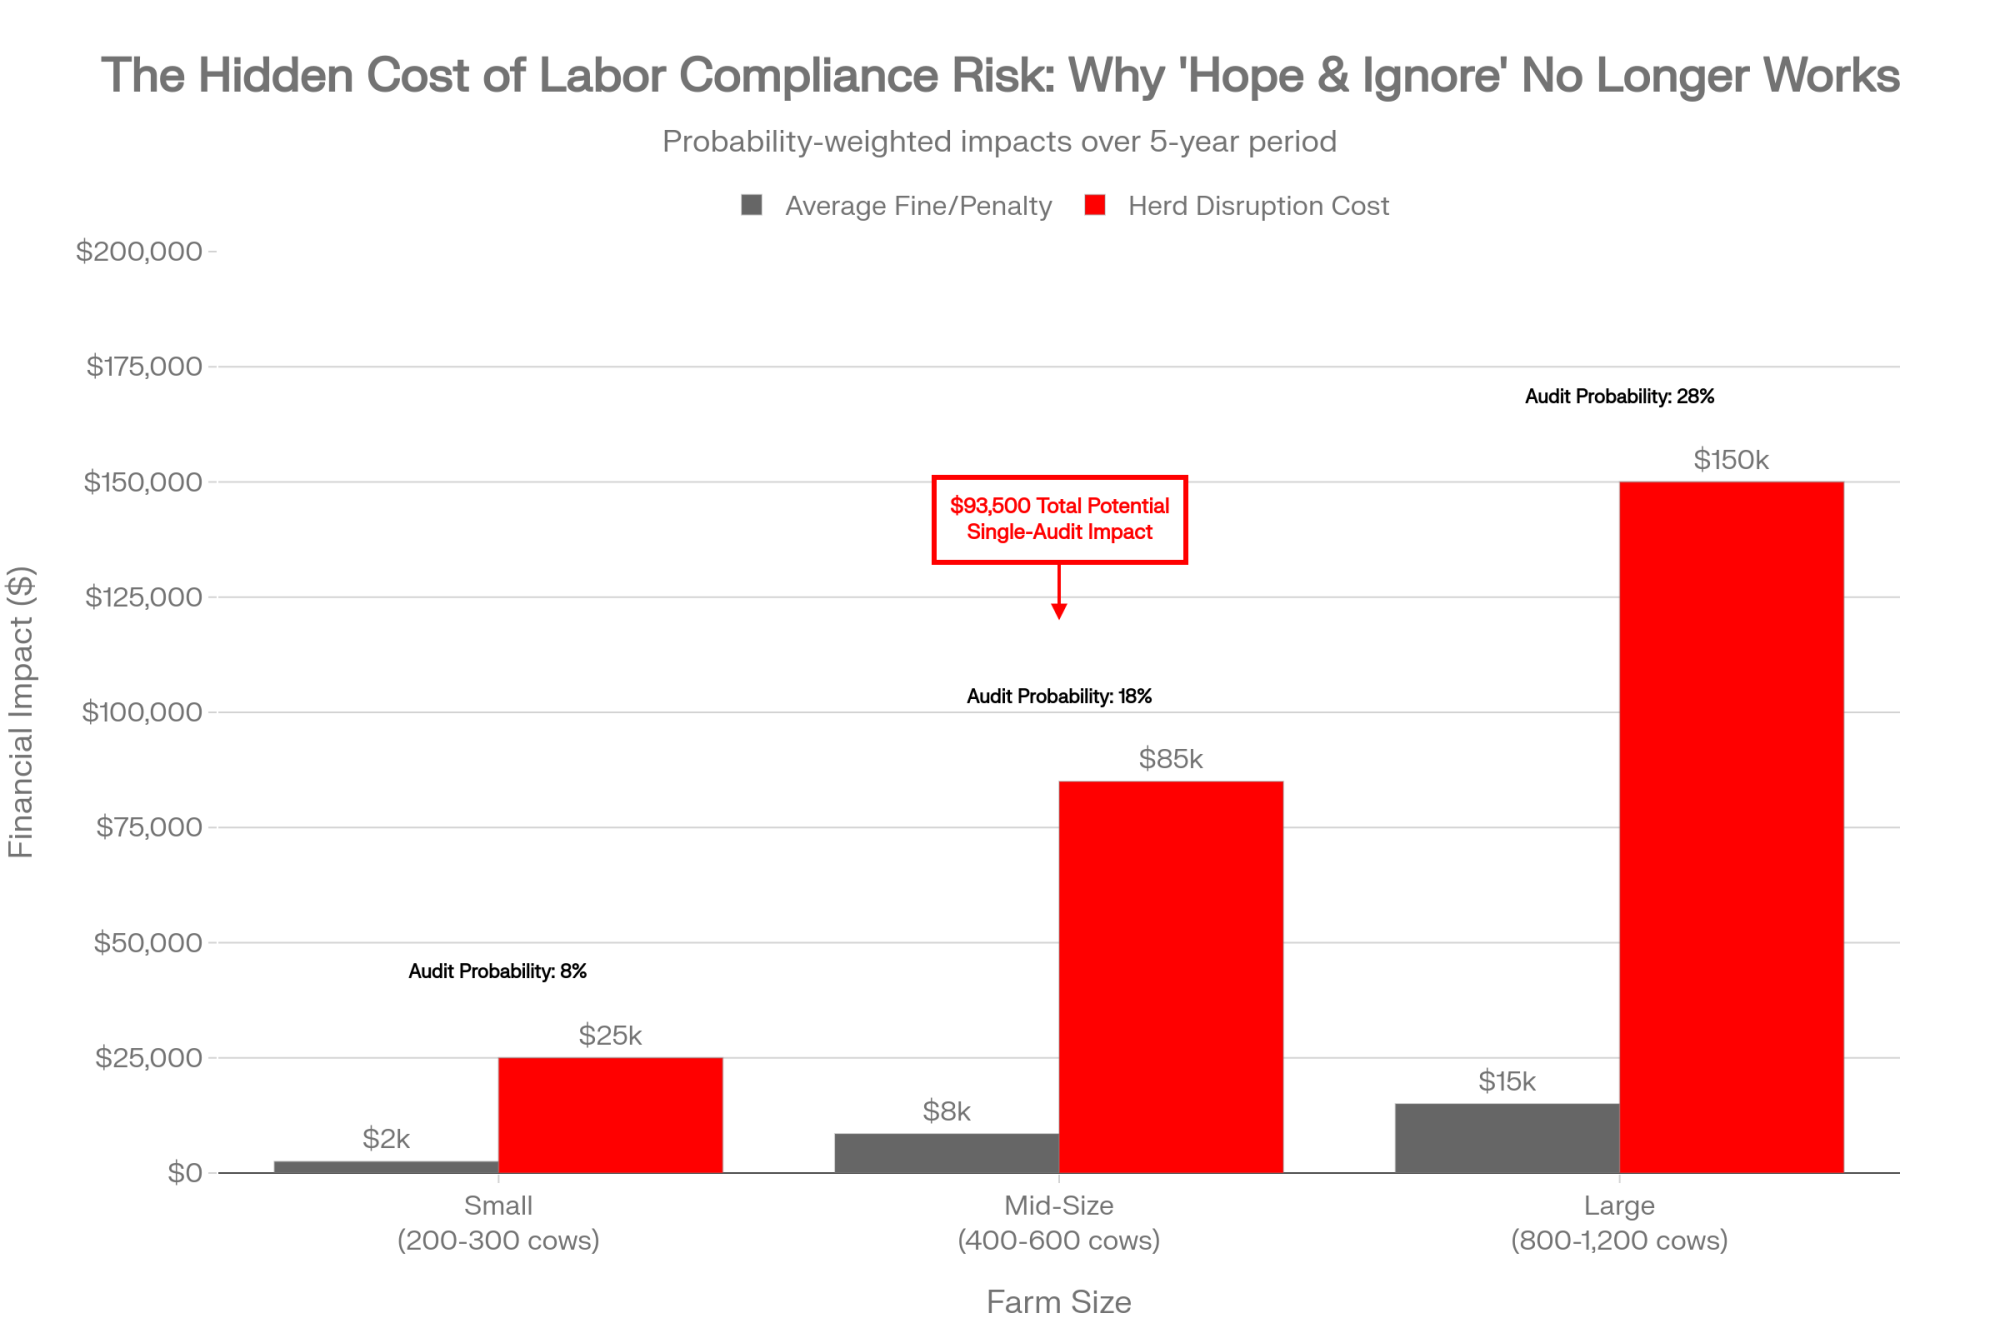
| Farm Size | Herd (cows) | Full-Time Employees | 5-Yr Audit Probability | Average Fine if Audited | Disruption Cost (Lost Production) | Total Risk Impact |
|---|---|---|---|---|---|---|
| Small | 200–300 | 3–4 | 8% | $2,500 | $25,000 | $2,700 (probability-weighted) |
| Mid-Size | 400–600 | 8–12 | 18% | $8,500 | $85,000 | $16,900 |
| Large | 800–1,200 | 15–20 | 28% | $15,000 | $150,000 | $46,200 |
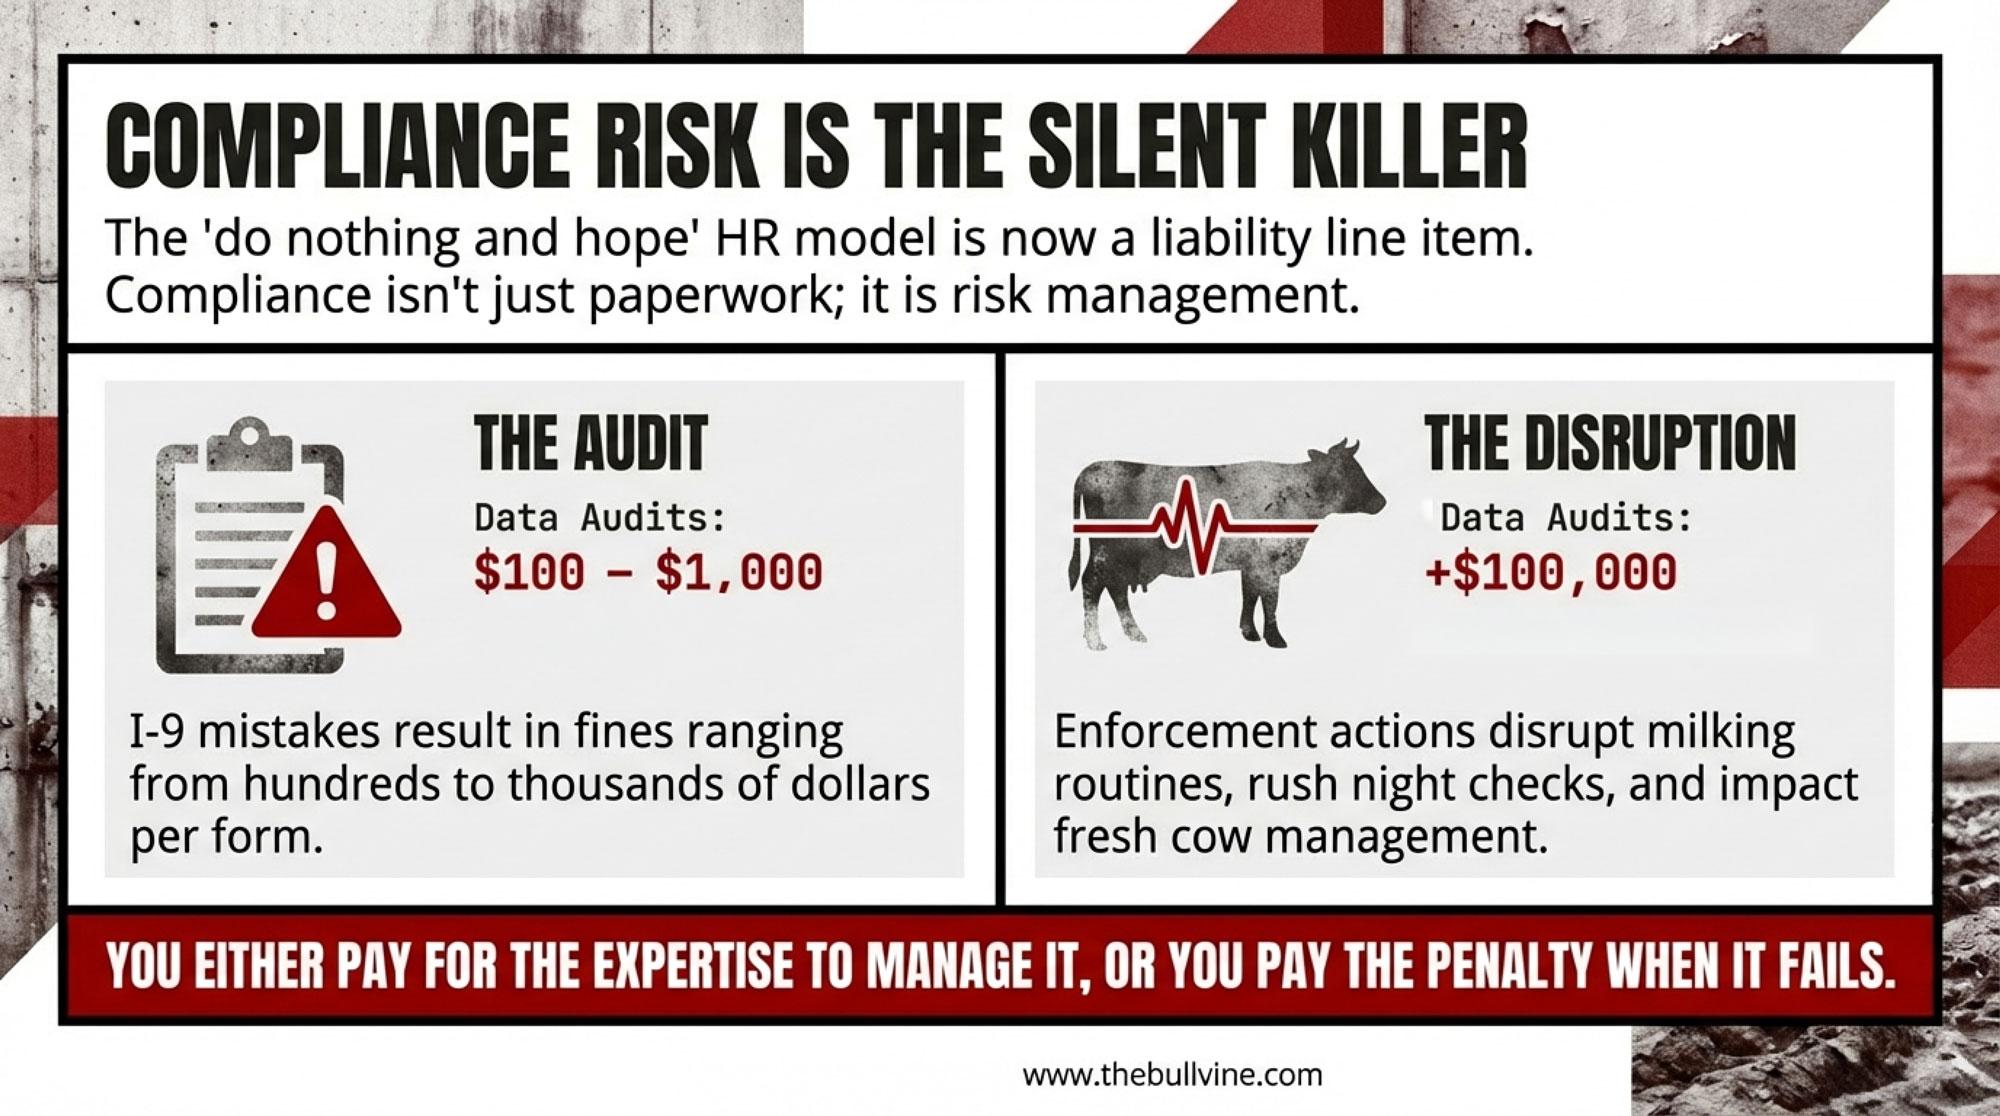
Current federal penalty schedules show that mistakes on I‑9 forms can result in fines ranging from the low hundreds of dollars per form to the low thousands as the share of incorrect forms and prior violations increases. The latest CRS report on H‑2A and farm labor notes that more serious violations—repeat offenses, unsafe housing or transportation, clear wage underpayment—can lead to significantly higher penalties, back‑wage orders, and, for H‑2A users, possible debarment from the program.
On a dairy, that’s not theoretical. If an audit or enforcement action suddenly disrupts part of your crew, you feel it almost immediately in milking routines, fresh cow checks, and even butterfat performance. Milking shifts run longer, night checks get rushed, and transition cows don’t get quite the eyes they need. And if you, as the owner or manager, are tied up for days gathering records and sitting in meetings, that’s less time walking pens, watching TMR consistency, and working with your people.
So it’s worth noting that more herds and advisors are treating labor compliance as a risk management line item instead of something you hope never lands on your doorstep. That might mean budgeting a modest amount each year for an attorney or HR professional to review I‑9s and wage practices, scheduling internal audits of paperwork, and putting in place at least a basic HR system. Not because anyone enjoys it, but because the “do nothing and hope” model has just gotten too risky.
The global cost squeeze: why, where, and how you milk matters more
Now, zooming out a bit helps explain why these labor decisions feel so tight right now.
| Region | Cost/Litre (USD) | Cost/cwt (approx.) | Gap vs. NZ |
|---|---|---|---|
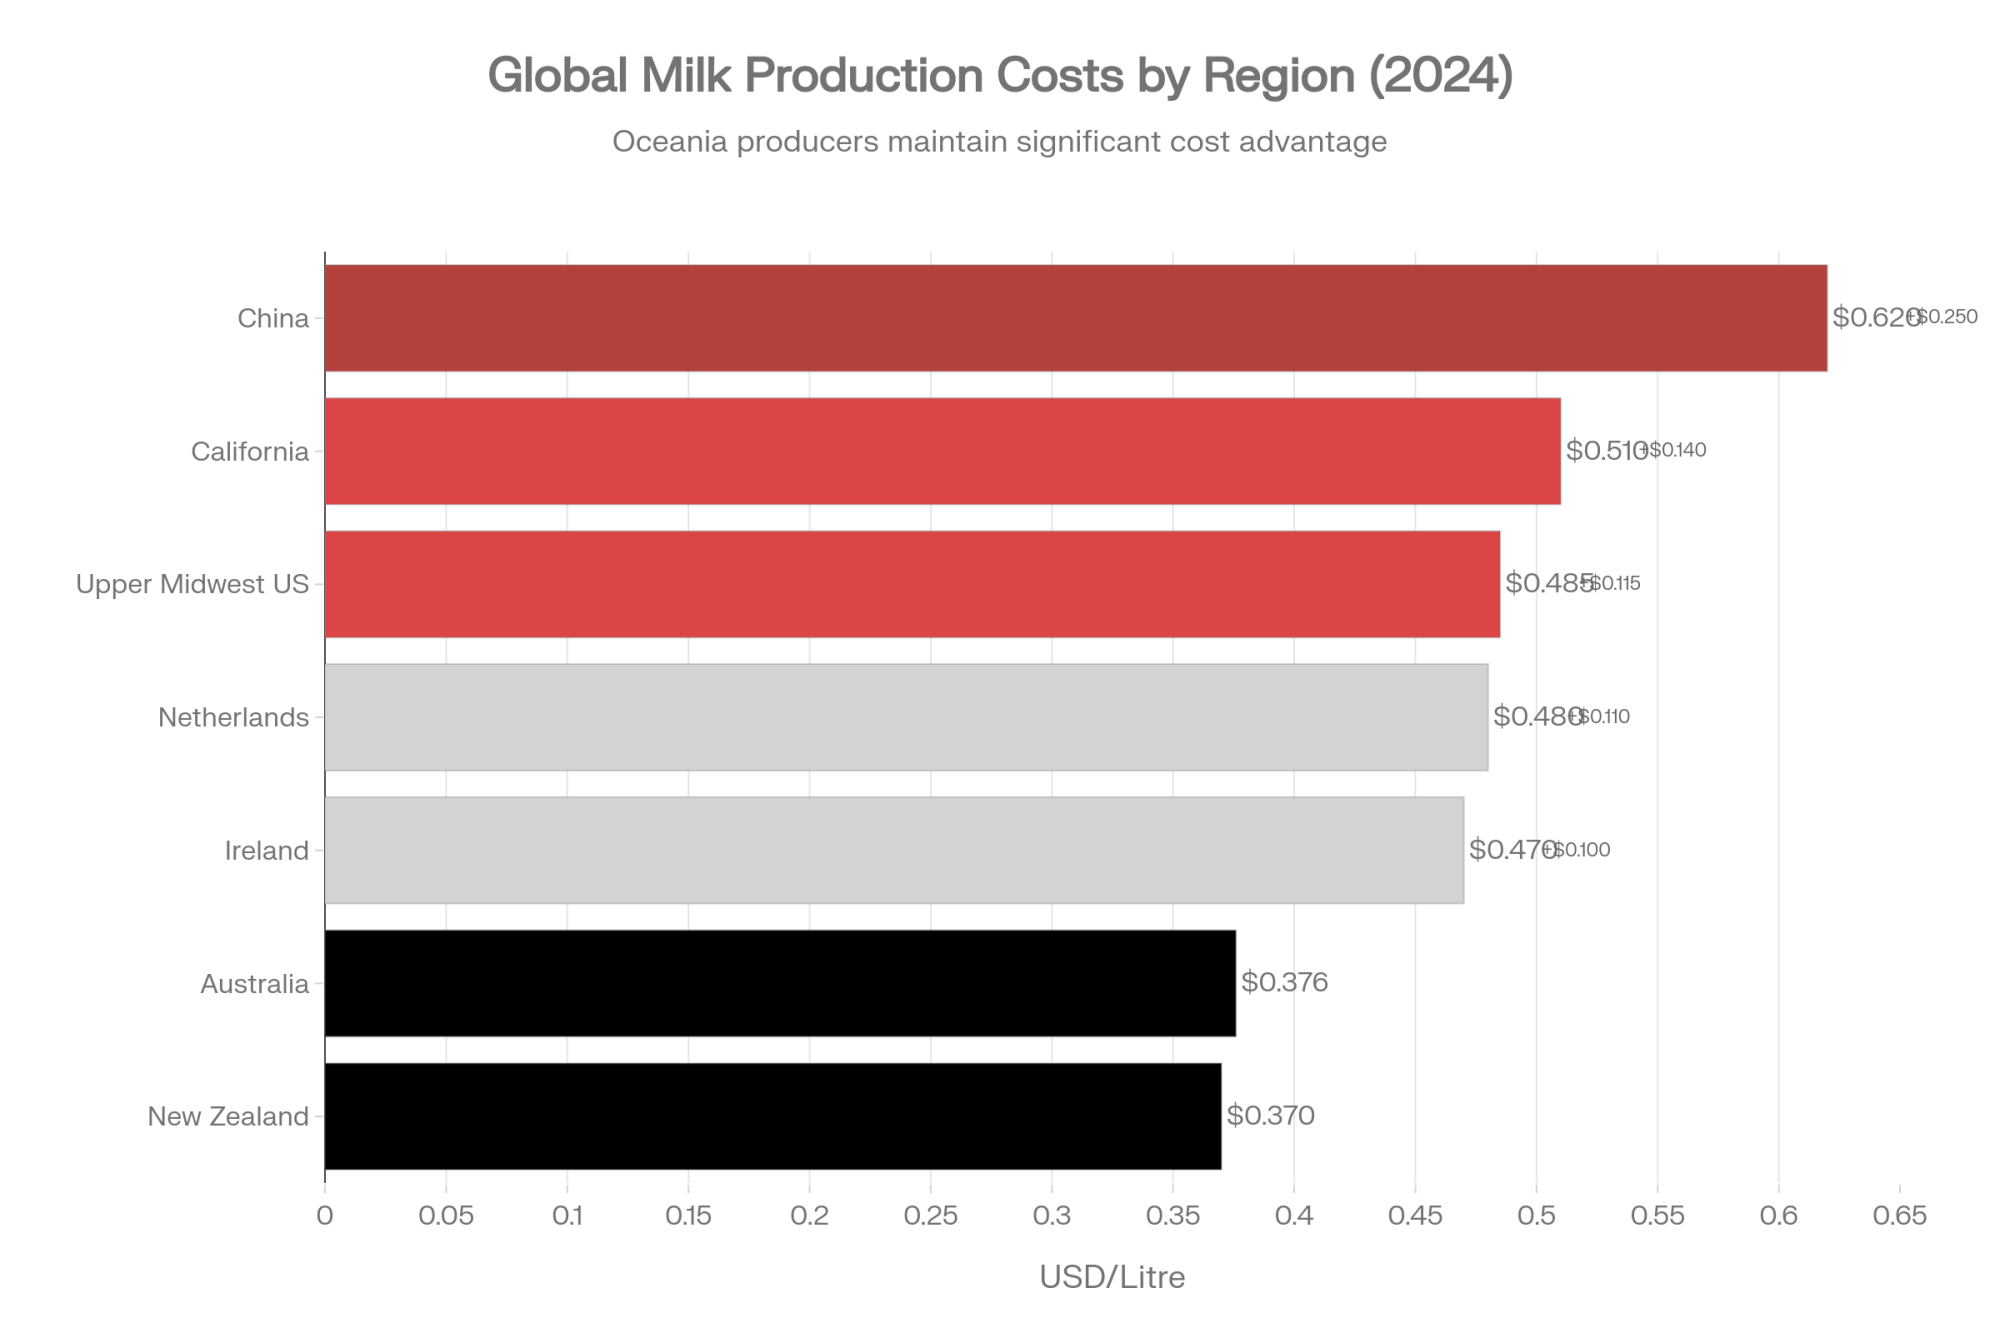
| New Zealand | $0.370 | $16.95 | Baseline |
| Australia | $0.376 | $17.27 | +$0.006 |
| Ireland | $0.470 | $21.58 | +$0.100 |
| Netherlands | $0.480 | $22.03 | +$0.110 |
| Upper Midwest US | $0.485 | $22.27 | +$0.115 |
| California | $0.510 | $23.41 | +$0.140 |
| China | $0.620 | $28.47 | +$0.250 |
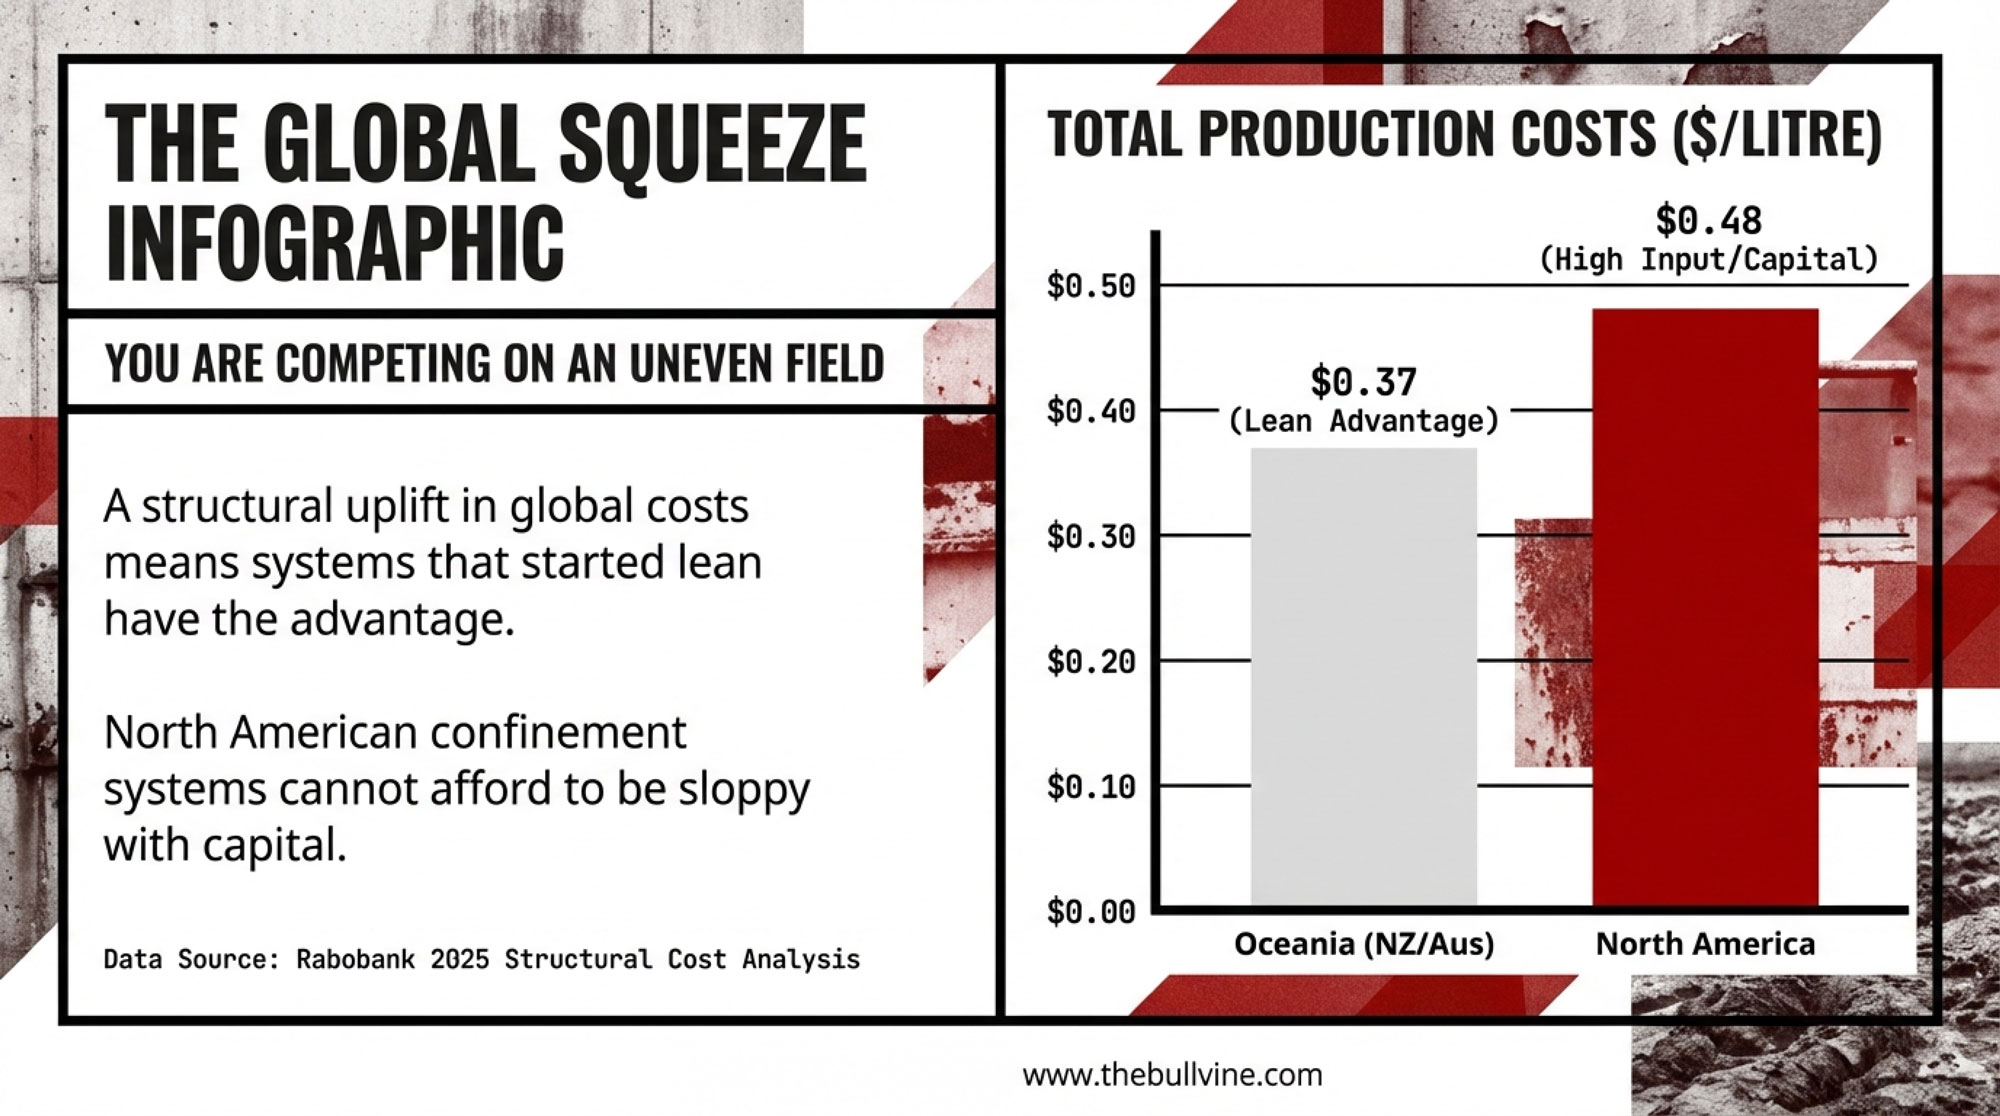
Rabobank’s dairy team has been benchmarking milk production costs across the major exporting regions—New Zealand, Australia, the U.S., the EU, and others. In a 2025 release, they described seeing a “structural uplift” in production costs across eight key exporters over roughly the last five years, with average costs up by low double‑digit percentages since 2019 as feed, fertilizer, and labor all climbed.
Here’s what’s interesting. Even with those cost increases, New Zealand and Australia still sit near the bottom of the global cost ladder. Rabobank senior dairy analyst Emma Higgins notes that the two Oceania countries have “competed neck and neck” as the lowest‑cost producers, and that New Zealand currently holds about a five‑U.S.‑cents‑per‑litre cost advantage over Australia for 2024. Looking at the last five years, Rabobank estimates average total production costs of roughly US$0.37 per litre for both New Zealand and Australia, compared with around US$0.48 per litre for the other exporting regions. They also point out that exchange rate movements have effectively widened New Zealand’s cost edge by about 8–9 percent compared with 2019.
A lot of that comes back to system design. New Zealand’s pasture‑based setups, high cows‑per‑worker ratios, and relatively light permanent infrastructure keep capital and operating costs per litre low. Australian systems share some of those traits, though higher labor and input costs have eroded their relative advantage somewhat.
When you swing back to North America, the picture changes:
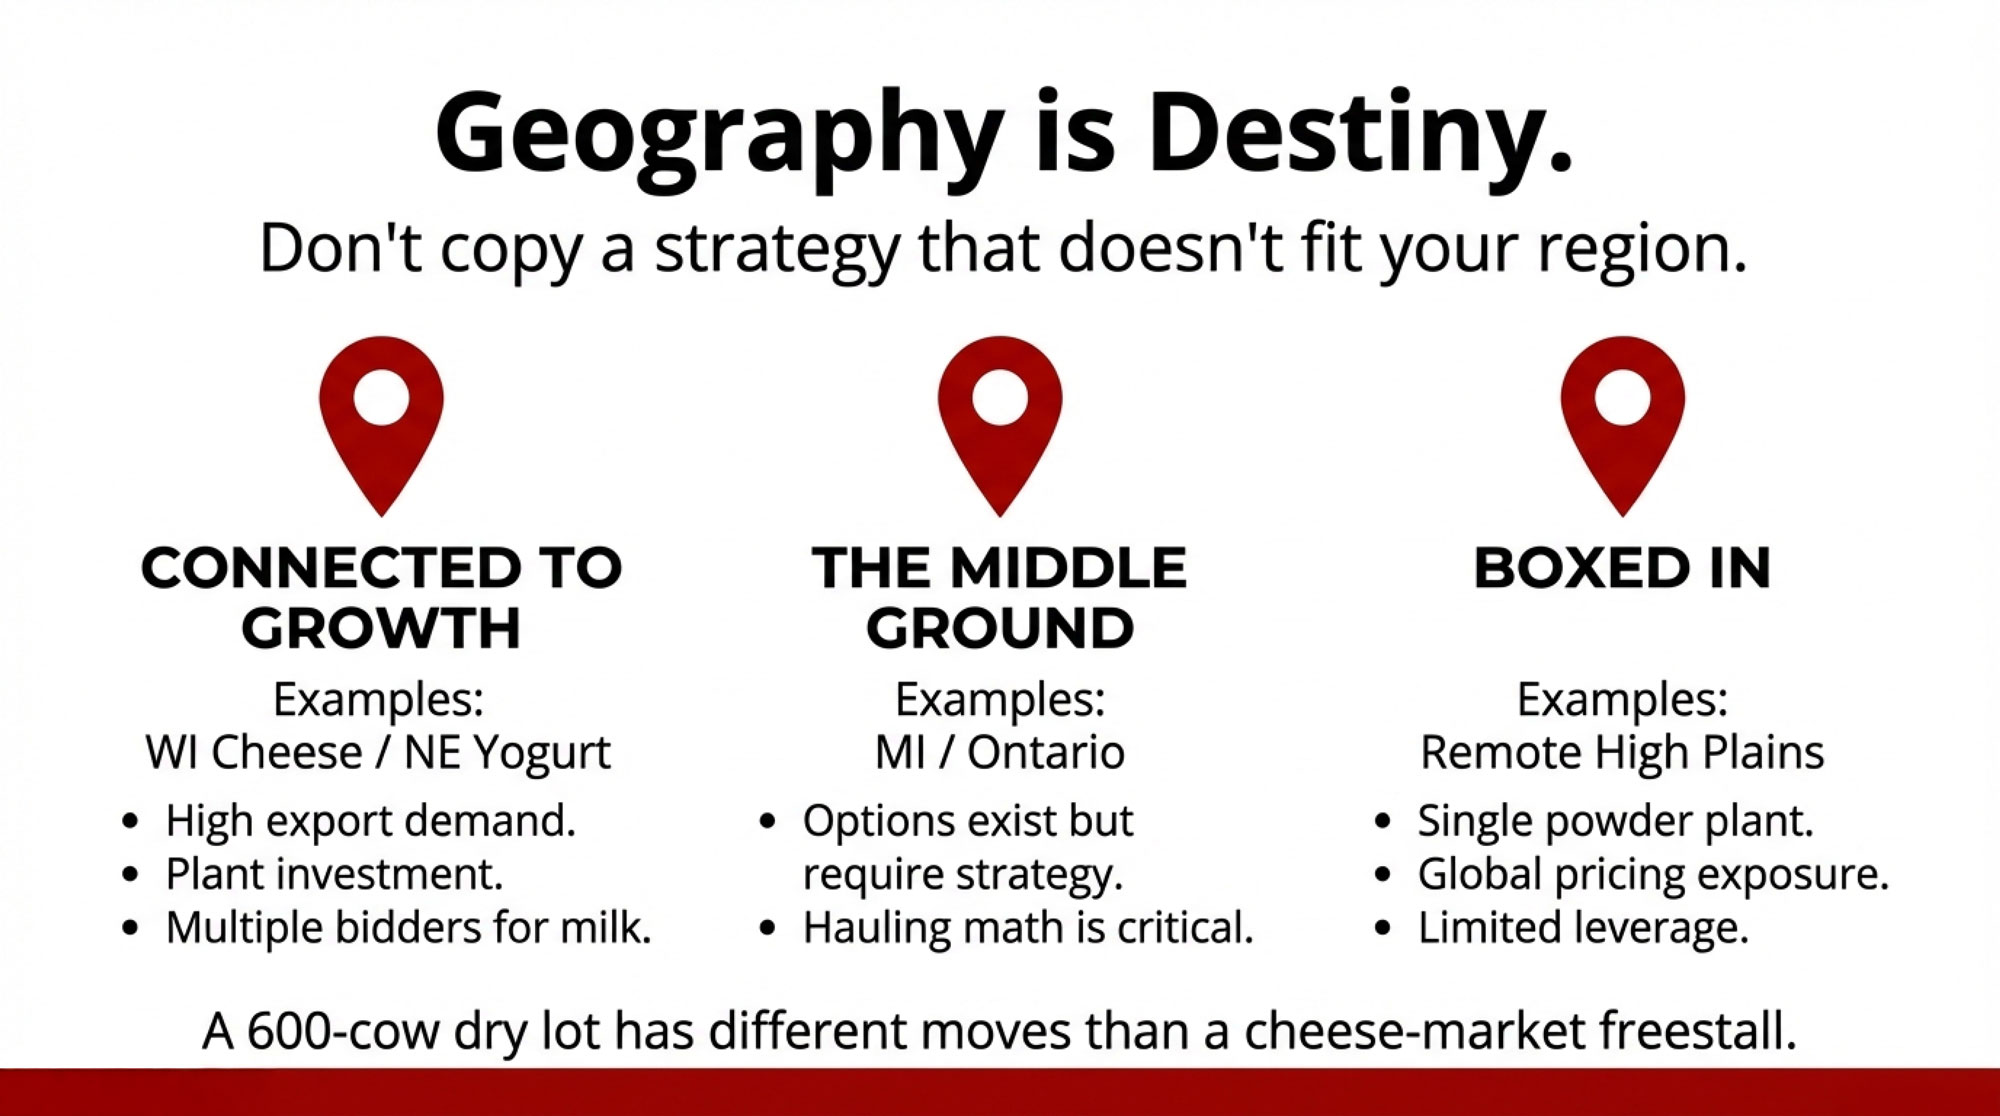
- In California, you’re talking about high‑input freestall and dry lot systems, a heavy reliance on purchased or custom‑grown feed, relatively high wage rates, and a lot of capital tied up in manure handling and environmental compliance, as Western U.S. cost of production and policy reports show.
- In the Upper Midwest, many herds benefit from strong homegrown forage and proximity to grain, but long winters mean housing cows, managing manure, and maintaining barns, all of which show up in fixed costs per cow in university cost‑of‑production summaries.
- In the Northeast and Ontario, plenty of farms run mixed systems—grazing when the weather allows, then housing herds through the cold months. That brings some pasture advantages, but the reality of winter infrastructure doesn’t go away, as regional and provincial benchmarks make clear.
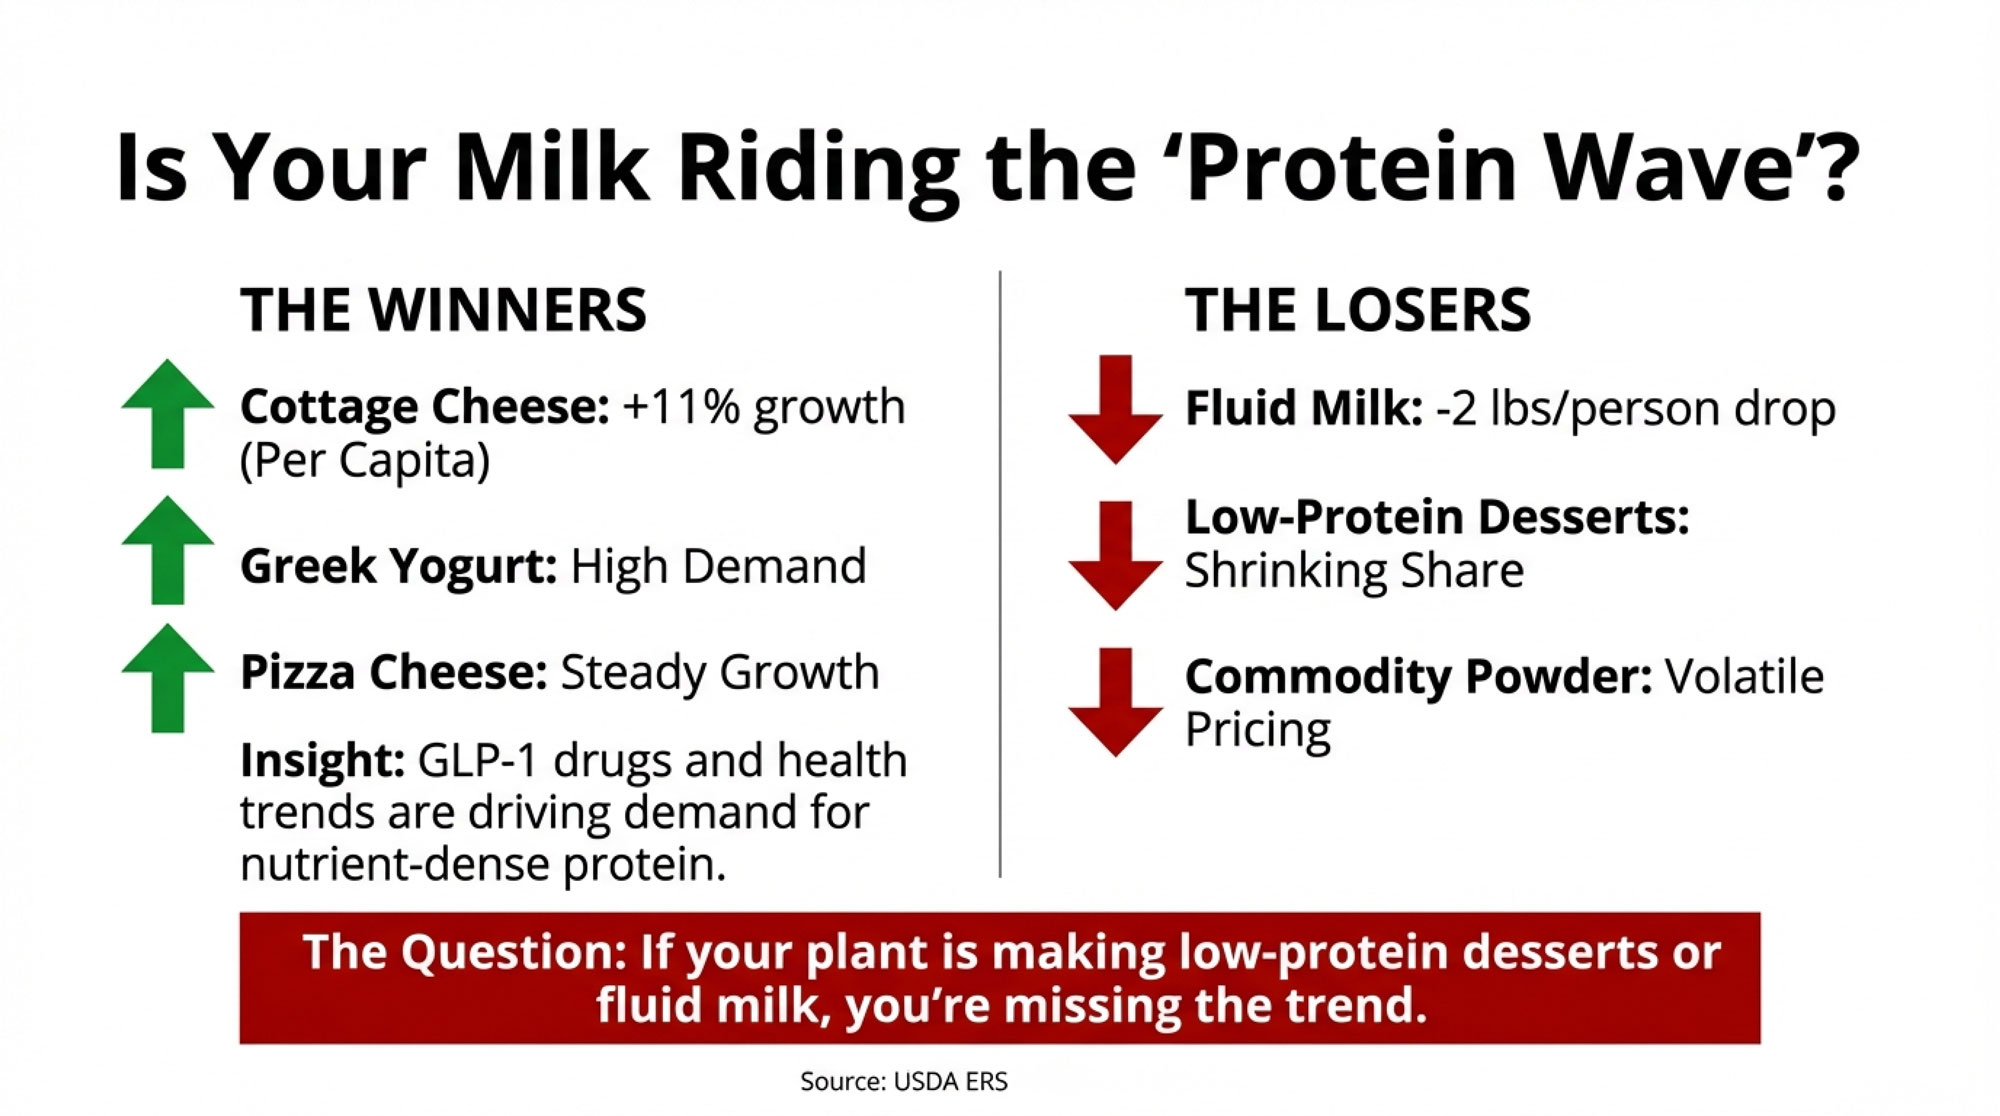
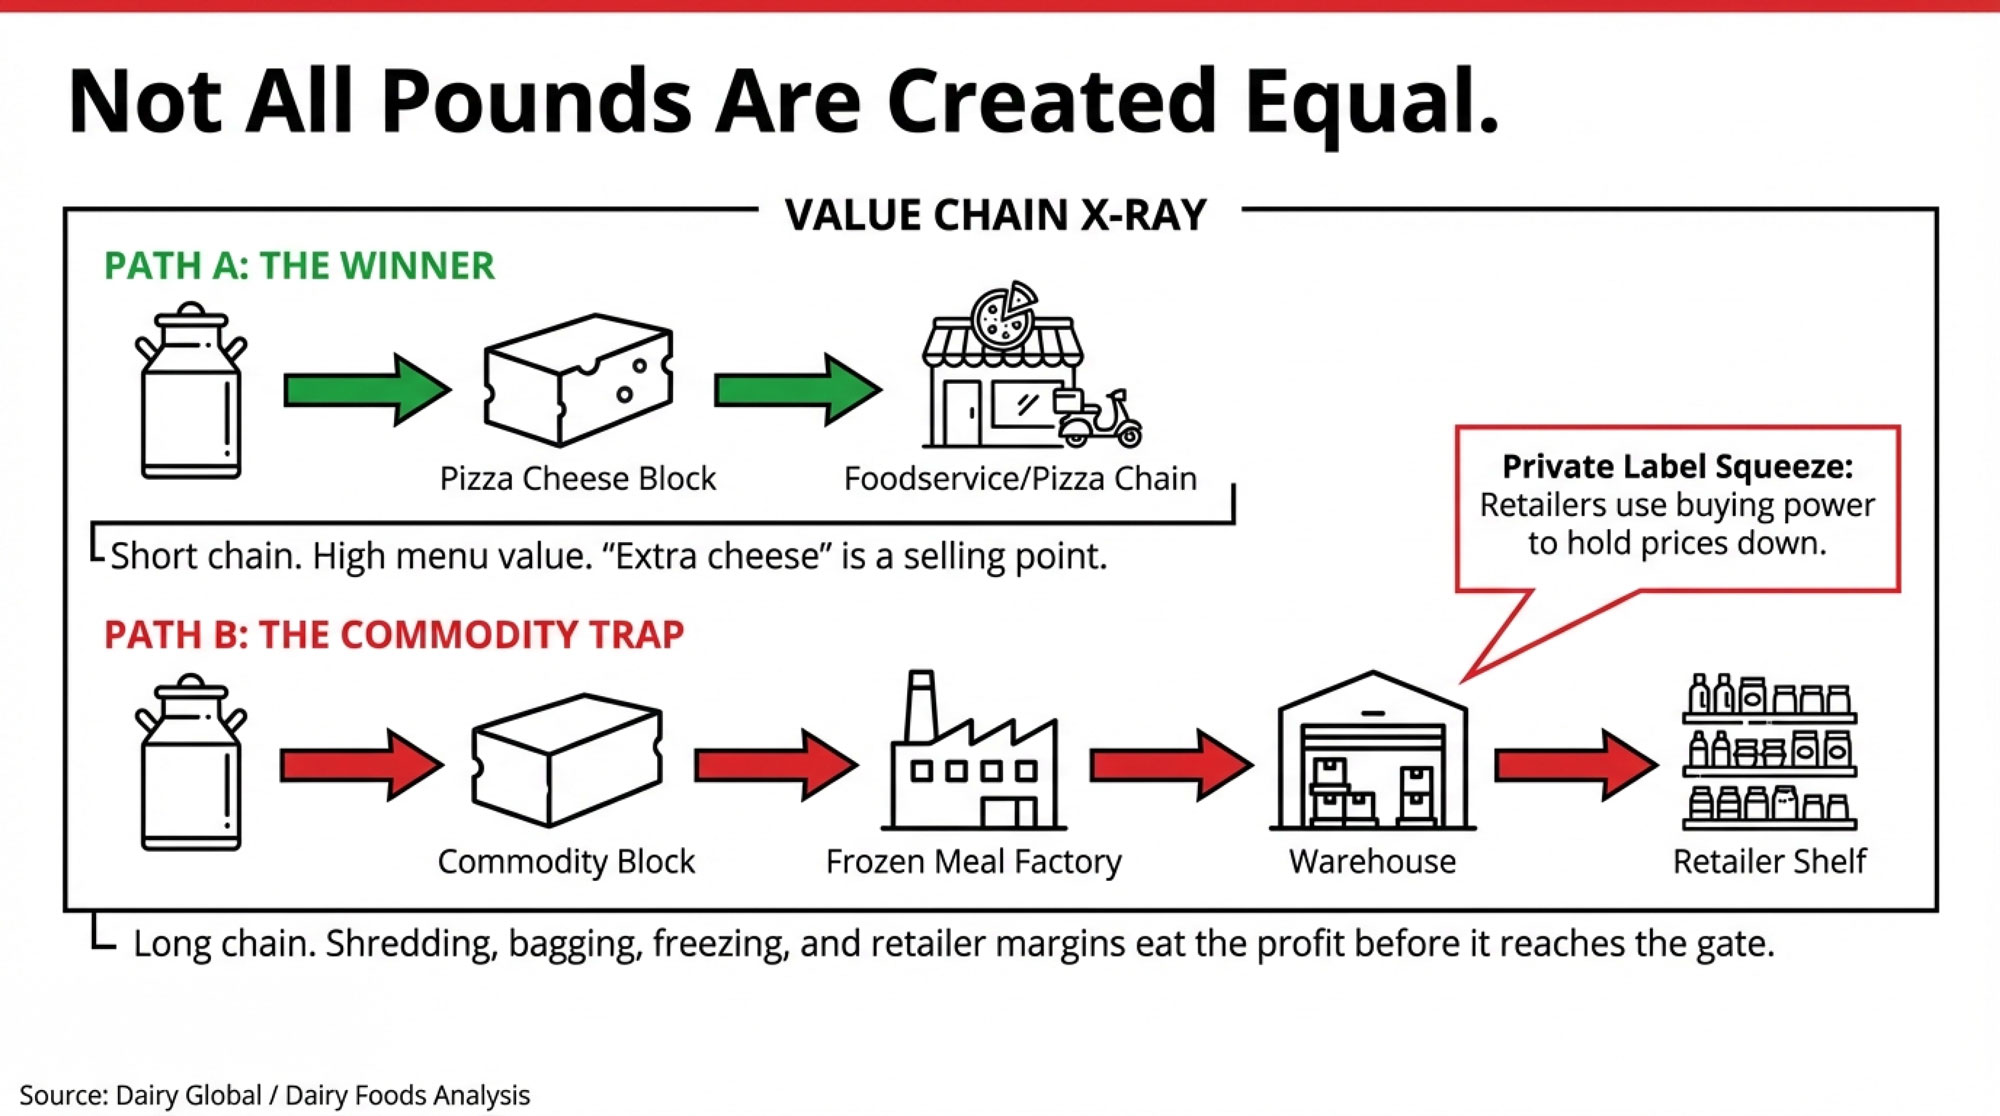
So when Rabobank says there’s been a structural cost lift across the world, what the numbers are also saying is this: the systems that started lean have more room to absorb those cost increases. If you’re in a higher‑input, higher‑capital setup in North America, every decision about labor, feed, and investment hits your cost per hundredweight harder, and that matters when you’re competing with milk coming from lower‑cost pasture‑based regions.
What the numbers really say about robots and labor
Let’s bring robots into this, because that’s where a lot of labor conversations end up.

| Herd Size | Annual Labor Savings ($/year) | Payback Period @ 3% | Payback Period @ 5% | Payback Period @ 7% | Payback Period @ 8.5% |
|---|---|---|---|---|---|
| 250 cows | $90,000 | 2.0 yr | 2.3 yr | 2.7 yr | 3.2 yr |
| 350 cows | $126,000 | 1.4 yr | 1.7 yr | 2.1 yr | 2.4 yr |
| 400 cows | $168,000 | 1.1 yr | 1.4 yr | 1.7 yr | 2.0 yr |
| 500 cows | $210,000 | 0.9 yr | 1.1 yr | 1.4 yr | 1.6 yr |
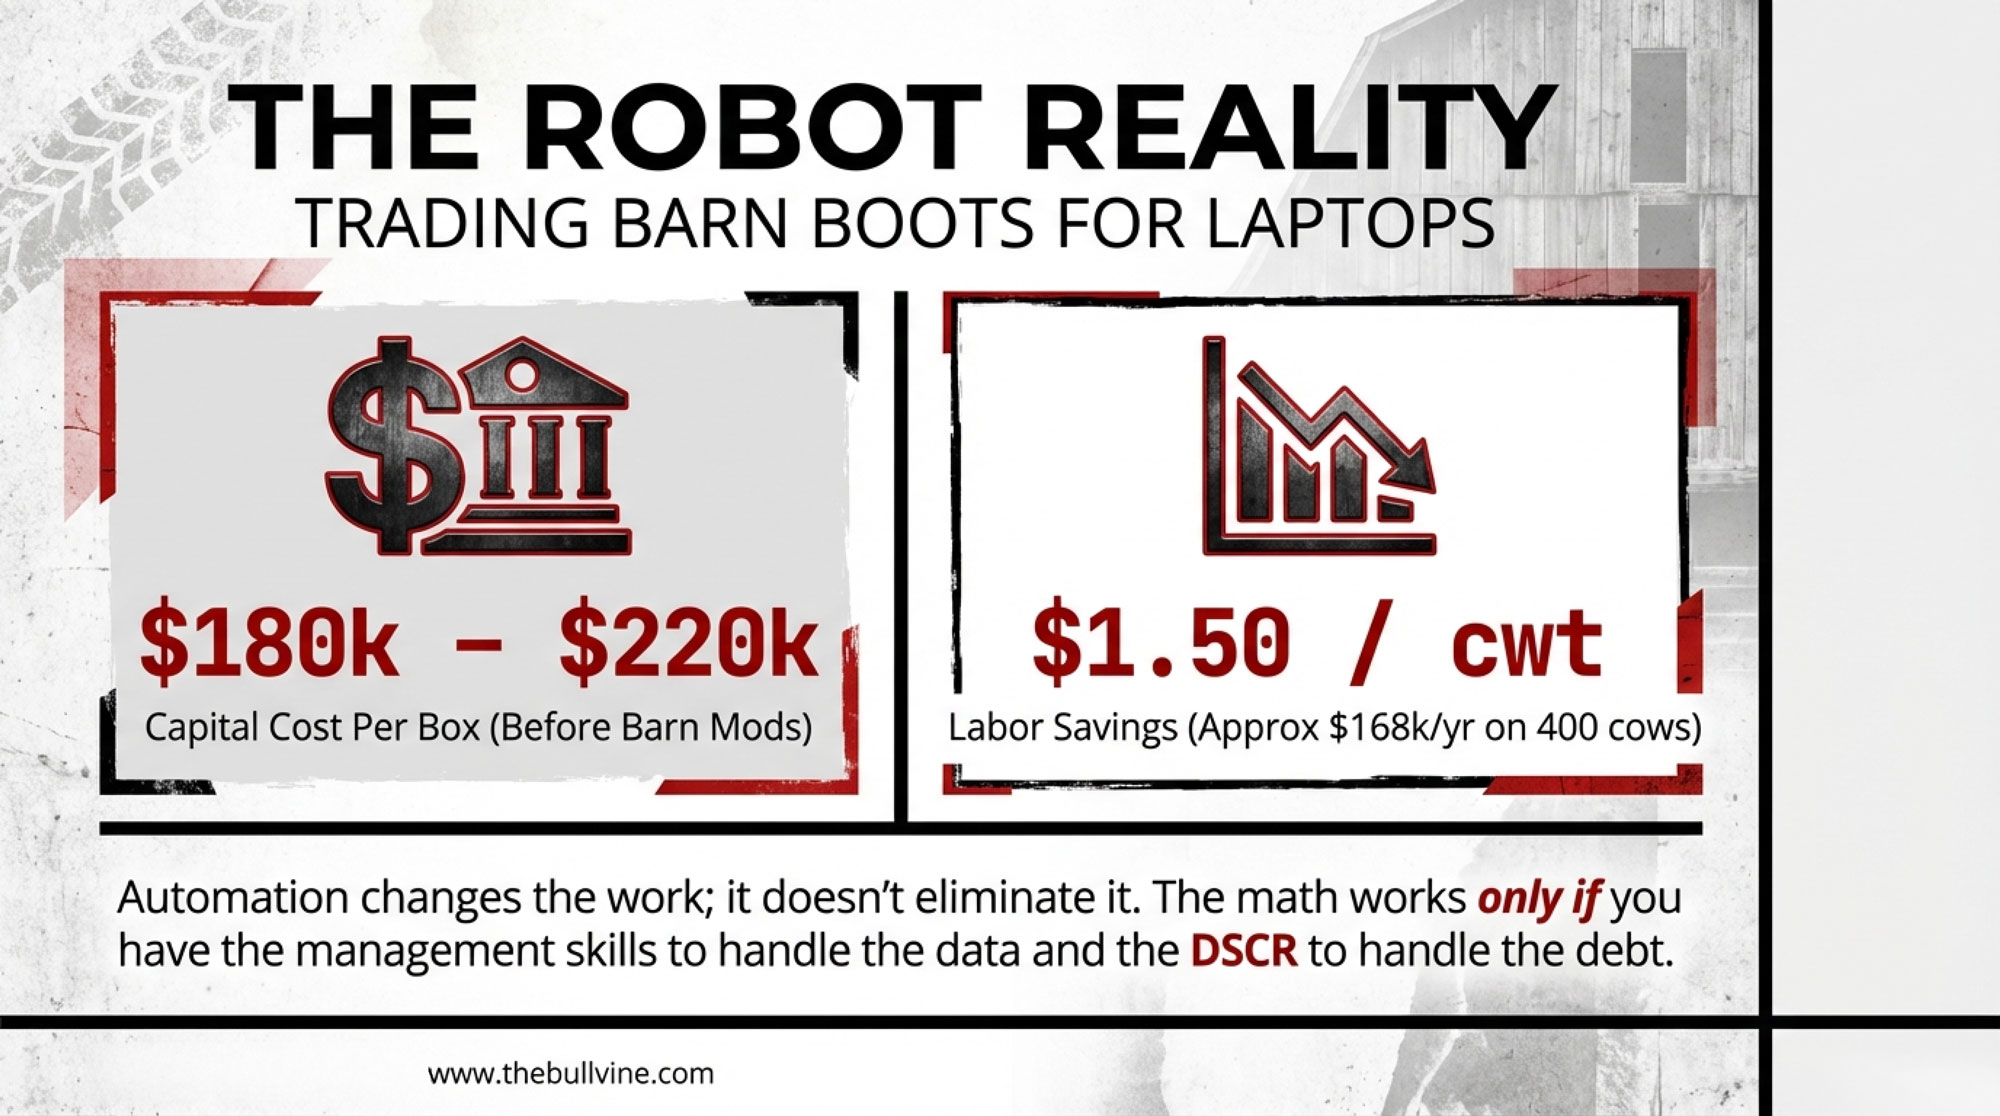
The University of Wisconsin conducted a careful analysis of what automatic milking systems actually do to reduce labor on U.S. farms. In a survey of 50 dairies that adopted box‑style AMS, extension economists found that, on average, farms reduced labor time by a little over 0.06 hours per cow per day. When they looked at it per hundredweight, labor time dropped about 0.10 hours per cwt. At an assumed wage of $15 per hour, that worked out to about $1.50 in labor cost savings per hundredweight of milk shipped.
In percentage terms, the Wisconsin team reported that the time required per cow fell by about 38 percent and the time per hundredweight by about 43 percent after AMS adoption. Some farms saw very little savings—often due to maintenance headaches or management issues—but roughly a quarter of the herds reported much larger reductions, translating to more than $2.40 per hundredweight in labor savings at that same $15 wage.
Now, put that into a herd size that many of you are in. Say you’re milking 400 cows and averaging 28,000 pounds per cow per year. That’s about 11.2 million pounds of milk annually, or 112,000 hundredweight. Multiply that by $1.50 per cwt in labor savings and you’re looking at roughly $168,000 per year in reduced labor costs, before you account for any changes in milk yield, components, or the extra time someone spends managing the technology. That’s the kind of math that will make anybody stop stirring their coffee and think, “Okay… what would that look like here?”
Researchers looking at AMS adoption in Norway have heard similar things, even though their systems and labor markets differ from ours. A recent peer‑reviewed paper in the journal Animals found that Norwegian farmers using multi‑box AMS generally perceived substantial reductions in labor needs, earlier detection of sick cows, and better mastitis management, and a meaningful share reported improved milk fat and protein levels after switching. Those are perceptions, not controlled trials, but they align with what many AMS herds in Europe and North America report to extension staff and industry journalists.
The work changed on those farms. Instead of spending as many hours in the pit, producers and staff spent more time looking at herd management software, following up on activity and rumination alerts, and handling preventive maintenance and troubleshooting.
“The work changed… Some described the shift as trading barn boots for a laptop—a sentiment echoed across both sides of the Atlantic.”
Extension folks and consultants here have been making the same point for years: robots don’t remove labor; they change the kind of labor you need. You trade a chunk of routine milking time for tech oversight, data interpretation, and cow‑flow management. That can be a very good trade if you’re struggling to fill repetitive milking positions and you have the management bandwidth—or someone on your team—who enjoys the technical side.
On the capital side, nobody pretends that AMS is cheap. A single robotic unit capable of handling 60–70 cows can cost between $150,000 and $275,000, depending on the model and support package. University economic tools and field experience often use a working range of about $180,000 to $220,000 per box before barn modifications, and real‑world projects frequently climb higher once you include concrete, cow‑traffic changes, sort gates, power upgrades, and so on.
At today’s interest rates, that financing cost becomes a big part of the payback equation. That’s why AMS investment tools from universities like Michigan State and Wisconsin encourage farms to plug in multiple milk price and interest rate scenarios, not just a best‑case line. If your DSCR has been under 1.0 for three of the last five years, it’s a fair question to ask: are you really in a position to add another big pile of robot debt?
The middle ground: automation that isn’t “all or nothing.”
What farmers are finding—especially on mid‑sized herds—is that the most realistic automation story often sits between “old parlor” and “full robots.”
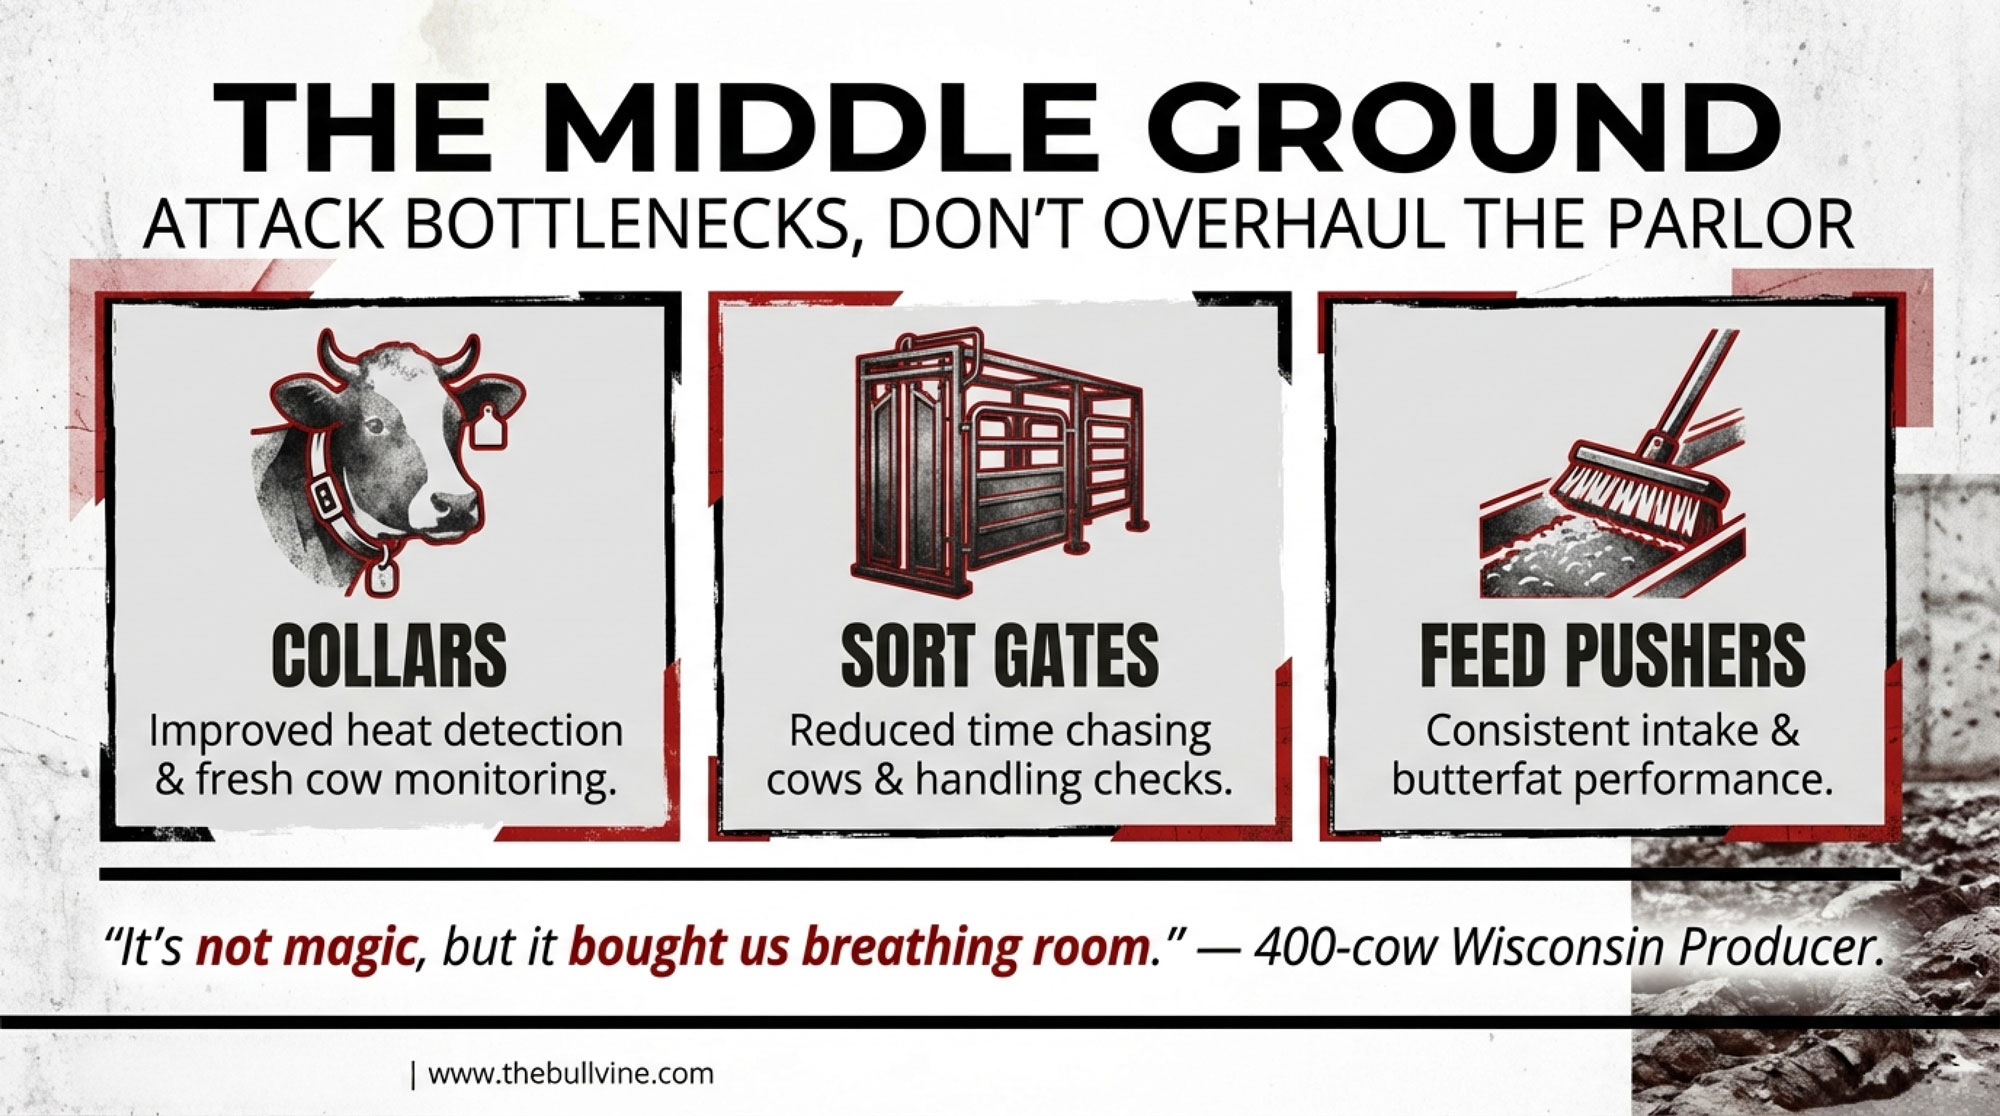
In a lot of Wisconsin and Minnesota freestall herds, the starting point isn’t to rip out the parlor. It’s to add activity and rumination collars, automatic sort gates, and a robotic feed pusher. Collars give better eyes on heat detection and fresh cow behavior. Extension studies and case reports have shown that well‑managed activity systems can significantly improve heat detection rates and reduce days open. Automatic sort gates reduce the time and hassle of chasing cows for herd checks or hoof trimming. Robotic feed pushers keep TMR consistently in front of cows, which helps sustain dry matter intake and butterfat performance—something multiple UW and industry case studies have highlighted.
Several UW Extension profiles have featured 300‑ to 400‑cow freestall operations that added collars and a feed pusher, then reported cutting overtime hours, reducing emergency night checks, and catching transition‑period problems a day or two earlier than before. One producer summed it up nicely by saying, “It’s not magic, but it bought us some breathing room.” That sentiment comes up a lot when you talk to farms that have taken that incremental approach.
In California and the Southwest, where dry lot systems and intense summer heat are everyday realities, many dairies first consider automating feed handling and cooling before even considering robots. That can mean upgrading feed delivery controls, installing variable‑speed fans with automated controls, or integrating soaker systems tied to temperature and humidity sensors. Case studies from hot‑climate herds show that better-targeted cooling not only protects milk yield and reproduction during heat stress, but also frees up labor that used to be tied up shuffling cows in and out of shade or manually adjusting valves and timers.
In Northeast herds that split time between pasture and freestalls, automation often appears around the transition period and during seasonal moves. Activity and rumination monitors help managers see which cows aren’t handling the move from pasture back into the barn, or which fresh cows are slipping early in lactation, so the team can intervene sooner. Extension veterinarians and consulting nutritionists in those regions consistently point to early detection of subclinical problems as one of the biggest wins from these monitoring systems.
Across all of these examples, university and trade publications report that some farms see a pretty quick payback on targeted tools through reduced overtime, fewer emergency nights, and more consistent routines, while others see more modest gains. The common thread is that none of this technology is plug‑and‑play. It works best when it’s aimed at a clear bottleneck and someone on the farm is responsible for watching the data and adjusting management accordingly.
Domestic labor: “won’t work” or “can’t afford”?
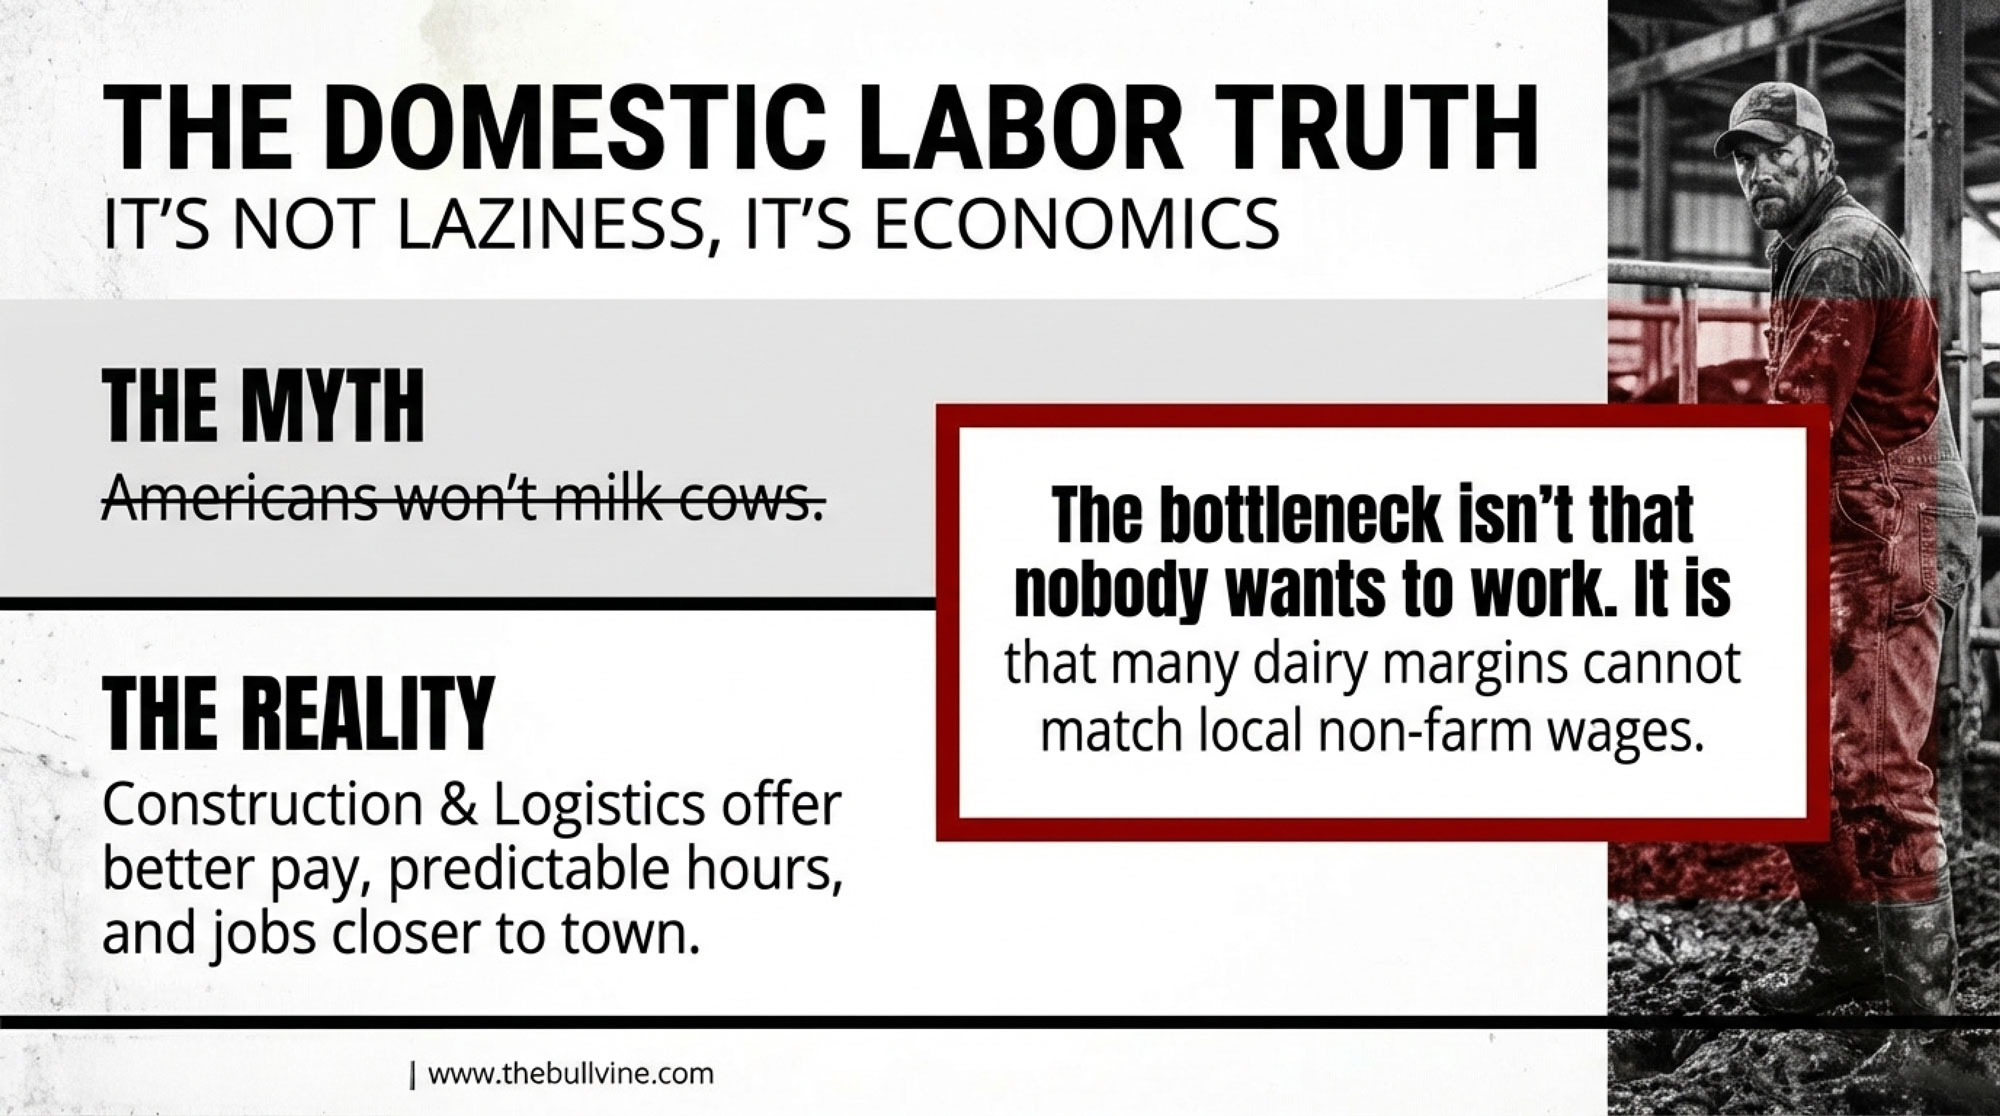
You probably know this already, but the line “Americans won’t milk cows anymore” shows up in almost every labor conversation. It comes from a real place—some producers have posted milker positions for weeks and never had a local applicant, especially in isolated rural areas.
At the same time, economists and policy analysts looking at farm labor and immigration point out that non‑farm sectors—construction, warehousing, logistics, food processing—have expanded and pulled in a lot of the same working‑age people dairies used to rely on. CRS and other analyses make it clear that this competition from non‑farm employers offering higher pay, more predictable schedules, and jobs closer to town is a major factor behind the surge in H‑2A usage.
On the farm side, dairy HR specialists at universities like Wisconsin and Michigan State emphasize a couple of practical points. When dairies in more populated areas offer wages that truly compete with local non‑farm employers, provide at least some benefits, and offer more predictable time off, they can and do attract domestic workers into milking, feeding, and calf care roles. These advisors also point out that job design matters. Roles that mix equipment operation, basic maintenance, and parlor work tend to be more attractive than jobs that are “just in the pit” all day.
The hard reality is that not every dairy can afford to match those wages and conditions at current milk prices with their existing debt load. So the bottleneck often isn’t that nobody wants to milk cows; it’s that the farm can’t afford to pay what the rest of the local economy is offering for similar effort. That’s a tough truth, but it lines up with both the labor market data and the farm financials.
And that’s where H‑2A comes back into play. The program can give farms access to workers willing to take dairy jobs, but only if the operation can carry the full cost—AEWR wages plus housing, transportation, and compliance expenses. Leaders at AFBF have described H‑2A in interviews as a “mixed bag”: essential for some growers, too expensive for others, and, under current law, an imperfect or inaccessible fit for many year‑round operations like dairies. That mix of outcomes is exactly what producers are staring at when they put their numbers into a spreadsheet and compare H‑2A against domestic labor and against automation.
The labor problem on a lot of dairies isn’t that nobody will milk cows—it’s that the farm can’t afford to pay what the broader labor market is paying for comparable work.
For a 400‑cow dairy, what are you really choosing between?
So let’s bring this right back to a herd size many Bullvine readers live in: roughly 350 to 500 cows, a mix of family and hired labor, with a freestall or dry lot system and a parlor that might be ten to twenty years into its life.
| Metric | Path 1: Selective Automation | Path 2: Legal Higher-Cost Labor | Path 3: Planned Transition |
|---|---|---|---|
| Capital Required | $50K–$150K (collars, sort gates, feed pusher) | $0–$25K (HR systems, legal setup) | $0–$10K (valuation, transition consulting) |
| Annual Debt Service | $8K–$18K (5-year amortization @ 6%) | $0 (operational cost, not debt) | $0 (exit phase) |
| Annual Labor Cost Impact | –$80K to –$120K (labor savings) | +$30K to +$50K (legal wages/housing vs. baseline) | N/A (phasing out) |
| DSCR Requirement | >1.15 (need room for new debt service) | >1.0 on average (can absorb higher wages) | >0.85 (can sell from position of strength) |
| 3-Year Cash Flow Net | Positive if herd productivity holds | Neutral to slightly positive (wages offset labor efficiency) | Positive (captures land/facility value, reduces ongoing risk) |
| Best For… | Farms with strong debt coverage & clear bottlenecks; plan to keep milking 7–10+ years | Farms with decent margins but tired of compliance risk; want stability & peace of mind | Farms with weak DSCR, no clear succession, tired after decades of volatility |
| Key Risk | Tech adoption failure, maintenance headaches, milk price crash erodes payback | Wage pressure continues; if milk price crashes, margin squeeze is acute | Market timing: land/cow values may soften; need to execute transition professionally |
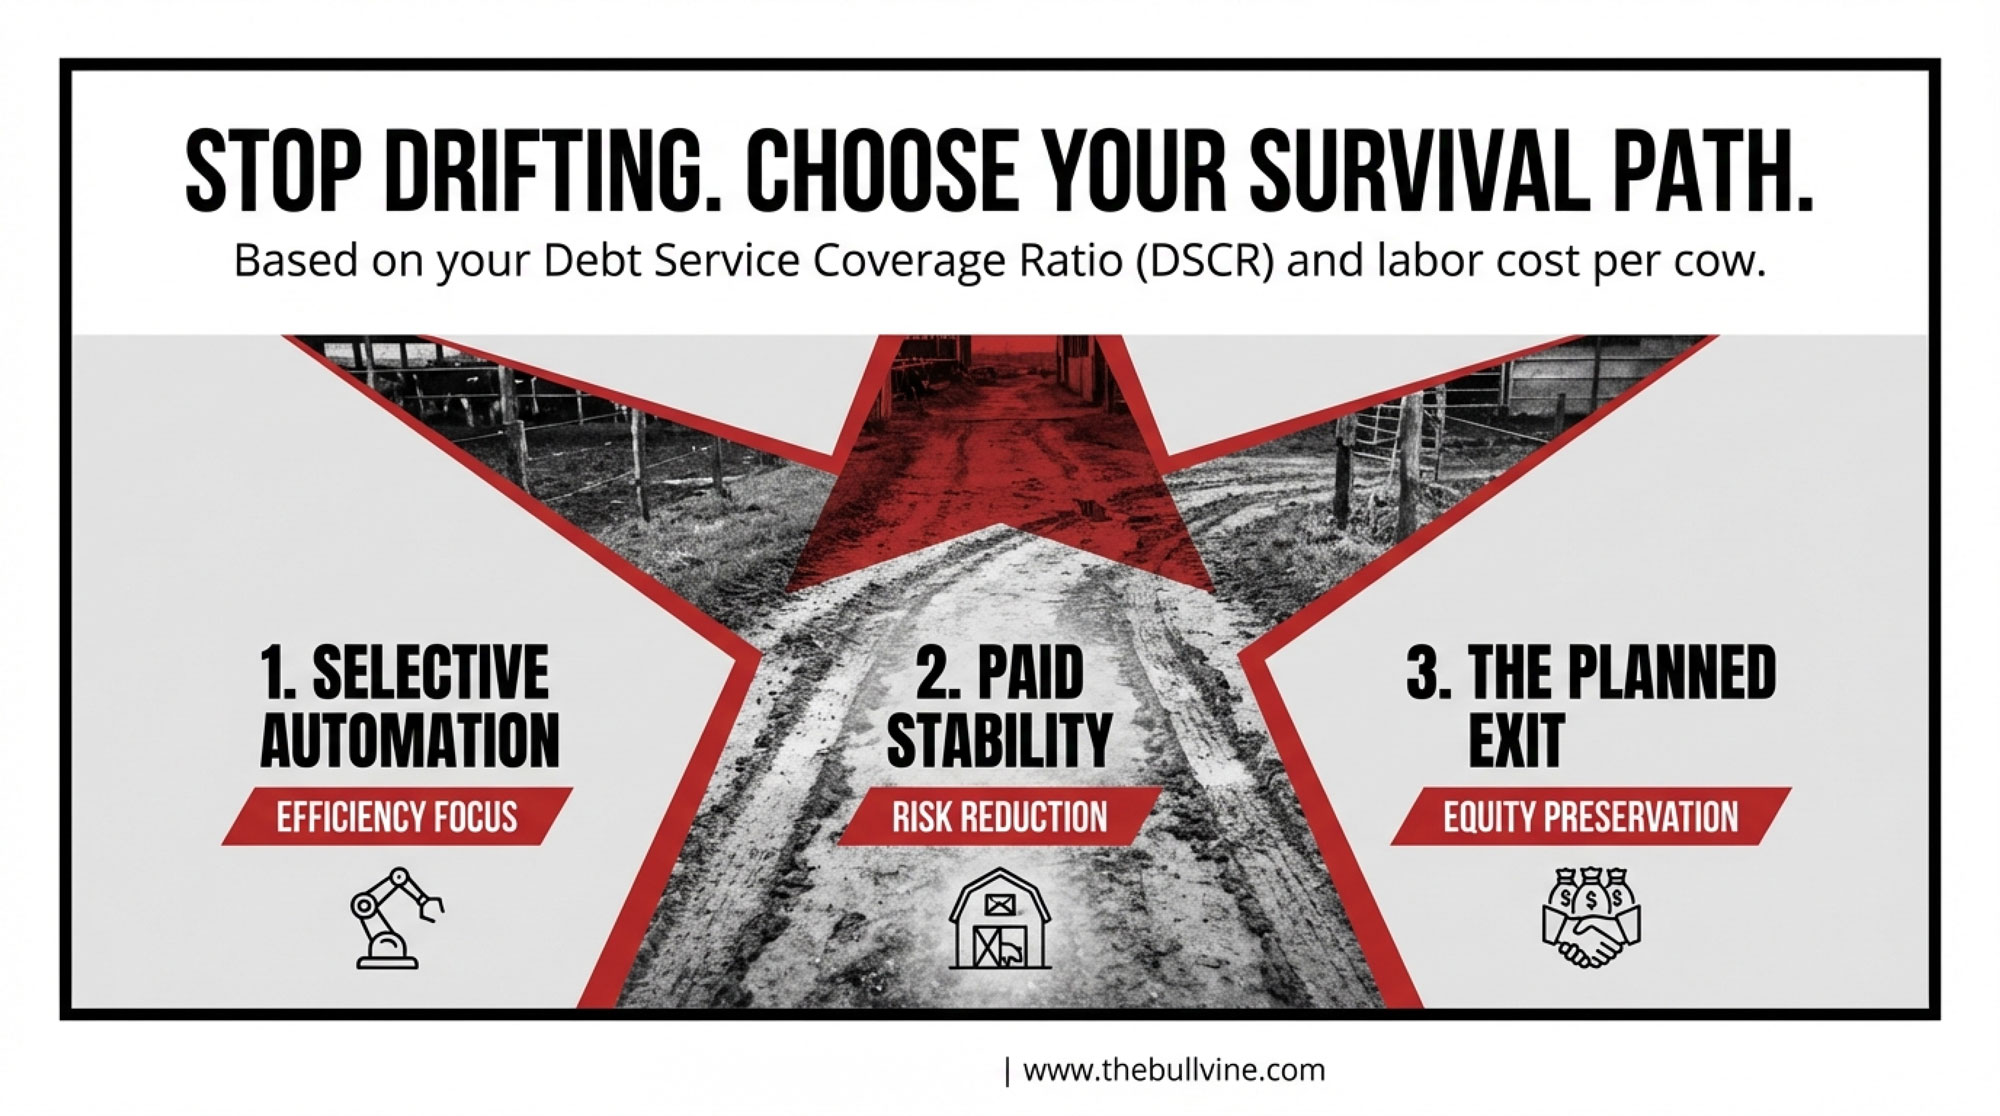
From conversations with producers, lenders, and extension folks—and backed by research and numbers—the choices for a farm like that often fall into three broad paths.
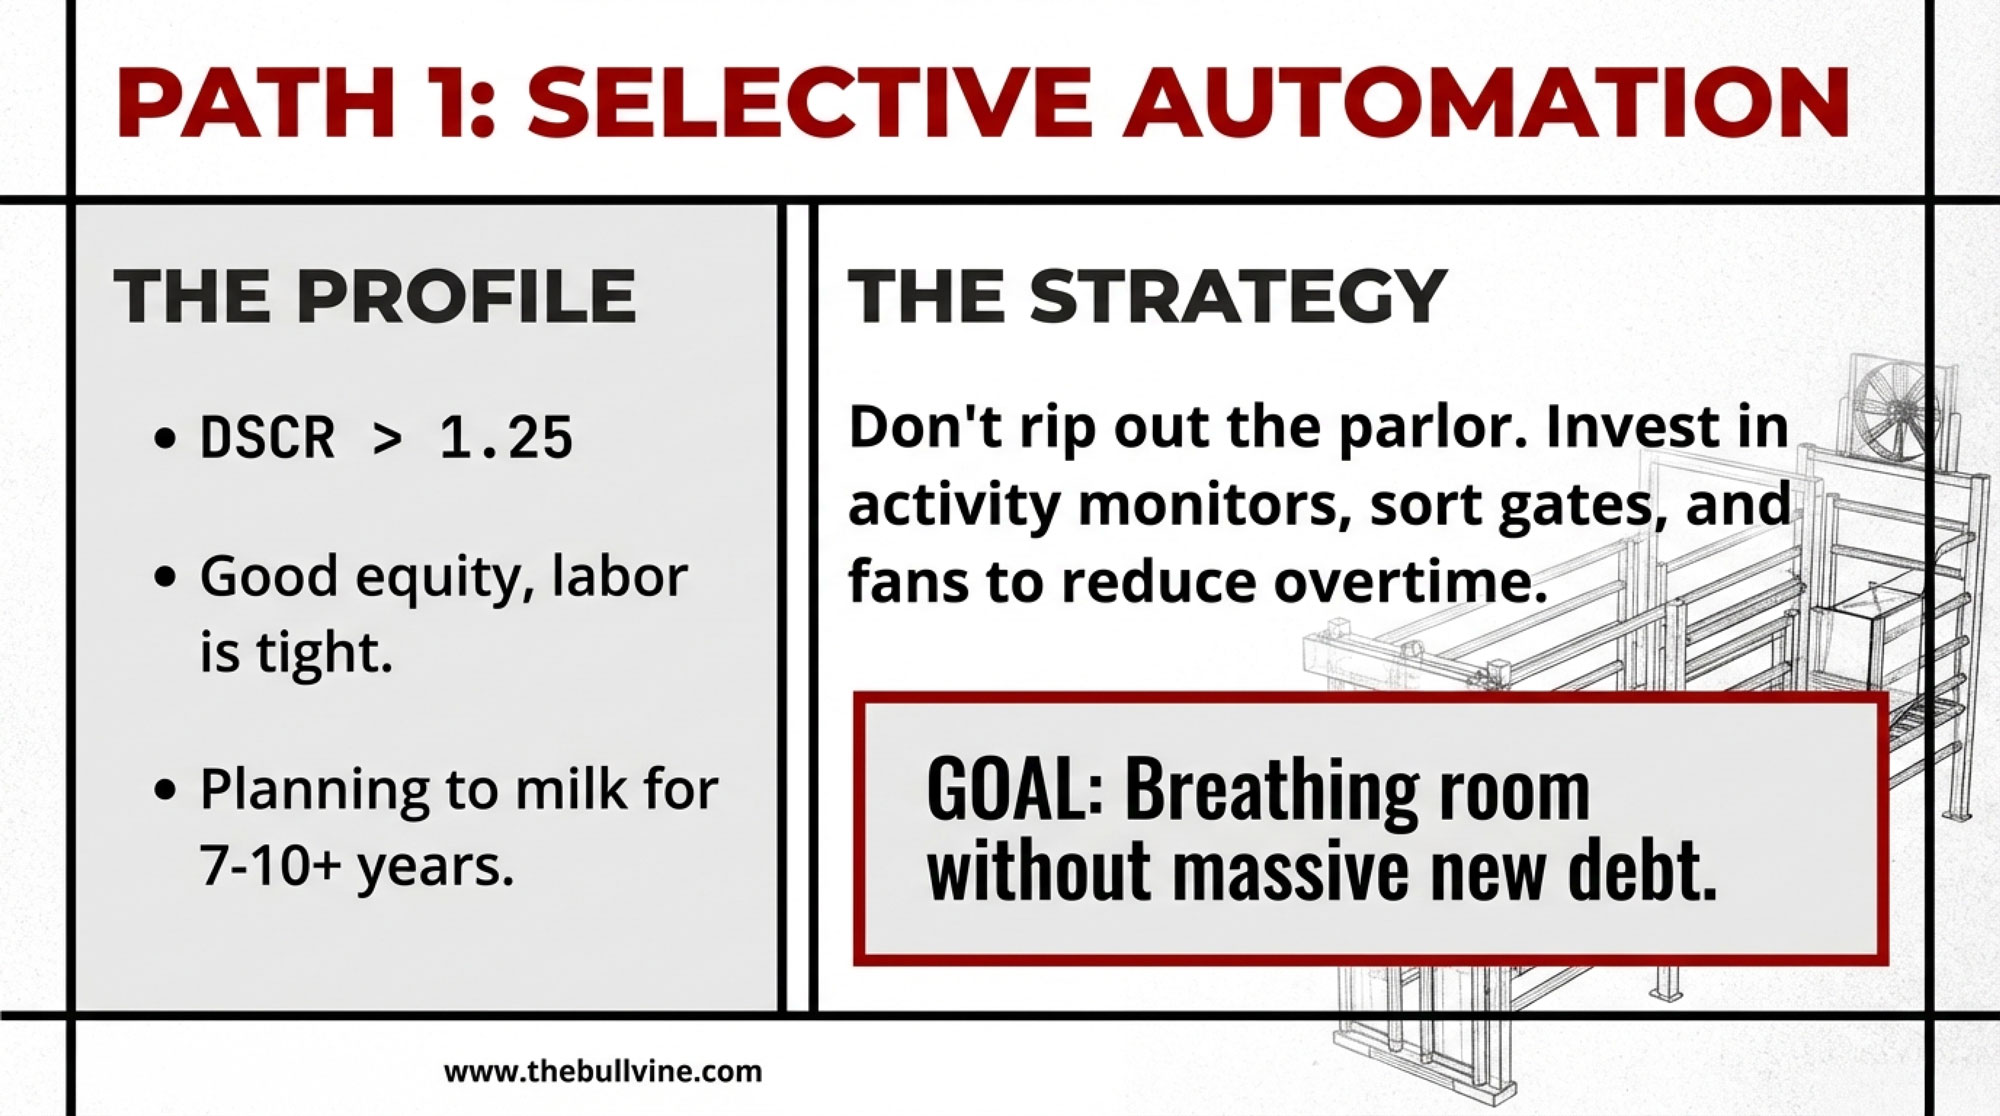
Path 1: Selective automation around real bottlenecks
This first path fits farms that:
- Have generally been able to cover debt payments, with at least some cushion
- Feel the labor pressure—long days, hard‑to‑cover shifts—but aren’t in outright crisis
- Expect to keep milking for at least the next seven to ten years
The starting point is to put hard numbers on labor and debt. That means figuring out your total labor cost per cow—including family labor, overtime, housing, payroll taxes, and any HR or legal expenses—and then looking at your debt service coverage ratio (DSCR) over three to five years. Many agricultural lenders get nervous about major new capital projects if DSCR hasn’t been consistently above 1.0, and often they’re more comfortable when it’s around 1.25 or higher on average.
Once you know where you stand financially, you can go hunting for your bottlenecks. Maybe it’s late‑night fresh cow checks. Maybe it’s heat detection and breeding. Maybe it’s feed push‑up and bunk management. Maybe it’s the time you spend chasing cows for herd health or hoof trimming.
Extension advisors in Wisconsin, California, and the Northeast repeat the same advice: match the technology to the specific bottleneck, and your odds of seeing a return go up. So you look at one or two targeted tools—activity monitors, sort gates, a feed pusher, upgraded fans, and soakers—and build budgets with your accountant or consultant. The UW AMS work and other automation studies give you benchmarks for what’s possible, but the key is plugging in your own wage rate, herd size, and management style.
This path doesn’t require you to bolt robots to the floor tomorrow. It’s about picking off the worst bottlenecks and using focused automation to reduce overtime, improve consistency in fresh cow management and the transition period, and give your team a bit more breathing room without taking on unmanageable debt.
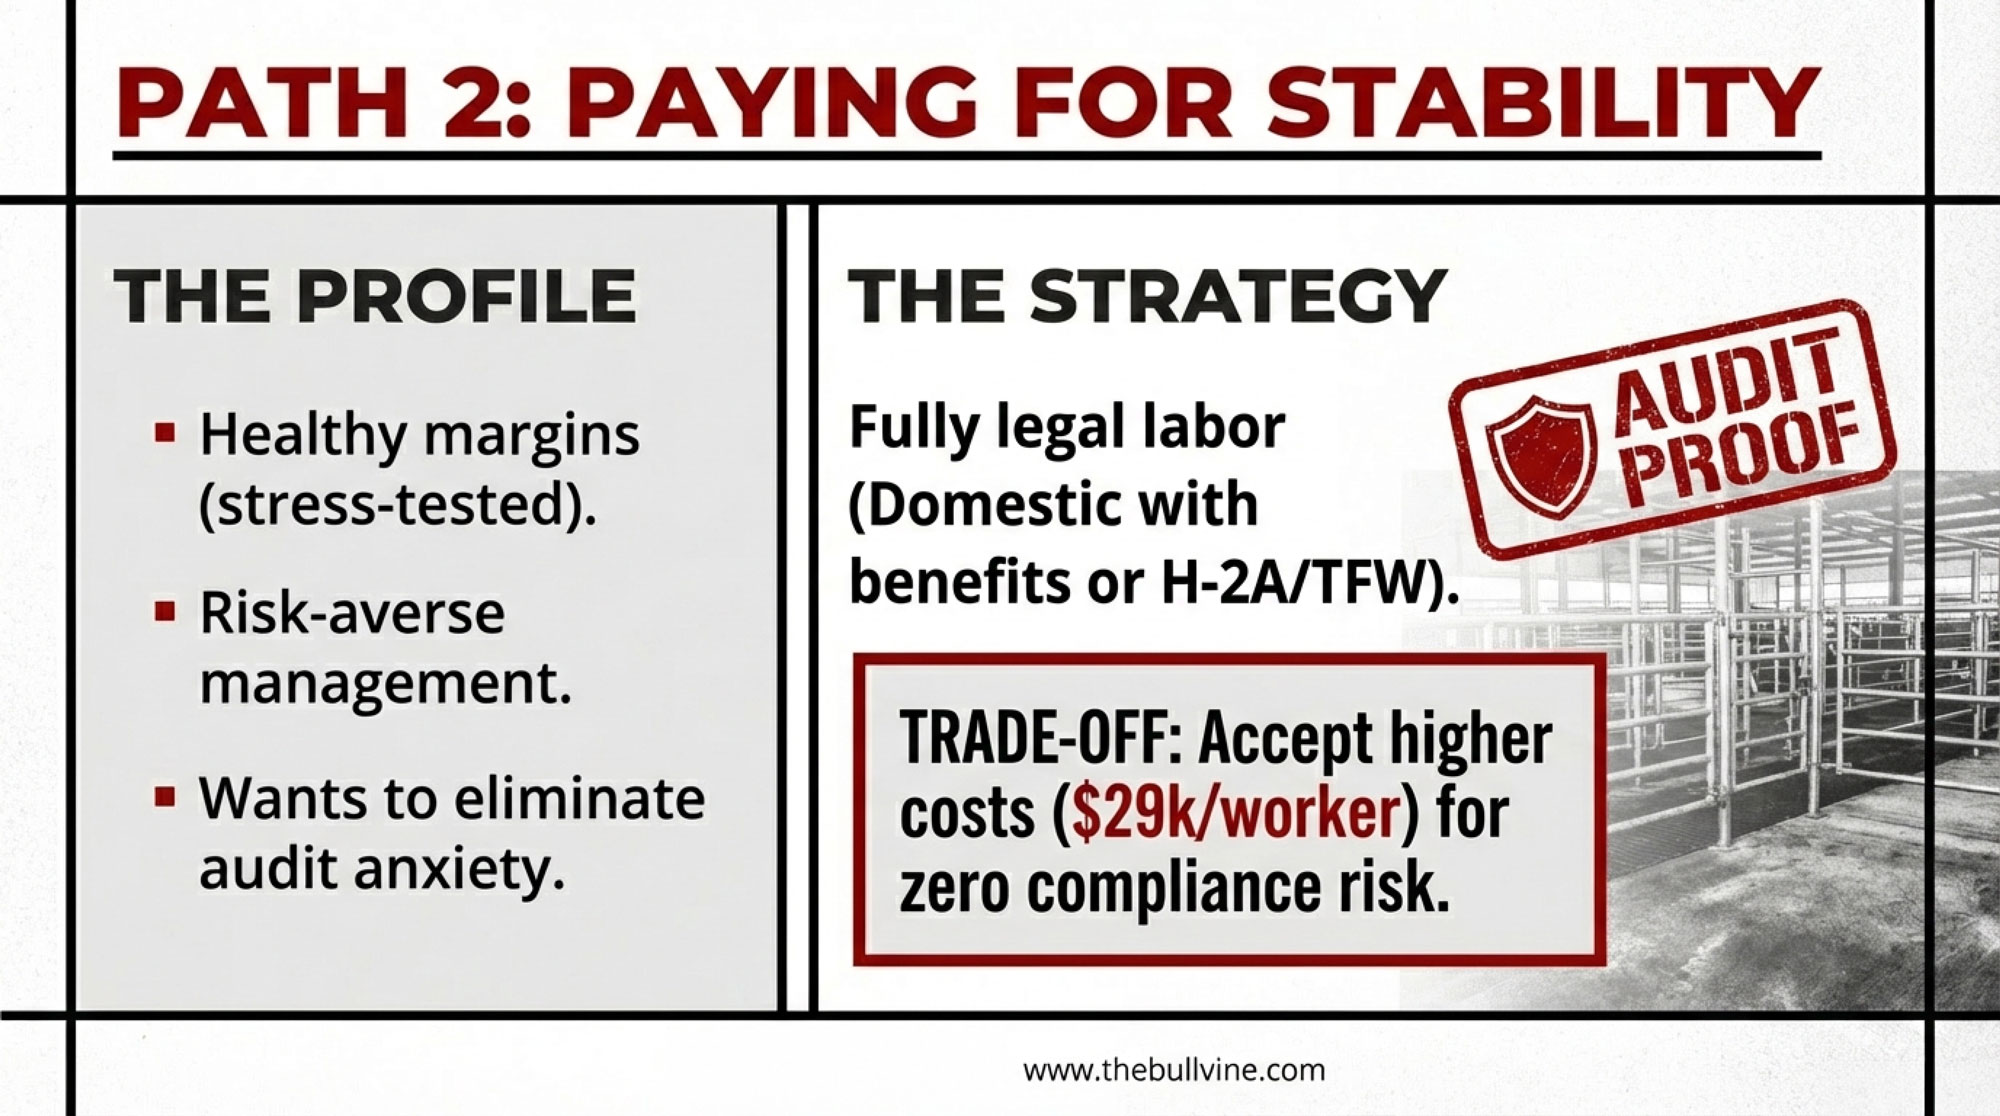
Path 2: Fully legal labor at a higher cost, in exchange for more stability
The second path is less about squeezing every last dollar of margin and more about lowering risk and sleeping at night. It tends to fit farms that:
- Have maintained reasonably healthy margins on average, even through some tough price years
- Don’t really want to add major new capital obligations right now
- Have at least a rough sense of succession or a timeline for milking
Here, most of the hard work happens on paper. With your lender or a good farm management advisor, you build two parallel labor budgets.
One assumes a fully domestic, documented crew, paid at wages and benefits that genuinely compete with local non‑farm employers, plus housing where appropriate, all payroll taxes, and some allowance for HR and compliance work. The other assumes a blend of domestic and foreign workers—H‑2A in the U.S. or Temporary Foreign Workers in Canada—with realistic costs for housing, transportation, legal fees, and administrative time, in addition to the AEWR or equivalent wage.
Then you stress‑test both budgets. What happens to DSCR and family living under different milk price and interest rate scenarios? That kind of scenario planning is exactly what many extension farm management programs are teaching right now. If those budgets show that you can afford a fully legal labor structure—domestic, H‑2A, or a mix—and still keep DSCR in acceptable territory across most scenarios, then this path can dramatically reduce your compliance risk and mental load. You’re choosing to pay more for labor in exchange for predictability and legal security.
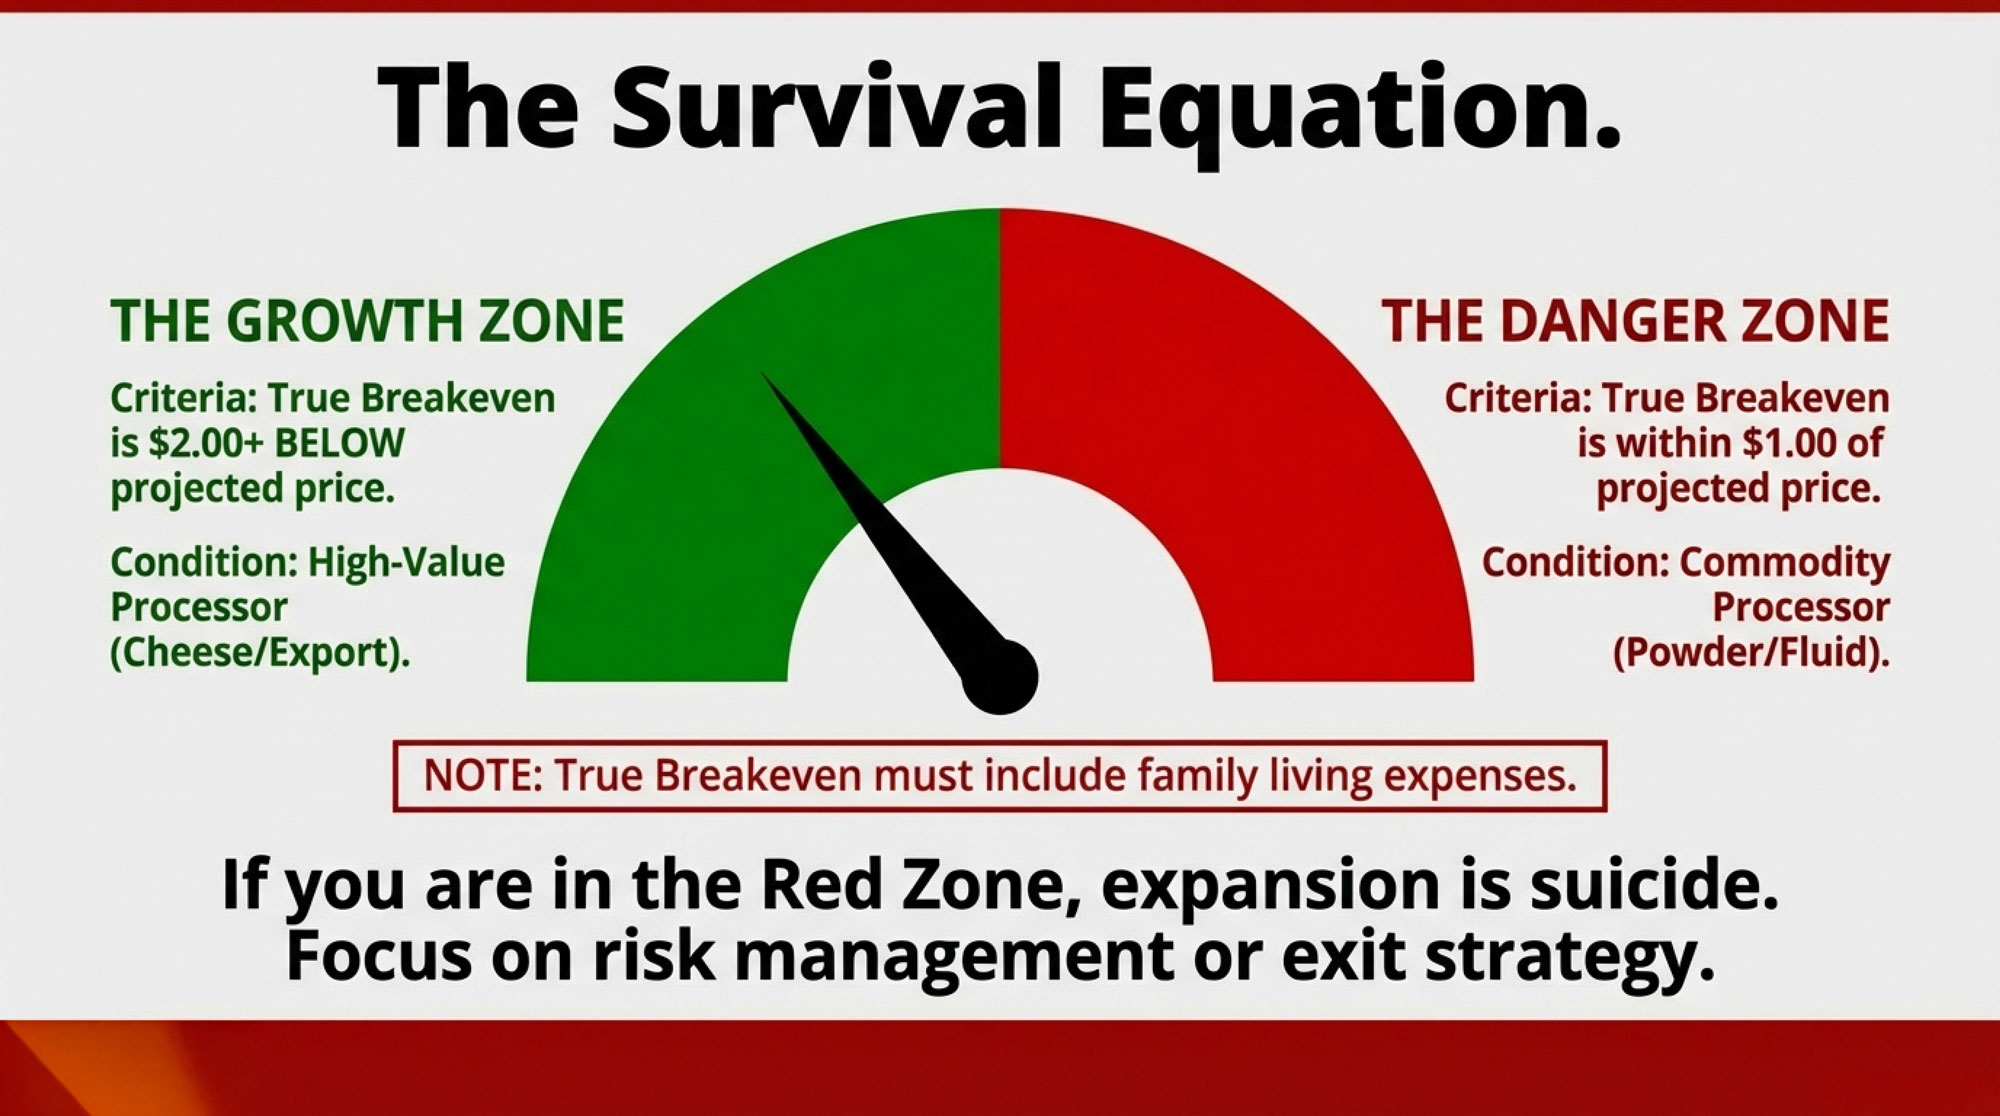
If your DSCR falls below 1.0 in most of those scenarios, you’re not buying stability—you’re buying more risk. And if the numbers don’t work in any reasonable scenario, that’s a strong signal that something deeper needs to change in scale, system, or long‑term plans.
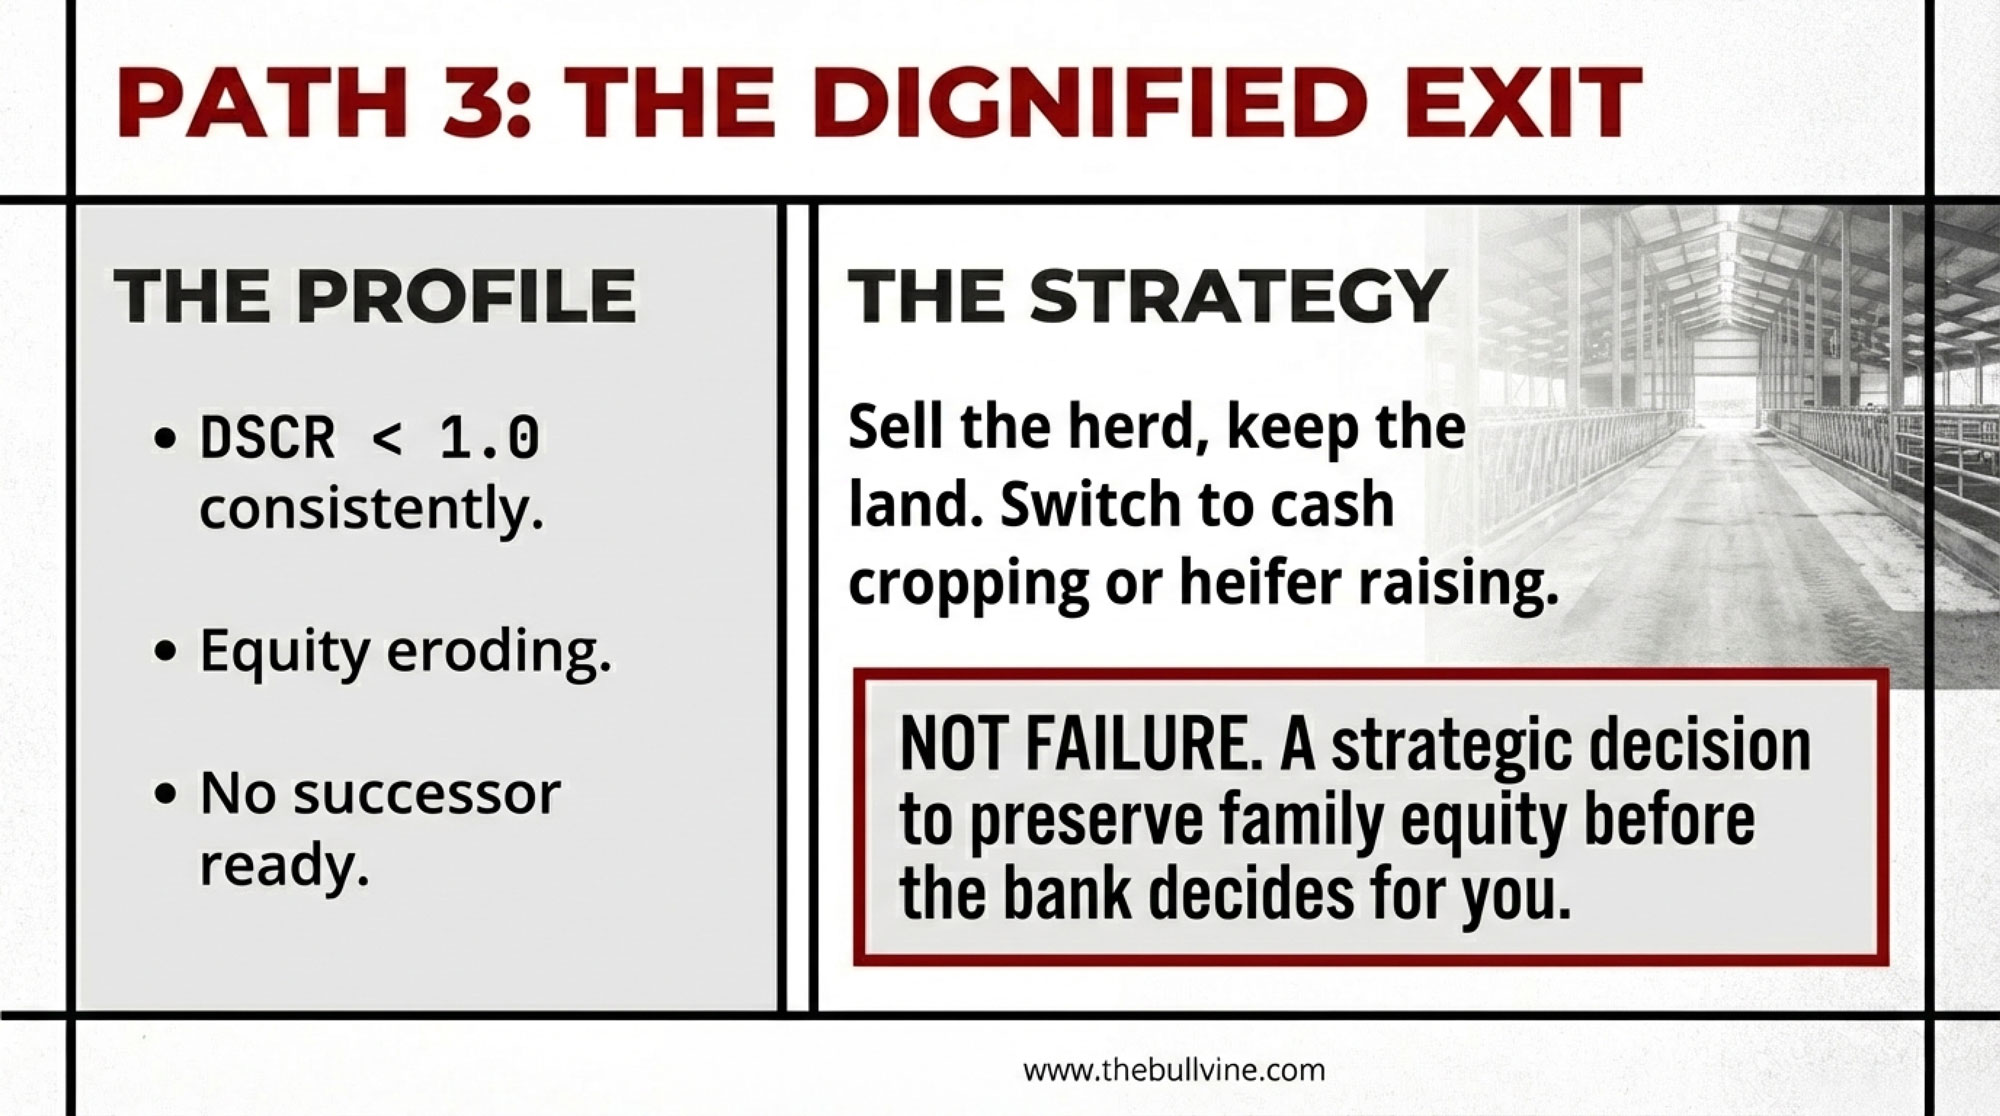
Path 3: A planned transition out of milking while you still have choices
The third path is the one nobody loves to talk about, but more families are facing it head‑on. It usually becomes a serious option when:
- DSCR has been weak for several years, not just during one ugly price cycle
- Even “good” milk price years haven’t really improved equity or family living
- There’s no next generation that’s both ready and genuinely eager to shoulder the risk
In that situation, throwing more debt at robots or locking yourself into an expensive labor program may not fix the underlying problem and can make the business more fragile.
This is where lenders, accountants, and transition advisors often urge families to take a hard look at updated land, cow, and equipment values and explore options before they’re forced into a fire sale. Depending on your region and setup, those options might include selling the herd and leasing your facilities to a neighbor, selling cows and barns but keeping the land for cropping or rental, or stepping away from dairy entirely and shifting into another enterprise.
In the Northeast, the Upper Midwest, and Ontario, extension case studies include real examples of families who sold their milking herds, kept the land, and moved into custom heifer raising or cash cropping. The common thread in the better outcomes is that they made those decisions before the bank or the barn decided for them.
Those are never easy conversations. But they can be responsible choices, especially if the numbers and family dynamics are pointing that way.
The Bottom Line
So why does all of this matter when you’re standing in your own yard, looking at your cows and your crew?
Because labor, automation, and long‑term strategy have basically braided themselves together. H‑2A and similar programs have expanded dramatically and can deliver legal, predictable labor, but at a premium once you factor in housing, travel, and compliance. Domestic labor is under pressure from non‑farm jobs that often pay more and offer more predictable lives, and not every dairy can match those offers on today’s milk prices. Automation—whether it’s collars and sort gates or full AMS setups—can change how work gets done and open up new options, but it takes capital and management horsepower in an interest rate environment that’s tighter than it was a few years ago. And global cost shifts have tilted the playing field in favor of leaner, pasture‑based systems, which means higher‑input confinement and dry lot setups have to be that much sharper on costs and execution.
What’s encouraging is that there isn’t only one “right” answer.
A 450‑cow freestall herd in Wisconsin might look at their numbers and decide the most realistic path is to keep the parlor, add monitoring and a feed pusher, maintain a solid domestic crew, and focus hard on fresh cow management and butterfat performance to squeeze every bit of value out of components. A 1,000‑cow dry lot dairy in California might decide that, despite the cost, H‑2A or other foreign worker programs are essential just to have enough hands on deck, then use targeted automation to make those people as effective as possible in the heat. A 320‑cow family operation in the Northeast or Ontario might look at five years of DSCR and equity trends and conclude that the most responsible decision is to sell the herd while they’re still in control, keep the land, and write the next chapter on their own terms.
What I’ve found, both in the research and around kitchen tables, is that the herds that come through periods like this in the best shape are the ones that don’t kid themselves. They know their all‑in labor cost per cow, including family labor and housing. They’ve looked at their debt coverage over several years, not just one good or bad season. They have a realistic sense of where their system sits on the cost spectrum compared with other options, both here and overseas. And then they pick a path—selective automation, fully legal higher‑cost labor, or a planned transition—that actually aligns with their numbers and goals.
If you do nothing else after reading this, here’s one practical step. In the next month, take an hour to pull your last three to five years of financials. Calculate your true labor cost per cow, including family labor. Work with your lender or advisor to figure out your average DSCR over that stretch. That quick snapshot will tell you a lot about whether you’re in a position to buy more labor stability, buy more automation, or buy yourself time to design a dignified exit.
The worst place to be isn’t on the “wrong” path—it’s drifting with no path at all. These aren’t easy decisions. But they’re exactly the kind of decisions that make the difference between reacting to the next crisis and steering your farm where you actually want it to go—for you, your family, your cows, and whoever might come next.
| Step | Metric to Calculate | Data Source(s) | Your Farm’s Number | Red Flag / Decision Rule |
|---|---|---|---|---|
| Day 1–3 | Total Annual Labor Cost (All-In) | Payroll records (wages, taxes), family draw (owner/spouse labor), housing, transportation, HR/compliance | $____ per year (or $____ per cow) | >$1,500/cow? Automation or labor program may be necessary. >$1,800/cow? Path 3 (transition) worth exploring. |
| Day 4–7 | 3-Year Average Debt Service Coverage Ratio (DSCR) | Last 3 years’ tax returns or P&L, total debt service (principal + interest), net operating income | DSCR: ____ (target: >1.15) | <1.0? Stop new debt; focus on cash flow / Path 2 or 3. 1.0–1.15?Proceed cautiously; Path 1 automation is risky. >1.25? Healthy; Path 1 or 2 feasible. |
| Day 8–10 | Current Interest Rate on Farm Debt | Loan agreements, bank statements, capital plan notes | Current rate: ____%; Projected 5-yr avg: ____% | >7%? AMS payback stretches to 2+ years; reconsider Path 1 timeline. >8.5%? Automation payback becomes unattractive unless labor savings are exceptional. |
| Day 11–15 | Bottleneck Analysis: Where Does Labor Time Get Wasted? | Time-motion study, staff interviews, milk parlor observation, feeding/bedding routines | Biggest pain point: _________________ (e.g., late-night fresh cow checks, heat detection, feed push-up) | If no clear bottleneck, targeted automation (Path 1) may not pay off. If multiple bottlenecks, prioritize & sequence tools (collars first, then sort gates, then robots). |
| Day 16–20 | Succession Plan & Timeline | Family conversation, advisor notes, estate plan | Next operator identified? ☐ Yes / ☐ No Expected transition year: ____ (or N/A) | No next operator + 5–10 years to retirement? Path 3 (planned transition) is likely the right move. Clear next operator + strong DSCR? Path 1 or 2 can position the farm for growth. |
| Day 21–25 | Multi-Year DSCR Trend | Last 5 years of financials, plot DSCR year by year | DSCR trend: ☐ Improving / ☐ Flat / ☐ Declining | Declining DSCR + weak bottleneck case = Path 2 or 3 most prudent. Improving DSCR + strong bottleneck case = Path 1 opportunity. |
| Day 26–30 | Decision: Which Path Aligns with My Numbers & Goals? | Summary of all above metrics + advisor input | Path Chosen: ☐ 1 (Automation) / ☐ 2 (Legal Labor) / ☐ 3 (Transition) | Once decided, build 3–5-year action plan with lender, advisor, or consultant. No path is “wrong”—but drifting is. |
Key Takeaways
- H‑2A isn’t “cheap.” Once you add housing, transportation, and compliance, total cost per worker often hits around $29,500 for a six‑month contract—far above the posted wage.
- Robots save labor, but demand capital and management. UW research shows AMS can cut labor costs by about $1.50/cwt on average—roughly $168,000/year on a 400‑cow herd—but payback depends heavily on interest rates and your team’s tech skills.
- Global cost gaps are real. Rabobank data shows New Zealand and Australia produce milk at about US$0.37/litre versus US$0.48/litre for most other exporters—a gap that puts extra pressure on higher‑input North American systems.
- Compliance risk belongs on your management list. Labor audits and I‑9 mistakes can disrupt crews and hit your P&L hard; treating compliance like herd health is now table stakes.
- Three paths for mid‑size dairies. Selective automation, fully legal higher‑cost labor, or a planned exit—your multi‑year DSCR and true labor cost per cow will tell you which one your farm can actually afford.
Complete references and supporting documentation are available upon request by contacting the editorial team at editor@thebullvine.com.
Learn More
- Robotic Milking: 3 Hard Truths Every Owner Must Face – Master the transition to automation without blowing your budget. This analysis reveals the hidden management shifts required to make robots pay off, arming you with a realistic implementation plan that protects your cash flow and sanity.
- The New Dairy Economy: Strategies for Long-Term Resilience – Position your farm to thrive despite structural cost increases. It exposes the long-term trends shaping the next decade, delivering the strategic framework you need to align your capital investments with the realities of a shifting global milk market.
- Wearable Tech: How Monitoring Systems Are Changing the Breeding Game – Gain a competitive advantage in reproductive performance by leveraging the latest sensor technology. This piece breaks down how high-tech monitoring delivers superior pregnancy rates and labor savings that traditional heat detection simply can’t match.
 Join the Revolution!
 Join the Revolution!
Join over 30,000 successful dairy professionals who rely on Bullvine Weekly for their competitive edge. Delivered directly to your inbox each week, our exclusive industry insights help you make smarter decisions while saving precious hours every week. Never miss critical updates on milk production trends, breakthrough technologies, and profit-boosting strategies that top producers are already implementing. Subscribe now to transform your dairy operation’s efficiency and profitability—your future success is just one click away.