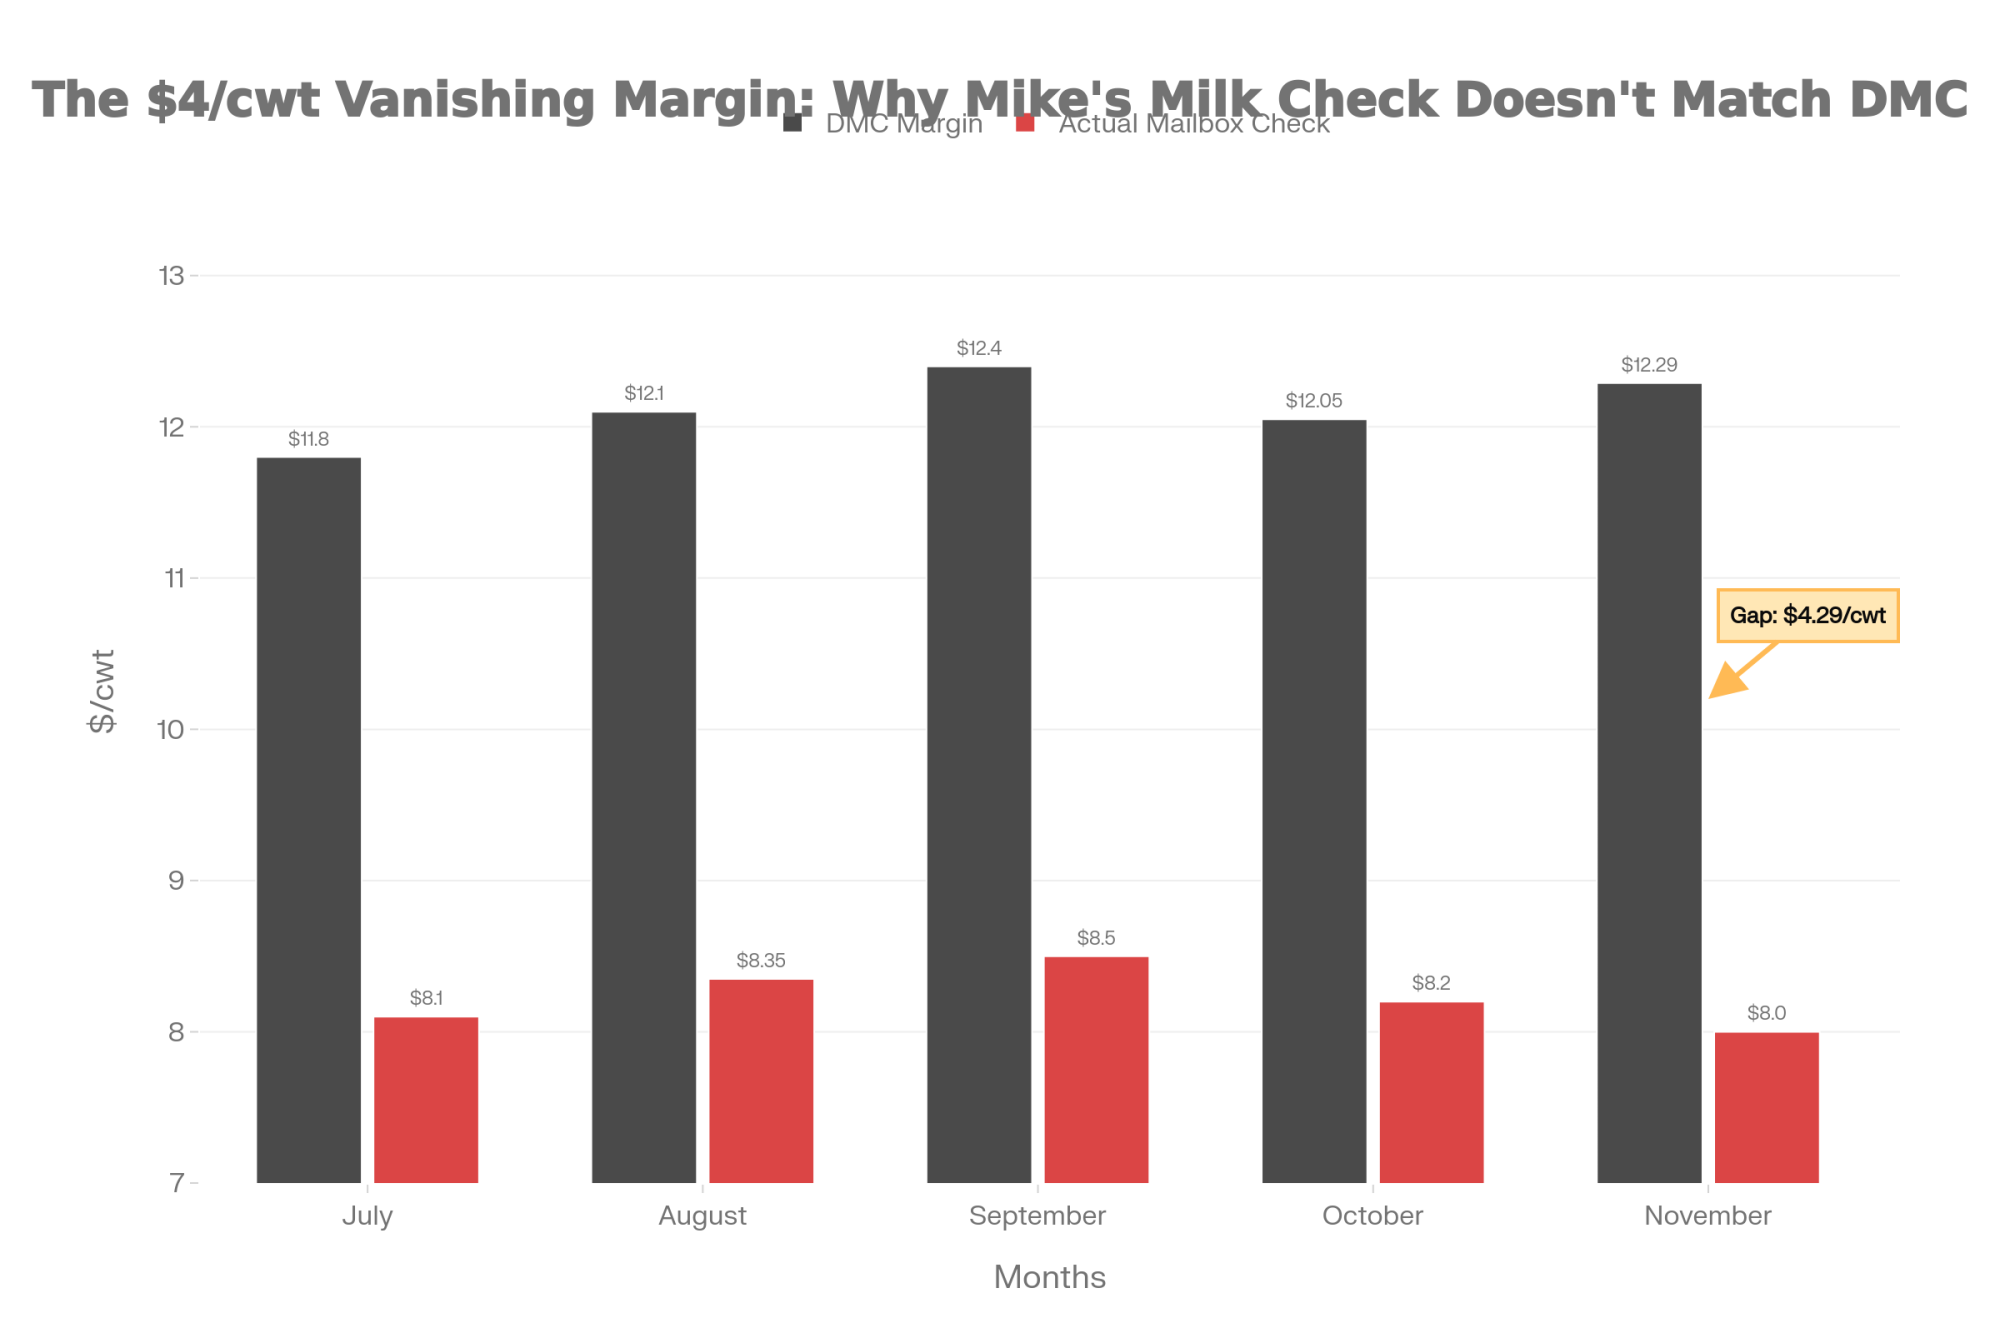
You know that moment—scrolling to the bottom of your milk statement, already doing the math in your head? Mike Boesch’s DMC said $12.29. His deposit said $8.
Executive Summary: Dairy producers everywhere are doing the math twice lately—and they’re not wrong. There’s a $4/cwt gap between what DMC margins show on paper and what’s actually hitting farm accounts. The causes stack up fast: make allowance increases that cost farmers $337 million in just three months, regional price spreads running nearly $7/cwt, and component formula changes that blindsided many operations. Milk keeps flowing despite the pressure—expansion debt doesn’t pause for soft markets, and the lowest heifer inventory since 1978 makes strategic culling nearly impossible. With USDA projecting $18.75/cwt All-Milk prices for 2026, margin relief likely won’t arrive until late 2027. The producers gaining ground are focusing on what they can control: component-focused genetics, beef-on-dairy programs built on smart sire selection, and risk management tools that most operations still aren’t using.
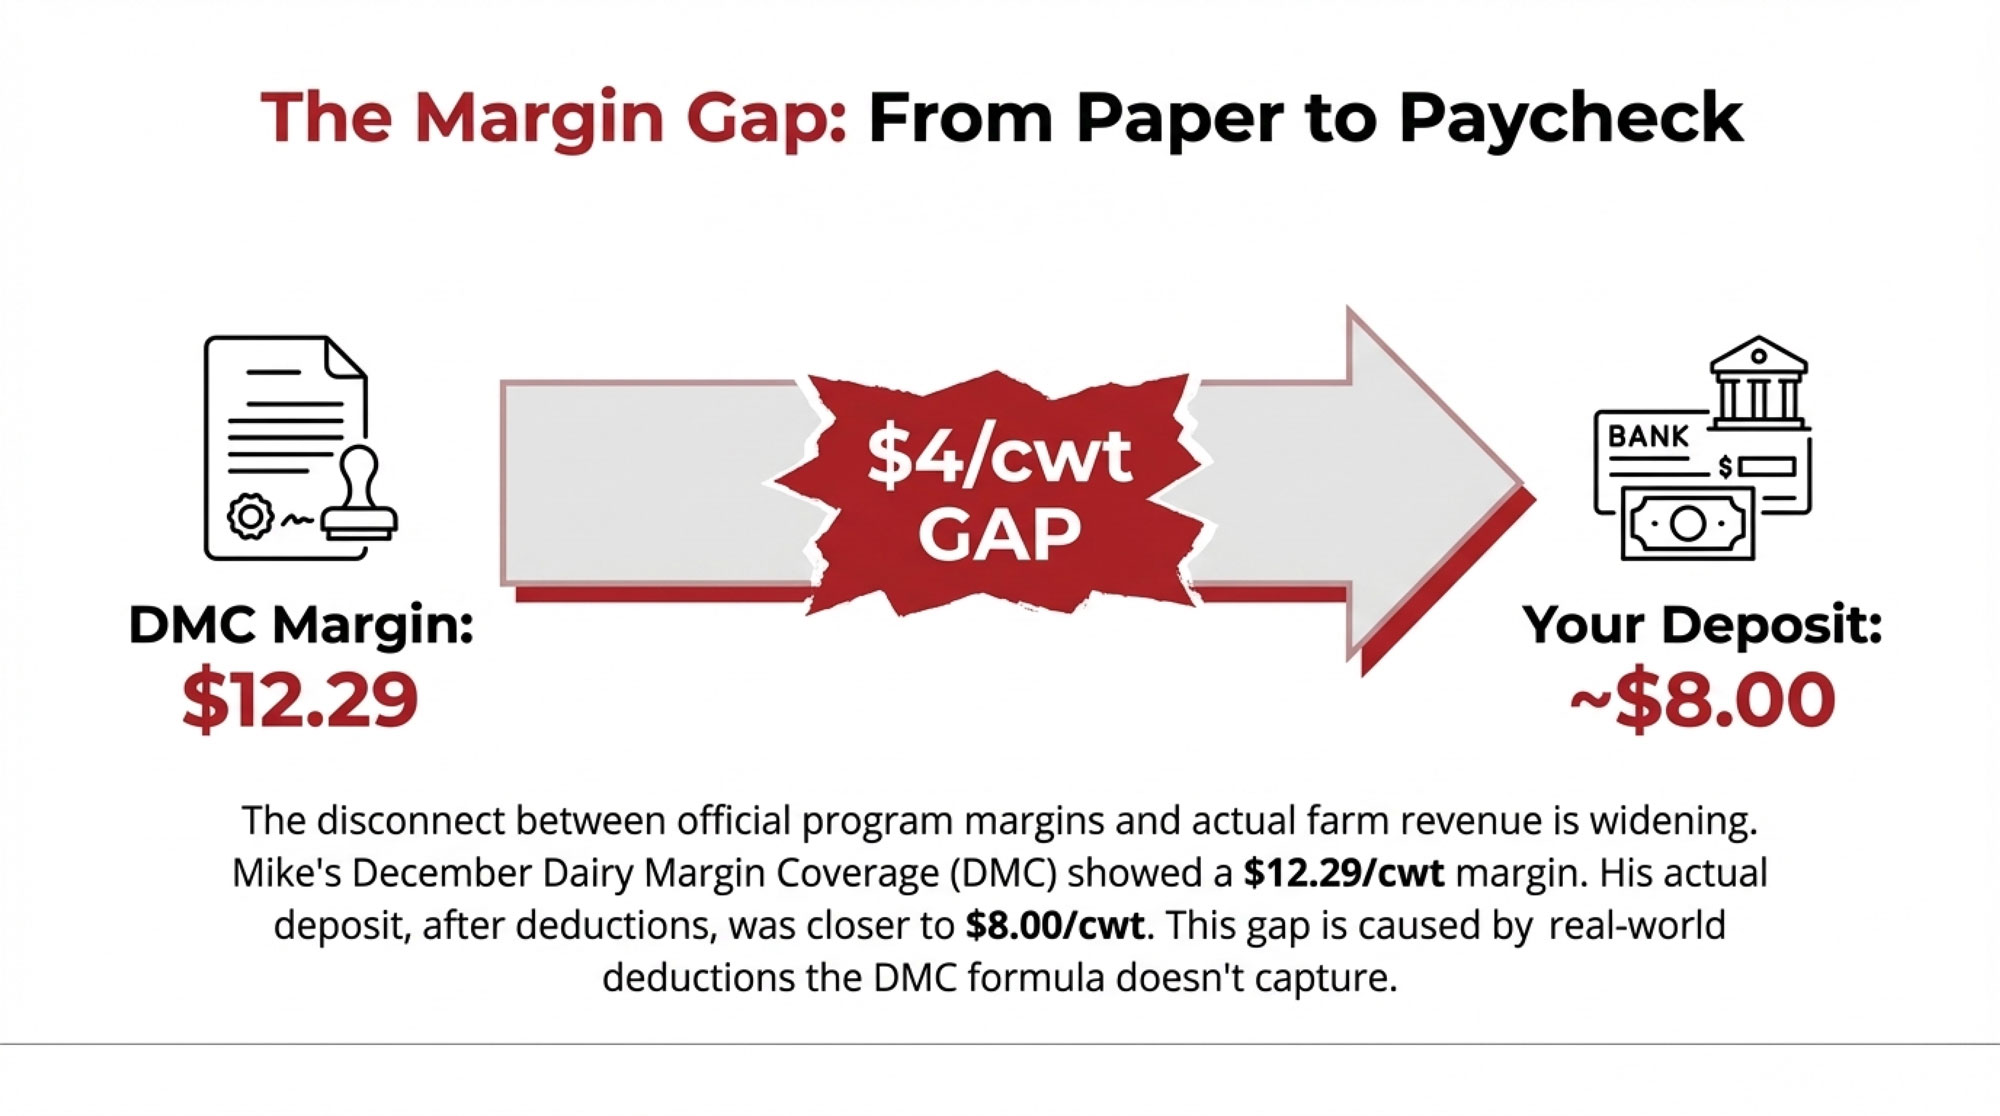
You know that feeling when the numbers on paper don’t quite match what’s hitting your bank account? Mike Boesch, who runs a 280-cow operation outside Green Bay, Wisconsin, put it well when we talked last month. He pulled up his December milk statement, scrolled straight to the bottom—like we all do—and there it was. His Dairy Margin Coverage paperwork showed a comfortable $12.29/cwt margin. His actual deposit? After cooperative deductions, component adjustments, and those make allowance changes that kicked in last June, he was looking at something closer to $8/cwt.
“I keep two sets of numbers in my head now. The one the government says I’m making, and the one my checkbook says I’m making. They’re not the same number.” — Mike Boesch, Green Bay, Wisconsin (280 cows)
He’s far from alone in this experience. I’ve been talking with producers from California’s Central Valley to Vermont’s Northeast Kingdom over the past few months, and I keep hearing variations of the same observation. There’s a growing disconnect between what the formulas say margins should be and what’s actually landing in farm accounts. Understanding why that gap exists—and what you can do about it—has become one of the more pressing questions heading into 2026.

The Math That Isn’t Adding Up
| Year | Corn ($/bu) | Soymeal ($/ton) | All‑Milk ($/cwt) |
|---|---|---|---|
| 2023 | 6.54 | 430 | 22.50 |
| 2024 | 5.10 | 380 | 21.80 |
| 2025 | 4.00 | 300 | 21.35 |
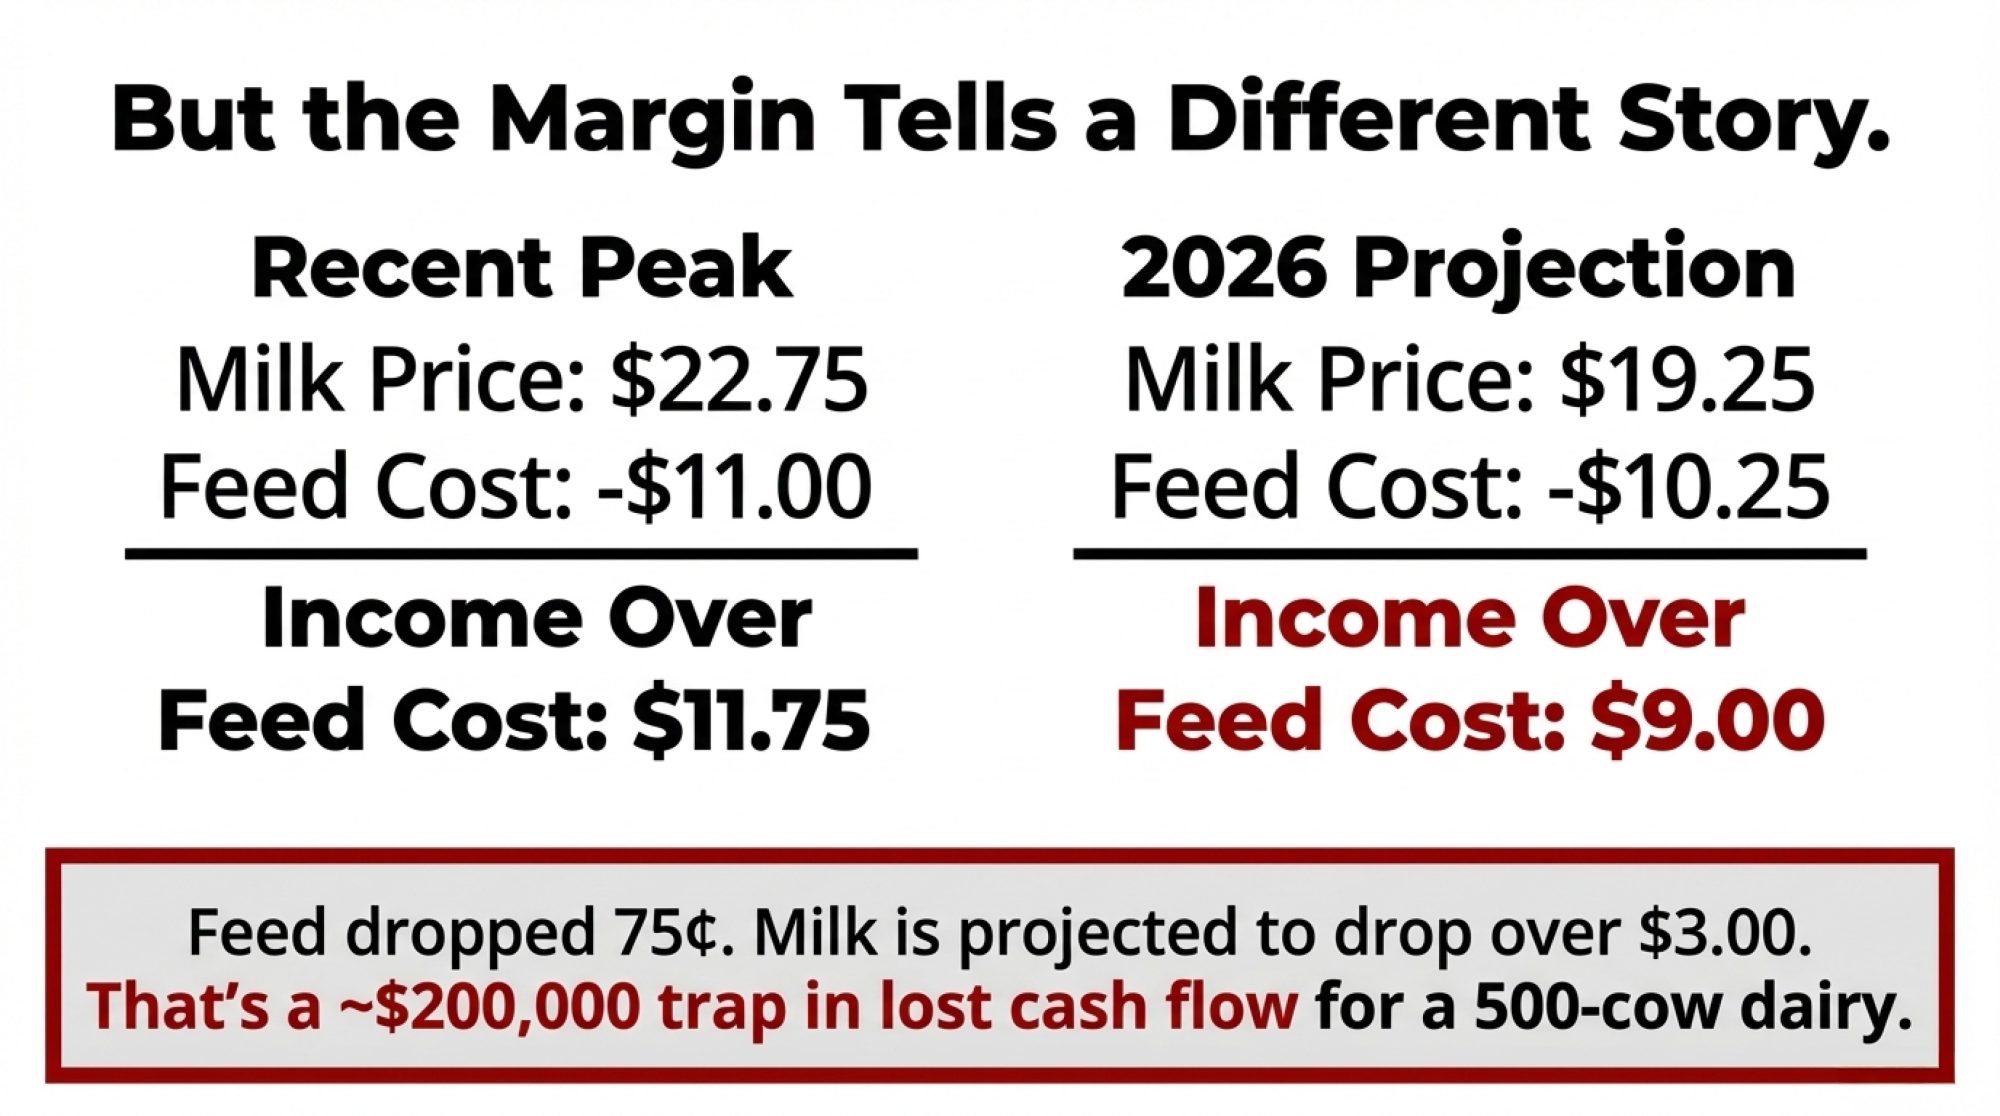
Here’s what makes this situation so frustrating for many of us. Feed costs dropped meaningfully through 2025. Corn’s been trading in the low $4s per bushel—USDA’s November World Agricultural Supply and Demand Estimates report projected $4.00 for 2025-26—down considerably from that $6.54 peak we saw in 2023. Soybean meal’s been running in the high $200s to low $300s per ton through fall. For most operations, that translates to real savings on the feed side.
But milk revenue softened faster. USDA National Agricultural Statistics Service data shows September’s All-Milk price came in at $21.35/cwt, with Class III at $18.20. That’s below what many of us were hoping for at this point in the year.
What I’ve found talking to producers and running through numbers with nutritionists and farm business consultants: even with clearly lower feed costs, the decline in milk revenue has offset—and in many cases more than offset—those feed savings. The specifics vary by operation. Your ration, your components, and your cooperative’s pricing structure all matter. But the pattern holds across a lot of different farm types.
Mike’s take stuck with me: “I saved money on feed. But I lost more on milk. The feed savings felt like winning a $20 scratch ticket after your truck got totaled.”
Where Your Money Is Actually Going
So what’s creating that $4/cwt gap between calculated margins and received margins? It comes down to several deductions that the DMC formula doesn’t capture.
The Make Allowance Shift
When the Federal Milk Marketing Order updates took effect on June 1, processors received larger deductions for manufacturing costs. American Farm Bureau Federation economist Danny Munch analyzed the impact, and his findings show the higher make allowances reduced farmer checks by roughly $0.85-0.93/cwt across the four main milk classes.
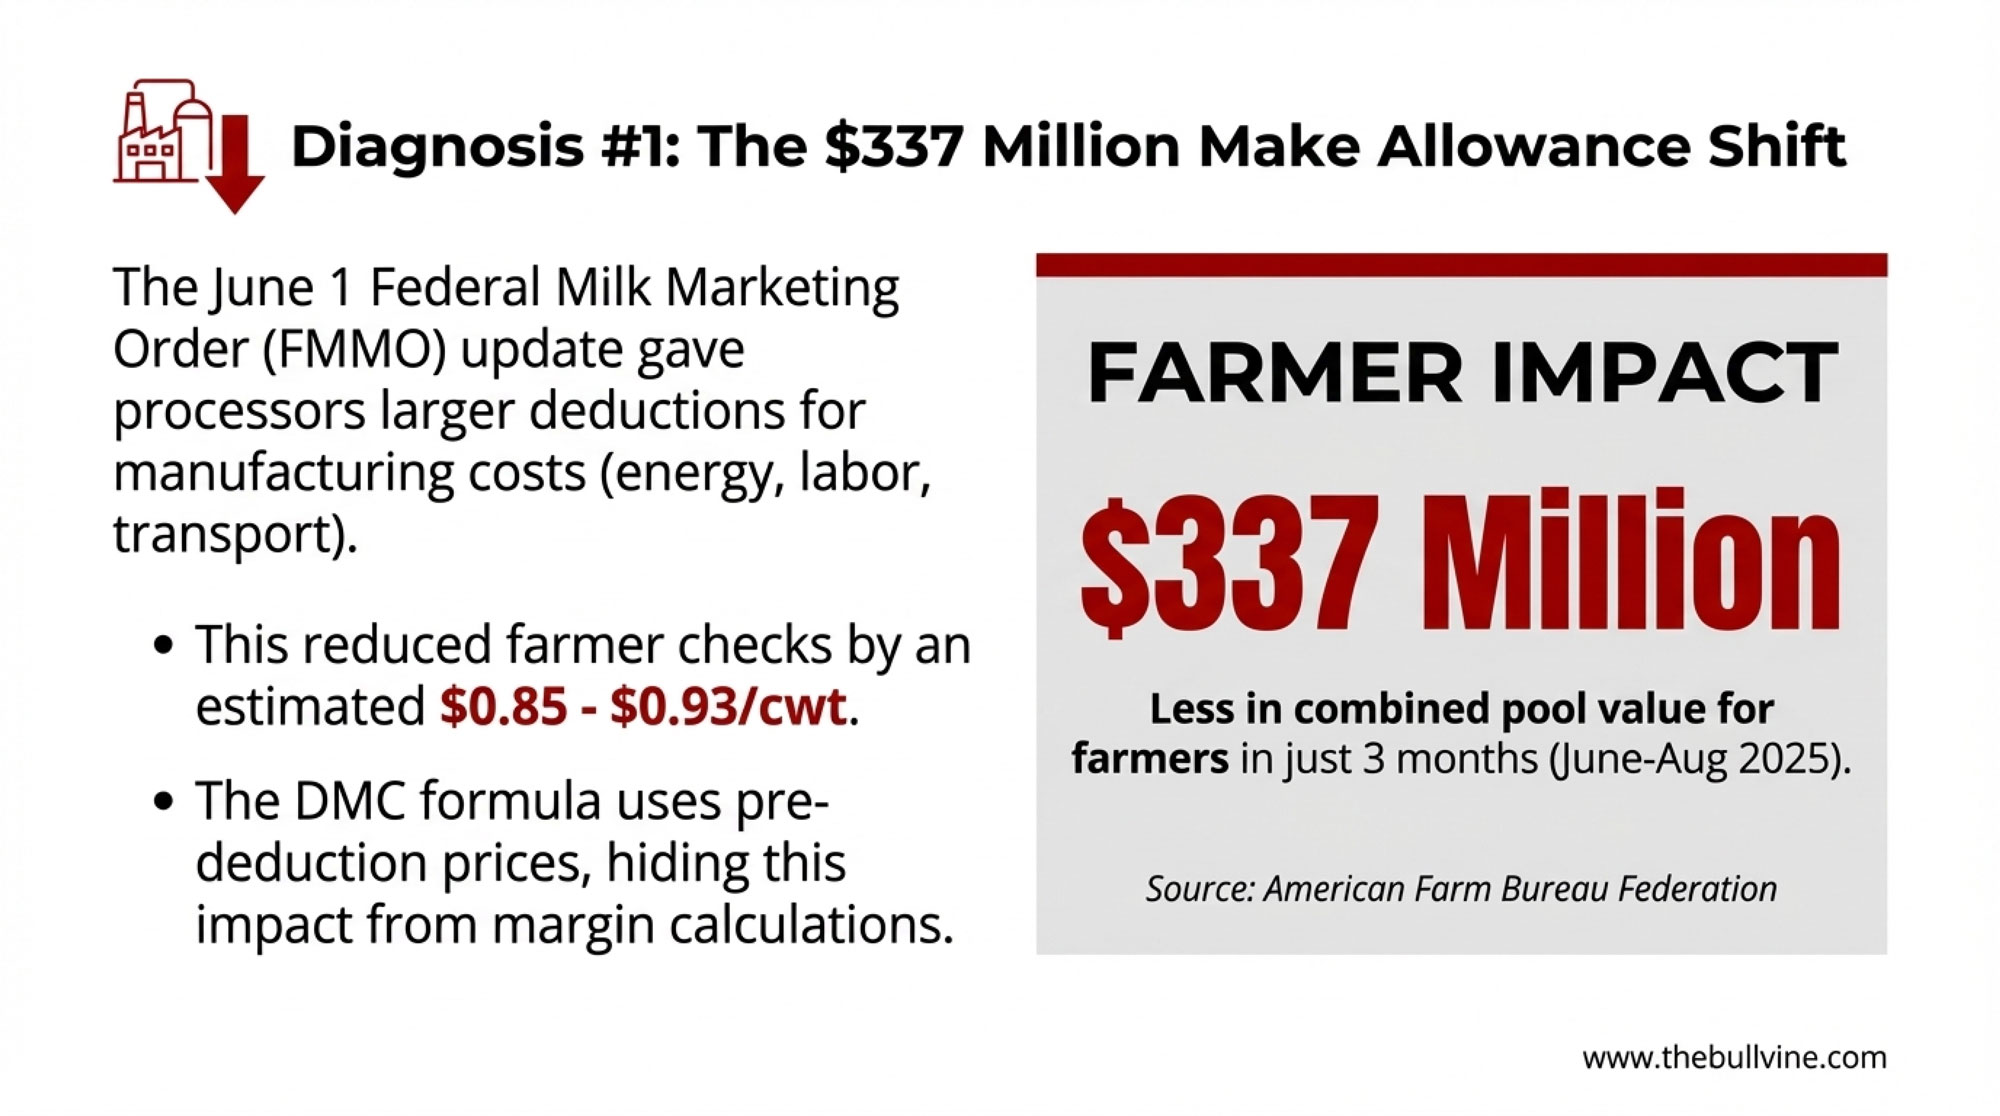
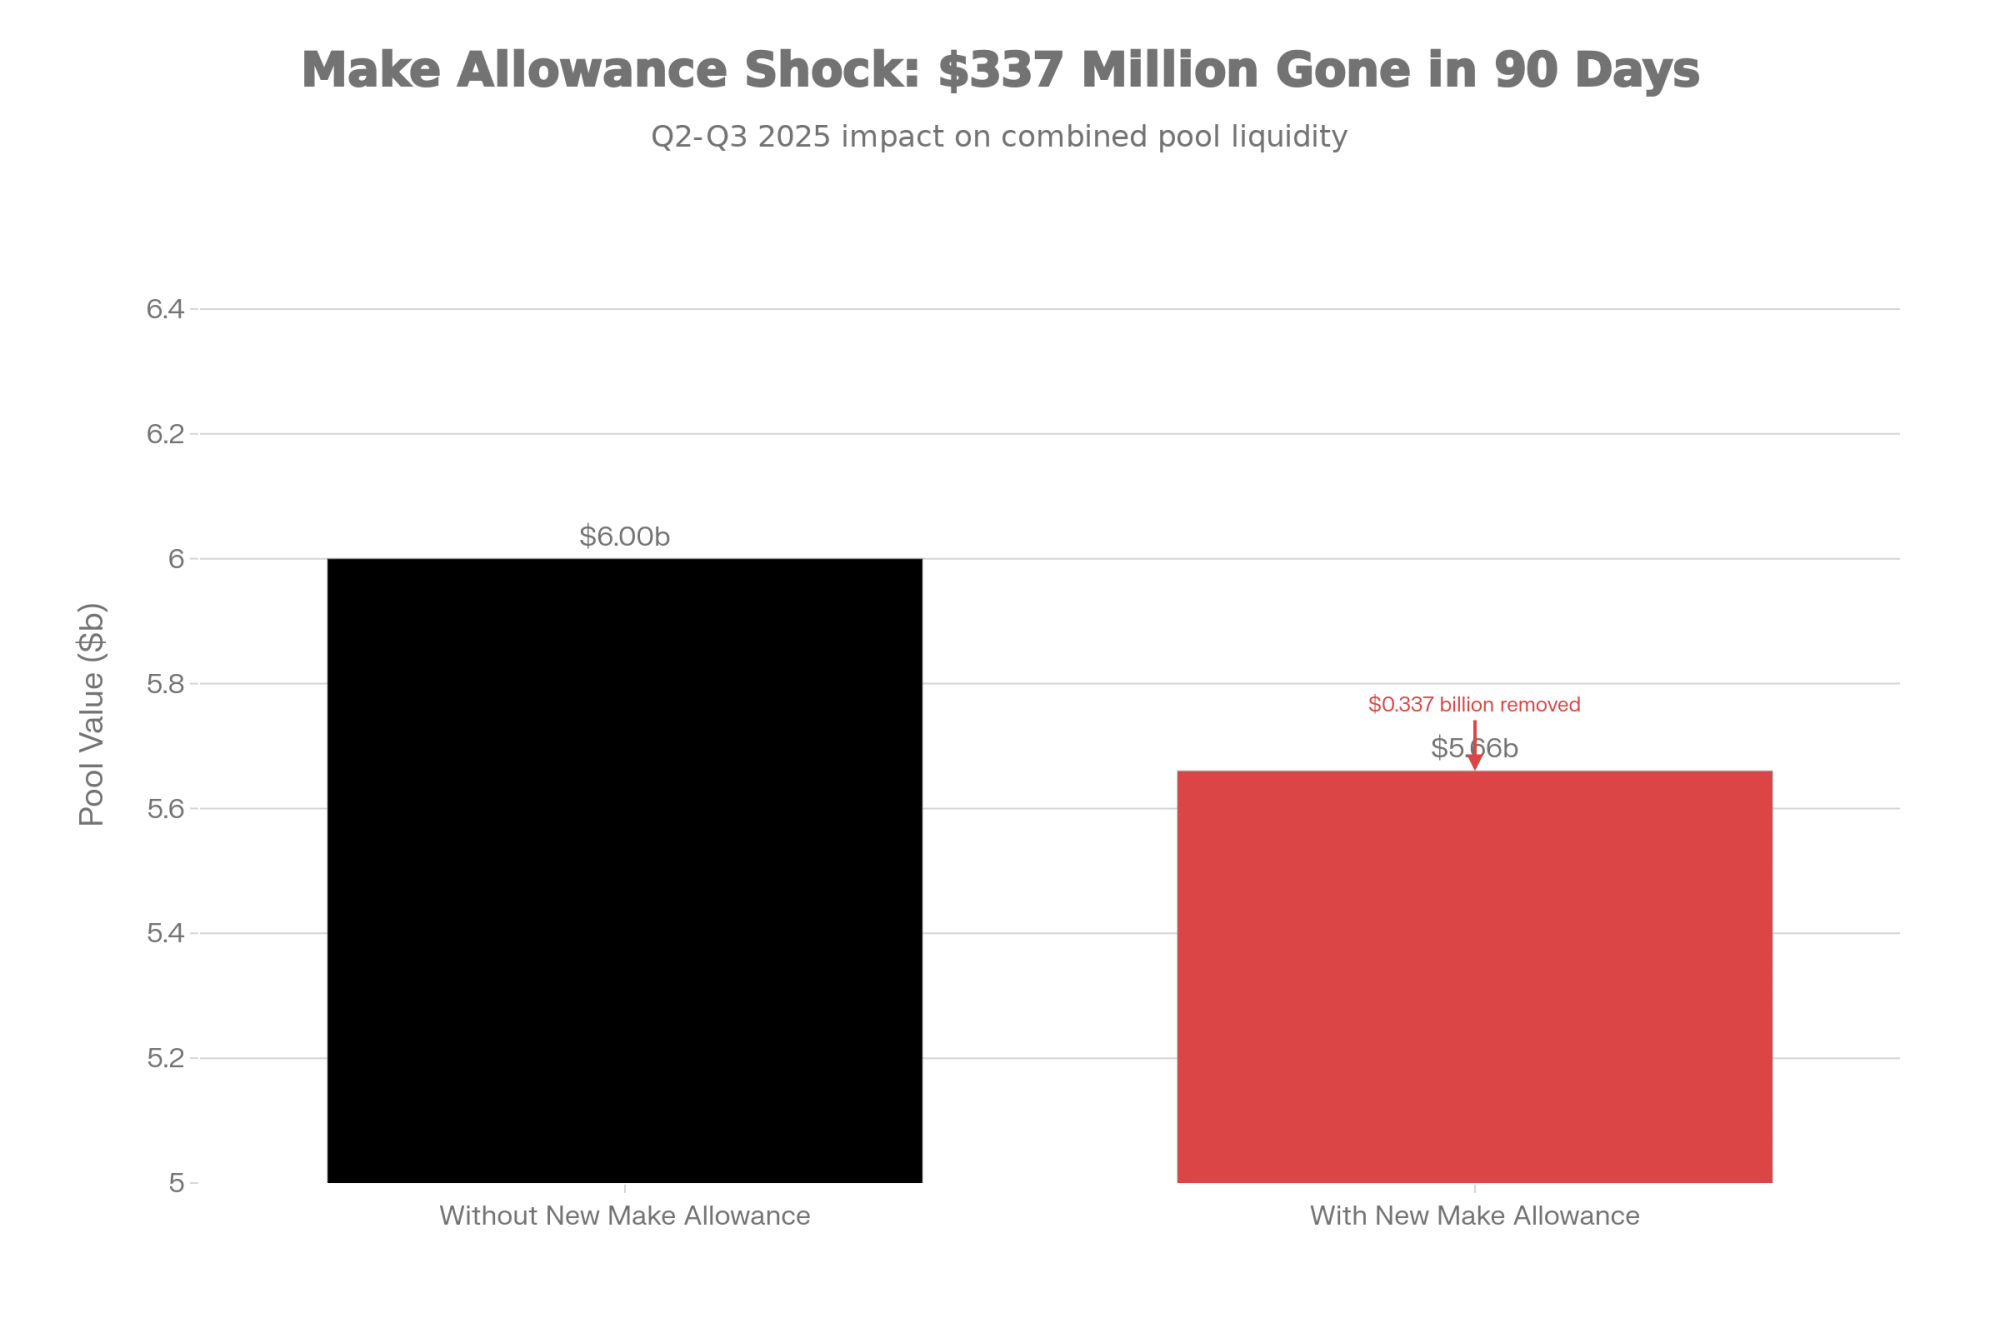
Key Finding: $337 Million Impact
Farm Bureau’s Market Intel analysis found that farmers saw more than $337 million less in combined pool value during the first three months under the new rules—that’s June through August alone.
| Scenario | Pool Value ($ billions) |
|---|---|
| Without new make allowance | 6.00 |
| With new make allowance | 5.66 |
Source: American Farm Bureau Federation, September 2025
I talked with a Midwest cooperative field rep who asked to stay anonymous, given how sensitive pricing discussions can be. His perspective added some nuance worth considering: “Nobody wanted to make allowances to go up. But processing costs genuinely increased—energy, labor, transportation. The alternative was plant closures, and that would have helped nobody. It’s a situation where producers and processors both feel squeezed.”
He raises a fair point. The processing sector faced real cost pressures, and there’s a legitimate argument that updated make allowances were overdue. That said, the timing has been difficult for producers already navigating softer milk prices.
What’s worth understanding here is that the DMC formula uses pre-deduction prices. So your calculated margin looks healthy, while your actual check reflects those higher processor allowances.
Regional Pricing Reality
DMC uses national average milk prices, but anyone who’s compared notes with producers in other states knows the spread can be significant.
The Regional Price Gap: Same Month, Different Reality
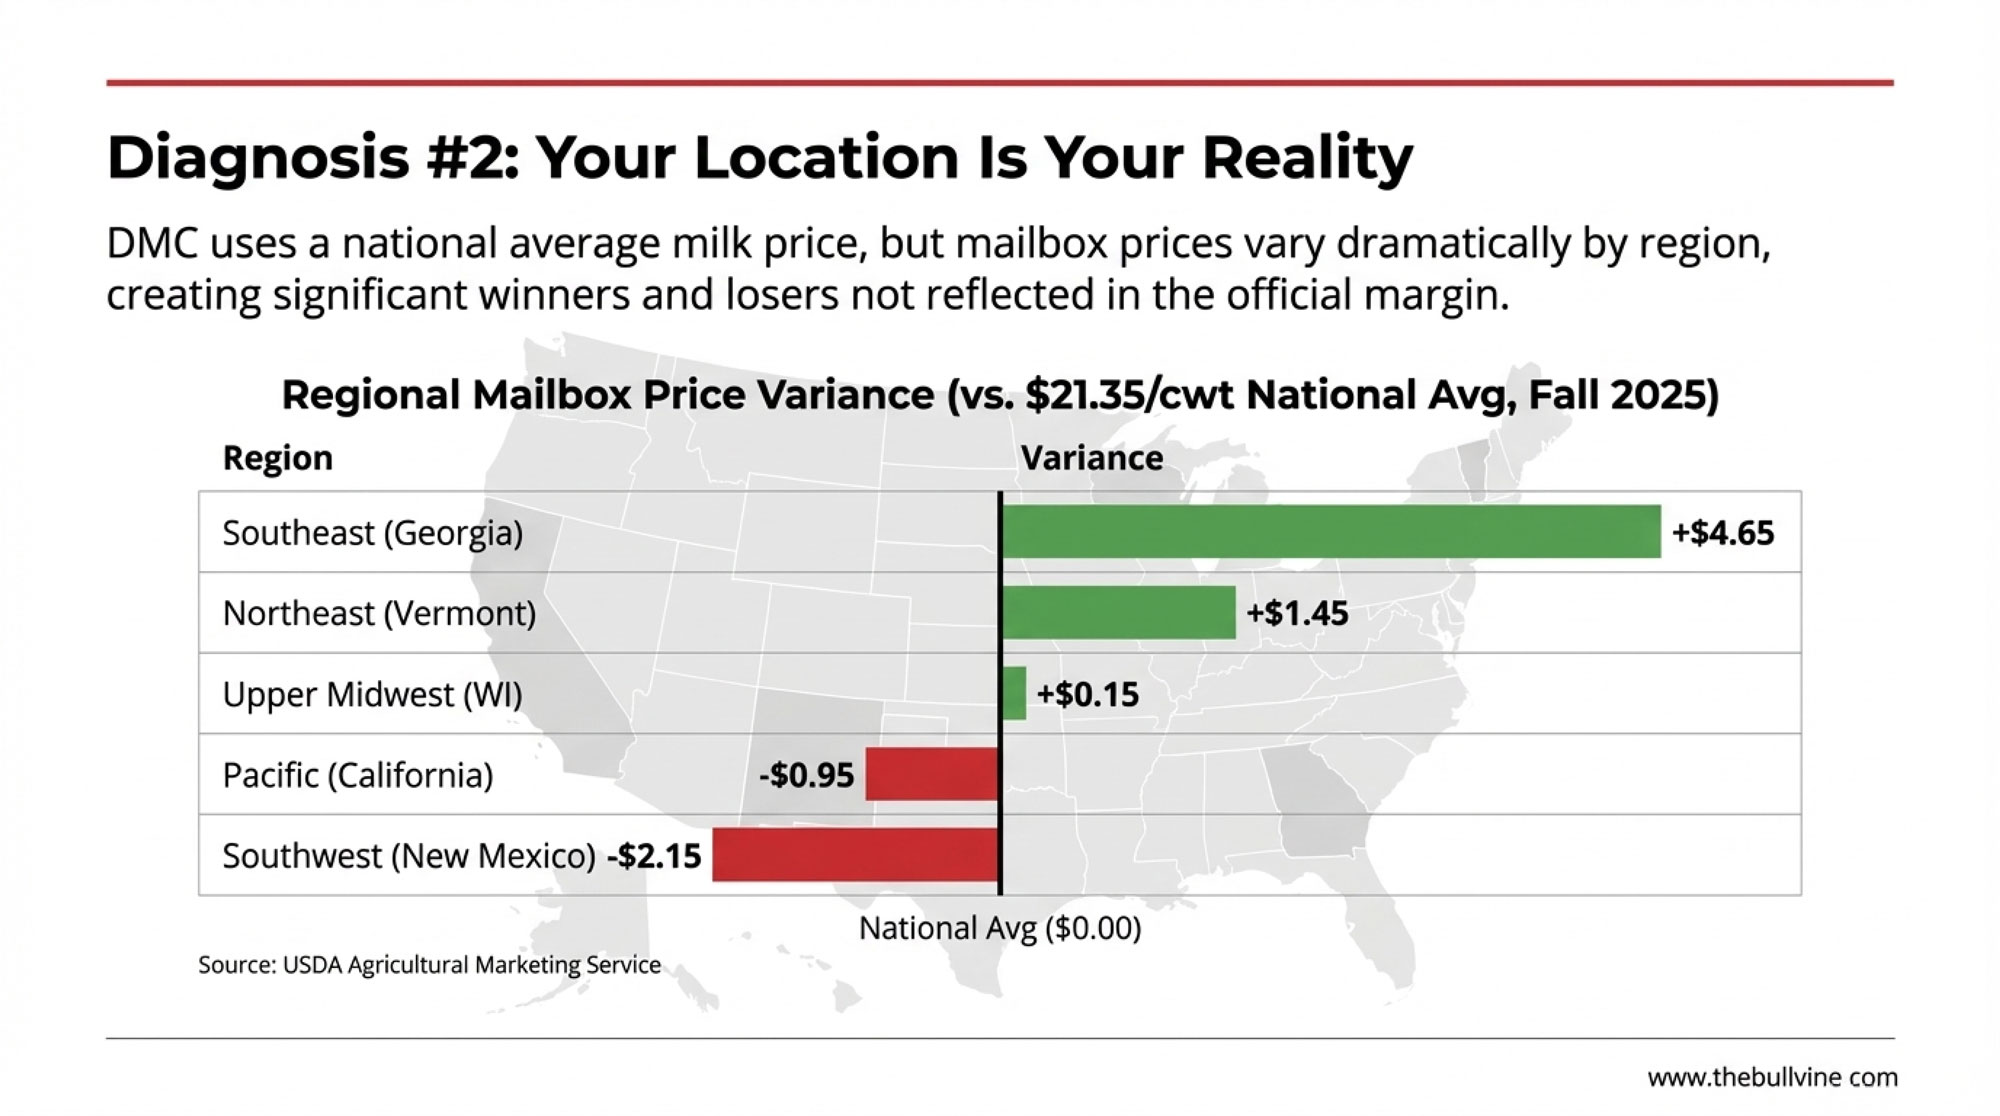
| Region | Approximate Mailbox Price | Variance |
| Southeast (Georgia) | ~$26.00/cwt | +$4.65 |
| Northeast (Vermont) | ~$22.80/cwt | +$1.45 |
| Upper Midwest (Wisconsin) | ~$21.50/cwt | +$0.15 |
| Pacific (California) | ~$20.40/cwt | -$0.95 |
| Southwest (New Mexico) | ~$19.20/cwt | -$2.15 |
Source: USDA Agricultural Marketing Service Federal Order mailbox prices, Fall 2025
The regional story plays out differently depending on where you’re milking cows. Upper Midwest producers deal with cooperative basis adjustments and seasonal hauling challenges. California’s Central Valley operations face water costs that have fundamentally changed their cost structure—some producers there tell me water now rivals feed as their biggest variable expense. Southwest operations running large dry-lot systems have entirely different economics.
The Component Pricing Shuffle
Here’s one that caught a lot of producers off guard: the June 2025 FMMO changes removed 500-pound barrel cheddar from Class III pricing calculations. Now, only 40-pound block cheddar prices determine protein valuations—the USDA Agricultural Marketing Service confirmed this in their final rule.
Sounds technical, I know. But when barrels were trading higher than blocks—which they were in early summer—that switch affected producer checks. The rationale was to reduce price volatility and better reflect actual cheese market conditions, though the timing meant lower payments for many during that transition period.
Stack all of these together, and you get that $4-5/cwt gap between what DMC says you’re earning and what you’re actually receiving.
The Production Paradox
One thing that keeps coming up in conversations: if margins are this tight, why does milk keep flowing?
USDA NASS data shows national production running 1-4% above year-earlier levels in many recent months. July 2025 came in 3.4% higher than July 2024, totaling 19.6 billion pounds nationally.

At the same time, we’re watching a steady structural decline in dairy farm numbers. USDA has documented this trend for years—thousands of farms exiting nationally over the past decade, with several hundred closing each year just in heavily dairy states like Wisconsin.
Expert Insight: Leonard Polzin, Ph.D. Dairy Economist, University of Wisconsin-Madison Extension
“What we’re seeing is expansion commitments made in 2022-2023 when margins looked completely different. That debt doesn’t care about today’s milk prices. Producers have to keep milking to service those loans.”
There’s also the heifer situation. Replacement heifer inventory has dropped to 3.914 million head—the lowest level since 1978, according to USDA cattle inventory reports and confirmed by Dairy Herd Management coverage. Producers who might otherwise strategically cull their way to a smaller herd can’t easily replace the animals they’d be selling.
And then there’s processing. Since 2023, substantial new cheese processing capacity has come online—much of it financed through long-term USDA Rural Development loans requiring consistent milk intake. Those plants need milk regardless of farmgate prices.
For your operation: the supply response to low prices is likely to be slower than historical patterns suggest. If you’re planning around industry-wide production cuts that are expected to boost prices by late 2026, a longer timeline may be more realistic.
Why the Export Safety Valve Is Stuck
I’ve had producers ask when China might start buying again. Honestly? That valve is essentially closed for the foreseeable future.
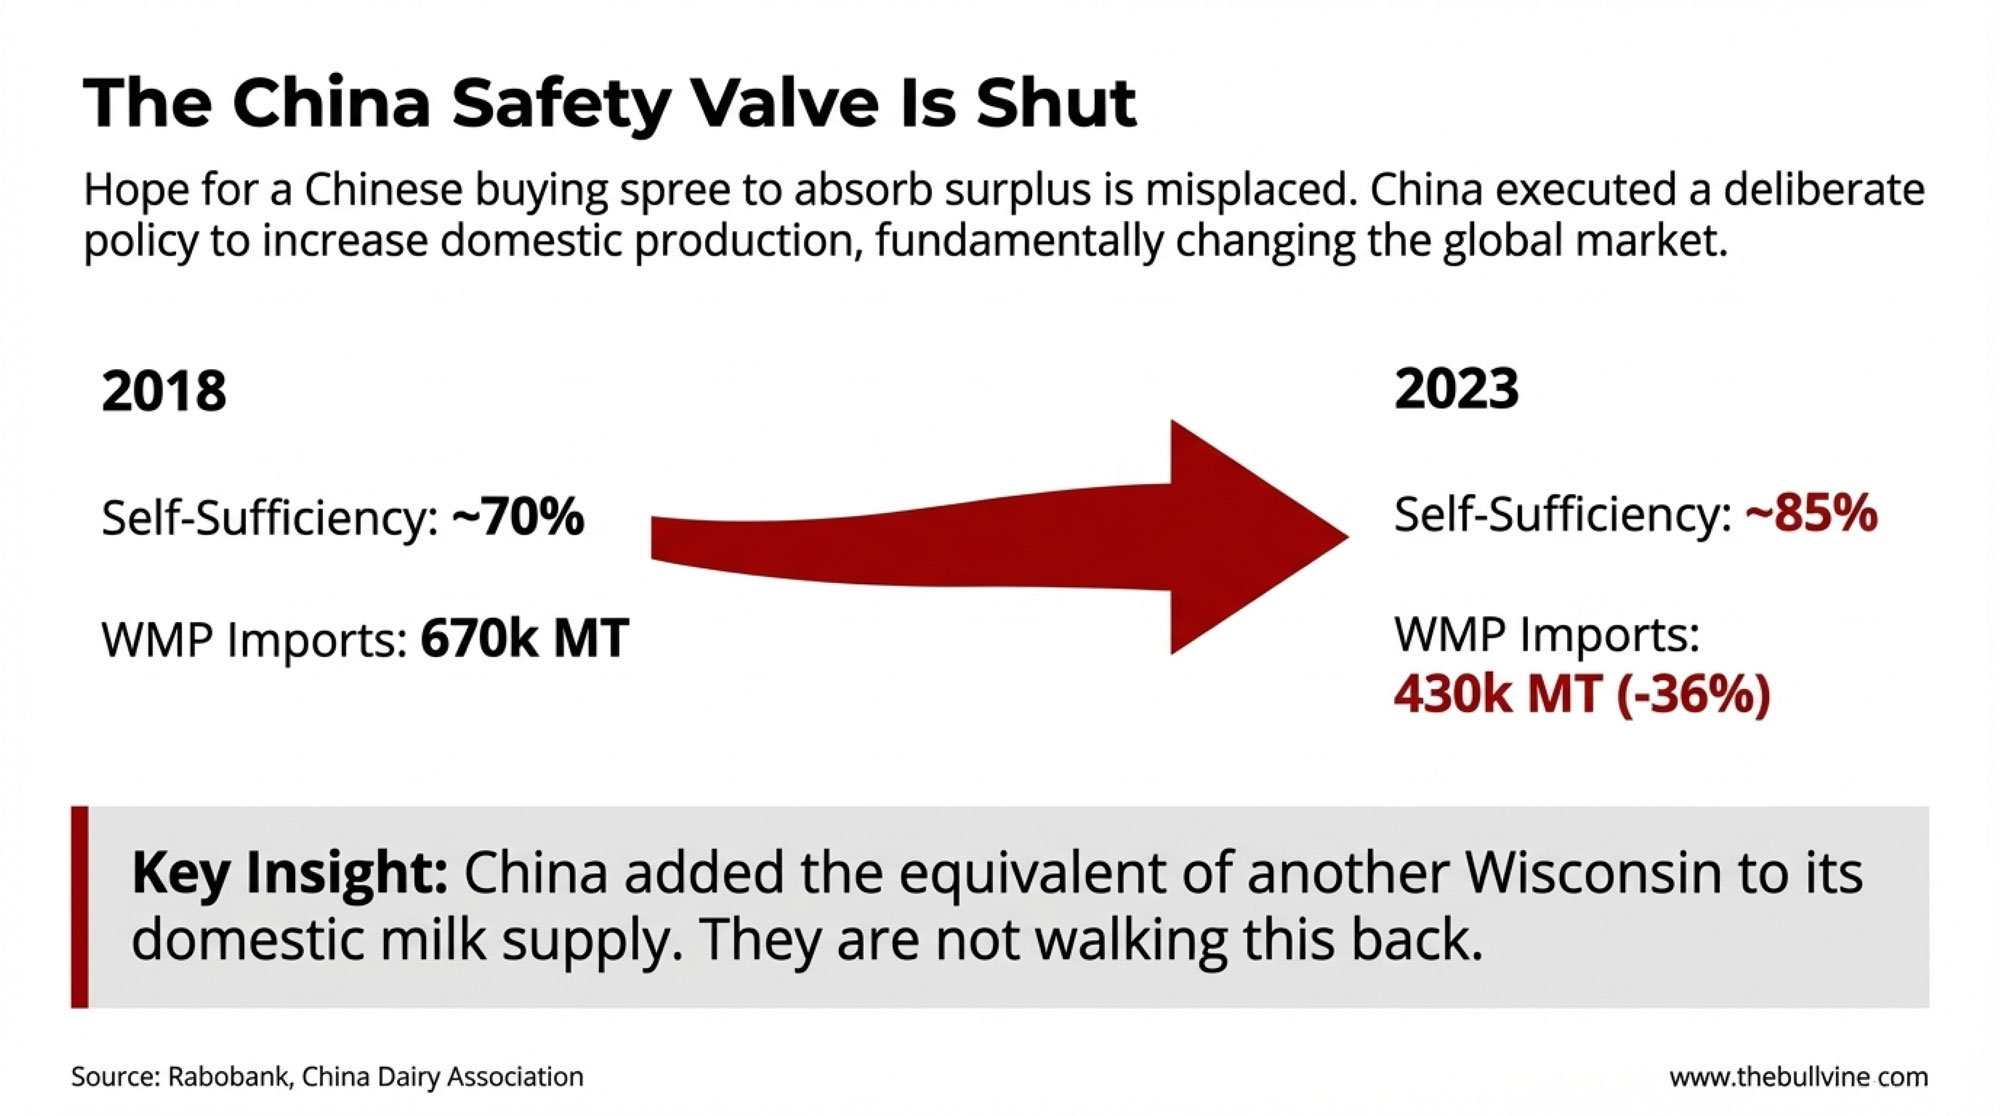
Between 2018 and 2023, China added roughly 10-11 million metric tons of domestic milk production—equivalent to around 24-25 billion pounds. Rabobank senior dairy analyst Mary Ledman noted that’s almost like adding another Wisconsin to their domestic supply. The result? Self-sufficiency jumped from about 70% to 85% during this period.
China’s Dairy Transformation: The Numbers
| Metric | Before (2018) | After (2023) | Change |
| Self-sufficiency | ~70% | ~85% | +15 pts |
| WMP imports | 670,000 MT/yr avg | 430,000 MT | -36% |
| Impact on competitors | — | 7% of NZ production was displaced | — |
Sources: Rabobank/Brownfield Ag News
This wasn’t market fluctuation—it was deliberate government policy. And they’re not walking it back. In July 2025, China’s Dairy Association announced plans to maintain at least 70% self-sufficiency through 2030.
For U.S. producers, this represents a structural shift. Other markets—Southeast Asia, Mexico, and parts of the Middle East—continue to show growth potential. But that traditional “surplus absorption” mechanism that China provided? It’s significantly smaller than it used to be.
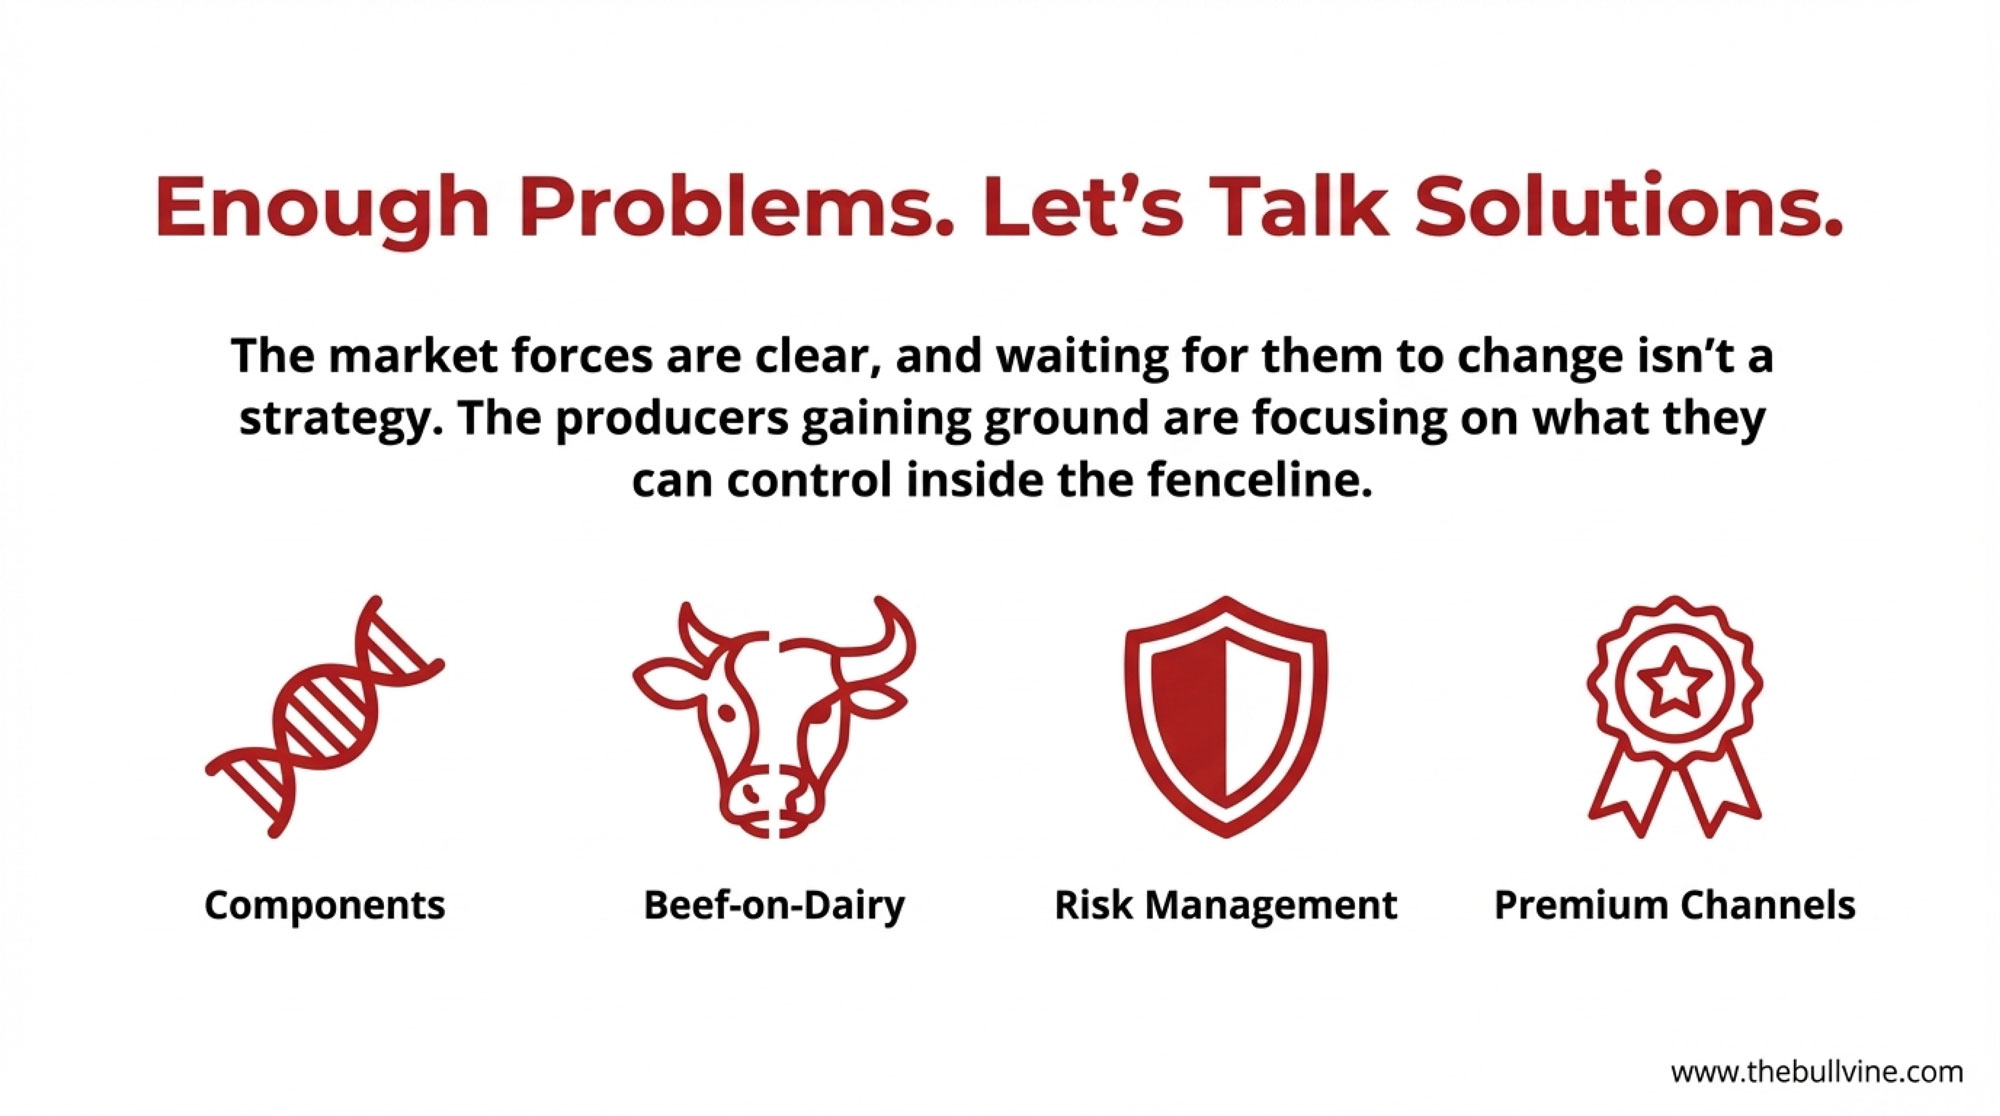
What’s Actually Working: Four Strategies From the Field
Enough about challenges. Let’s talk about what’s actually moving the needle on margins.
Getting Paid for Components
Sarah Kasper runs a 340-cow operation in central Minnesota that she transitioned to component-focused management three years ago. Her approach: genomic testing on every replacement heifer, sire selection emphasizing butterfat and protein over milk volume, and ration adjustments optimizing for component production rather than peak pounds.
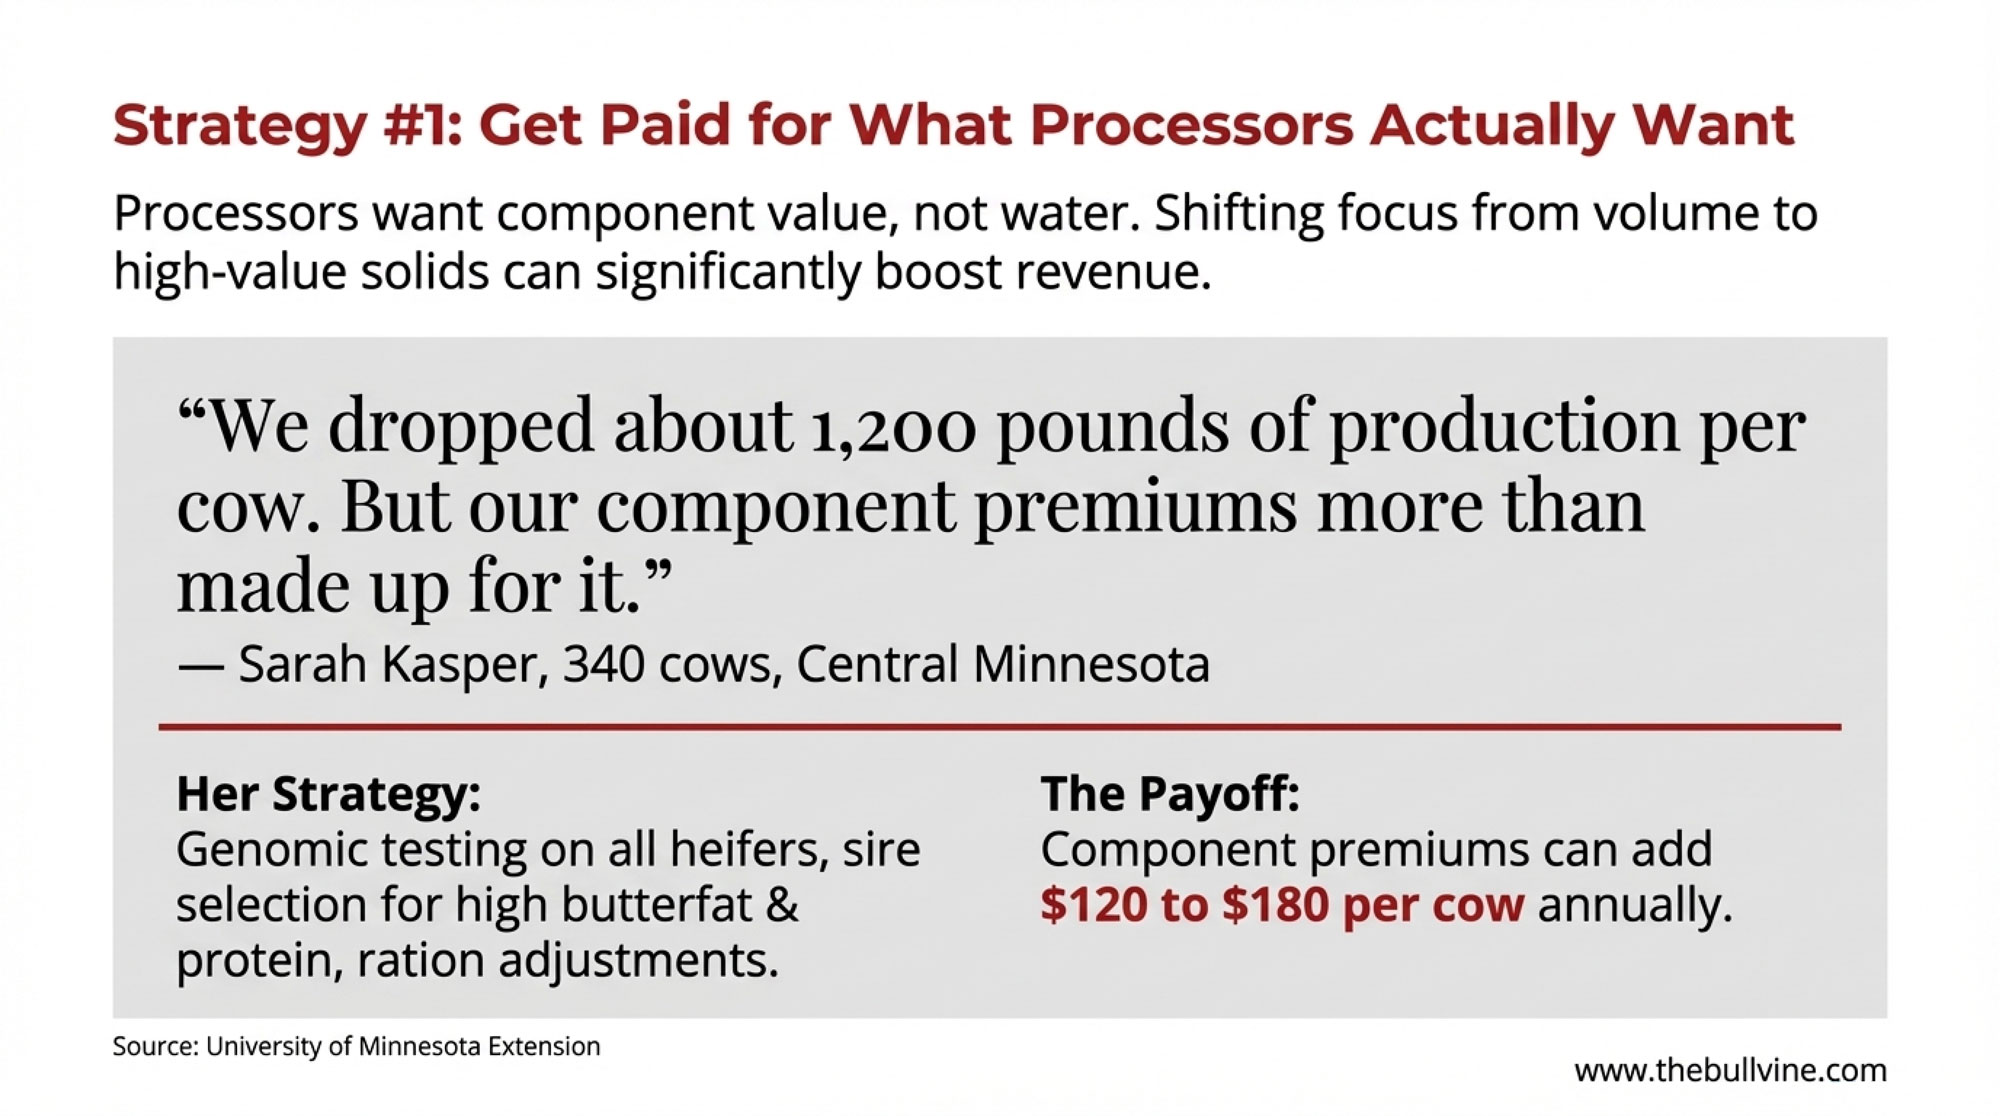
“We dropped about 1,200 pounds of production per cow. But our component premiums more than made up for it. We’re getting paid for what processors actually want.” — Sarah Kasper, Central Minnesota (340 cows)
University of Minnesota Extension dairy economic analyses document component premiums ranging from $120 to $ 180 per cow annually for operations achieving above-average butterfat and protein levels. With genomic testing running $30-50 per animal, the return on investment can be meaningful—especially compounded over multiple generations.
What processors increasingly want is component value, not volume. April 2025 USDA data showed cheese production up 0.9% year-over-year while butter production fell 1.8%—processors are routing high-component milk toward their highest-margin products.
The Beef-on-Dairy Opportunity
This strategy has seen remarkable adoption. CattleFax data reported by Hoard’s Dairyman shows there were about 2.6 million beef-on-dairy calves born in 2022, up from just 410,000 in 2018. CattleFax projects that it could grow to 4-5 million head by 2026.
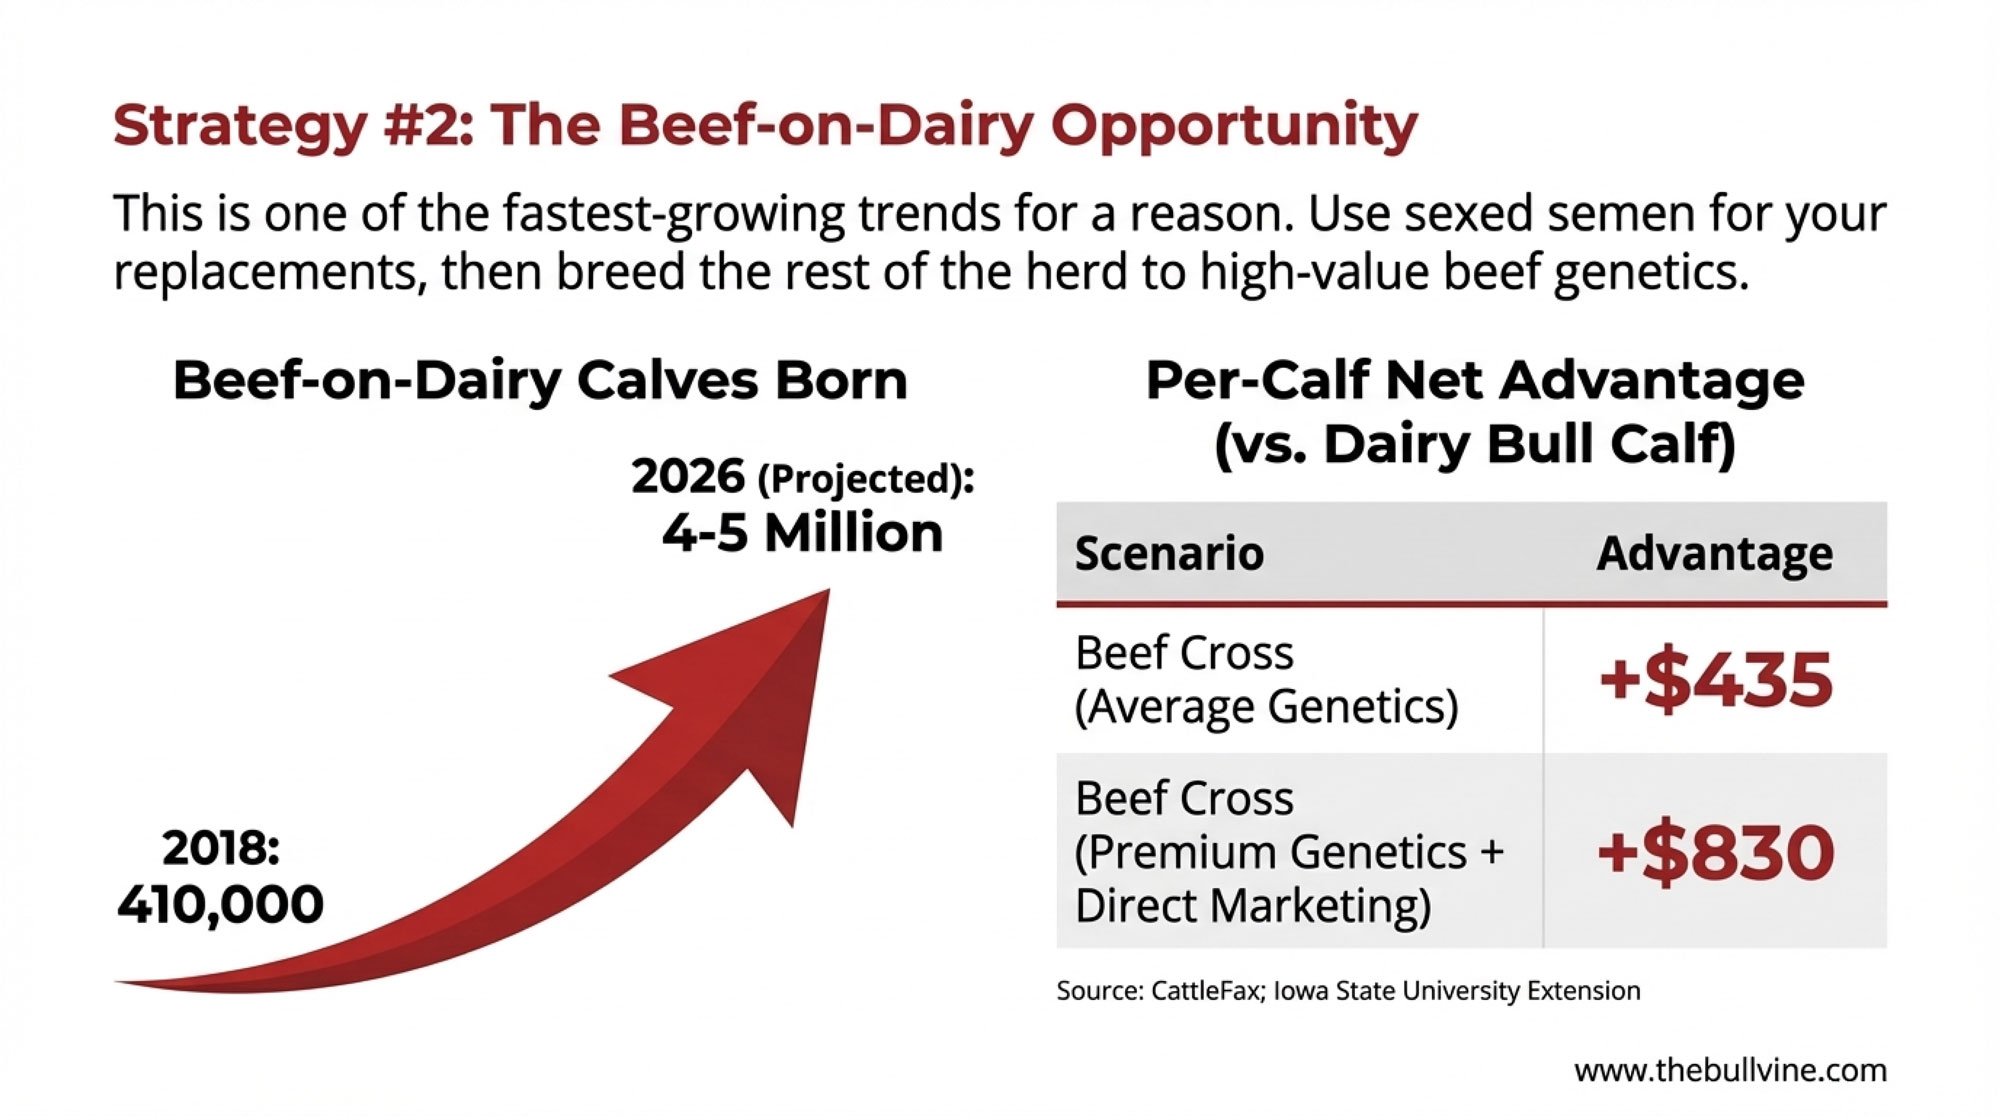
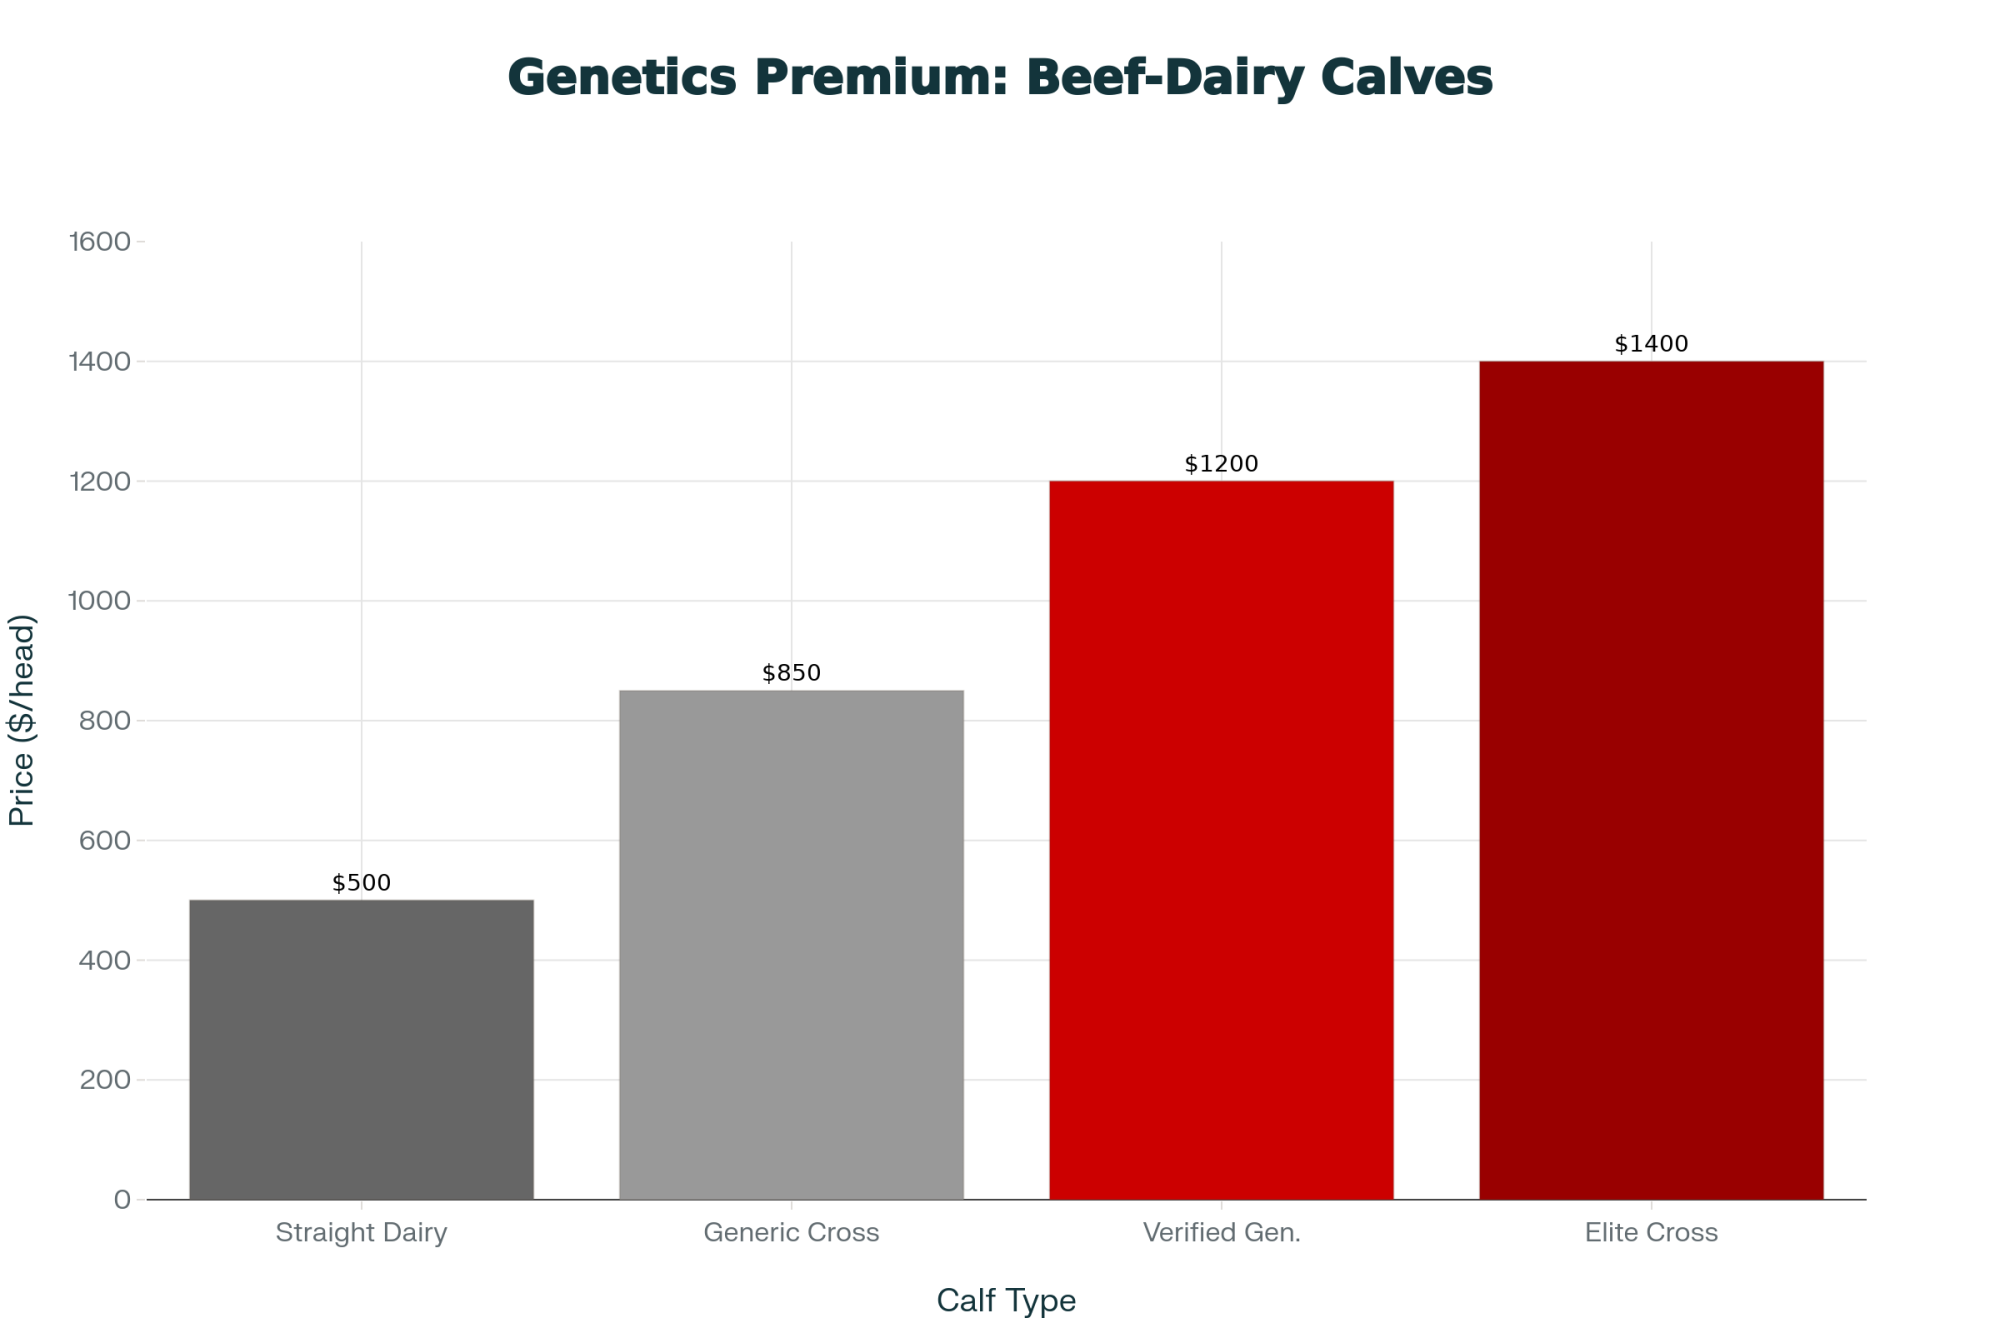
The economics are fairly straightforward. Use sexed dairy semen on your top-performing cows to secure replacements, then breed the remaining 60-70% of your herd to beef genetics. A dairy bull calf might bring $200-400. A well-managed beef cross with the right genetics and colostrum management can fetch $900-1,250 through direct feedlot relationships, according to Iowa State University Extension beef-dairy market reports.
Beef-on-Dairy Economics: Per-Calf Comparison
| Scenario | Calf Value | Semen Cost | Net Advantage |
| Dairy bull calf | $250 | $8-15 | Baseline |
| Beef cross (average genetics) | $700 | $15-25 | +$435 |
| Beef cross (premium genetics + direct marketing) | $1,100 | $20-35 | +$830 |
Note: Values vary significantly by region, genetics quality, and buyer relationships Sources: Iowa State Extension; Hoard’s Dairyman market reports
But here’s where genetics selection really matters—and where I see a lot of operations leaving money on the table.
Research published in the Journal of Dairy Science in 2025 found the average incidence of difficult calving in beef-on-dairy crosses runs around 15%. But breed selection makes a significant difference: data from the Journal of Breeding and Genetics shows Angus-sired calves had only 7% calving difficulty compared to 13% for Limousin when looking at male calves.
Beef Sire Selection: The Calving Ease vs. Carcass Quality Tradeoff
Here’s the tension every producer needs to understand: beef sires selected for ease of calving and short gestation are often antagonistically correlated with carcass weight and conformation, according to research in Translational Animal Science.
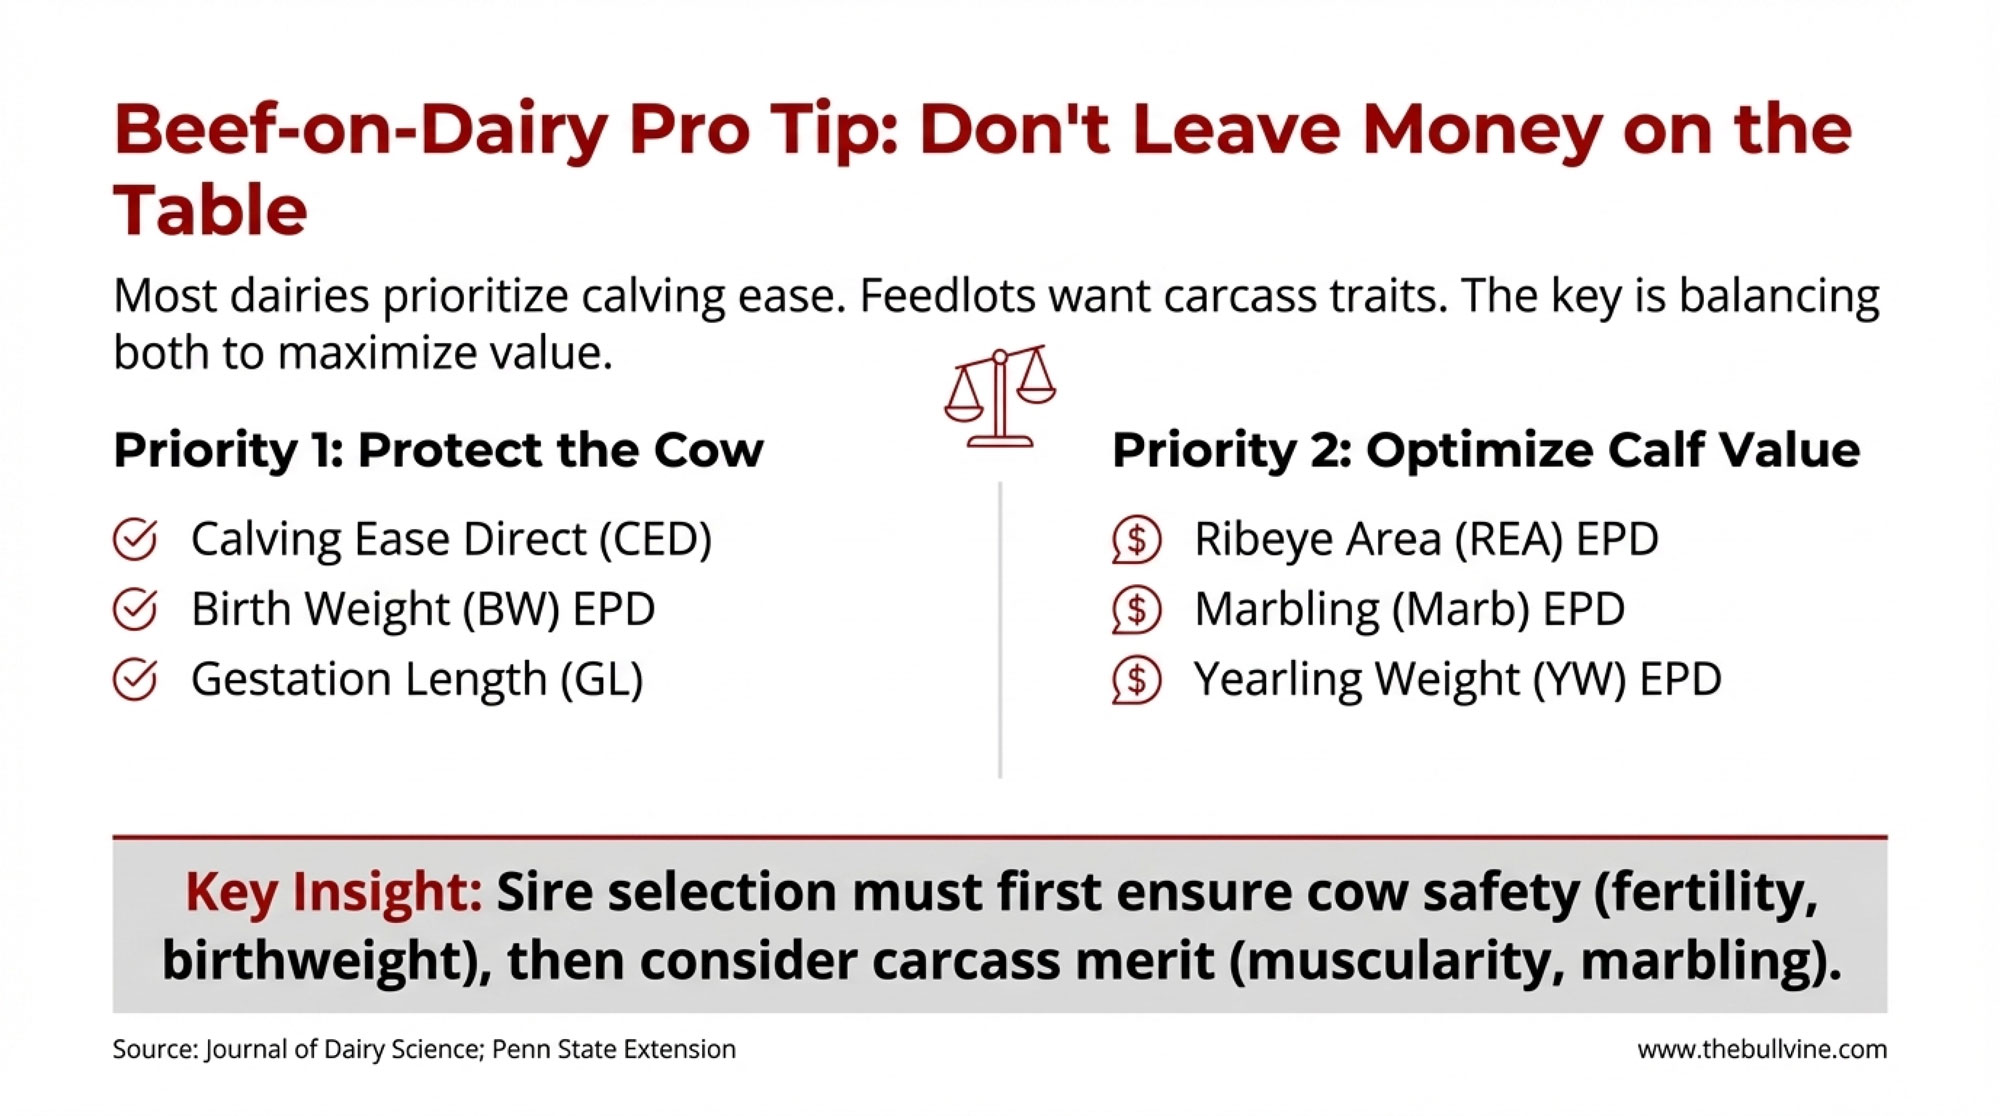
Priority 1 — Protect the Cow:
- Calving Ease Direct (CED): Select from the top 25% of beef sires
- Birth Weight EPD: Lower is generally safer for dairy dams
- Gestation Length: Angus adds ~1 day vs. Holstein; Limousin adds 5 days; Wagyu adds 8 days
Priority 2 — Optimize Calf Value:
- Frame Size: Moderate-framed bulls generally produce more feed-efficient animals
- Ribeye Area (REA) EPD: Higher values improve carcass muscling
- Marbling EPD: Targets quality grade premiums
- Yearling Weight EPD: Predicts growth performance
Sources: Journal of Dairy Science (2025); Penn State Extension; Michigan State Extension; Translational Animal Science
A Hoard’s Dairyman survey found that most dairies currently prioritize conception rate, calving ease, and cost when selecting beef sires—but feedlot and carcass performance traits aren’t priorities for most farms yet. Michigan State Extension notes this is a missed opportunity: selecting for terminal traits that improve growth rate and increase muscling should be a priority.
The bottom line from peer-reviewed research: sire selection for beef-on-dairy should firstly emphasize acceptable fertility and birthweight because of their influence on cow performance at the dairy; secondarily, carcass merit for both muscularity and marbling should receive consideration.
Tom and Linda Verschoor, who run 1,200 cows near Sioux Center, Iowa, started their beef-on-dairy program in 2022 with this balanced approach. “We figured out we only need about 35% of our herd for replacements,” Tom explained.
They report that in 2024, they generated roughly $185,000 more revenue from beef-cross calves than they would have from traditional dairy bull calves. Results will vary depending on genetics quality, calf care, and buyer relationships. But the opportunity is real for operations set up to capture it.
Actually Using the Risk Management Tools
This is where I see one of the biggest gaps between what’s available and what producers actually use.
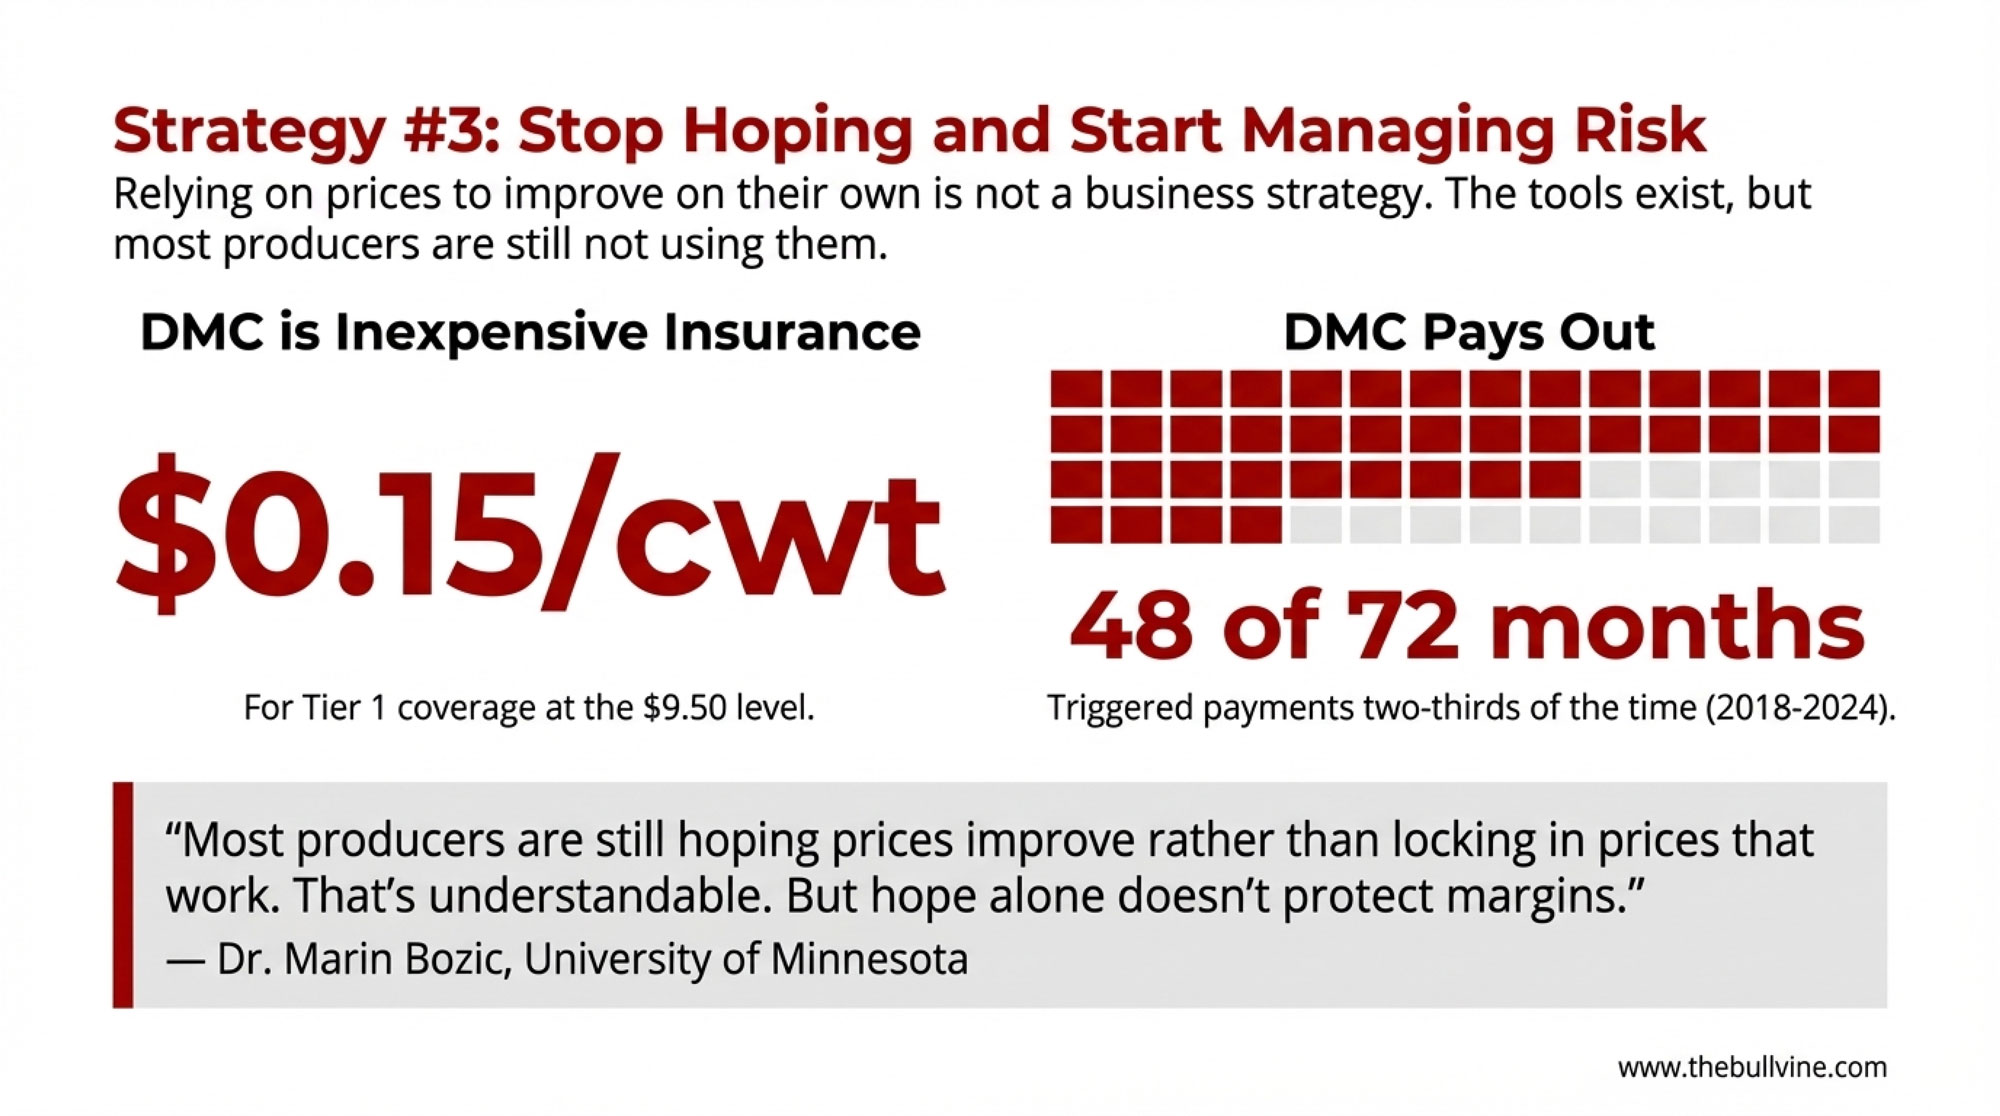
DMC Tier 1 coverage costs $0.15/cwt, with a $9.50/cwt margin protection on the first 5 million pounds. University of Wisconsin-Extension analysis shows that from 2018-2024, DMC triggered payments in 48 of 72 months—about two-thirds of the time. Average net indemnity ran $1.35/cwt during payment months. It’s essentially catastrophic margin insurance at minimal cost.
| Scenario | Covered Milk (million lbs/year) | Net Avg Indemnity ($/cwt in pay months) | Approx. Extra Margin per Year ($) |
|---|---|---|---|
| No DMC enrollment | 0 | 0.00 | 0 |
| DMC Tier 1 at $9.50 margin | 5 | 1.35 | 45,000 |
Beyond DMC, Class III futures and options let you establish price floors. If your break-even is $16/cwt and you can lock $17/cwt through futures, you’ve reduced margin uncertainty—even if it means giving up potential upside.
Expert Insight: Marin Bozic, Ph.D. Dairy Economist, University of Minnesota
Bozic often reminds producers at risk-management meetings that relying on prices to improve on their own simply isn’t really a strategy. Most producers are still hoping prices improve rather than locking in prices that work. That’s understandable. But hope alone doesn’t protect margins.
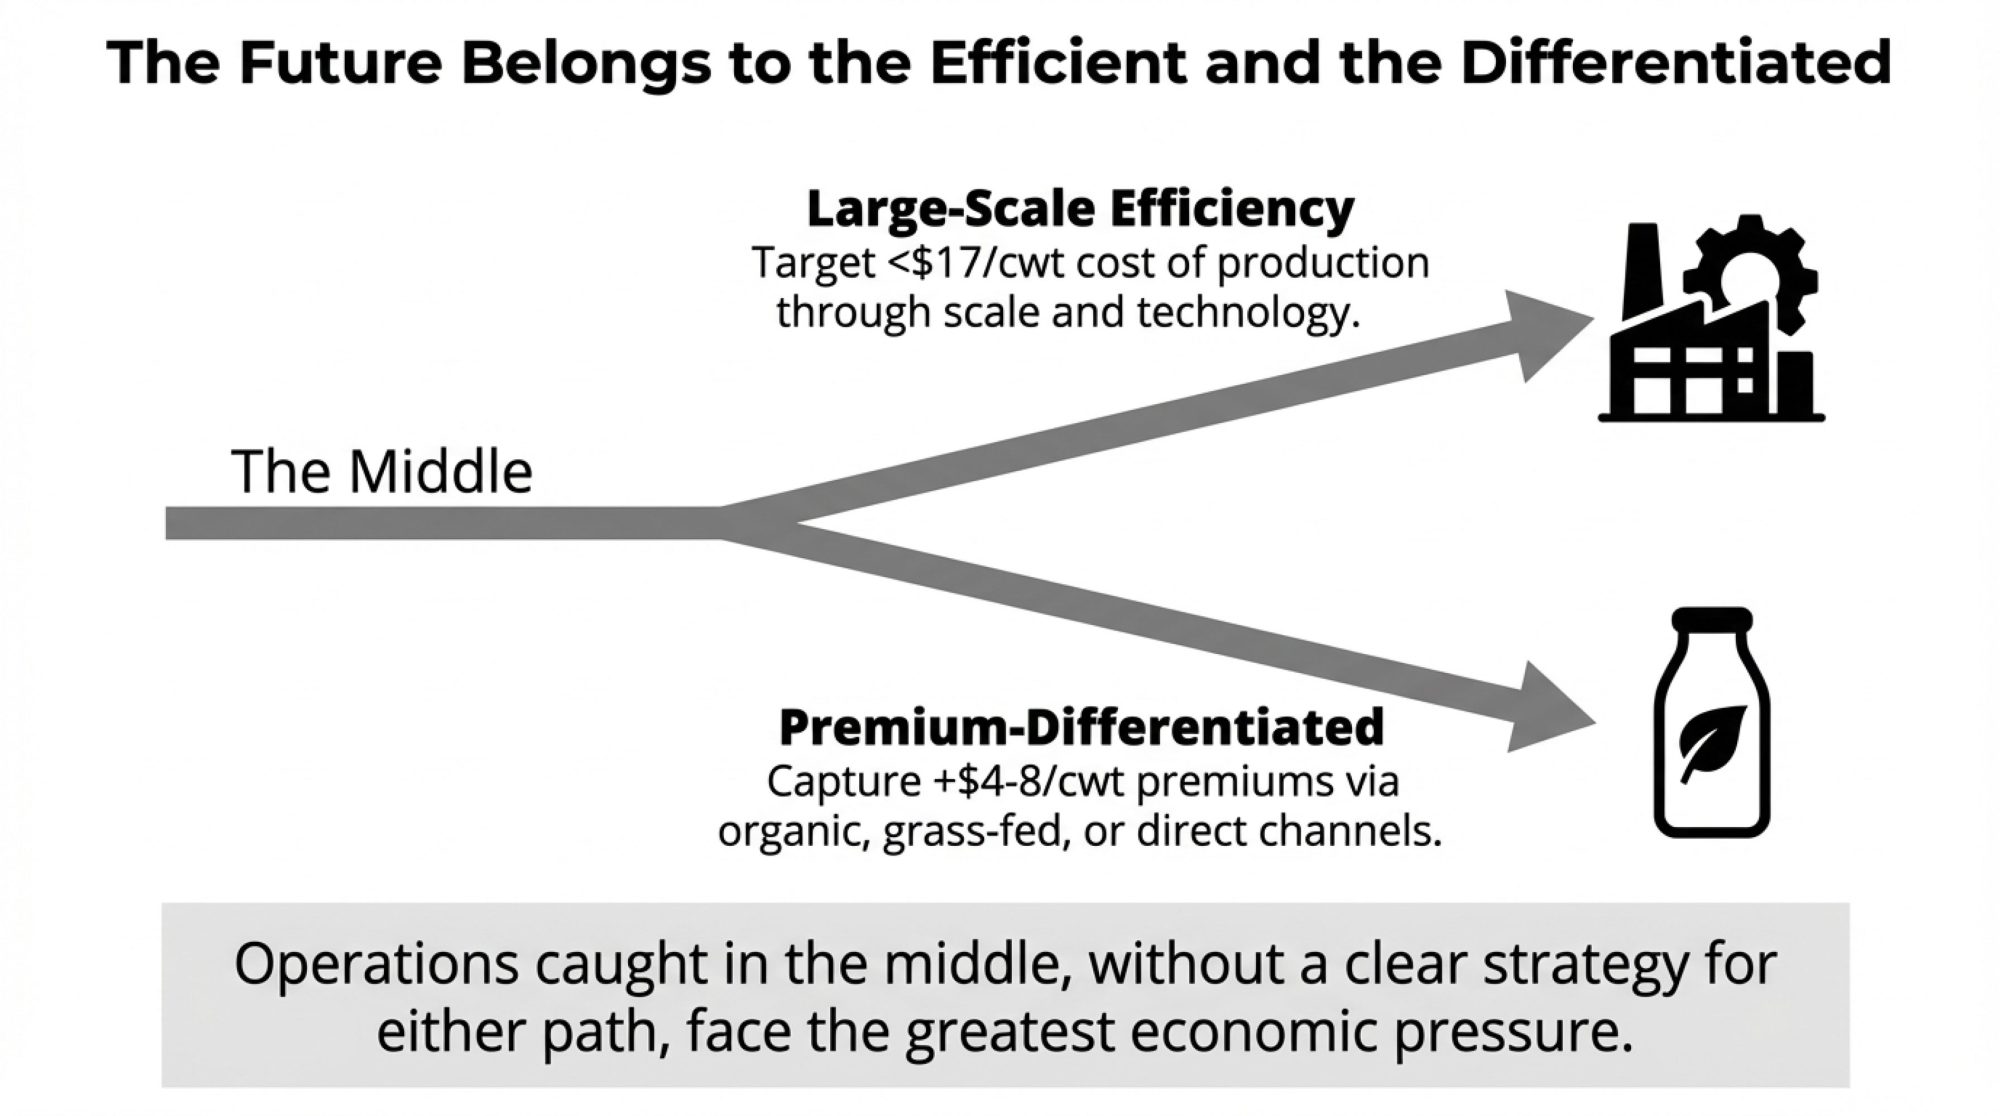
Finding Premium Channels
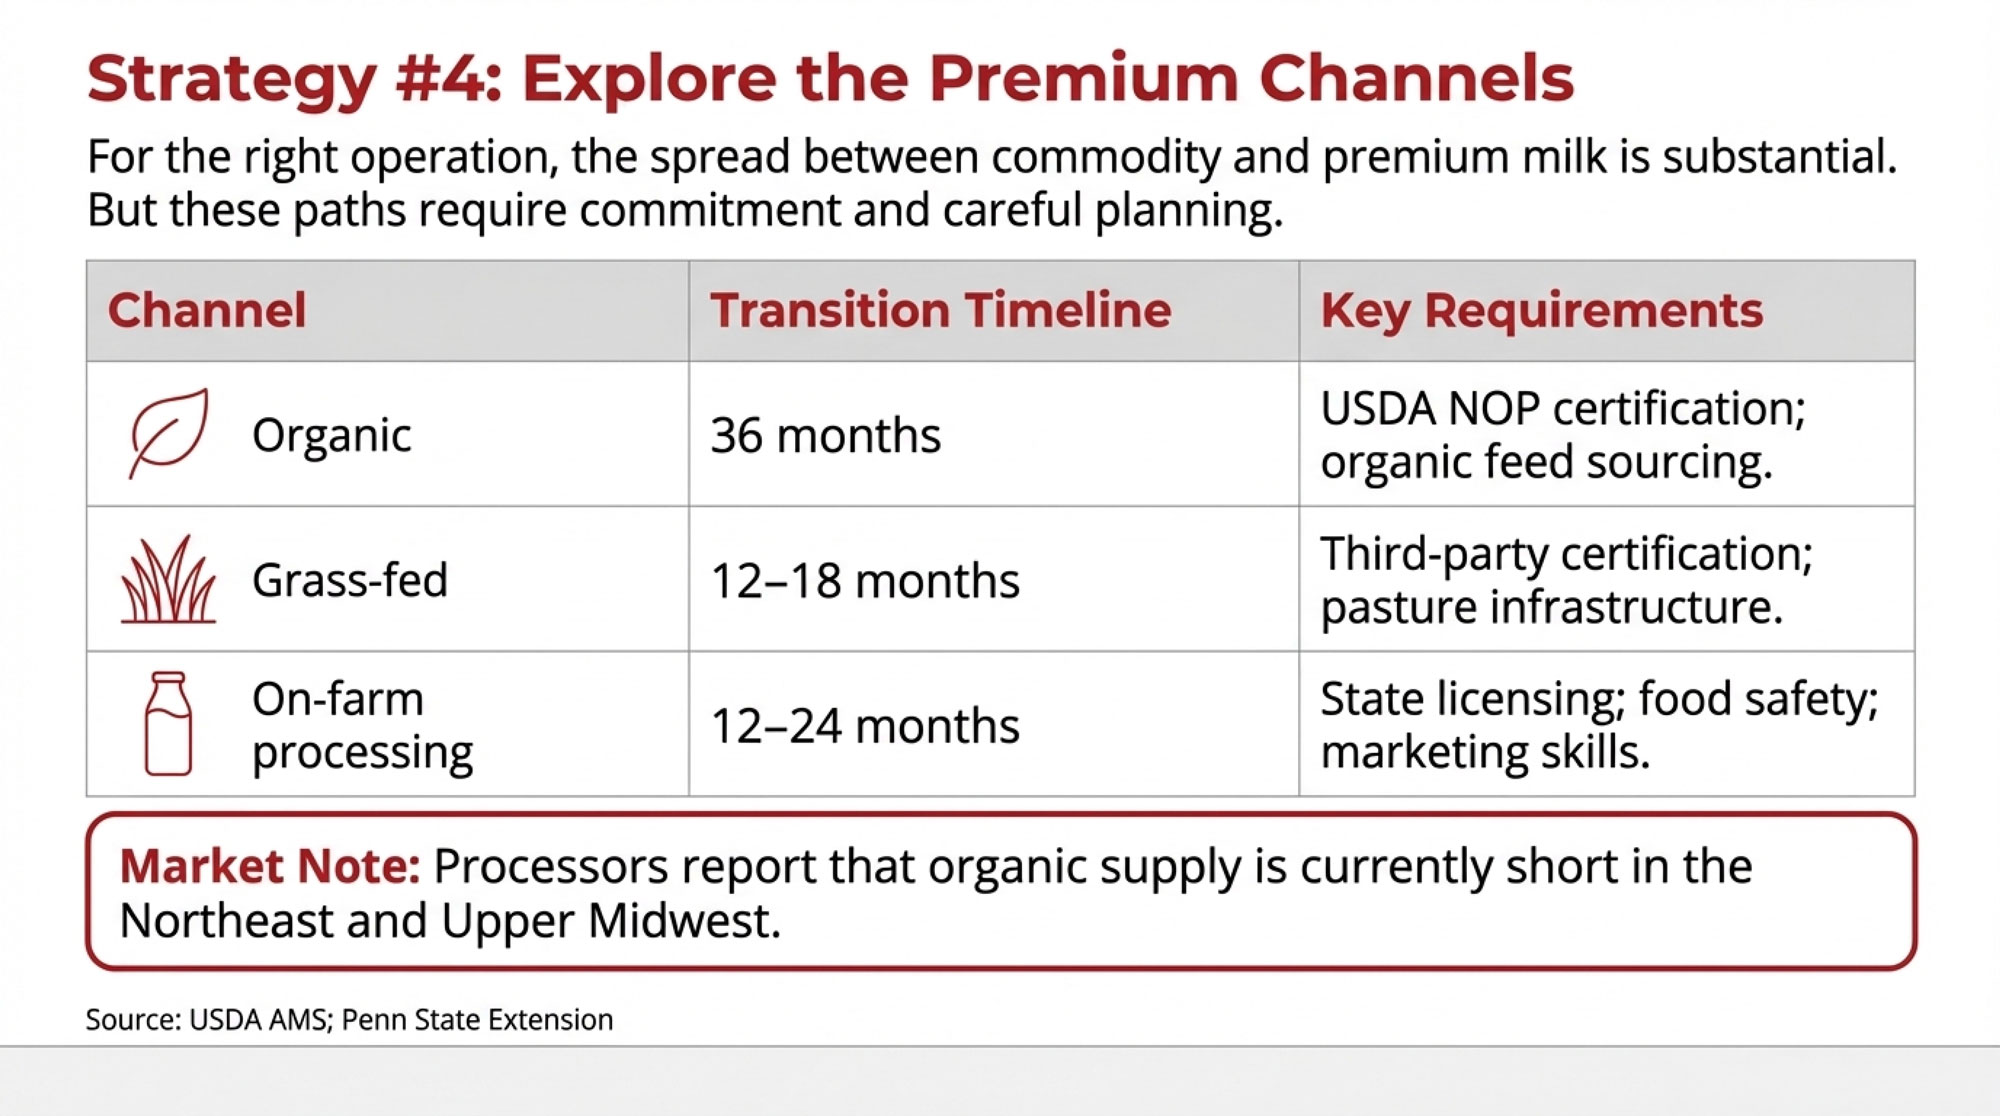
The spread between commodity milk and premium markets continues widening:
- Organic certified: $33-50/cwt depending on region and buyer (USDA National Organic Dairy Report)
- Grass-fed certified: $36-50/cwt with current supply shortages (Northeast Organic Dairy Producers Alliance)
- Value-added processing: On-farm yogurt or cheese production can generate meaningful additional margin, though capital requirements are real
I’m hearing from processors that organic supply is currently short in the Northeast and Upper Midwest—there’s genuine demand if you can make the transition work.
Premium Channel Pathways: What’s Actually Involved
| Channel | Transition Timeline | Key Requirements | Regional Considerations |
| Organic | 36 months | USDA NOP certification; organic feed sourcing; no prohibited substances | Strong processor demand in the Northeast, Upper Midwest; fewer options in the Southwest |
| Grass-fed | 12-18 months | Third-party certification (AWA, PCO, or equivalent); pasture infrastructure | Works best with existing grazing infrastructure; limited in western dry lot operations |
| On-farm processing | 12-24 months | State licensing; food safety compliance; marketing/distribution capability | Strong local food demand helps; it requires entrepreneurial capacity beyond milk production |
Sources: USDA Agricultural Marketing Service; Northeast Organic Dairy Producers Alliance; Penn State Extension
The transition timeline matters. Organic requires three years of certified organic land management before you can sell organic milk—and you’ll need reliable organic feed sourcing, which can be challenging and expensive depending on your region. Grass-fed certification moves faster but requires pasture infrastructure that not every operation has. On-farm processing offers the highest margin potential but demands skills well beyond dairy farming.
Whether these channels make sense depends on your land base, labor situation, existing infrastructure, and appetite for marketing complexity. They’re not right for every operation, but for those with the right setup, the premium differential is substantial.
What the Analysts Are Actually Saying About 2026
Let me share what the forecasts show, because realistic timeline expectations matter.
Producer conversations often reference recovery by “late 2026.” The analyst forecasts suggest a more gradual path.
2026 Price Outlook: Key Forecasts
| Source | 2026 All-Milk Forecast | Assessment |
| USDA December WASDE | $18.75/cwt | Down from $20.40 (Nov) |
| 2025 Actual | $21.35/cwt | Baseline comparison |
| Rabobank | “Prolonged soft pricing through mid-to-late 2026” | |
| StoneX | Production slowdown not until Q2-Q3 2026 |
Here’s the key difference: analysts are describing prices “bottoming out” in early to mid-2026. That means the decline stabilizes—not that prices bounce back to 2024 levels. Most forecasts suggest meaningful margin recovery is more likely a late-2027 development.
This isn’t cause for panic. Markets are cyclical, and conditions will eventually improve. But it does suggest planning for an extended timeline.
The Conversation Worth Having
For producers with potential successors, this margin environment brings important conversations into focus. University of Illinois Extension notes that less than one in five farm owners has an estate plan in place. The Canadian Bar Association found 88% of farm families lack written succession plans.
Expert Insight: David Kohl, Ph.D. Professor Emeritus, Virginia Tech
Kohl emphasizes that families starting succession talks early navigate transitions more smoothly than those who wait until circumstances force the conversation.
His framework:
- Know your actual numbers — true break-even, debt maturity, realistic equity position
- Find out what your kids actually want — not what you assume
- Lay out options honestly — status quo, restructuring, strategic exit, or succession
You’re not solving everything in one meeting. You’re getting information on the table.
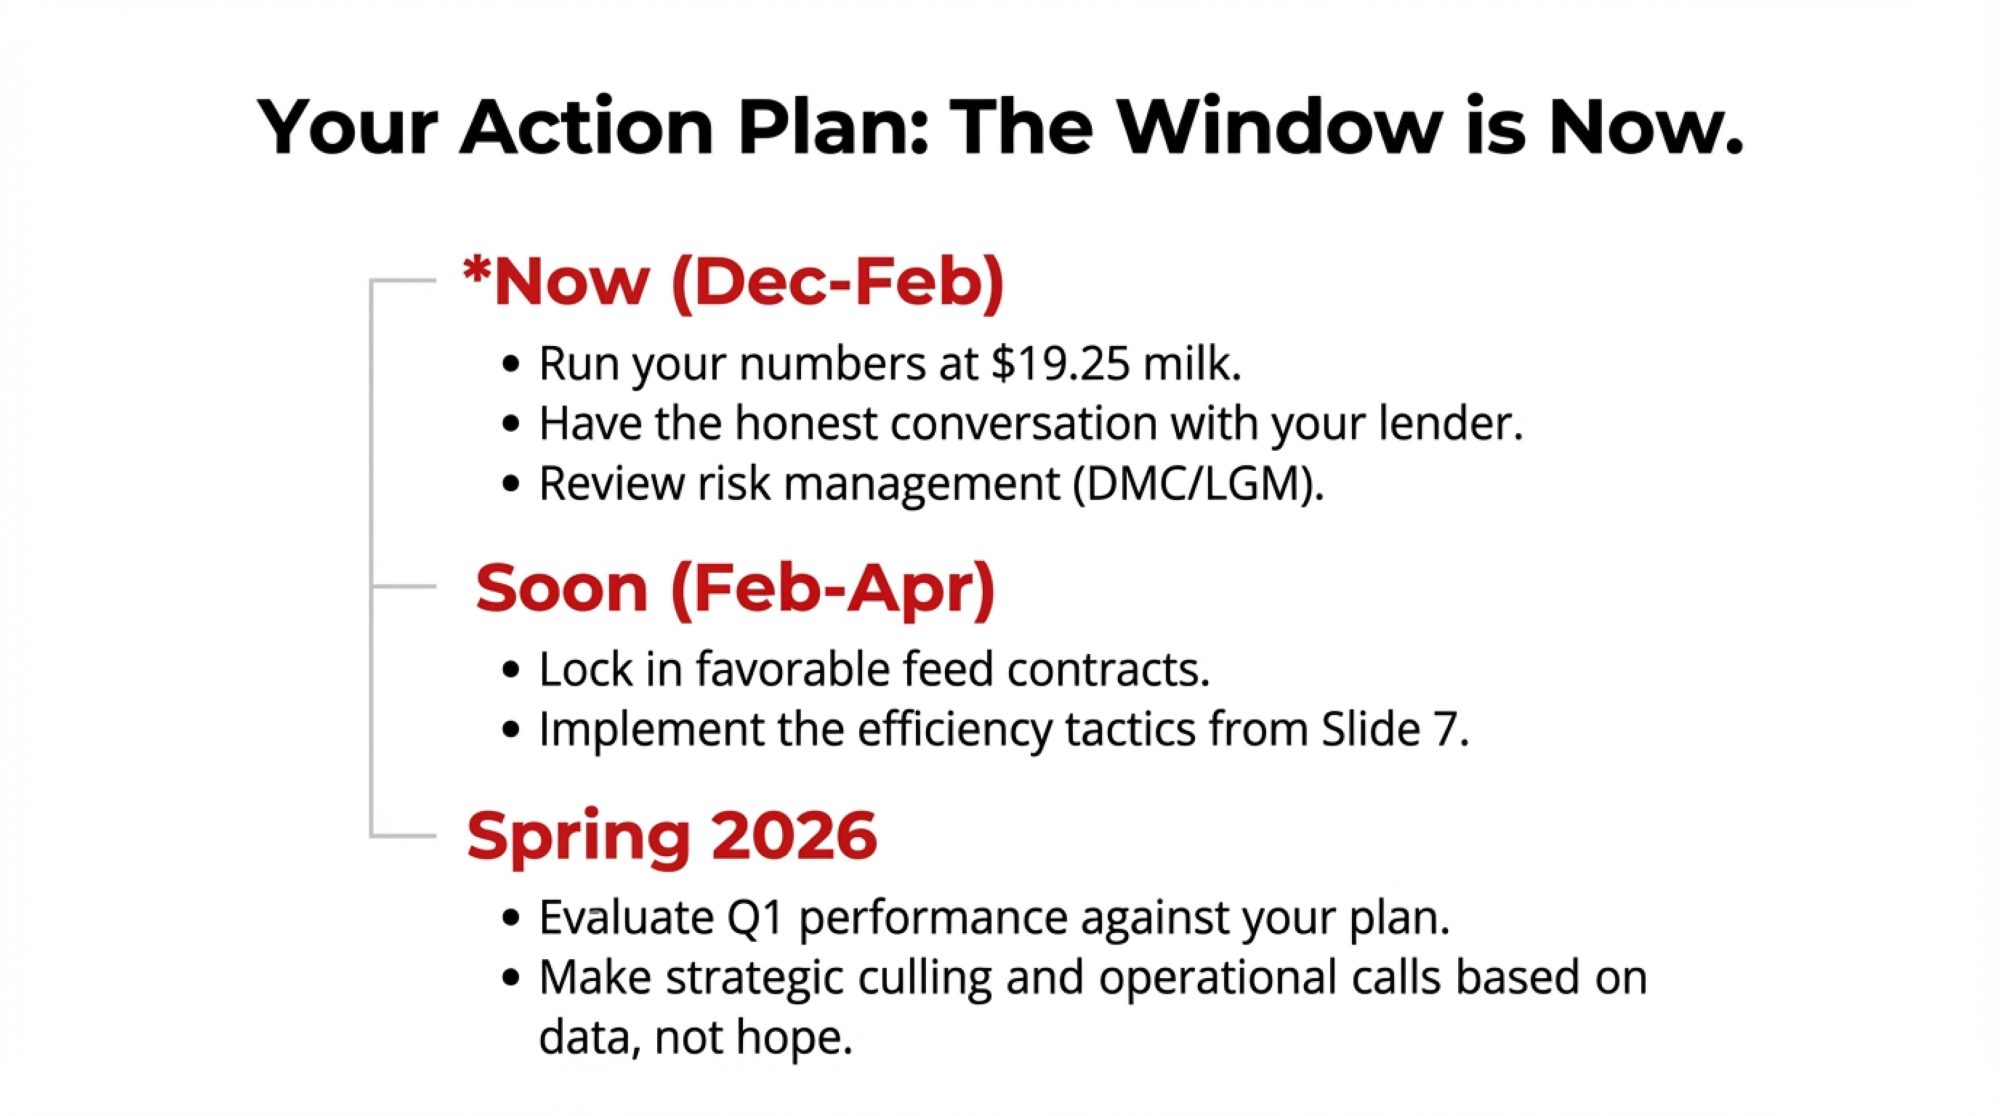
The Bottom Line
“I’m not pretending the math is good right now. But I’ve stopped waiting for someone else to fix it. We enrolled in DMC at the $9.50 level, we’re breeding 60% of our herd to Angus, and we had that kitchen table conversation with our son over Thanksgiving. First real talk about whether he wants this place.”
He paused. “I’d rather know where we stand than keep guessing. At least now we’re making decisions instead of just hoping.” — Mike Boesch
That’s really the choice in front of all of us right now. The margin environment is challenging—that’s just the reality for the foreseeable future. But producers who understand the dynamics, assess their positions honestly, and implement available strategies aren’t just getting through this period; they’re succeeding. Some are building advantages that will serve them well when conditions improve.
The math is difficult. It’s not impossible. The difference comes down to whether you’re making decisions based on information or just waiting to see what happens.
Key Takeaways
- The $4/cwt gap is real—and it’s not your math. Make allowances, regional spreads, and formula changes explain why your milk check doesn’t match your margins.
- $337 million left producer pockets in 90 days. June’s make allowance increases pulled that from the pool values before summer ended.
- Plan for a long haul. USDA projects $18.75/cwt for 2026—a meaningful margin recovery likely won’t show up until late 2027.
- Don’t count on production cuts to save prices. Expansion debt keeps cows milking, and the lowest heifer inventory since 1978 limits strategic culling.
- The wins are in the details. Component premiums, smart beef sire selection, and actually enrolling in DMC at $9.50—that’s where producers are finding margin.
Complete references and supporting documentation are available upon request by contacting the editorial team at editor@thebullvine.com.
Learn More:
- The Beef-on-Dairy Wake-Up Call: What Some Farms Are Still Missing – Provides a tactical roadmap for using genomic testing to identify high-value beef-cross candidates while avoiding the “purity trap,” helping producers turn a potential liability into a six-figure revenue stream.
- The 90-Day Dairy Pivot: Converting Beef Windfalls into Next Year’s Survival – Explores the strategic math behind hitting a $1.25/cwt component bonus and leveraging record-high cattle prices to navigate market volatility and secure the liquidity needed to survive a low-margin cycle.
- Unlock Hidden Dairy Profits Through Lifetime Efficiency: How Modern Genetics and Strategic Nutrition Can Cut Feed Costs by $251 Per Cow – Reveals how precision breeding for Residual Feed Intake (RFI) can slash feed expenses by $251 per cow annually, offering a data-driven path to offset the structural margin gaps in today’s economy.
 Join the Revolution!
 Join the Revolution!
Join over 30,000 successful dairy professionals who rely on Bullvine Weekly for their competitive edge. Delivered directly to your inbox each week, our exclusive industry insights help you make smarter decisions while saving precious hours every week. Never miss critical updates on milk production trends, breakthrough technologies, and profit-boosting strategies that top producers are already implementing. Subscribe now to transform your dairy operation’s efficiency and profitability—your future success is just one click away.