


50K vanished from WI 300-cow dairy’s Jan check. Von Ruden blames FMMO make allowances. Yours?
Executive Summary: In January 2026, a 300-cow Wisconsin dairy watched $50,000 vanish despite shipping the same milk to the same plant under the same management. This massive revenue hemorrhage is the direct result of the FMMO’s new “make-allowance” deductions—a structural 90¢/cwt tax that processors now skim off the top before you see a dime. While the industry touts federal “safety nets,” the cold math reveals a brutal 23-to-1 gap where DMC pennies cannot stop formula-driven dollar losses. This is not a market anomaly; it is a fundamental wealth transfer from the barn to the plant that your own co-op likely bloc-voted into existence. To survive, producers must audit their statements, isolate their specific “hidden drag,” and demand immediate accountability from leadership before their equity evaporates. Your January check wasn’t just a disappointment—it was a warning shot for an 18-month fight for survival.
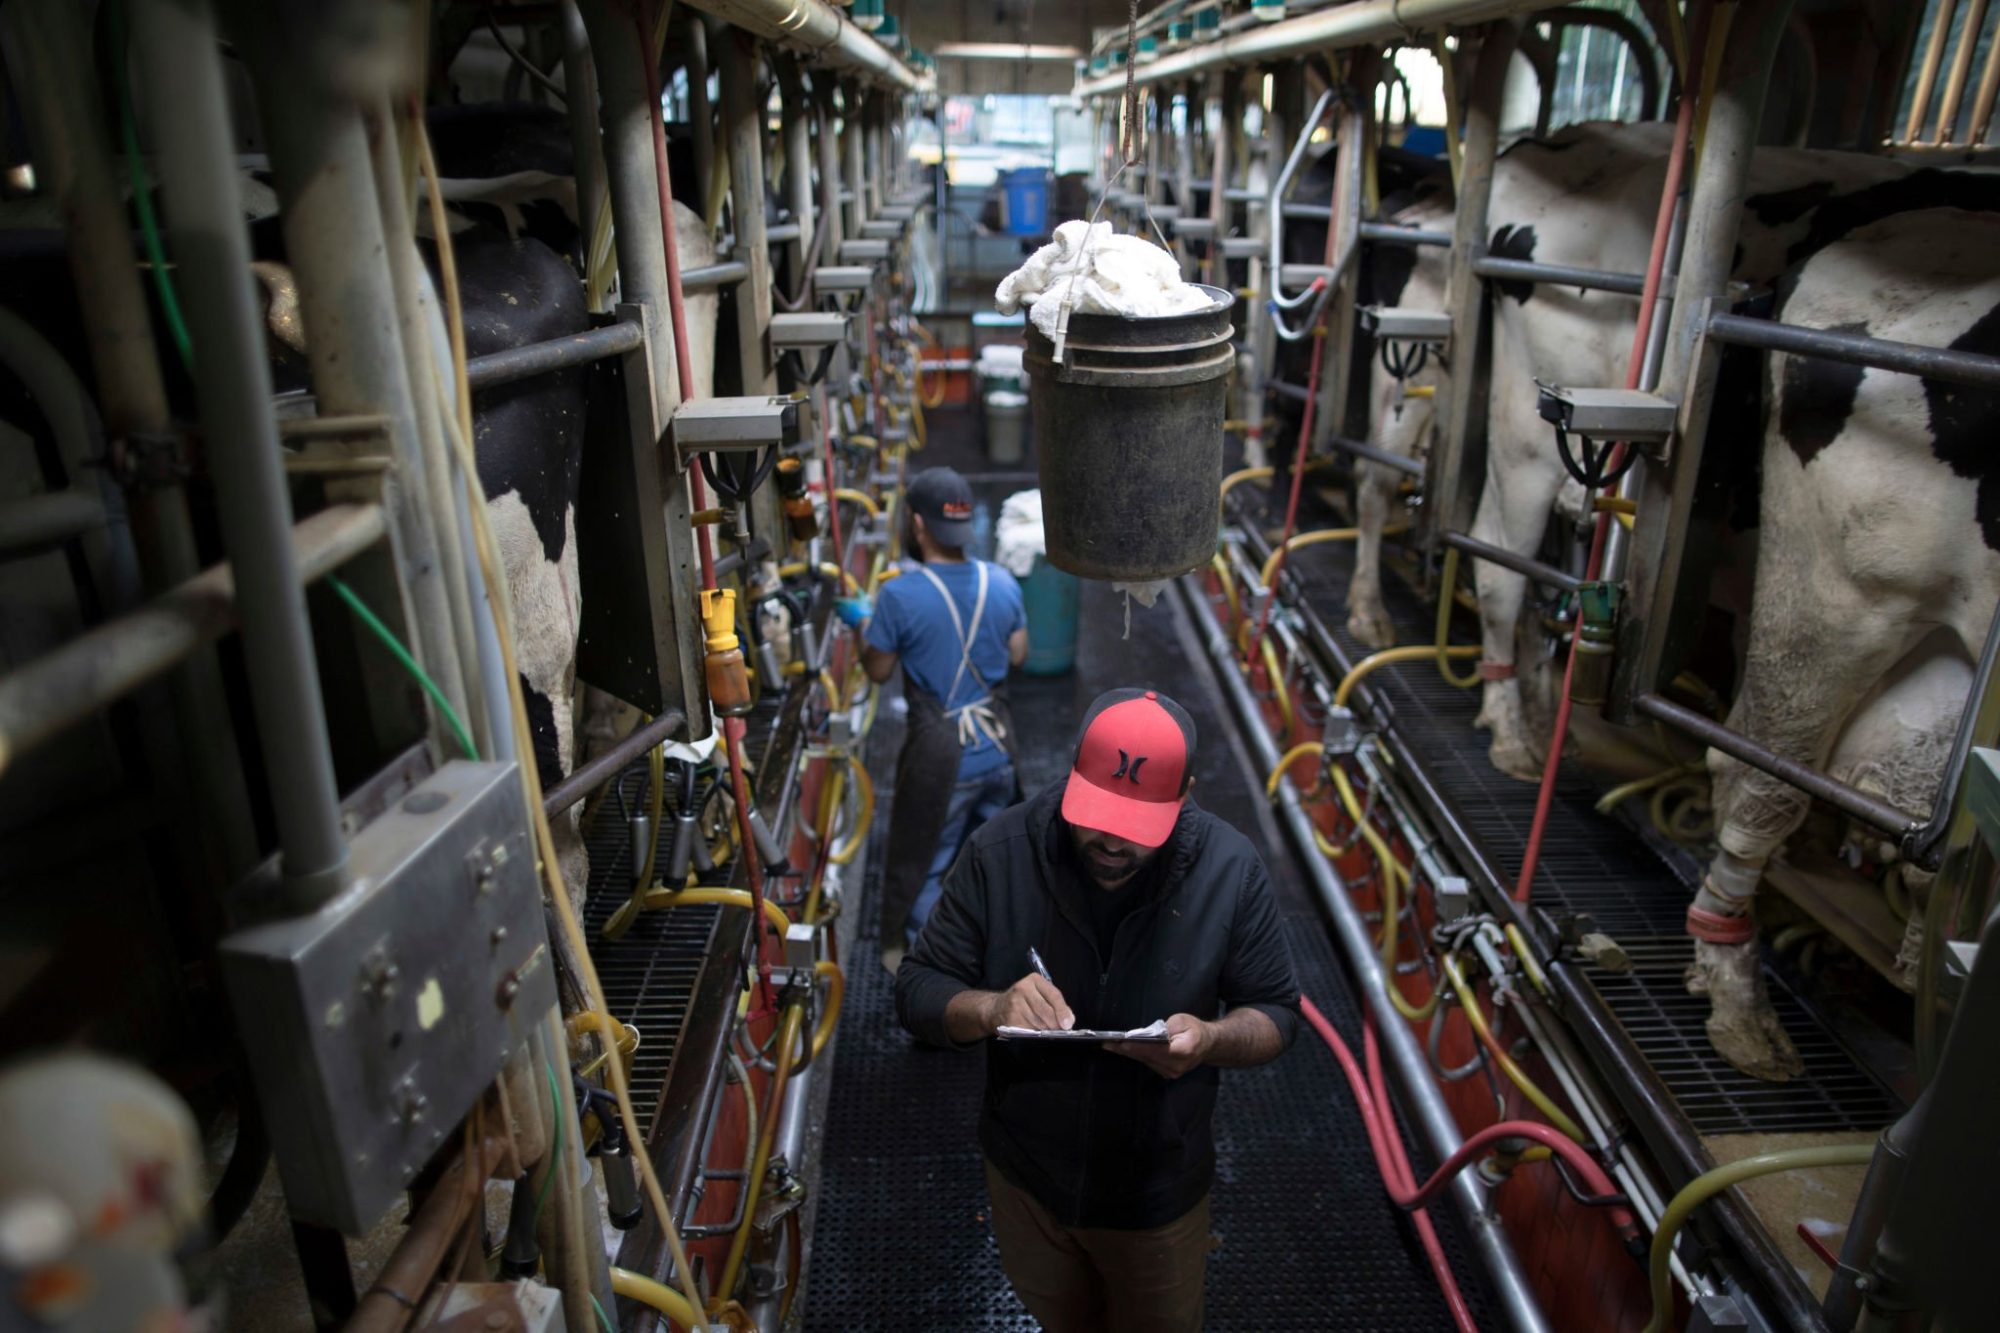
At the National Farmers Union’s 124th annual convention this March, Wisconsin Farmers Union president Darin Van Ruden stood up in a delegate session and dropped a number that stuck: about $50,000. That’s how much less a 300‑cow dairy operator in southwest Wisconsin received on his January 2026 milk check compared with January 2025, according to Van Ruden.
He told Brownfield Ag News this wasn’t a model herd or a spreadsheet example. It was a neighbor he’d spoken with the week before — 300 cows, southwest Wisconsin, same plant, same truck, roughly $50,000 gone in one month. The cows didn’t change. The formulas did.
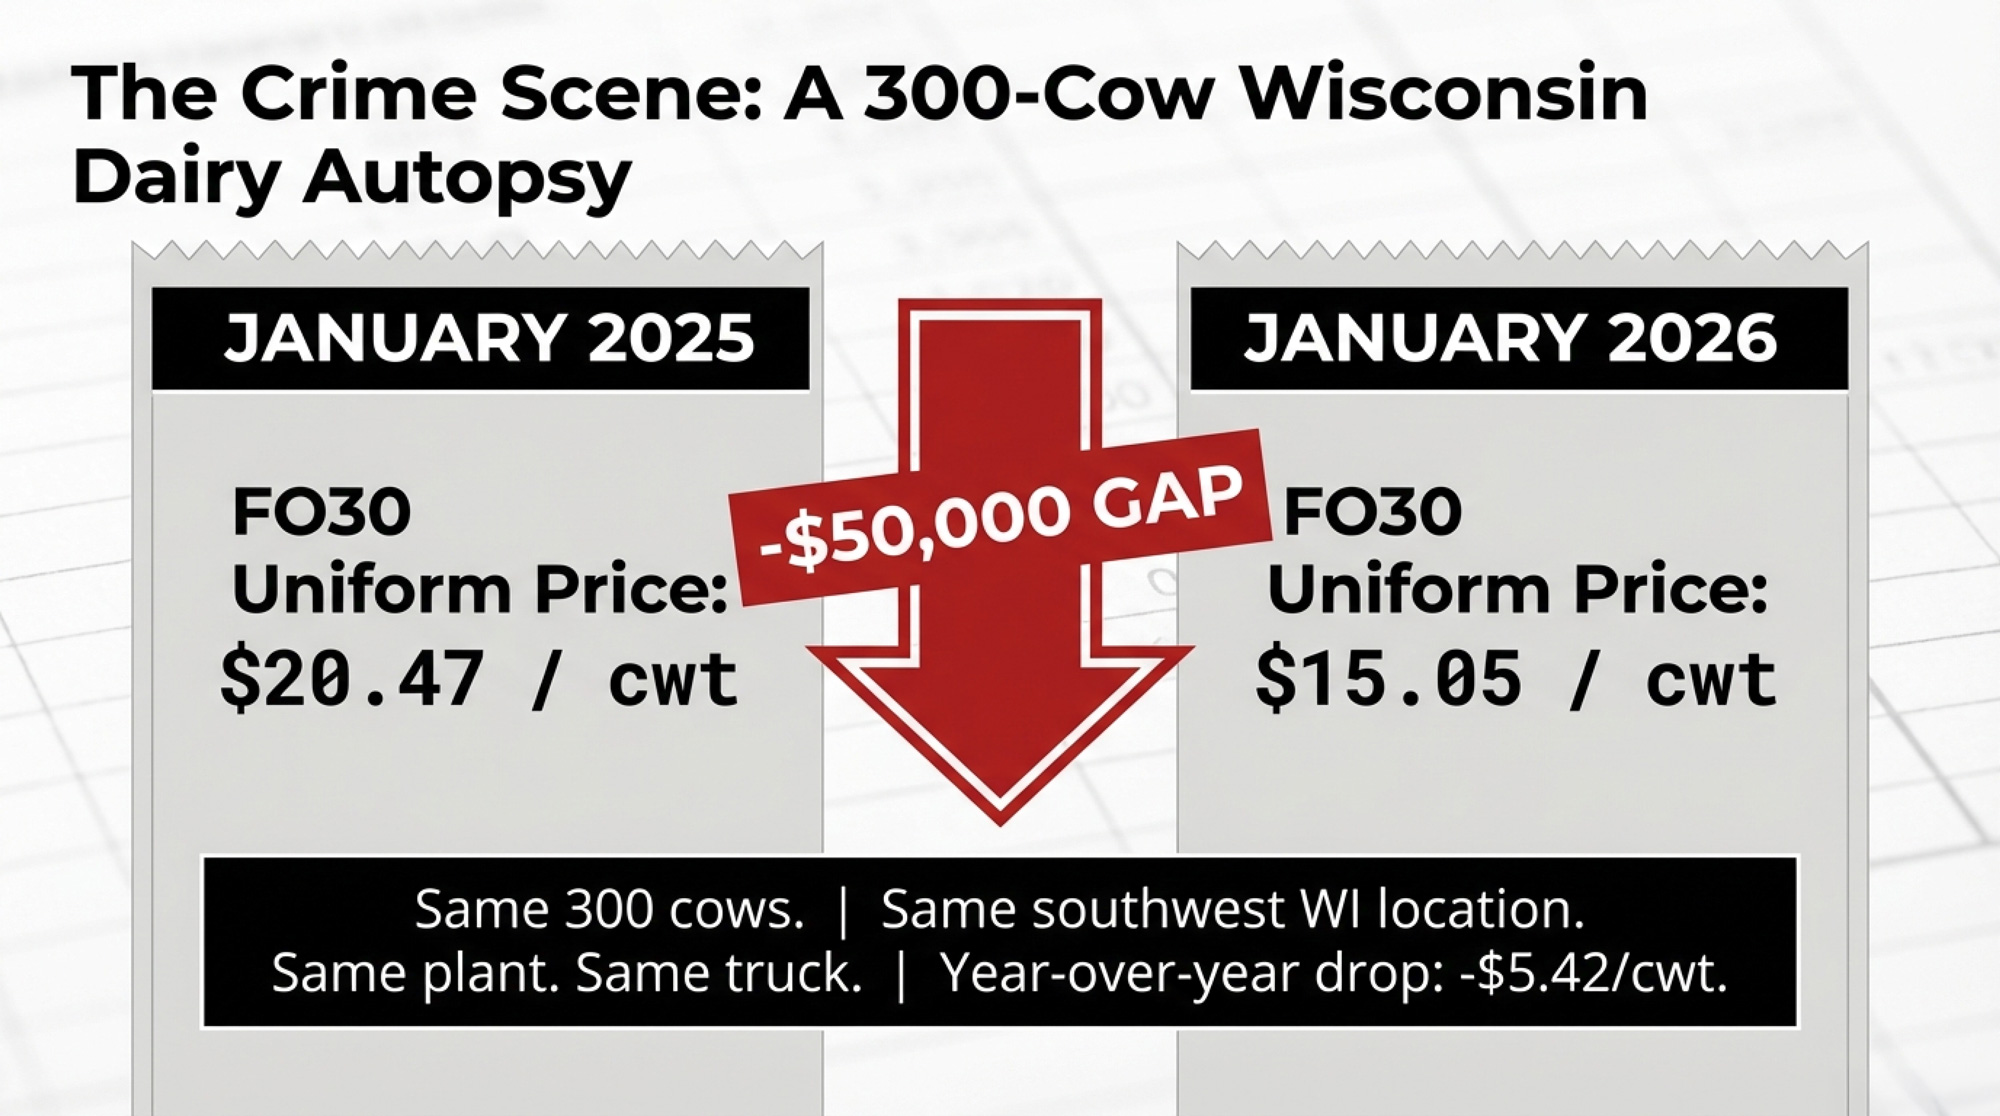
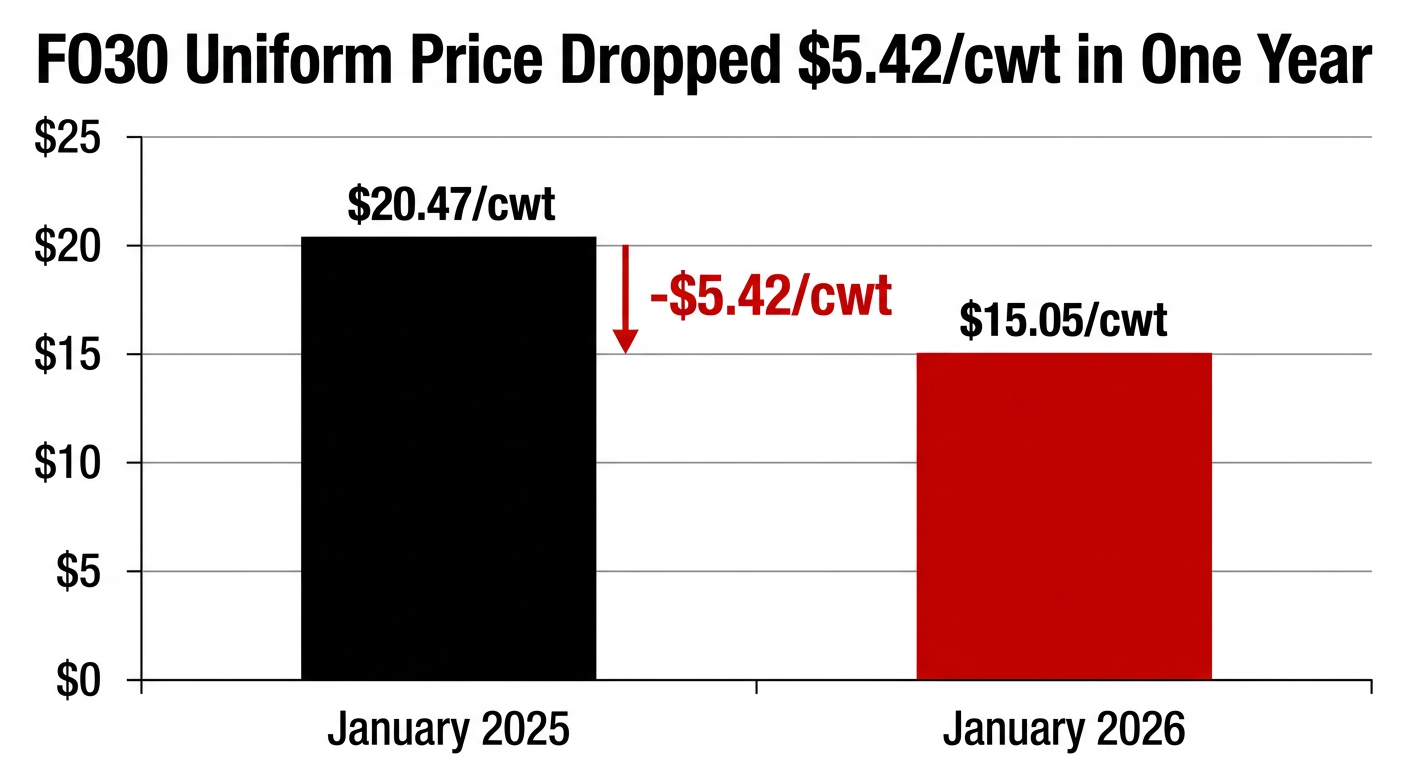
From $20.47 to $15.05: What Changed in a Year
Before you argue about anyone’s $50,000, look at the numbers every FO30 producer faced.
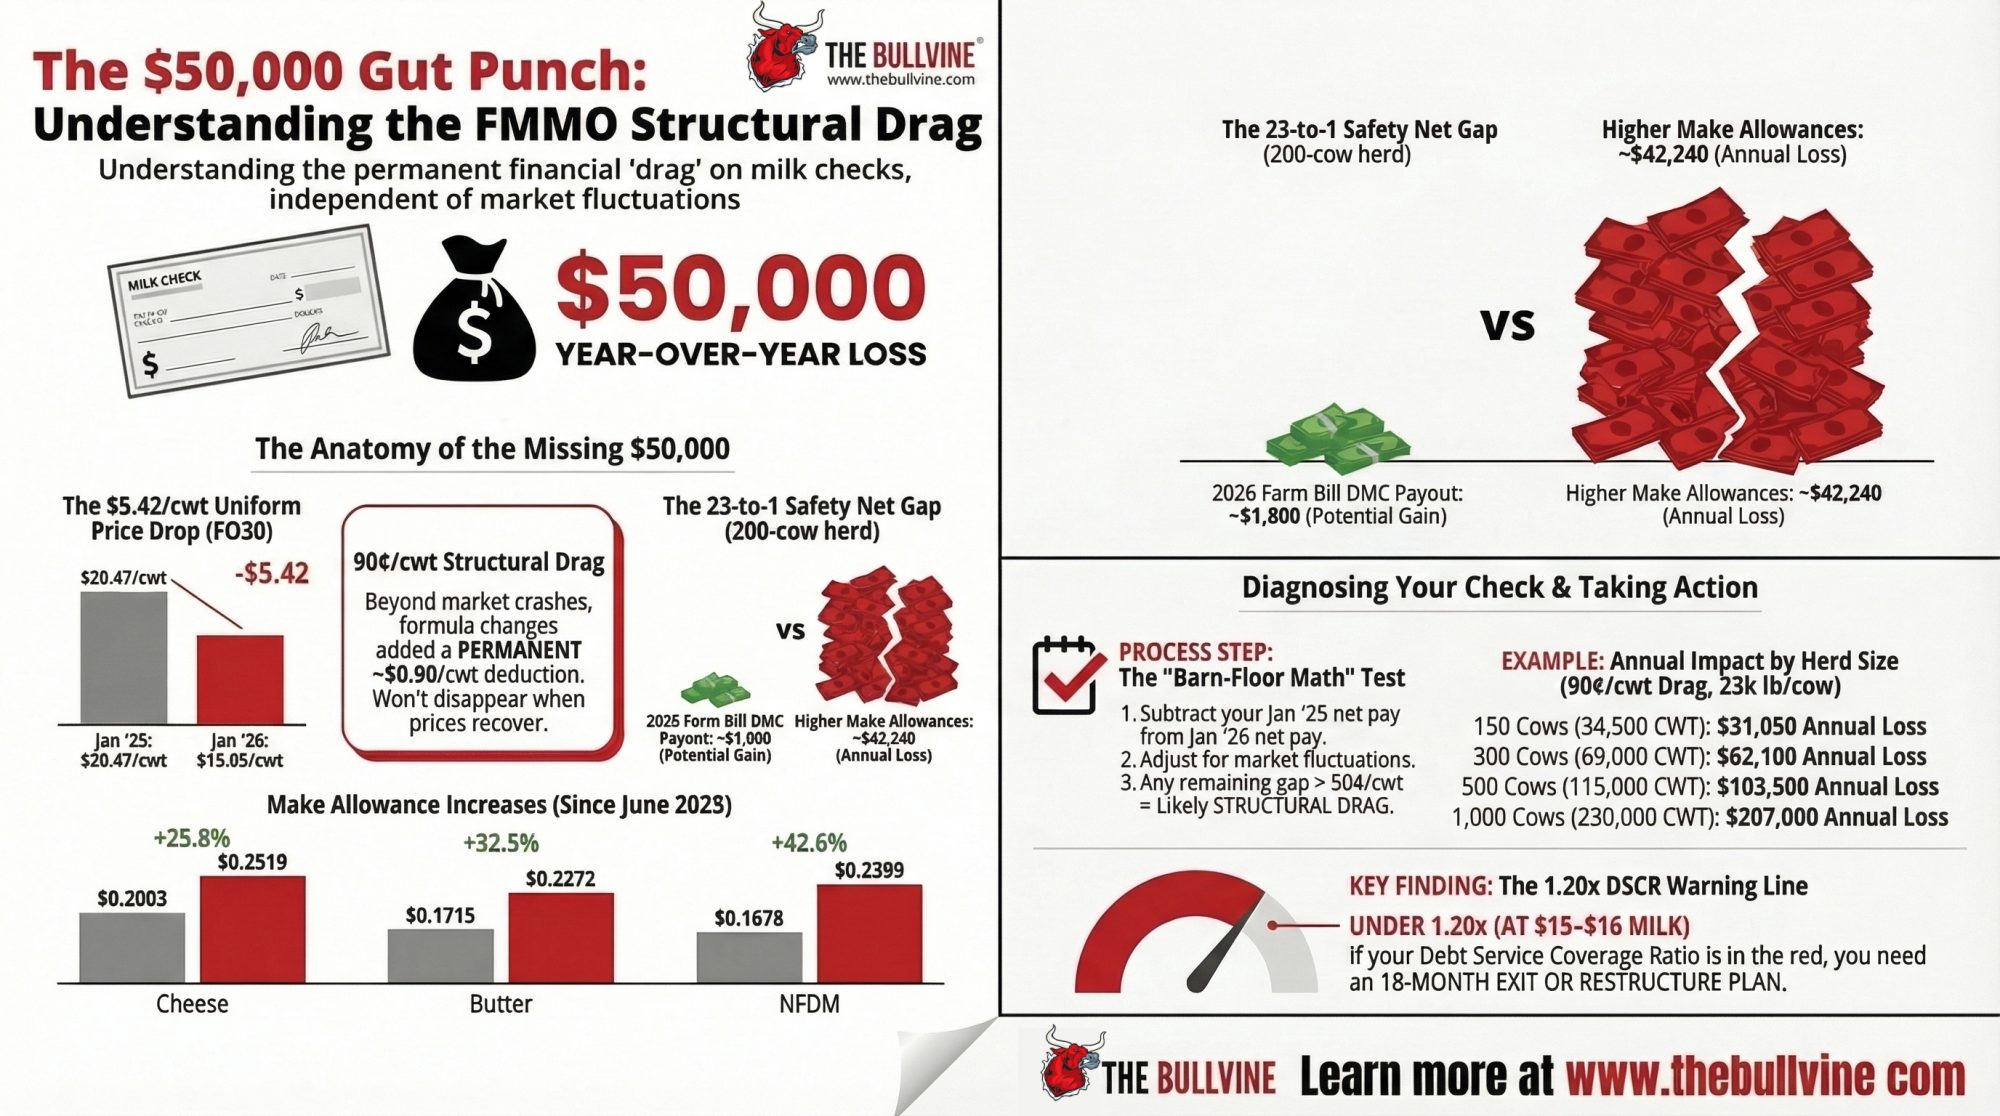
The Upper Midwest FMMO (Order 30) statistical uniform price for January 2025 was $20.47/cwt. In January 2026, it was $15.05/cwt — a year‑over‑year drop of $5.42/cwt. That’s the base reality under every milk check in the order.
Commodity prices did plenty of damage. CME butter’s monthly average price slid from $2.6042/lb in January 2025 to $1.4266/lb in January 2026, down about $1.18/lb — roughly a 45% crash. Cheddar blocks dropped from $1.8954/lb to $1.4003/lb, a 26% hit. FO30’s January Class III price followed that slide, falling from $20.34/cwt in 2025 to $14.59/cwt in 2026 — off $5.75.
| Product | Jan 2025 Price | Jan 2026 Price | Change |
| CME Butter | $2.6042/lb | $1.4266/lb | –$1.18/lb (–45%) |
| Cheddar Blocks | $1.8954/lb | $1.4003/lb | –$0.50/lb (–26%) |
| FO30 Class III | $20.34/cwt | $14.59/cwt | –$5.75/cwt (–28%) |
| FO30 Class I Util | 7.7% | 7.7% | No blend cushion |
And FO30 is built to feel that pain harder than most. Class I made up just 7.7% of pooled producer milk in the order in 2025 — the lowest share of any federal order. Almost everything else is Class III and IV. When cheese and butter break, there isn’t much Class I volume to pull the blend up.
Handlers behaved exactly how you’d expect in that setup. In January 2026, FO30’s producer price differential was $0.46/cwt, and an estimated 2.6 billion pounds of eligible milk weren’t pooled — more than the 1.4 billion that stayed in the pool. When more milk sits outside the pool than inside it, you don’t have a healthy pricing system. You have a blender that’s barely plugged in.
Where the Missing 90¢/cwt Really Went
That $5.42/cwt drop in FO30’s uniform price is not all structure. A big chunk is just a miserable butter and cheese month. But there’s a permanent piece baked into your check now, and that’s the make‑allowance jump.
Make allowances are the manufacturing‑cost numbers USDA subtracts from surveyed cheese, butter, powder, and whey prices in the FMMO formulas. When those numbers go up, class prices go down by the same amount. USDA’s modernization package raised the allowances effective June 1, 2025:
| Product | Old make allowance | New make allowance | Change |
| Cheese | $0.2003/lb | $0.2519/lb | +5.16¢ (25.8%) |
| Butter | $0.1715/lb | $0.2272/lb | +5.57¢ (32.5%) |
| NFDM | $0.1678/lb | $0.2393/lb | +7.15¢ (42.6%) |
| Dry whey | $0.1991/lb | $0.2668/lb | +6.77¢ (34.0%) |
American Farm Bureau Federation economist Danny Munch ran those new allowances through 2020–2023 markets. His Market Intel analysis found that higher make allowances alone would have lowered average FMMO class prices by about $0.92/cwt for Class III, $0.85/cwt for Class IV, $0.89/cwt for Class I, and $0.85/cwt for Class II. That’s not worst‑case. That’s the average.
AFBF then looked at what that would have done to pool values. Over just three months — June through August — higher make allowances stripped about $337 million out of producer pools nationally, including roughly $64 millionfrom the Upper Midwest, $62 million from the Northeast, and $55 million from California. That’s money that would’ve been in milk checks under the old formulas.
Yes, USDA did throw some offsets into the same package. The final rule restores the “higher‑of” Class I mover, revises Class I differentials, and updates composition factors so higher‑solid milk gets recognized at 3.3% protein and 9.3 lb SNF instead of the old 3.1/8.7. But timing matters. Make allowances went up on June 1, 2025. The composition factor change didn’t kick in until December 1, 2025. For six months, producers received the full cost increase with no solid‑adjustment relief.
If you want the deeper class‑by‑class walk‑through, The Bullvine’s own FMMO Reset analysis uses AFBF’s numbers to show how that roughly 90¢/cwt drag plays out across orders and herd sizes. The short version: there’s now a structural discount sitting in your class prices that won’t disappear just because butter has a good month.
How Much Did the FMMO Rewrite Actually Cost Your January Milk Check?
Now let’s get close to home.
Take the herd Van Ruden talked about: 300 cows in southwest Wisconsin. If that operation is shipping about 85 lb/cow/day in January, that’s roughly 7,905 cwt in 31 days.
FO30’s statistical uniform price dropped $5.42/cwt from January 2025 to January 2026. The straight arithmetic on that herd looks like this:
- 7,905 cwt × $5.42/cwt = $42,845 less on the check, just from the change in the uniform price at test.
But FO30’s “at test” milk isn’t 3.5% butterfat. In January 2026, pooled butterfat averaged 4.52%, with protein at 3.42%. At the same time, the butterfat component price fell from $2.9487/lb in January 2025 to $1.4525/lb in January 2026 — a collapse of $1.4962/lb. That hits all the butterfat you’ve bred and fed for above 3.5%.
Layer in premium changes. Plants facing lower class prices and higher make allowances have every reason to trim or restructure volume incentives, quality bonuses, and over‑order payments. You don’t see those cuts in a USDA bulletin. You see them when your “other credits” line shrinks.
When you add the FO30 uniform‑price drop, the butterfat collapse on high‑component milk, and likely premium erosion, you’re suddenly right in the neighborhood of Van Ruden’s $50,000 example for a 300‑cow herd. The exact number belongs to that family. The order‑level math says the story is believable.
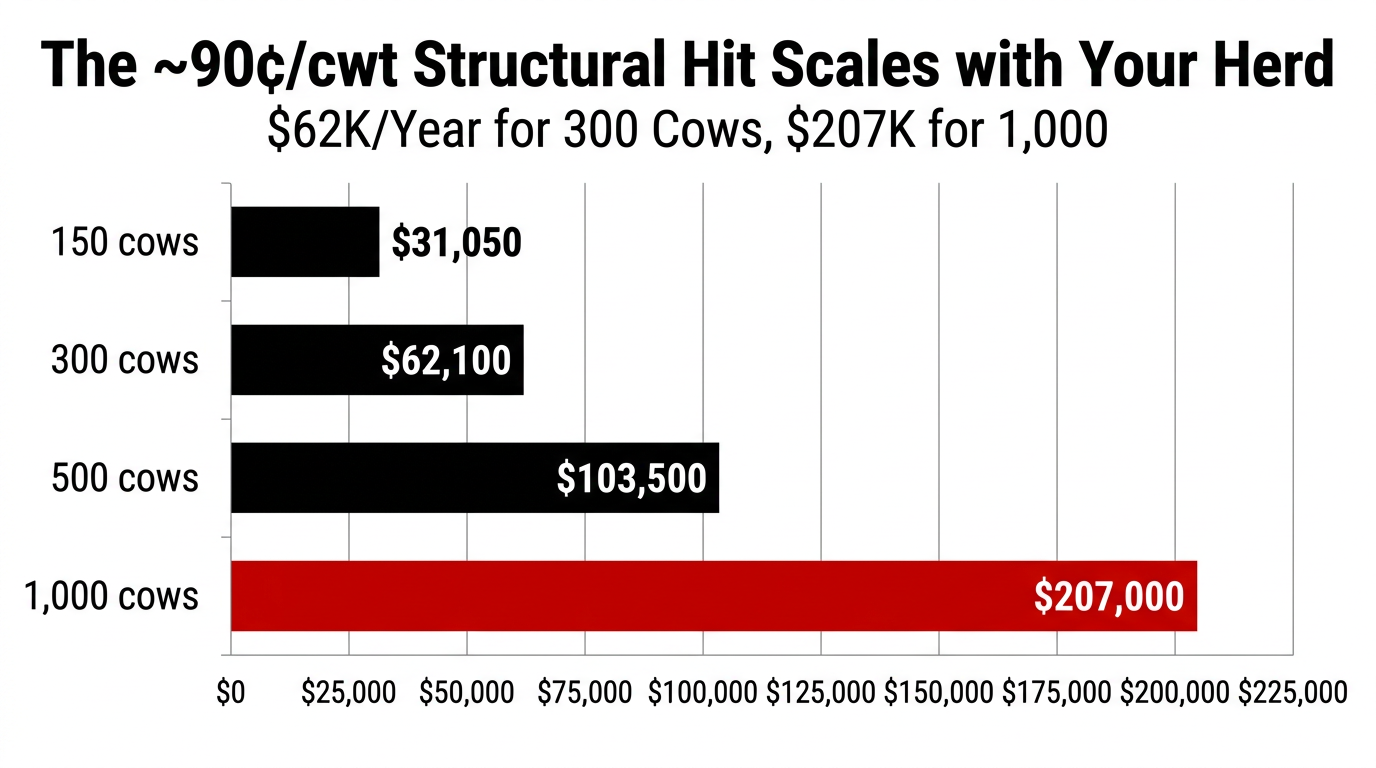
Now pull out the structural part. AFBF’s modeling suggests that higher make allowances alone cut FMMO class prices by roughly 90¢/cwt. Here’s what that looks like across herd sizes at 23,000 lb/cow annual production:
| Herd size | Annual cwt | 90¢/cwt drag/year | Monthly drag |
| 150 cows | 34,500 | $31,050 | $2,588 |
| 300 cows | 69,000 | $62,100 | $5,175 |
| 500 cows | 115,000 | $103,500 | $8,625 |
| 1,000 cows | 230,000 | $207,000 | $17,250 |
That’s what “structural” means. Those dollars disappear off the table every year until formulas, cost surveys, or utilization change. Markets might add to or subtract from that. The drag itself stays.
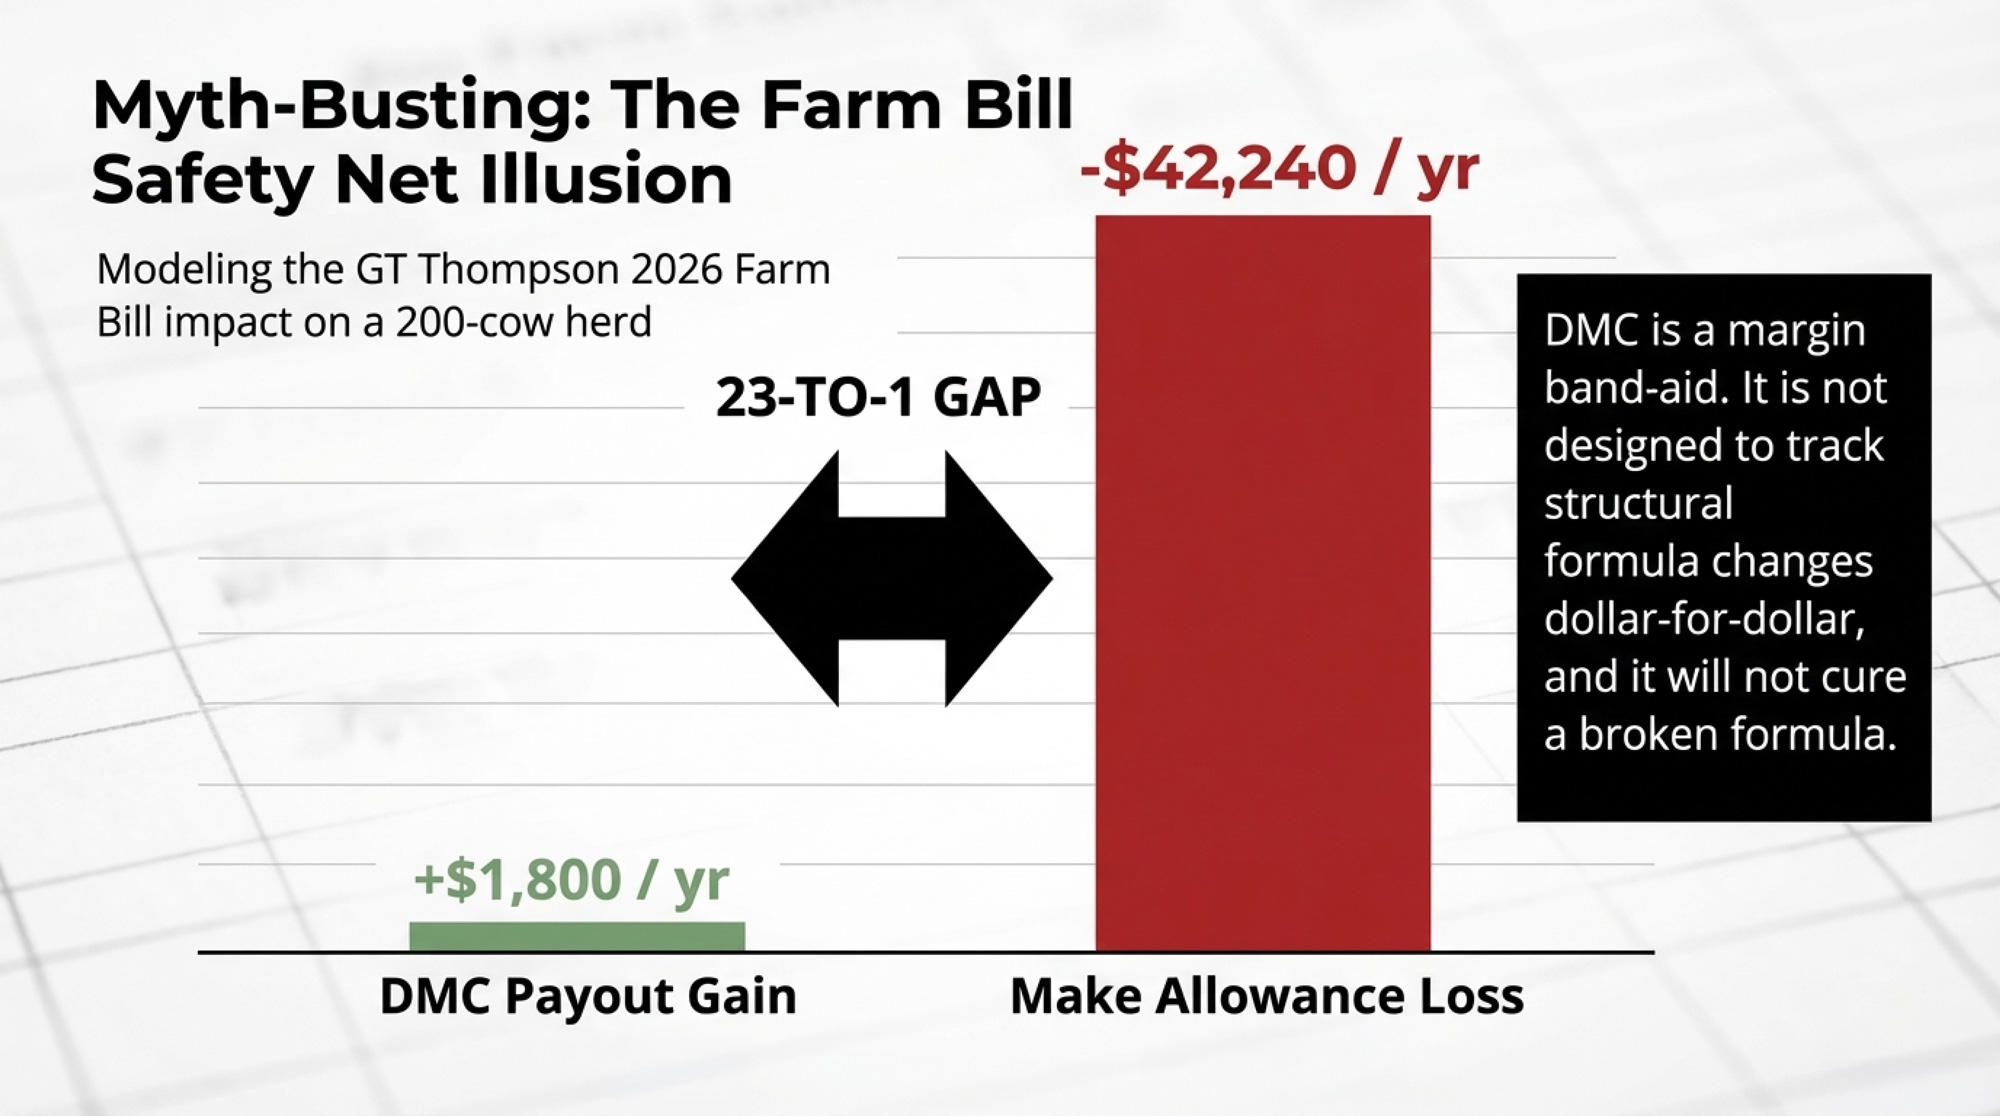
And when you park that drag next to the Farm Bill safety net? The Bullvine’s GT Thompson 2026 Farm Bill pieceshows a 200‑cow herd gaining roughly $1,800/year in improved DMC payouts while losing about $42,240/year from higher make allowances. That’s a 23‑to‑1 gap. For every dollar DMC gives back, the formula takes twenty‑three.
How Much Did the Formula Change Actually Cost Your January Check?
Now it’s your turn.
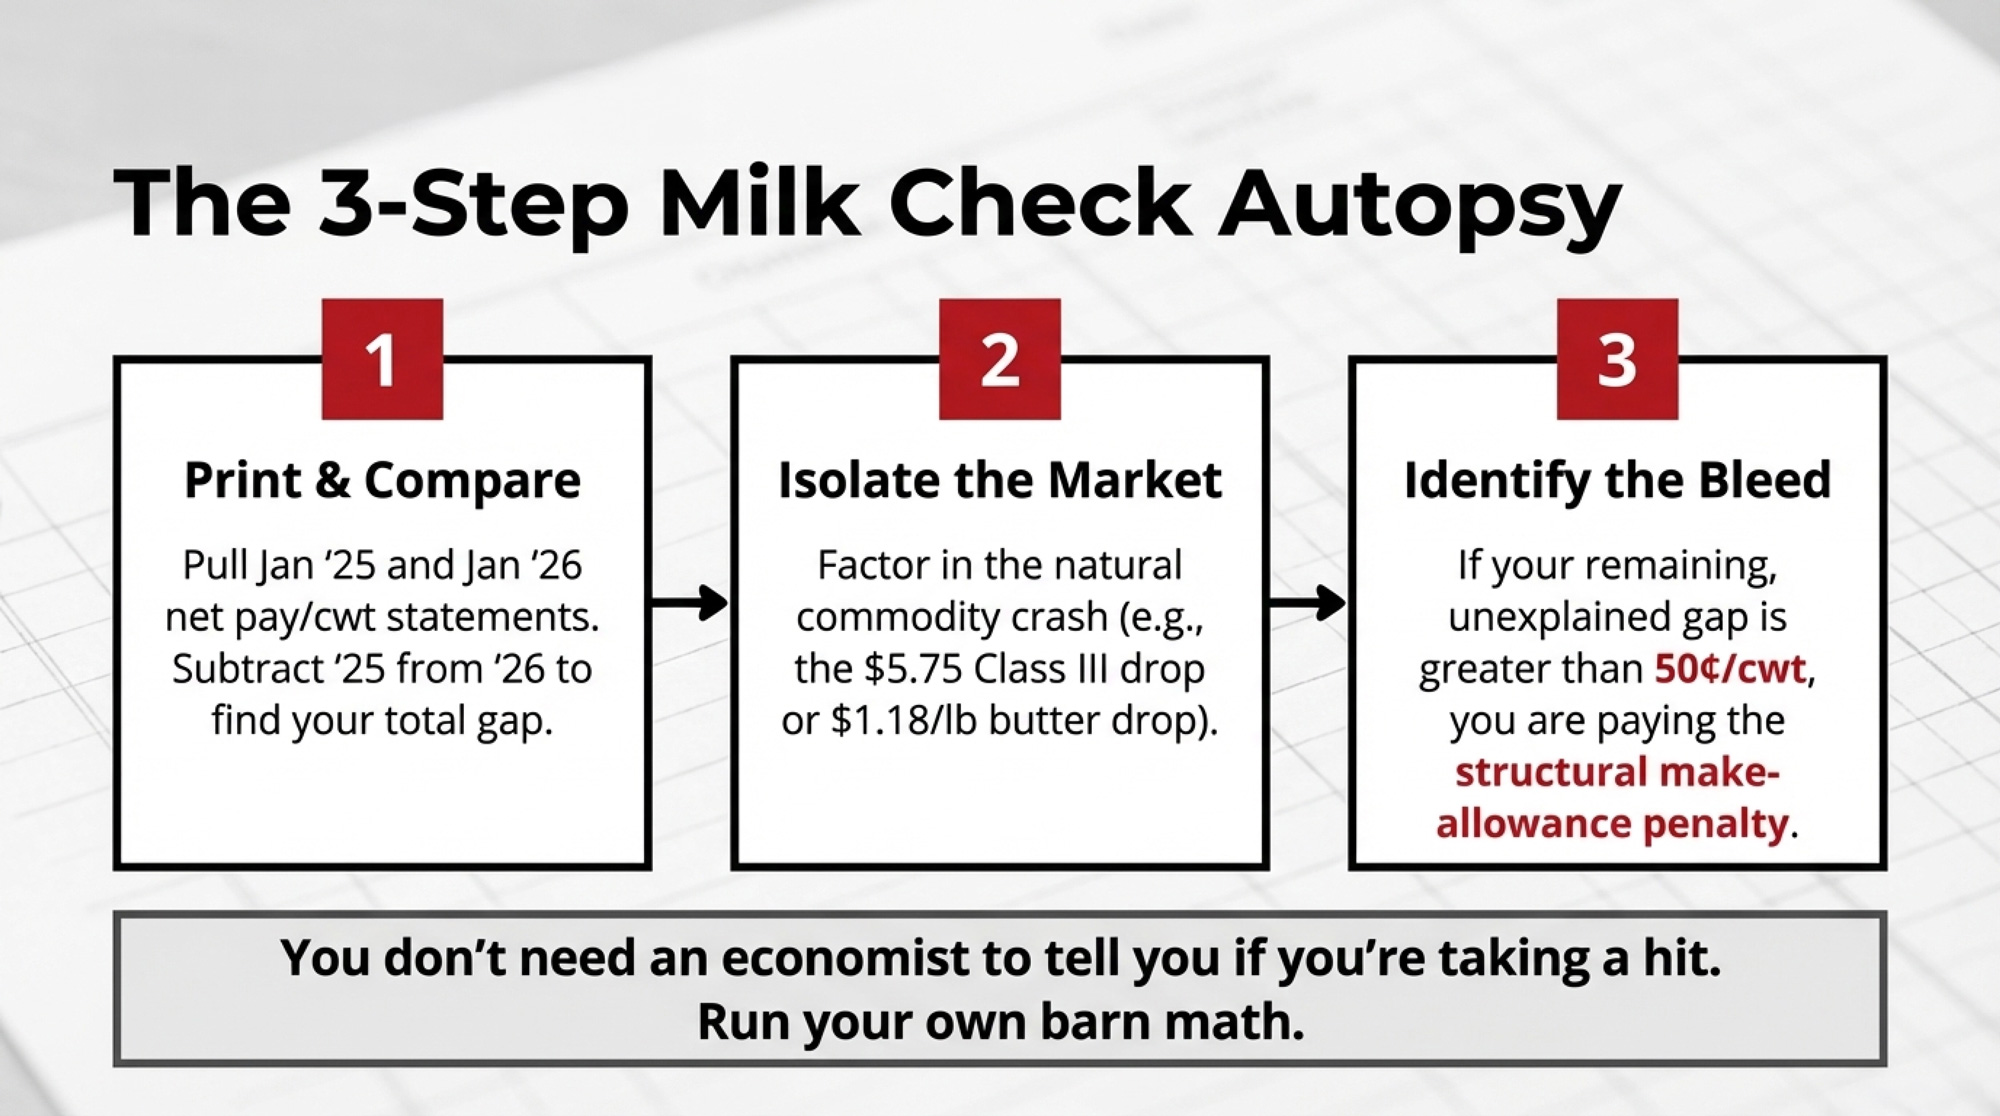
Step 1: Put a real number on your January‑over‑January price.
- Grab your January 2025 milk statement. Take net pay (after hauling, dues, and fees) and divide by total cwt shipped. Write that number down.
- Do the same for January 2026.
- Subtract 2025’s $/cwt from 2026’s $/cwt. That difference is your real‑world January drag.
Step 2: Separate what the market did from what the formula did.
Look at the same FO30 numbers Van Ruden’s neighbor faced:
- Class III price: $20.34/cwt → $14.59/cwt (down $5.75).
- Statistical uniform price: $20.47/cwt → $15.05/cwt (down $5.42).
- Butter: about $2.60/lb → $1.43/lb (down roughly $1.18/lb).
If your $/cwt drop is roughly in line with those moves, most of your pain is “just” the butter and cheese crash. Whatever you can’t explain with those class‑price and butter moves is where the structural make‑allowance hit and co‑op decisions are hiding.
Step 3: Put a number on the “hidden” part.
- If your unexplained gap sits under 30–40¢/cwt, your buyer might already be buffering some of the structural drag with premiums or patronage.
- If it’s over about 50¢/cwt, especially in Class III‑heavy orders like the Upper Midwest and Central, you’re almost certainly feeling that ~90¢/cwt structural penalty from higher make allowances plus whatever your plant adjusted in premiums.
You don’t need an economist to tell you if Van Ruden’s neighbor is alone. That three‑step math will answer the question for your own barn.
| Step | Calculation | Your Number |
| 1 | Jan 2026 net $/cwt – Jan 2025 net $/cwt | $ ______ |
| 2 | FO30 uniform price drop (baseline: –$5.42/cwt) | –$5.42/cwt |
| 3 | Butterfat price collapse (–$1.50/lb on 4.52% avg) | ~$ ______ /cwt |
| 4 | Unexplained gap (Step 1 minus Steps 2 + 3) | $ ______ |
| 5 | If unexplained gap > 50¢/cwt: Structural drag + premium cuts likely |
Can You Recapture 90¢/cwt Through Components, or Is This a Permanent Loss?
A lot of advisors will tell you the path is simple: “Just make it up on components.”
There’s truth in that — up to a point. FO30 herds have pushed components hard. Pooled butterfat averaged 4.52% and protein 3.42% in January 2026. The December 2025 composition factor change in the final rule now prices “standard” milk at 3.3% protein and 9.3 lb SNF, up from 3.1/8.7, so you finally get some formula credit for the progress you’ve already bred and fed.
If you’re behind that bar, there’s money on the table. Picking up 0.1–0.2% protein through sire selection, grouping, and ration tuning in a decent Class III month can add 20–25¢/cwt. That’s real.
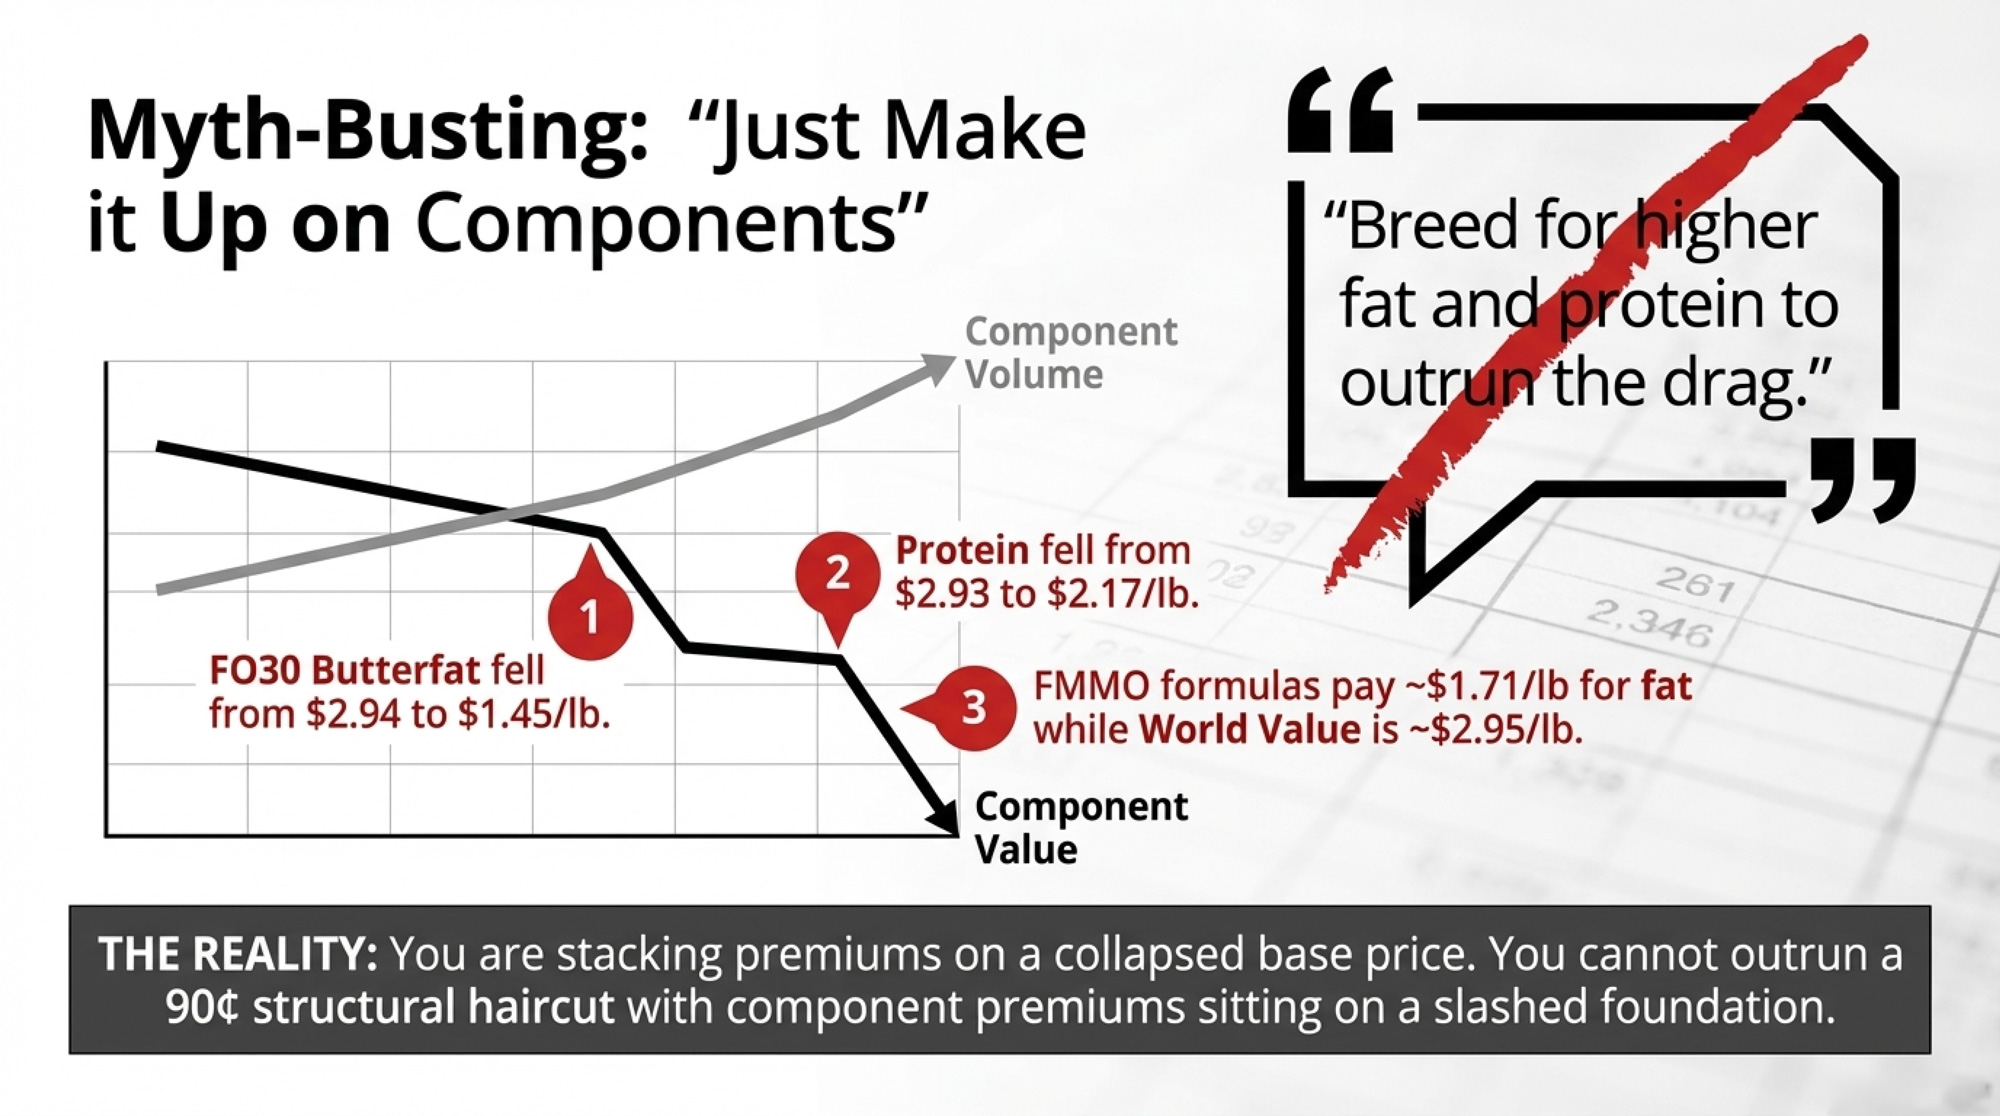
But look at what happened to the underlying prices you’re stacking that on. In January 2026, the protein price in FO30 was $2.1768/lb, down from $2.9307/lb a year earlier. Butterfat went from $2.9487/lb to $1.4525/lb. You’re trying to outrun a 90¢/cwt structural haircut with component premiums that are themselves sitting on a lower base.
And the system still doesn’t pay you full world value for the fat you ship. In The Bullvine’s butterfat deep‑dive, we showed FMMO formulas paying around $1.71/lb for butterfat at a time when Global Dairy Trade butterfat equivalents were closer to $2.95/lb — a gap north of $1.20/lb. You can crank out more fat, but the pricing system captures barely half its export value for you.
What about DMC? The 2026 Farm Bill draft raises Tier I coverage to 6 million pounds — roughly 260 cows at 23,000 lb —, but anything you ship beyond that is in Tier II or uncapped. USDA and Progressive Dairy coverage show the program helping when margins collapse, but even in “tight” years, the realistic annual benefit is low thousands of dollars on a 200‑cow herd — against roughly $42,240/year lost to higher make allowances in the GT Thompson example. DMCs aren’t designed to track structural formula changes dollar-for-dollar. It’s a margin band‑aid.
So yes, push components. Yes, use DMC intelligently. Just don’t fool yourself into thinking you can component your way out of a 90¢ structural discount that hits every cwt you ship.
Options and Trade-Offs for Farmers
You can’t undo June 1, 2025, on your own. You can decide how you’re going to respond to what it did to your check.
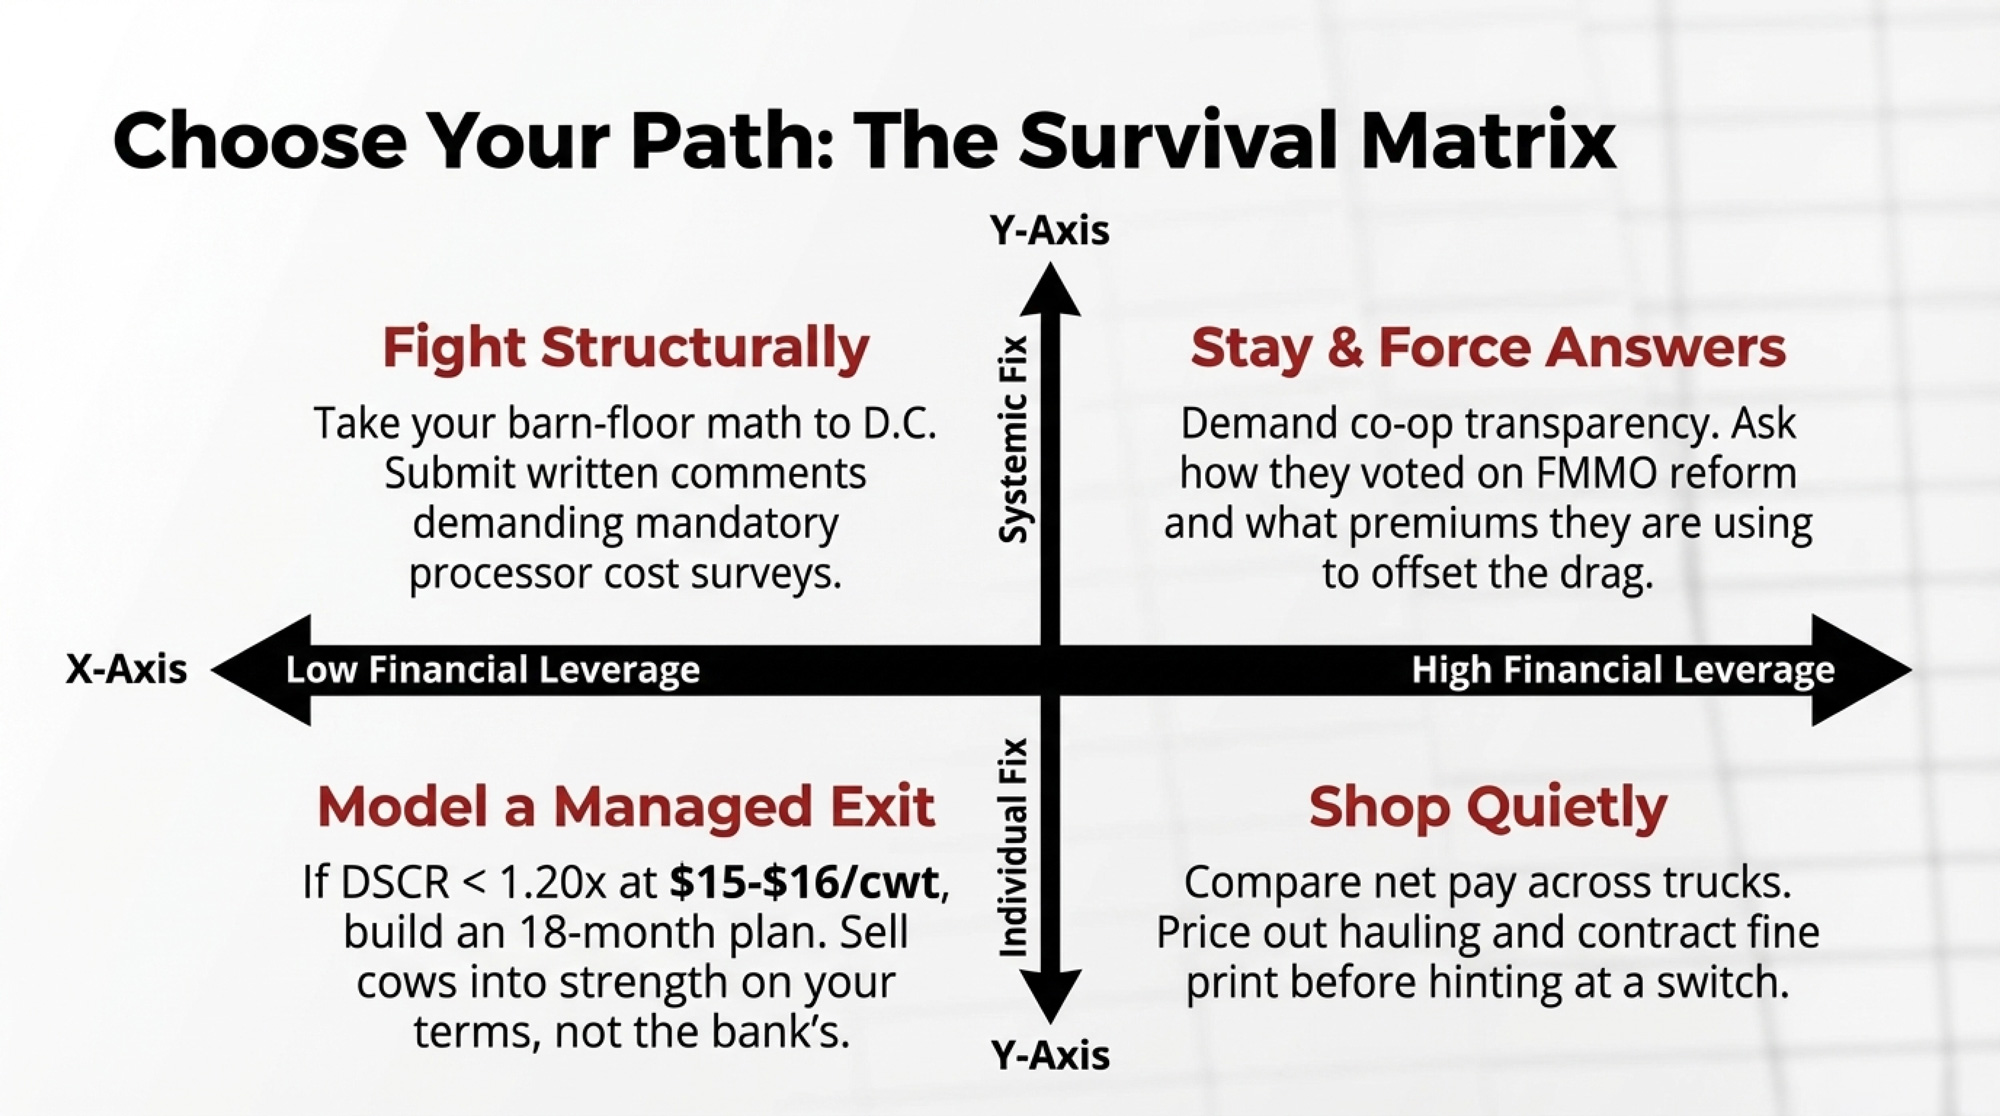
Path 1: Stay Put and Force the Conversation (Your 30‑Day Move)
This path fits if your co‑op or buyer has generally been fair on hauling, basis, and access, and you’ve got some runway.
Here’s the 30‑day checklist:
- Print your January 2025 and January 2026 milk statements.
- Calculate your net $/cwt for each and the gap between them.
- Highlight the part you can’t explain with Class III, Class IV, and butter moves.
Bring those pages to your next district or annual meeting and ask three straight questions:
- How did we vote in the FMMO modernization referendum — yes, no, or bloc‑voted by the co‑op?
- How much did higher make allowances cost our pool in 2025 and 2026, in dollars and cents per cwt?
- What are we doing — via premiums, over‑order pricing, or patronage — to push some of that value back toward member checks?
The risk with this path is time. The FMMO hearing process that produced this package took years. Nobody should be promising a quick redo.
Path 2: Shop Quietly for a Better Milk Check
This path makes sense if you’re consistently 50–60¢/cwt behind neighbors shipping similar milk to another buyer, and you have leverage left — equity, cow quality, location.
You’d need to:
- Compare net pay — after hauling, dues, and fees — with producers on other trucks.
- Price out hauling, quality penalties, balancing charges, and contract fine print before you even hint at switching.
- Equity factor that might get stranded if you leave a co‑op for a proprietary processor.
There’s real upside if another buyer structurally pays closer to class value. But you give up governance and some safety if milk markets get ugly. And in some regions, the “different” hauler still leads back to the same corporate plant.
If you want a sober look at how chasing a higher pay price can still leave you in a margin trap, pair this piece with The Bullvine’s coverage on $14.59 milk against $20‑plus/cwt cost of production — the DSCR math isn’t pretty.
Path 3: Model a Managed Exit While You Still Have Leverage
Nobody wants to be the one to say this, but here it is: some operations already know $15–16/cwt milk with a 90¢ structural drag, and current debt loads won’t pencil long term.
This path fits if:
- Your DSCR is stuck under roughly 1.20× at $15–16 uniform prices, and you’ve been there more than a quarter.
- You’re putting bills in a stack instead of paying them as they arrive.
- Your lender has already started asking for more “updated” projections.
You’d need to:
- Build an 18‑month cash flow projection at today’s price levels and at one or two “what if” scenarios.
- Sit down with your lender now, not when covenants are already broken.
- Price what a step‑back or exit looks like while cull cow and beef‑cross prices are still decent.
Selling cows into strength on your terms almost always preserves more equity than waiting until the bank’s credit committee decides you’re done. It’s ugly. It still beats pretending the structural drag doesn’t exist.
Path 4: Fight the Structural Battle Beyond Your Farm Gate
If the problem is structural, part of the solution has to live in D.C. hearing rooms and comment dockets.
This path fits if:
- You can keep the wheels on long enough to care what FMMO 2030 looks like.
- You’re angry enough to turn your drag number into testimony, not just coffee‑shop talk.
It looks like:
- Submit written comments to USDA the next time pricing hearings or make‑allowance surveys open up, with your herd size, order, and real $/cwt drag front and center.
- Pushing your state associations and co‑ops to take specific positions: mandatory processor cost surveys, automatic adjustments tied to verified costs, and a path for make allowances to come down if costs do.
- Using Farm Bill touchpoints — like the GT Thompson draft — to argue that a $1,800/year DMC fix against a $42,240/year make‑allowance hit isn’t “modernization.”
You won’t see these efforts reflected in your next milk check. But if producers don’t show up with barn‑floor math, the only numbers on the table will come from people whose margins just got protected.
Key Takeaways
- If your unexplained January‑over‑January gap is more than about 50¢/cwt after you factor in Class III, Class IV, and butter moves, treat that as structural drag — not just a bad month. That’s the make‑allowance change and premium structure, and it will hit every cwt you ship until something changes in the formulas or your contracts.
- If your DSCR can’t stay above roughly 1.20× at $15–16/cwt uniform prices, you need a written 18‑month plan — not just hope for “better milk.” That’s the line where most lenders start looking harder at restructuring or collateral.
- If your co‑op or buyer can’t explain how they voted on FMMO reform and what they’re doing to offset the drag in one clear conversation, treat that as a data point. You have every right to know how your volume was cast and where the money went.
- If you missed the 2026 DMC sign‑up, don’t miss the 2027. Run the USDA or AFBF decision tools against your own margins at $15.05 blend and $14.59 Class III, then decide ahead of enrollment how much coverage is worth paying for.
Print the Statements Before Your Next Meeting
Somewhere in southwest Wisconsin, a 300‑cow operation walked into 2026 shipping milk to the same plant in an order where average butterfat hit 4.52% — and opened a January check roughly $50,000 lighter than the year before, if Van Ruden’s account is right. About 90¢/cwt of that hit came from the pricing formula changing underneath them. The rest came from a butter-and-cheese crash that FO30 is structurally exposed to. Only one of those problems is guaranteed to cycle back on its own. fb
Before your next co‑op or lender meeting, do the thing most people keep putting off. Print your January 2025 and January 2026 statements. Run your own $/cwt math. Circle the part you can’t explain with commodity moves. Then lay those pages on the table and ask:
“If this is what the new rules did to my milk check, what’s our plan to change that math?”
If you want to go past envelope math into full spreadsheets — region‑by‑region drag, component strategy, DSCR stress tests — The Bullvine’s FMMO Reality Check analysis and Farm Bill/DMC coverage are built for that deeper dive. Next month, we’ll run this same barn math on a 1,000‑cow Upper Midwest herd and see whether scale fixes the equation — or makes the hole bigger.
Complete references and supporting documentation are available upon request by contacting the editorial team at editor@thebullvine.com.
Learn More
- More Milk, Fewer Farms, $250K at Risk: The 2026 Numbers Every Dairy Needs to Run – Stop guessing and start calculating with this essential 2026 playbook. It reveals how mid-size herds can close a $250,000 margin gap by sharpening culling and heifer programs, giving you the immediate tactical advantage to outrun negative cash flow.
- GT Thompson’s 2026 Farm Bill Math: DMC Pays Your 200‑Cow Dairy $1,800, Make Allowances Cut $42,240 – a 23 to 1 Hit – This deep dive exposes the 23-to-1 gap between your DMC check and formula-driven losses. It arms you with the structural policy insights needed to navigate the next five years of FMMO reform and protects your equity from silent “make-allowance” taxes.
- Bred for Success, Priced for Failure: Your 4-Path Survival Guide to Dairy’s Genetic Revolution – This feature breaks down why your 4.5% butterfat success is crashing into a processing wall. It delivers a four-path survival strategy to realign your genetic investments with modern market caps, ensuring your breeding progress actually converts to farm-gate profit.
 The Sunday Read Dairy Professionals Don’t Skip.
 The Sunday Read Dairy Professionals Don’t Skip.
Every week, thousands of producers, breeders, and industry insiders open Bullvine Weekly for genetics insights, market shifts, and profit strategies they won’t find anywhere else. One email. Five minutes. Smarter decisions all week.


