More cheese, no price crash: did 44 million pounds of U.S. cheese really ‘disappear’ in November—and what does that do to your milk check?
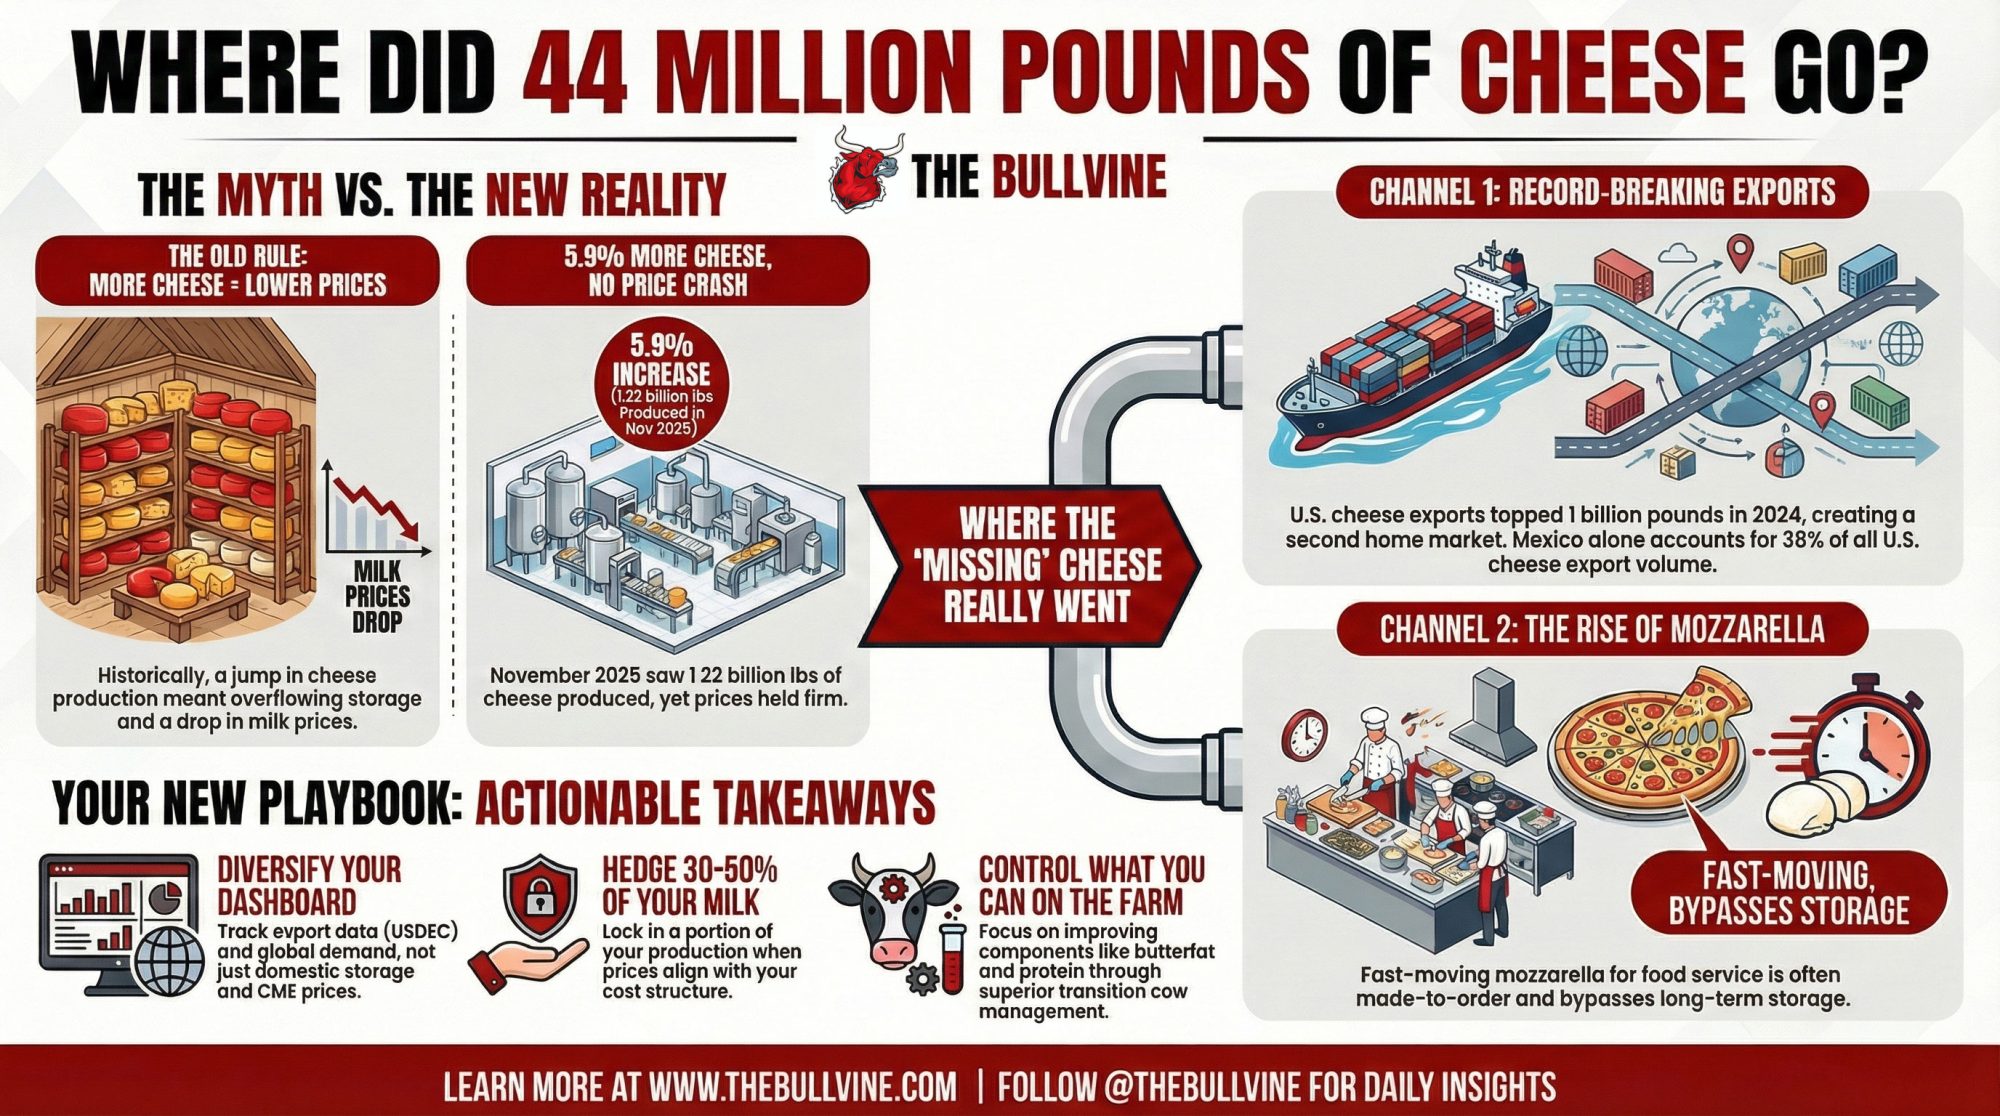
Executive Summary: U.S. cheese production jumped 5.9% to 1.22 billion pounds in November 2025, and milk output rose 4.7%—yet Cold Storage stocks didn’t hit new records, and Class III held firmer than the old “more cheese = lower prices” rule would predict. The reason is structural: roughly 40 to 50 million pounds of cheese flowed through channels that bypass traditional inventory tracking—contract mozzarella for food service, record exports exceeding 1 billion pounds in 2024 (led by Mexico at 38% of volume), and fast-turn value-added products. CME cheddar and Class III now reflect a shrinking share of total U.S. cheese, which means producers relying on those signals alone are flying partially blind. Midwest cheddar-heavy farms still need Cold Storage and CME, but Western and export-linked operations should track USDEC export data and global demand just as closely. The playbook: diversify your indicators, hedge 30–50% of your milk when prices fit your cost structure, ask your buyer how much of their output is cheddar vs. mozzarella vs. exports, and invest in components and transition-cow management—the variables you actually control. The cheese didn’t vanish; the market just evolved faster than many mental models could keep up.

Forty‑four million pounds. That’s not a rounding error; that’s a pretty good sign that the way U.S. dairy moves is changing on us, and you can feel it in your milk check long before you sit down with the latest USDA report.
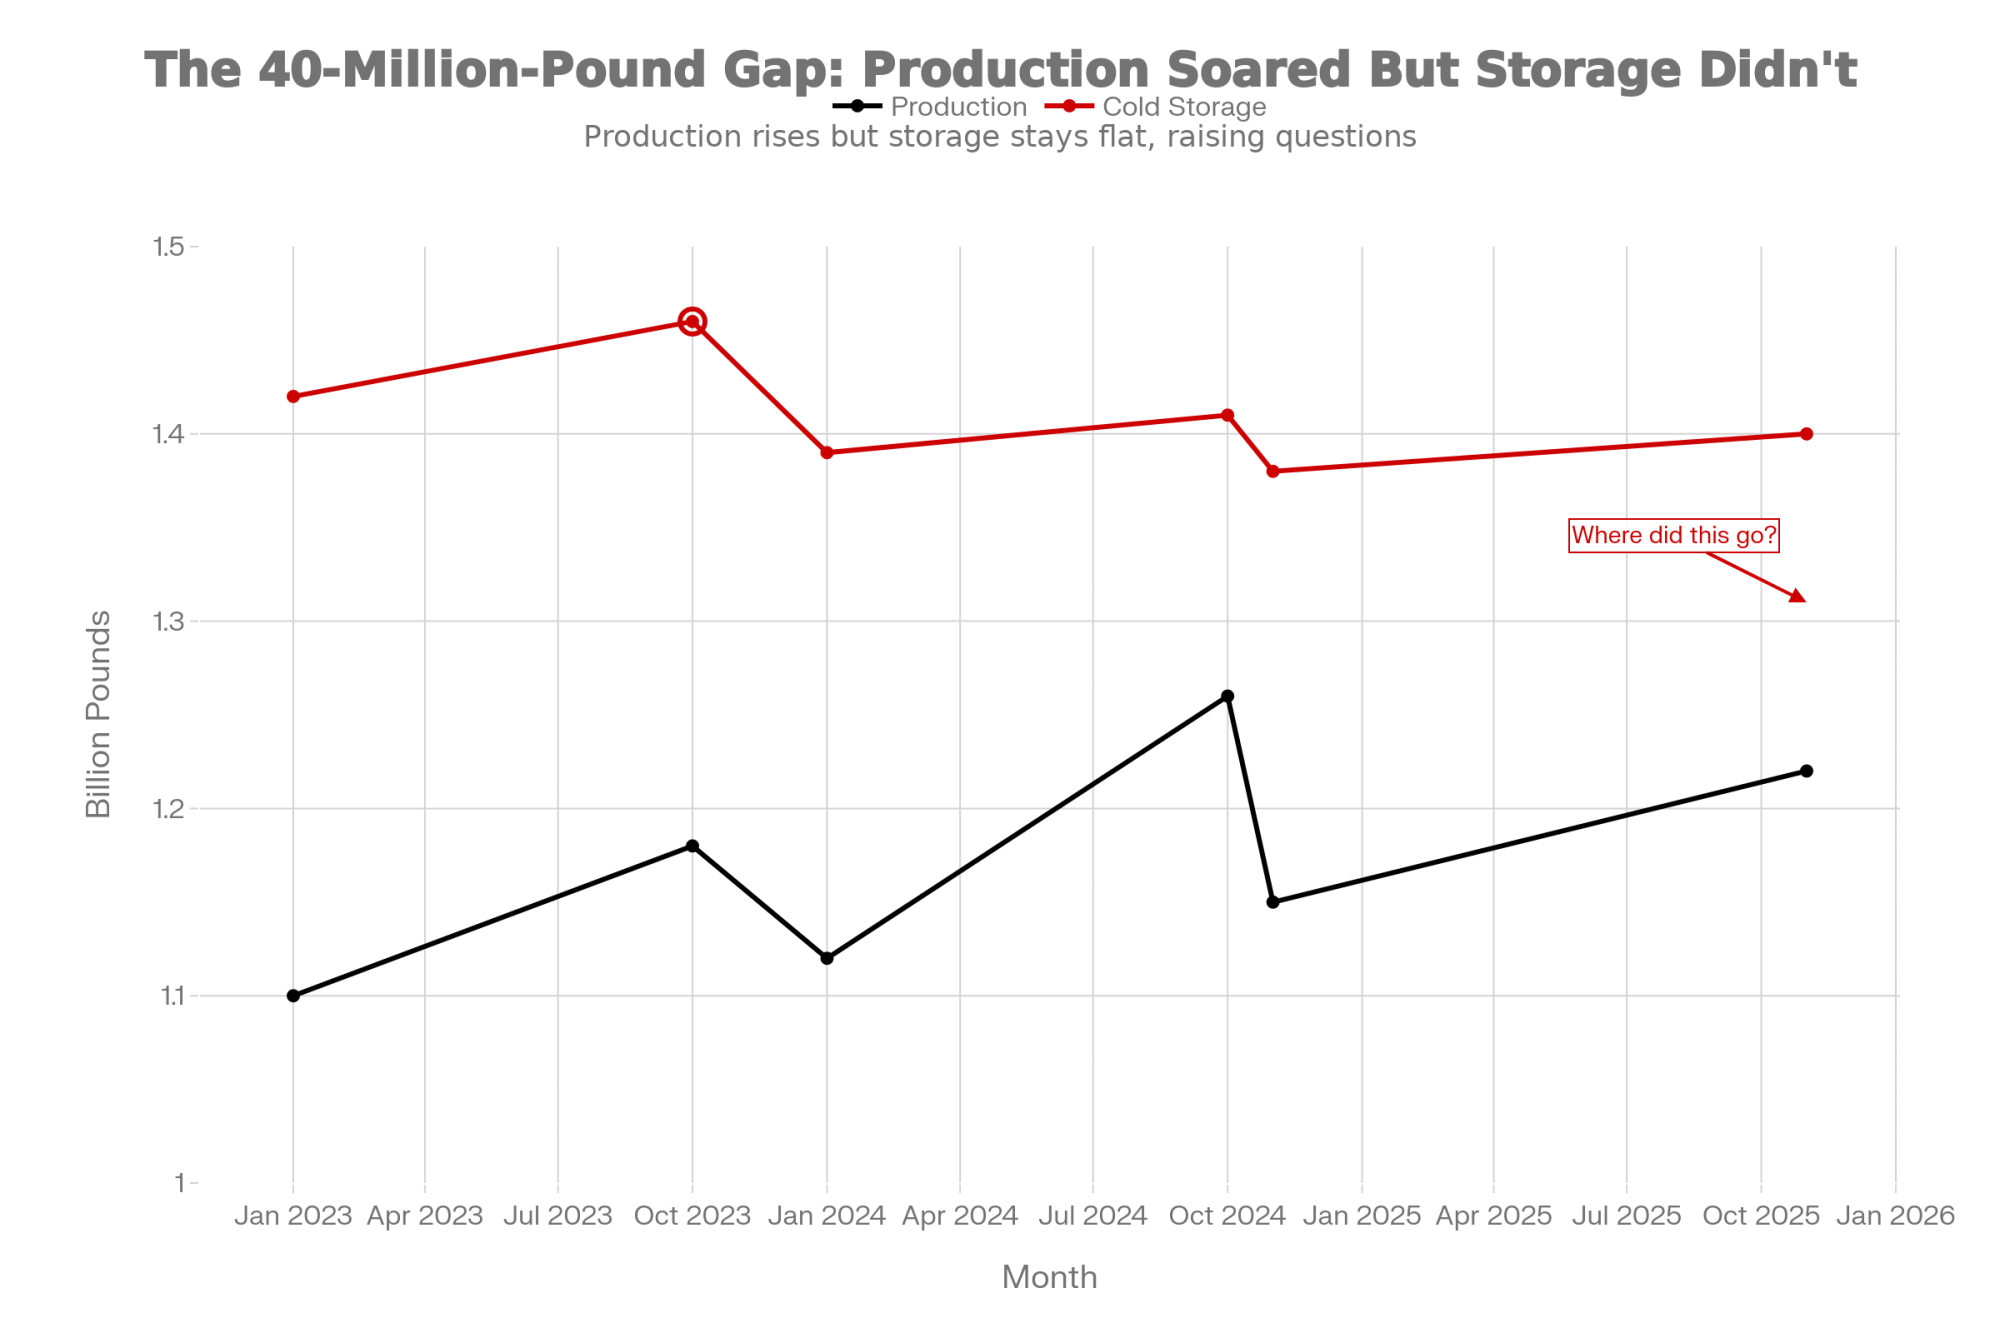
Looking at the hard numbers first keeps everyone honest. In its Dairy Products report released January 6, 2026, USDA’s National Agricultural Statistics Service says total natural cheese production, excluding cottage cheese, was 1.22 billion pounds in November 2025, 5.9% higher than in November 2024. At the same time, USDA Cold Storage data describe cheese inventories as substantial but still below the “record cheese in cold storage” mark set back in October 2023, when stocks hit about 1.46 billion pounds and made headlines as an all‑time high.
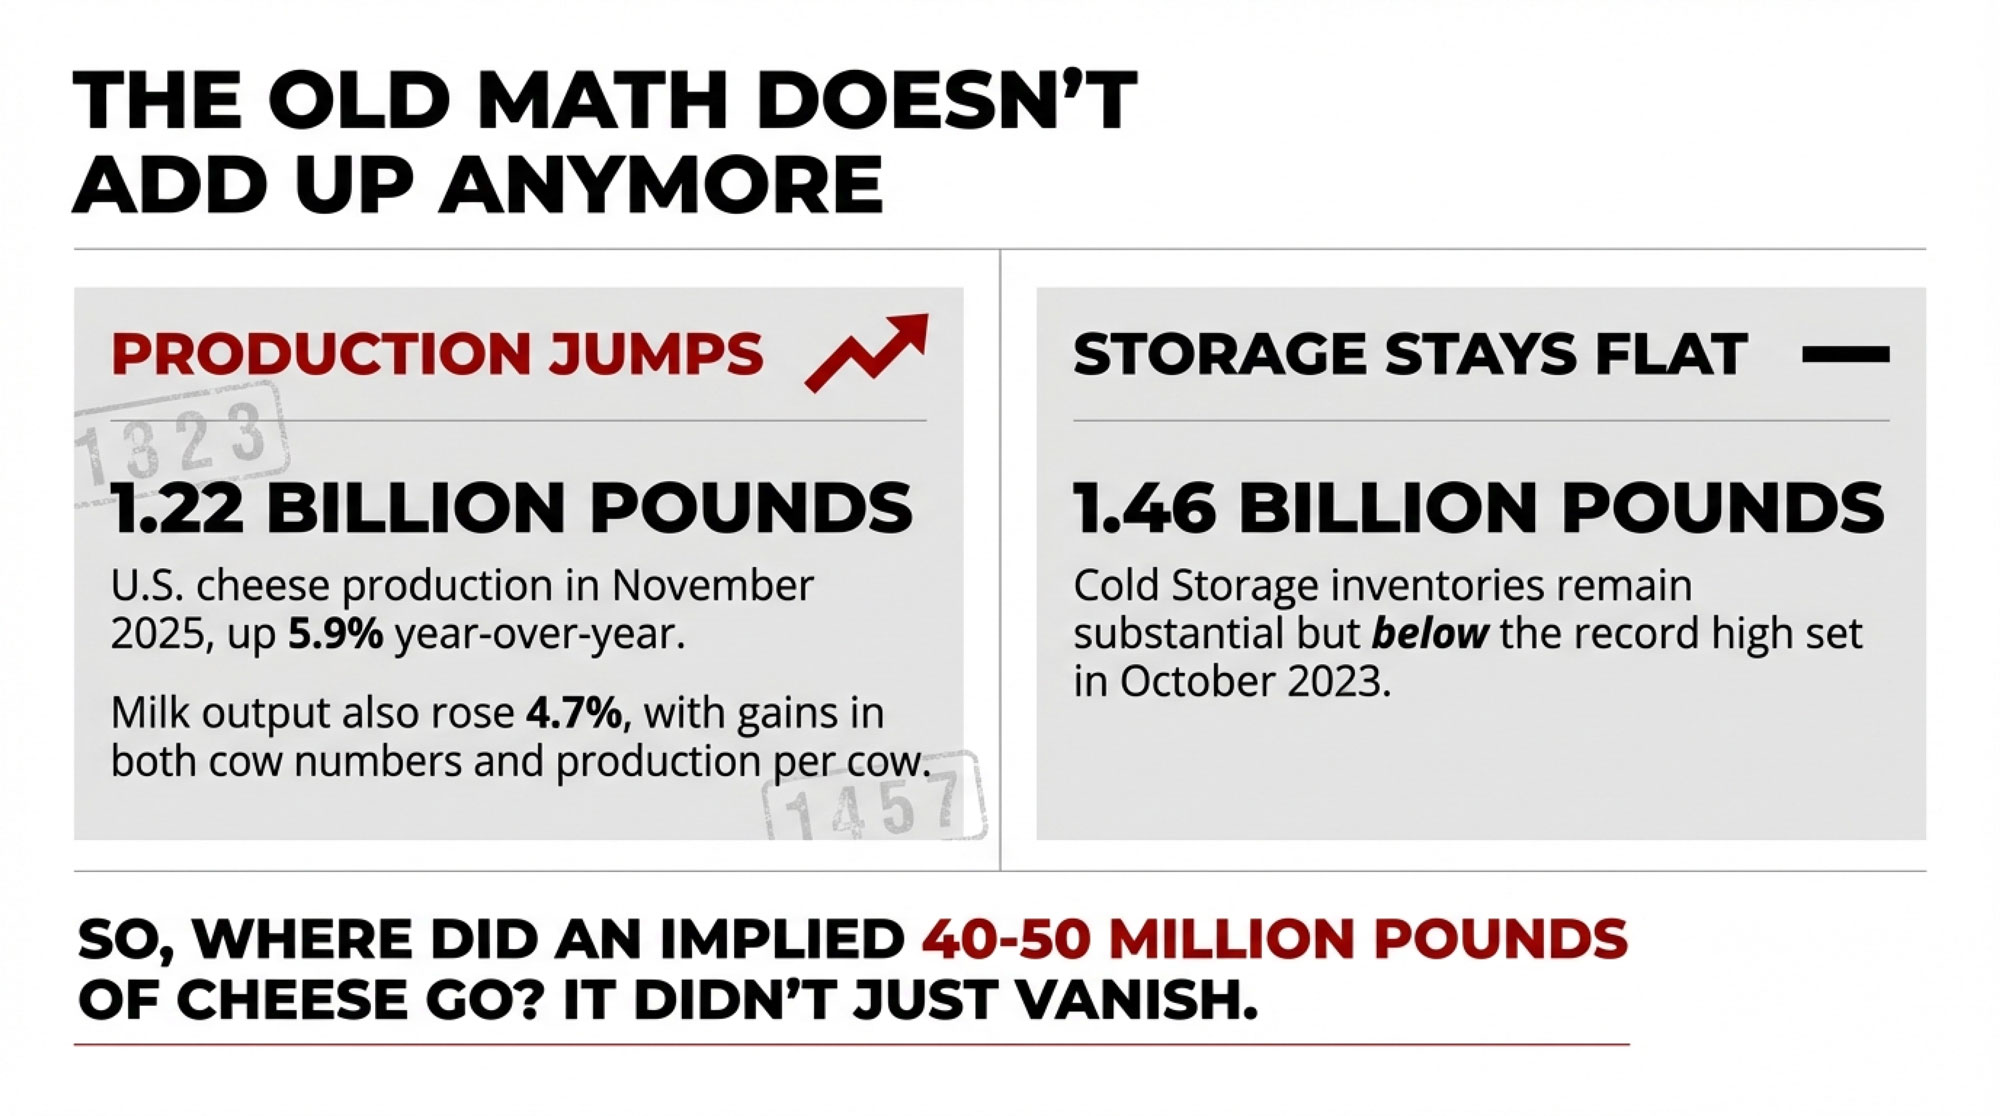
So the data suggests production moved up sharply, but stocks didn’t jump to fresh record levels alongside it. When you put that 5.9% year‑over‑year increase on a 1.22‑billion‑pound base next to “high but not record” storage language, you end up with a rough, implied gap on the order of tens of millions of pounds—somewhere in that 40‑ to 50‑million‑pound neighborhood of cheese that got made in November but didn’t show up as a big extra bulge in the Cold Storage number most of us still watch.
And you know, this isn’t happening in a year when milk is just muddling along. USDA’s Milk Production report released December 22, 2025, puts November output in the 24 major dairy states at 18.1 billion pounds, up 4.7% from November 2024, with total U.S. production at 18.8 billion pounds, up 4.5% on the year. Recent media reports have all noted how quickly both cow numbers and production per cow rose in 2025 compared with 2023–24. On top of that, work on milk composition and efficiency, along with extension discussions from programs like Wisconsin, Cornell, and Penn State, continues to show gradual gains in butterfat performance and protein levels, tied to better fresh-cow management, tighter transition‑period protocols, and greater focus on cow comfort and ration design.
So the milk is there, and the components are there. But the old, simple pattern—more milk, more cheese, more cheese piling up in storage—just doesn’t jump out of the latest reports the way it used to, and that’s where the story really starts to matter for your milk check.
Looking at This Trend Without the Noise
What farmers are finding, when they actually sit down with a coffee and walk through the USDA reports, is that the November numbers make a lot more sense once you separate “how much we made” from “where it went.”
On the production side, the story is pretty straightforward. USDA’s November 2025 Dairy Products summary lays it out plainly: total cheese output (excluding cottage cheese) was 1.22 billion pounds, 5.9% above November 2024 and 3.4% below October 2025. Earlier Dairy Products releases in 2025, and coverage in Brownfield and Cheese Market News describe “more cheese and butter, less whey and powder” and solid year‑over‑year growth across much of the cheese complex, which lines up with what a lot of you have seen in plant‑level reports. Reports has also noted that as butterfat and protein levels in the milk pool have trended higher, more cheese can be produced from every 100 pounds of milk.
On the inventory side, USDA Cold Storage reports and late‑2023 commentary from Brownfield make it clear that October 2023 remains the record high for cheese in storage, at around 1.46 billion pounds. Later updates through 2024 and into 2025 talk about “heavy” or “ample” stocks but don’t flag new records, which fits with what we see in the market: plenty of cheese around, but not a repeat of that 2023 peak.
When you put those two pieces together, the math keeps pointing in the same direction. Production is up sharply. Inventories aren’t pushing into new record territory. The difference—again, roughly that 40‑ to 50‑million‑pound range in a month like November, when you ballpark it—is being absorbed somewhere other than long‑term storage. The real question is where it’s going, and that’s where things start to get interesting.
| Channel | Estimated Monthly Volume (Million lbs) | % of Gap | Why It Bypasses Cold Storage |
|---|---|---|---|
| Export Programs | 15–20 | 35–40% | Moves plant → port consolidator → container; not surveyed in NASS commercial stocks |
| Contract Mozzarella (Food Service) | 12–18 | 25–35% | Tight delivery schedules for pizza chains; lean inventories, frequent shipments |
| Fast-Turn Value-Added Products | 5–8 | 10–15% | Shredded blends, cheese ingredients, protein-fortified products sold B2B with short lead times |
| Direct Retail & Private Label | 3–5 | 6–10% | Moves quickly through retailer DCs; minimal time in commercial cold storage |
| Other & Timing Differences | 2–4 | 4–8% | Reporting lags, in-transit inventory, non-surveyed smaller warehouses |
| TOTAL GAP | 40–50 | 100% | — |
What’s Interesting About Mozzarella Right Now
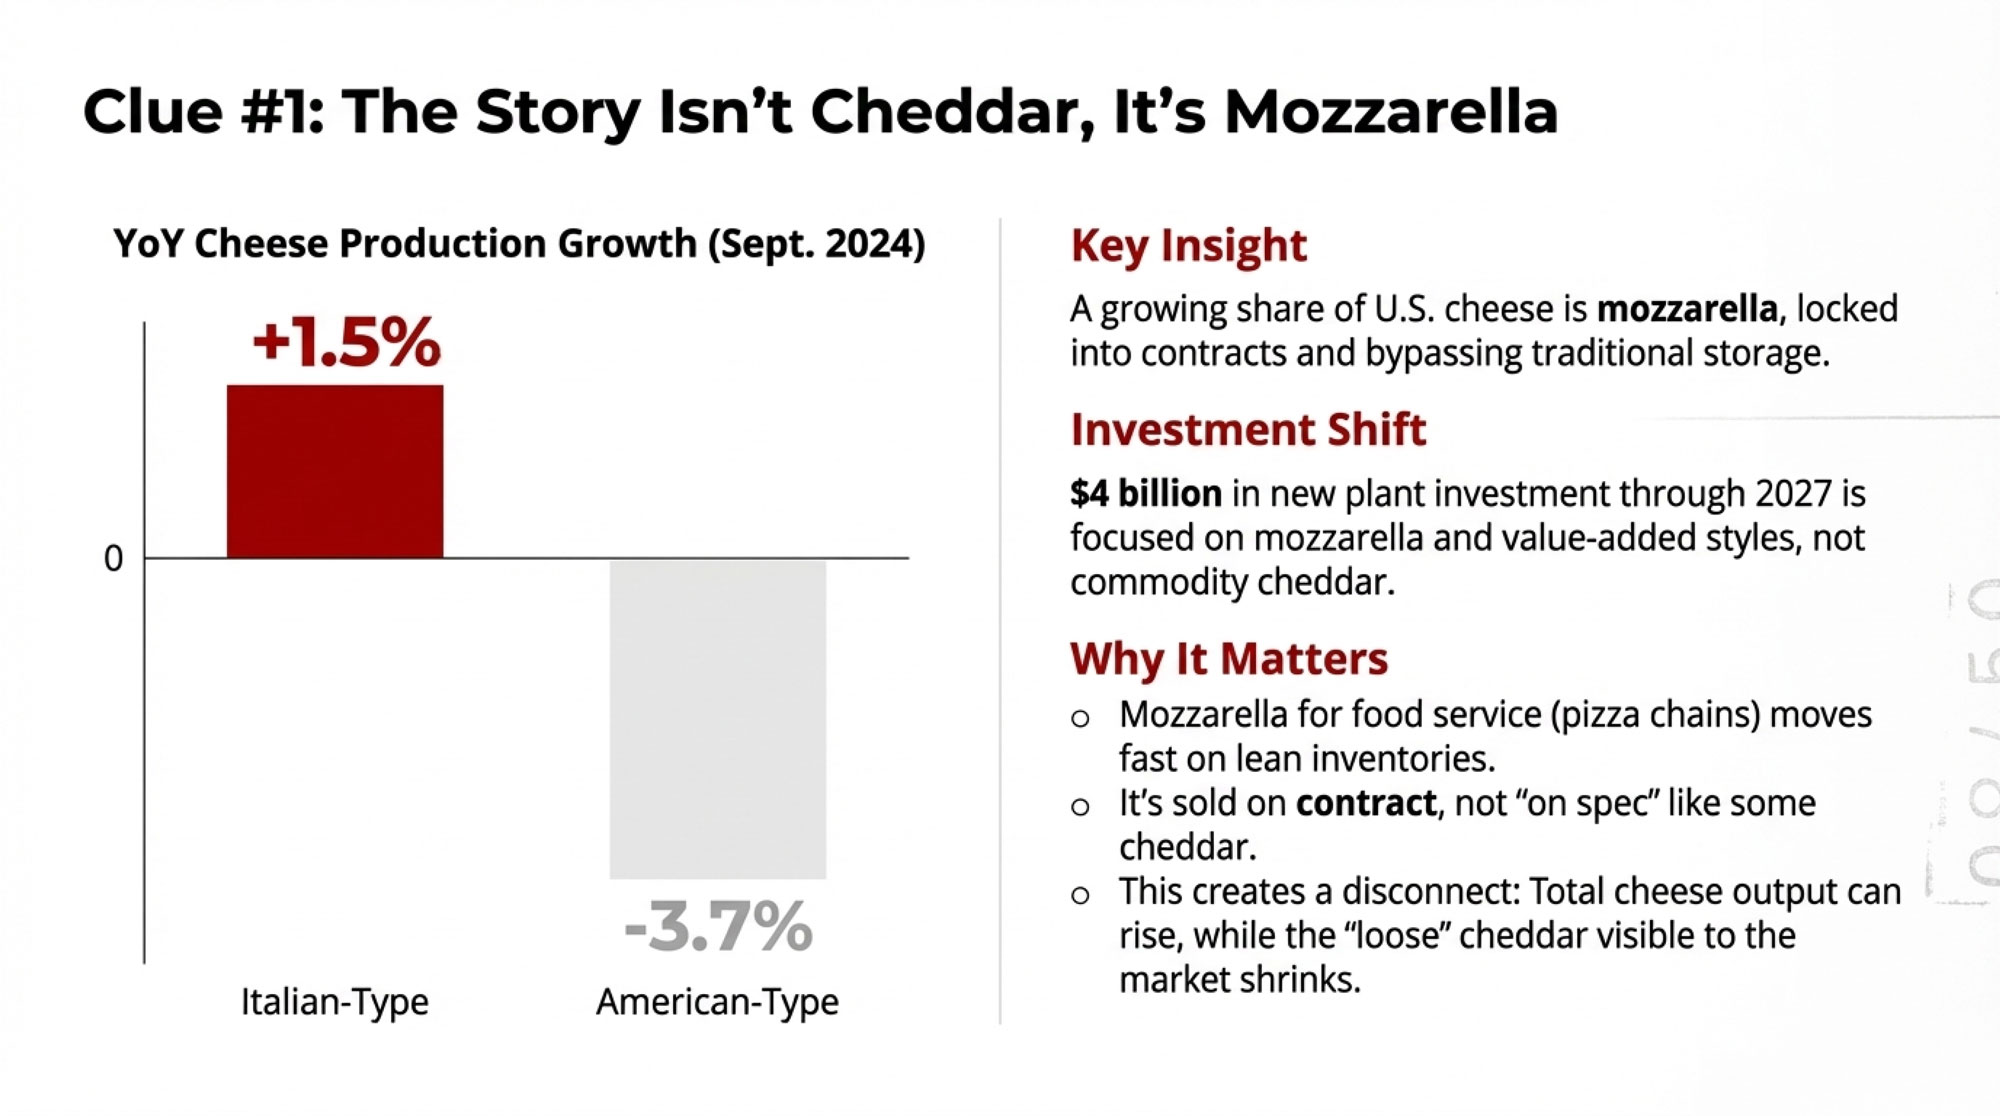
Looking at this trend, what’s interesting is that the cheese telling the story isn’t cheddar; it’s mozzarella.

USDA’s breakdowns for Italian‑type and American‑type cheeses in the Dairy Products reports show multiple recent months when Italian‑type cheese—including mozzarella—grew faster than total cheese, while American‑type cheese, including cheddar, lagged behind or even slipped below year‑ago levels. September 2024 total cheese production was about 1.16 billion pounds, up slightly from 2023, with Italian‑type cheese up 1.5% year‑over‑year at 487 million pounds and American‑type cheese down 3.7% from a year earlier. That same USDA snapshot showed butter production at 159 million pounds, up 11.3% on the year; nonfat dry milk production up 14.3%; and skim milk powder down 21.4%, which suggests plants are actively shifting cream and skim between product streams as markets move.
From a technical angle, researchers at places like the University of Wisconsin’s Center for Dairy Research and other dairy science groups have explained that low‑moisture mozzarella for pizza is designed for fast movement rather than long aging. The functional shelf life and performance window for pizza mozz are shorter than those for many cheddar styles, and large food‑service buyers—national pizza chains, regional restaurant distributors—try to run lean inventories with regular, frequent deliveries rather than big piles of cheese sitting in a freezer somewhere.
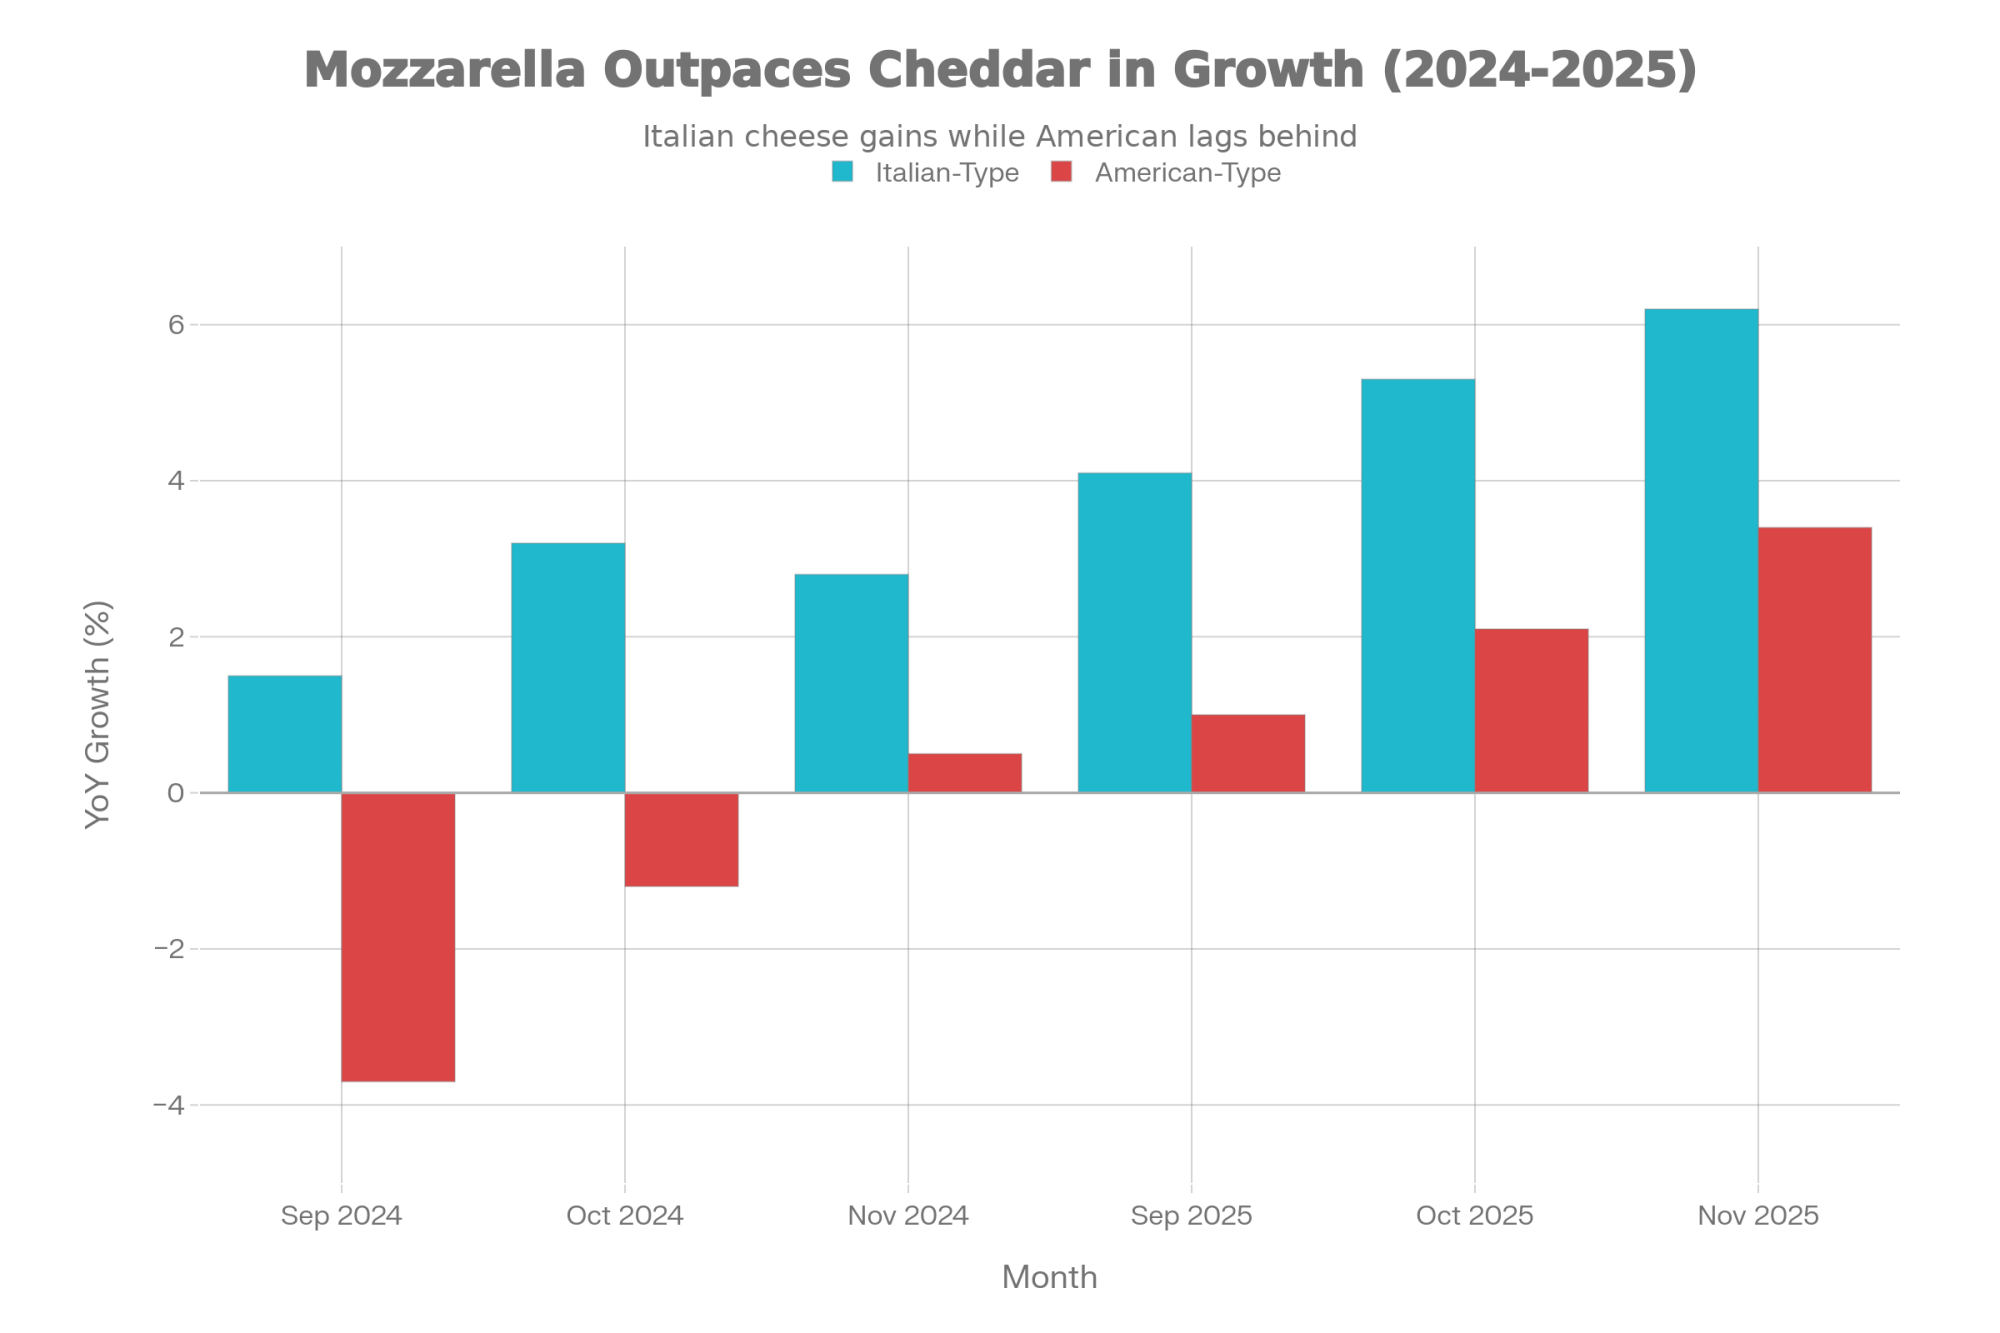
| Month | Italian-Type Cheese | American-Type Cheese |
|---|---|---|
| Sep 2024 | +1.5% | -3.7% |
| Oct 2024 | +3.2% | -1.2% |
| Nov 2024 | +2.8% | +0.5% |
| Sep 2025 | +4.1% | +1.0% |
| Oct 2025 | +5.3% | +2.1% |
| Nov 2025 | +6.2% | +3.4% |
On the ground, what I’ve noticed—and it lines up with what you hear in risk‑management workshops and plant visits—is that mozzarella lines are often heavily tied to contracts. Plants usually have a pretty tight handle on what their core accounts need week to week and month to month, whether that’s a national chain program, a regional distributor, or a long‑term export deal, and they run those vats accordingly. They’re not churning out mozzarella “on spec” the way some cheddar used to move; they’re filling orders that are already on the books.
Cheddar’s role is shifting at the same time. USDA data shows American‑type cheese growing more slowly than “all cheese” in several months, and in some cases running below year‑earlier levels while Italian‑type keeps climbing. Analysis of cheese markets and export opportunities has also highlighted about $ 4 billion in new cheese plants slated to come online through 2027, with new facilities already taking milk in Kansas and Texas and more expansions underway in the Upper Midwest, along the East Coast, and in the West. Company announcements and industry reporting emphasize mozzarella, Hispanic cheeses, and other value‑added styles as key outputs from many of these investments, often alongside powders and concentrated fat and protein ingredients.
This development suggests a structural disconnect that a lot of you are feeling in your milk checks. The CME spot market and the Class III milk price formula still lean heavily on cheddar blocks and barrels plus dry whey, as research on U.S. dairy futures, price transmission, and market integration has documented. When a growing share of U.S. cheese production is mozzarella and other styles that are locked into contracts or export channels, and a smaller share is “loose” cheddar available to show up in CME trading and Cold Storage, total cheese production and CME‑visible cheddar supply just aren’t tied together like they used to be.
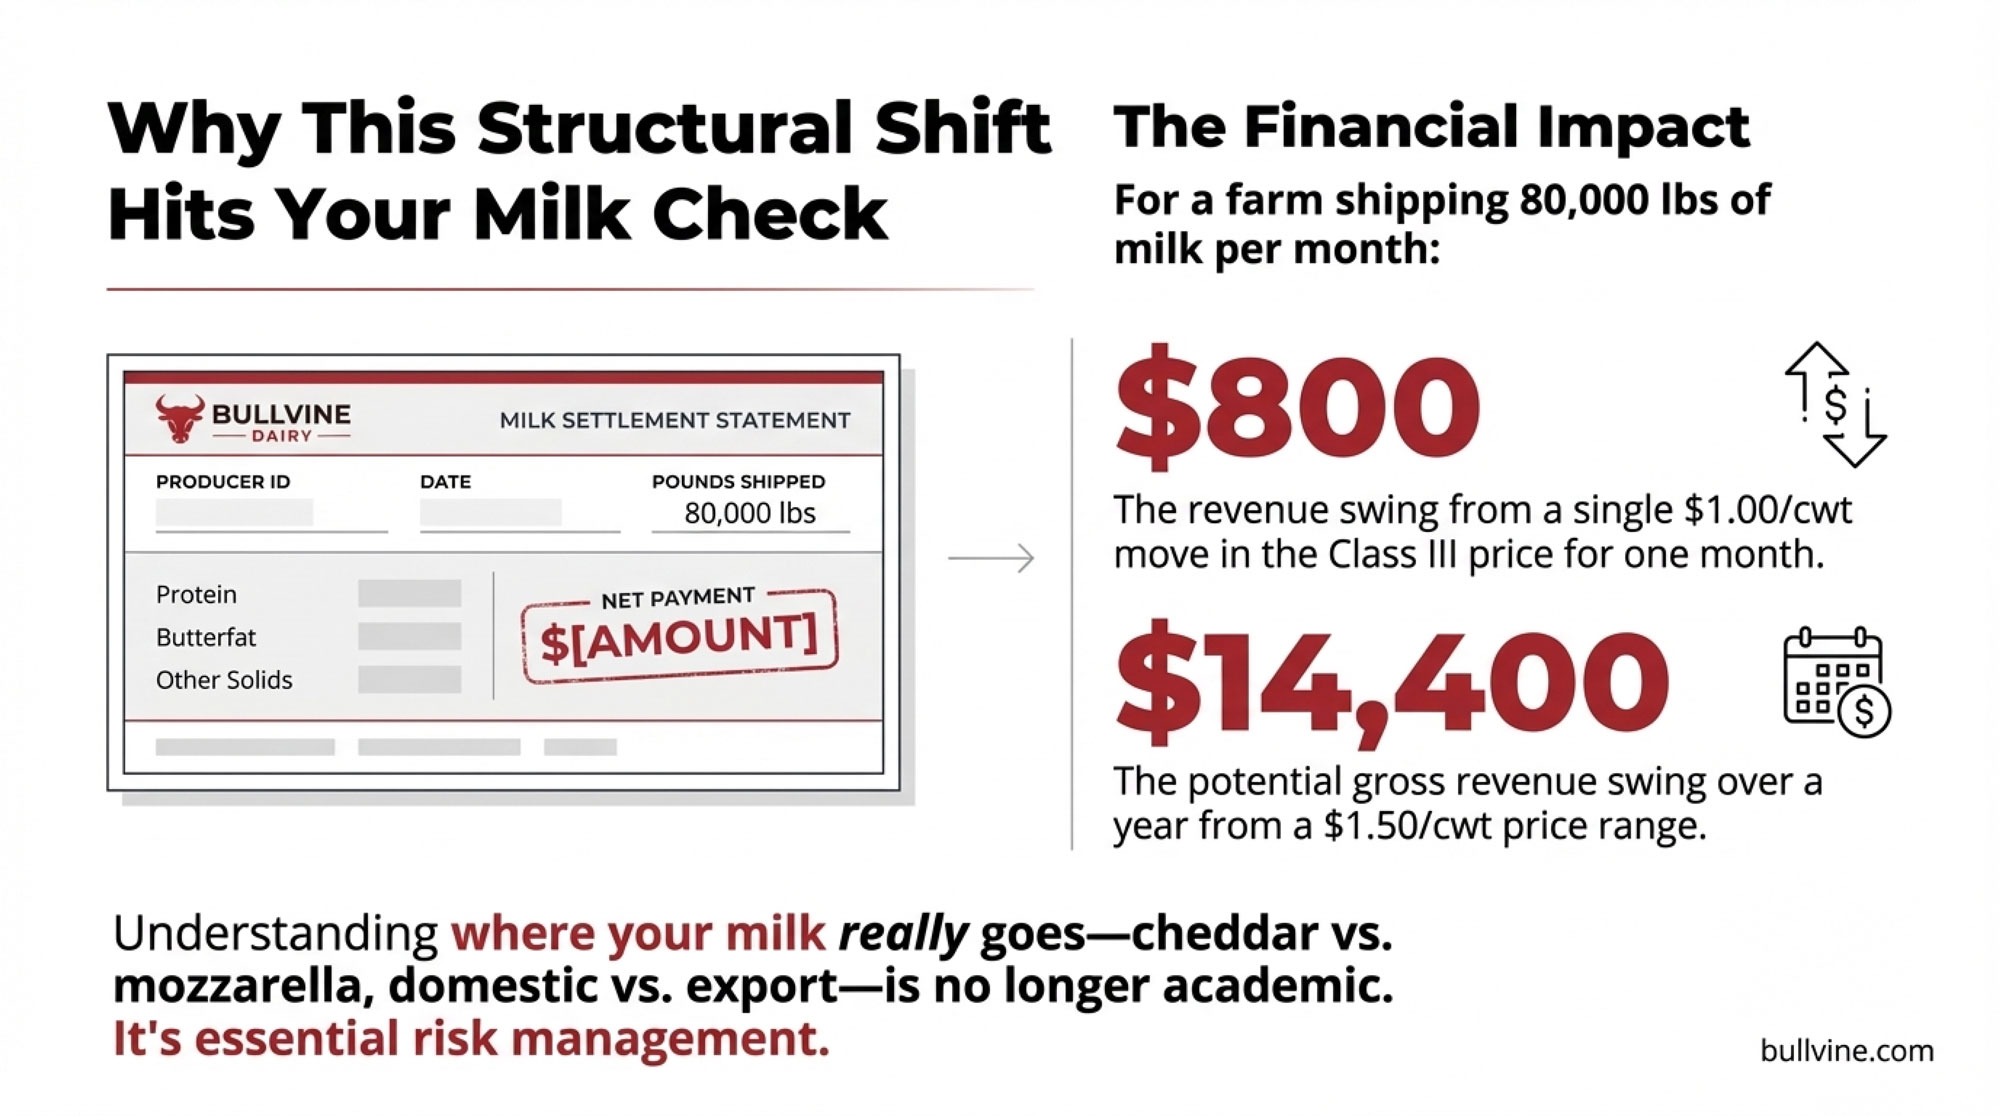
To put some numbers behind that feeling, think about a farm shipping around 80,000 pounds of milk in a month. Each one‑dollar move in Class III is roughly 800 dollars up or down in gross revenue for that month, because 80,000 pounds is 800 hundredweights. On a 500‑cow freestall in the Midwest, that’s a noticeable swing. On a 3,000‑cow dry lot system in the Southwest, you multiply that impact several times over. So the way cheese moves—cheddar versus mozzarella, domestic versus export—flows straight back to your bottom line.
| Herd Size / Type | Monthly Milk Volume (lbs) | Impact of $1.00 Class III Move (Monthly) | Impact of $1.50 Range Over 12 Months (Annual) | % of Typical Net Margin |
|---|---|---|---|---|
| 80-cow grazing (Northeast) | 80,000 | $800 | $14,400 | ~12–15% |
| 500-cow freestall (Midwest) | 500,000 | $5,000 | $90,000 | ~10–13% |
| 1,200-cow (Western/Midwest) | 1,200,000 | $12,000 | $216,000 | ~9–12% |
| 3,000-cow dry lot (West) | 3,000,000 | $30,000 | $540,000 | ~8–11% |
And if you zoom out a bit, a $1.50 per hundredweight range over a year on those same 80,000 pounds a month adds up to about $14,400 of gross revenue, swinging one way or the other. That’s real money when you start lining it up against feed bills, interest payments, or the cost of upgrading fresh cow facilities.
Exports: The Other Big Piece of the Puzzle
What farmers are finding, when they look beyond domestic reports, is that exports are quietly soaking up a lot of that “extra” cheese.

Media reports in early 2025 that U.S. cheese exports through November 2024 reached 1.028 billion pounds, the first time they’d crossed the billion‑pound mark. Mexico alone accounted for 392 million pounds of that total, roughly 38% of all U.S. cheese exports, and increased its cheese imports from the U.S. by 32% compared with the same period in 2023. The Bullvine’s own coverage of that milestone drew on USDEC and USDA Foreign Agricultural Service data and noted that South Korea, Japan, Central America, and several Middle Eastern buyers also increased their cheese purchases from the U.S., helping push exports over that threshold.
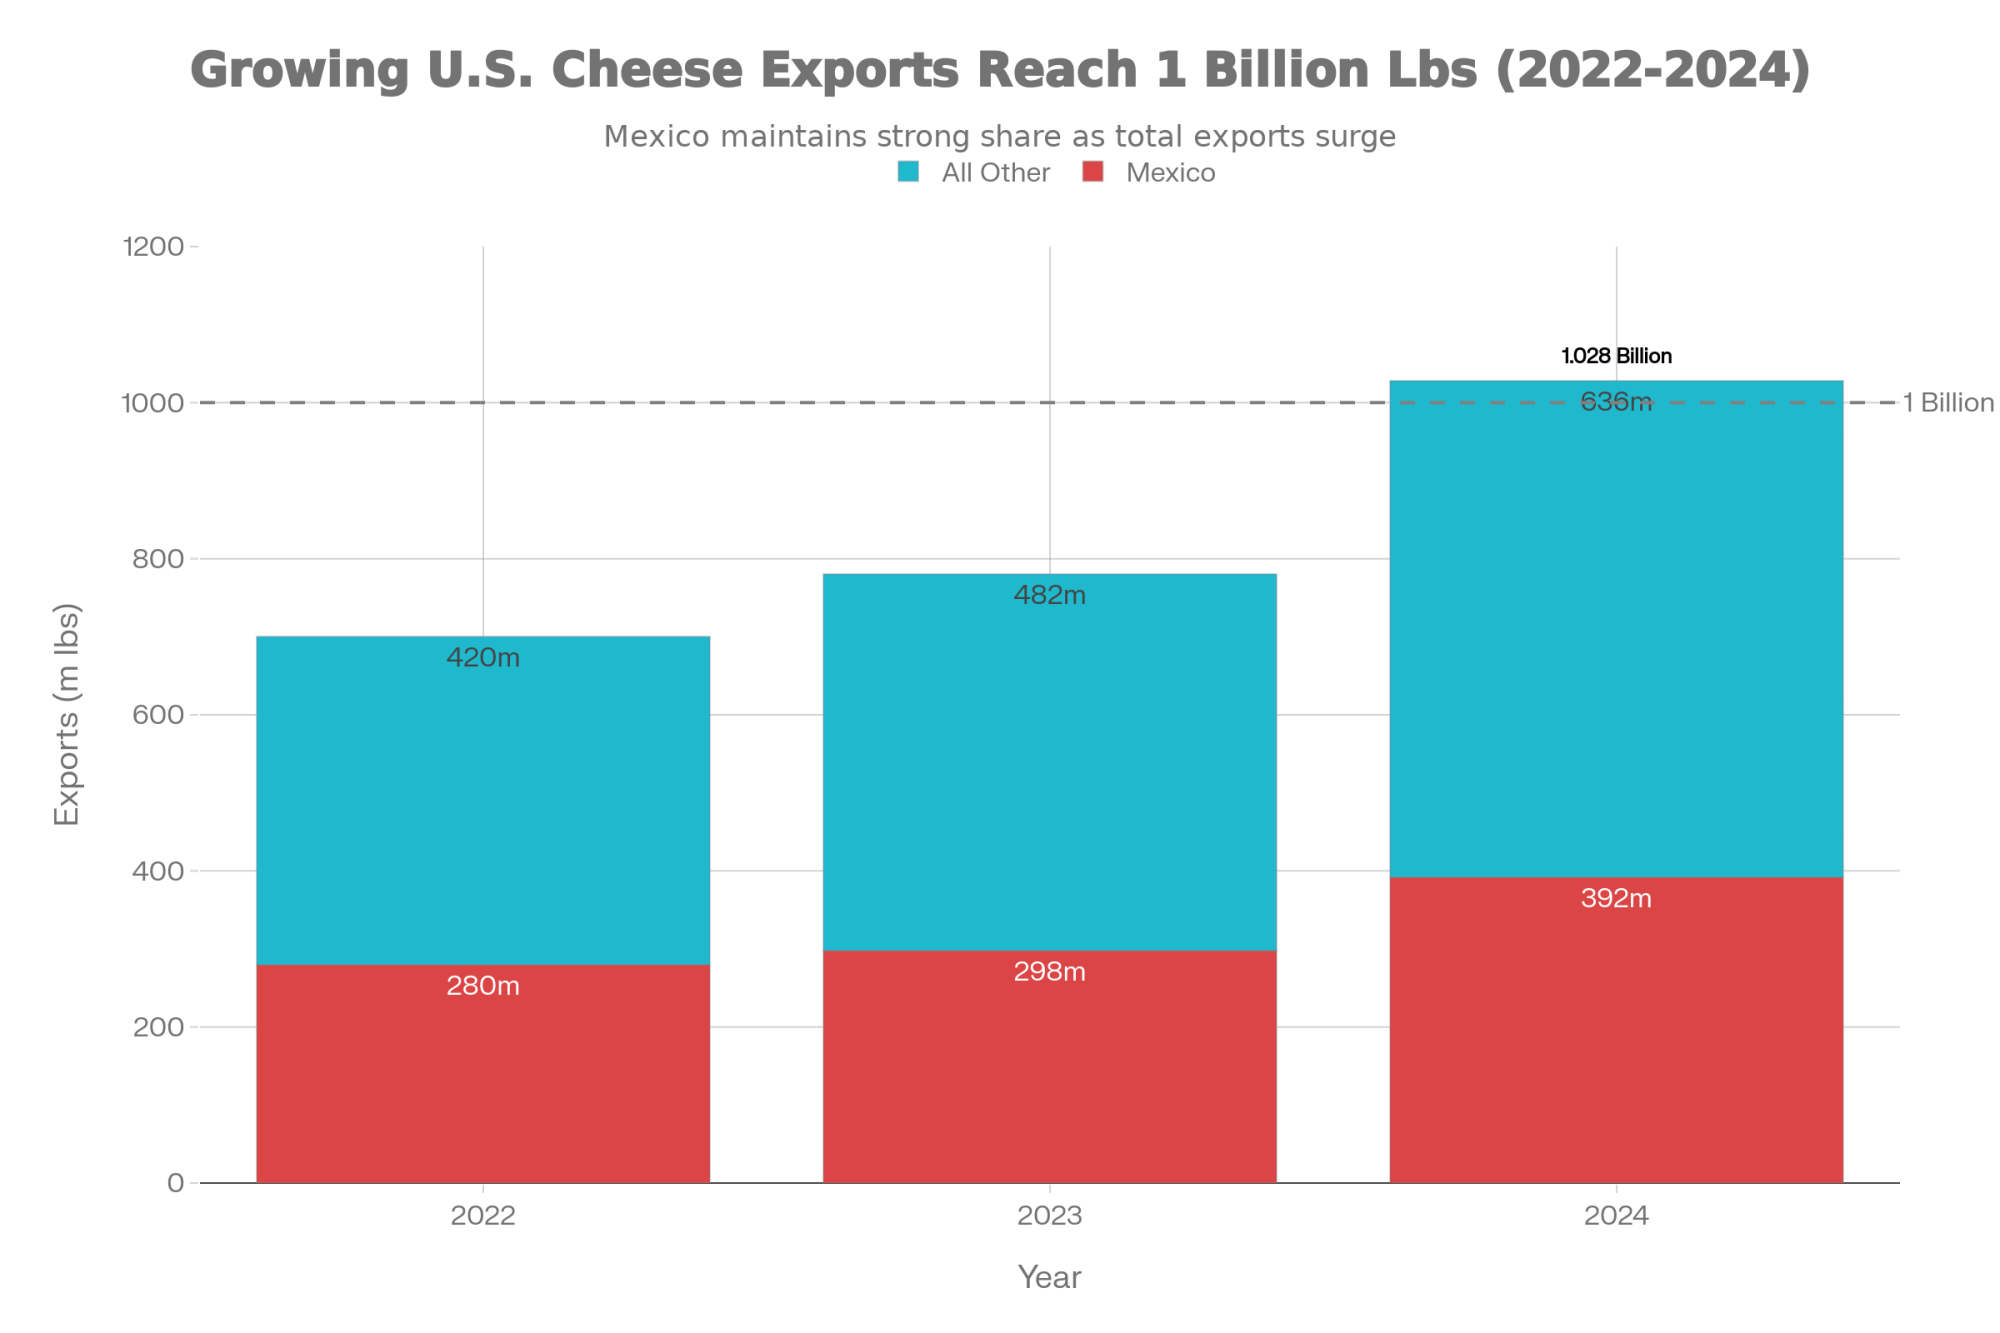
| Year | Mexico | All Other Destinations | Total |
|---|---|---|---|
| 2022 | 280 million lbs | 420 million lbs | 700 million lbs |
| 2023 | 298 million lbs | 482 million lbs | 780 million lbs |
| 2024 | 392 million lbs | 636 million lbs | 1,028 million lbs |
A 2024 export review in Progressive Dairy and Dairy Processing reported that total U.S. dairy export value reached about 8.2 billion dollars in 2024, with cheese exports totaling roughly 508,808 metric tons—about 1.12 billion pounds—an improvement of around 17% over 2023. That same coverage highlighted Mexico and Canada together taking more than 40% of U.S. dairy export value, with Mexico importing about 2.47 billion dollars’ worth of U.S. dairy products and Canada around 1.14 billion. USDEC’s own summaries reinforce that cheese has become a leading export item by volume and value for the U.S. in recent years, especially into North American and Asian markets.
In plain language, those buyers are acting like a second home market for U.S. cheese. That’s the kind of demand that can absorb a lot of “extra” product before it ever shows up as a big stock build in Cold Storage.
So if you step back from the individual line items, it’s pretty clear where a big chunk of that “missing” 40‑ to 50‑million‑pound gap in a month like November can go. It doesn’t stick around in domestic Cold Storage because much of it simply leaves the country through export channels.
Physically, export cheese tends to follow a different path than domestic retail cheese. It often moves from the plant to a specialized consolidator or a warehouse near a port, then into refrigerated containers bound for overseas destinations, spending relatively little time in the broad commercial cold‑storage facilities that NASS surveys for its stock reports. The same pattern holds for concentrated butterfat products—anhydrous milk fat and high‑fat blends—produced for export or industrial customers, which are usually sold under contract and don’t always show up neatly in the familiar “butter in cold storage” figures.

Fast‑Moving Channels and Value‑Added Products
What’s interesting here is that exports aren’t the only thing changing how cheese and components move. Domestic distribution has been evolving right alongside the global story.
Industry reporting has highlighted the growing share of cheese and dairy ingredients moving through food‑service and business‑to‑business channels, supported by regular, frequent shipments and lean inventory strategies. Major restaurant chains and broadline distributors often prefer multiple smaller deliveries rather than big, infrequent loads, especially when they’re dealing with shredded mozzarella, custom blends, or ingredient cheeses tailored to specific food manufacturers.
At the same time, research reviews and applied nutrition work are documenting steady growth in value‑added fluid and high‑protein dairy products—filtered milks, protein‑fortified beverages, and specialty dairy drinks—that build on higher butterfat and protein levels in the milk supply. Several recent and planned processing projects in states like Kansas and Texas, highlighted by regional agribusiness outlets, are designed to produce both cheese and higher‑value components, capturing more value from butterfat and protein rather than simply pushing volume into commodity powder and bulk butter.
All of this lines up with what many of us have seen on the ground over the last decade: that old “production minus stocks” rule of thumb used to capture a big chunk of what was happening in the market. Today, it describes a smaller slice. The milk still gets turned into product, and the product still gets sold, but more of it is moving through channels—export programs, contract‑driven mozzarella lines, food‑service and ingredient streams, and value‑added beverages—that don’t create large, slow‑moving inventories in the specific warehouses USDA tracks as “cheese in cold storage.”
How This Feels in Different Milksheds
The national data might be the same on paper, but it sure doesn’t feel that way on every farm. Regional context matters a lot, and it’s worth talking about that openly.
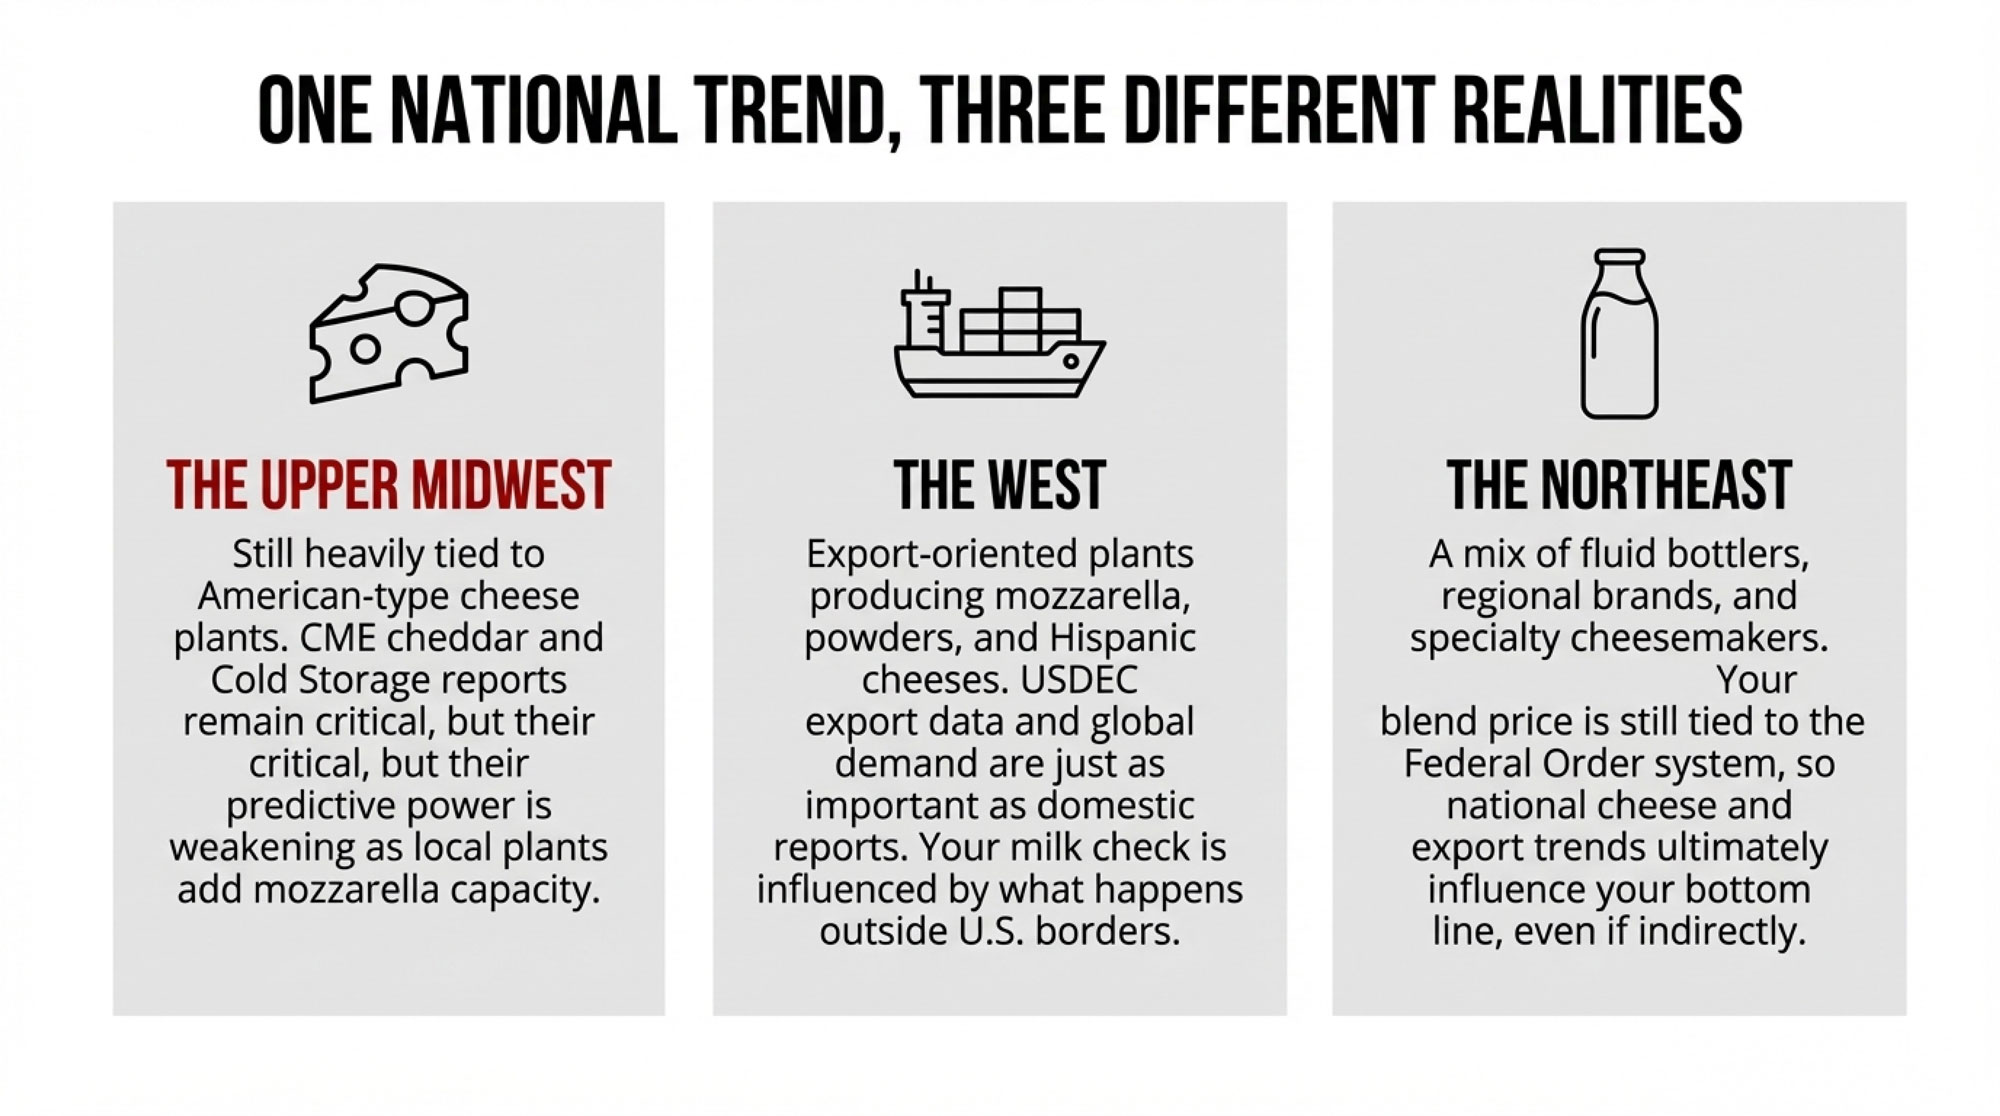
In Wisconsin operations and across much of the Upper Midwest, a large share of milk still goes into plants with substantial American‑type cheese capacity, even though many of those plants have added Italian‑type and specialty cheese lines in recent years. Many Midwest producers will tell you they still watch Cold Storage reports and CME cheddar prices almost like a weather forecast, because historically those numbers have been tightly linked to local basis and premiums—a relationship regional market updates and extension economists in that area often highlight. As more capacity in the Midwest shifts toward mozzarella and specialty cheeses, though, that one‑to‑one connection gets noisier. The indicators still matter; they just don’t explain everything the way they used to.
In California and the broader West, a lot of major plants built or expanded over the last decade were designed from day one with exports and value‑added production in mind. These facilities commonly produce mozzarella, Hispanic cheeses, milk powders, and concentrated fat and protein ingredients for both domestic and international customers, a pattern that shows up repeatedly in Western market updates and company announcements. Western producers shipping to those plants are often just as focused on export program health, port congestion, and global demand as they are on Cold Storage or the latest Dairy Products report, because their milk checks are heavily influenced by what’s happening outside U.S. borders.
In the Northeast, quite a few smaller and grazing‑based family farms still ship to fluid bottlers, regional brands, or specialty cheesemakers. Their daily reality revolves around local retail demand, co‑op policies, and regional brand strength, which is a story you see in provincial and state‑level dairy board and market reports. Even so, their blend prices and over‑order premiums still flow out of a federal order system tied back to national Class I, III, and IV values, which respond to the same production, inventory, and export trends we’ve been walking through.
For Canadian readers operating under supply management, it’s worth noting that while quota systems and Canadian Dairy Commission programs do buffer day‑to‑day volatility at the farm gate, the same global trends in cheese exports, product mix, and component emphasis still influence processor investment decisions and trade pressures that show up in national board discussions and long‑term policy debates.
So, as many of us have seen, one size doesn’t fit all. The November numbers are the same across the country—and, in many ways, across the border too—but the way they land in your mailbox depends heavily on who’s buying your milk, what they’re making with it, and how much of their business leans on cheddar, mozzarella, Class III versus Class IV, exports, or value‑added products.
| Region / Milkshed | Dominant Cheese Types | Primary Price Signals to Watch | Export Exposure | Hedging Priority | What Keeps You Up at Night |
|---|---|---|---|---|---|
| Midwest (WI, MN, IA) | Cheddar, some mozzarella | CME blocks/barrels, Cold Storage, Class III futures | Moderate (15–25% of volume) | CME Class III options, DRP | Cold Storage builds, cheddar oversupply |
| West (CA, ID, NM, TX) | Mozzarella, Hispanic cheeses, powders | USDEC exports, global powder prices, Class III & IV | High (30–45% of volume) | Class III/IV combo, export contract hedges | Mexico demand swings, port delays, trade disputes |
| Northeast (PA, NY, VT) | Regional brands, specialty, fluid | Class I differentials, regional blend price, over-order premiums | Low (5–15% of volume) | Basis contracts, limited futures | Fluid demand decline, retail brand strength, local co-op health |
What Farmers Are Finding Helps in This Environment
So, sitting here over coffee, the real question is: what do you actually do with all this?
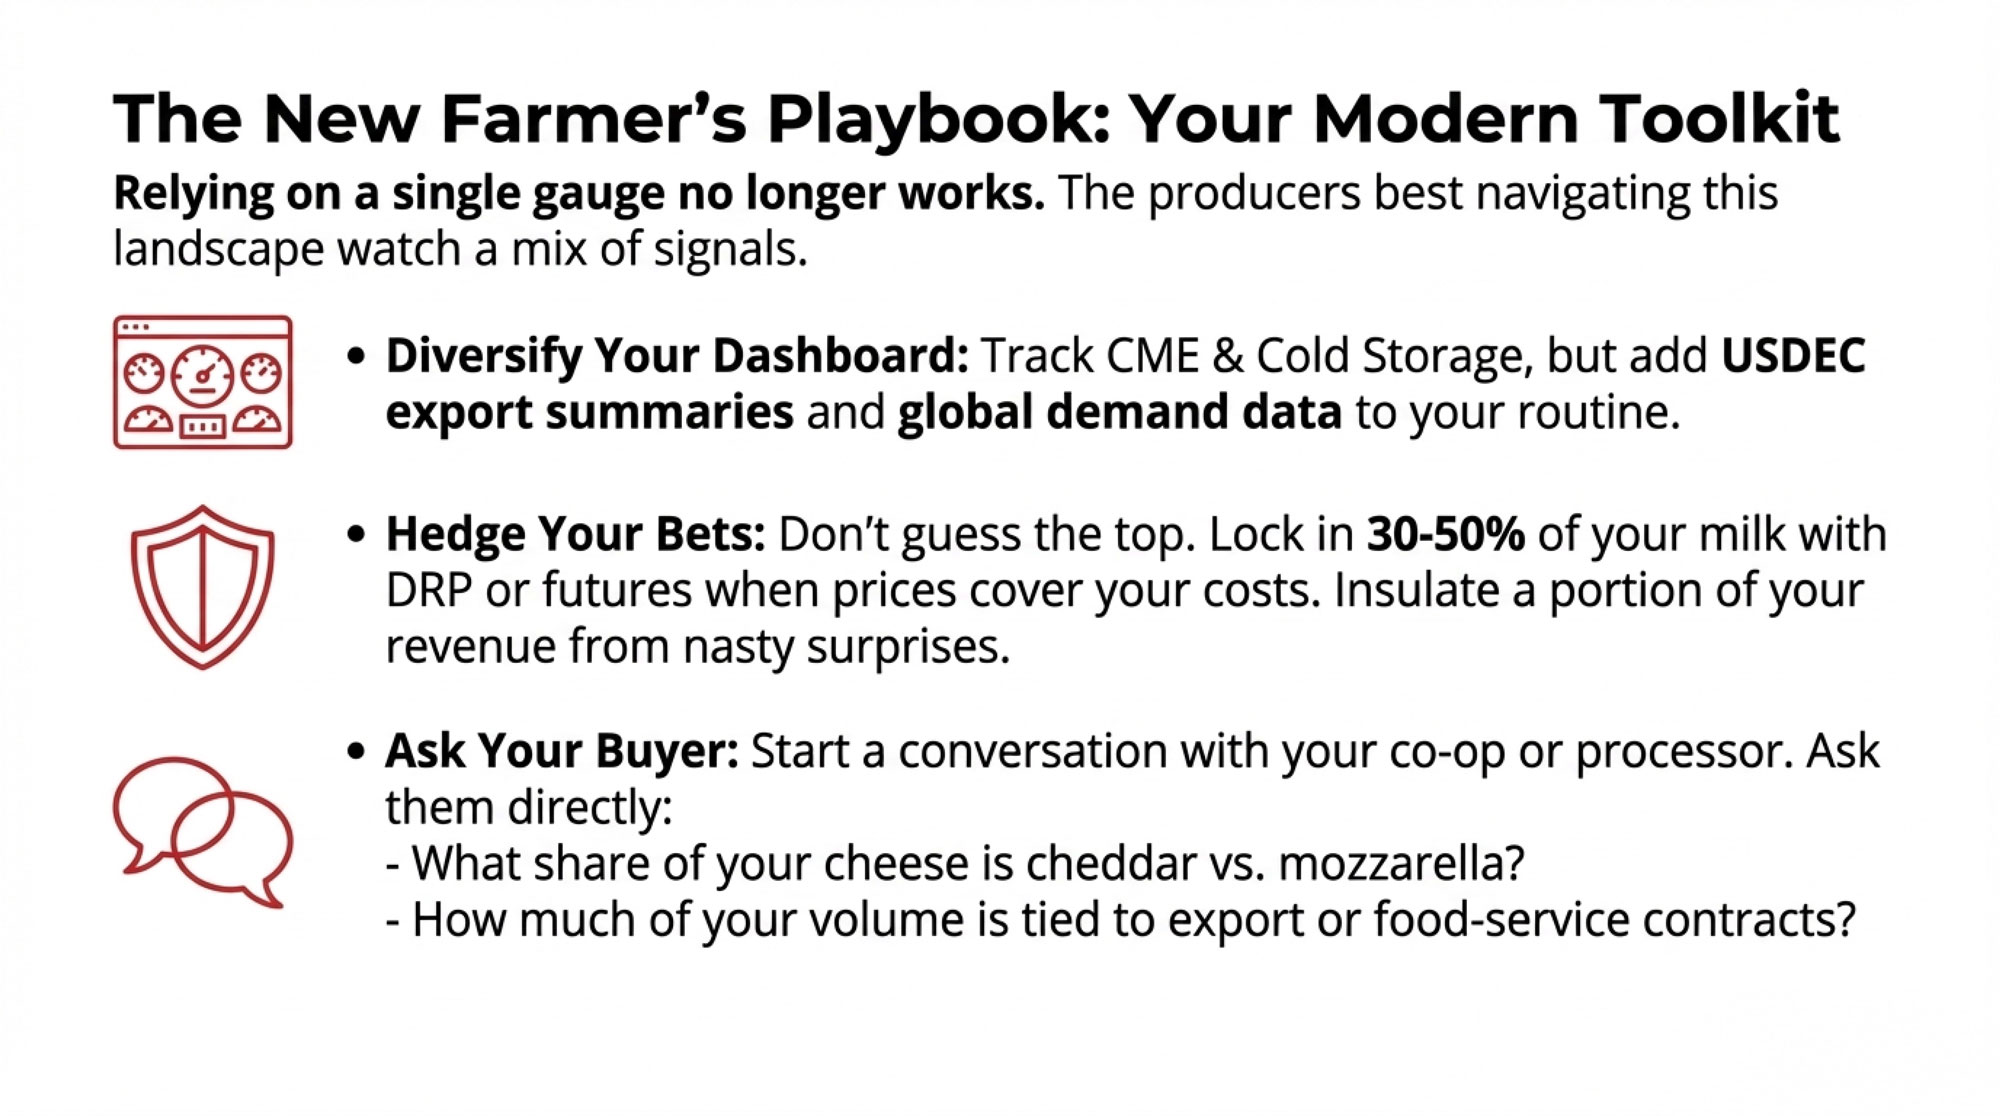
One thing I’ve noticed, and it matches what land‑grant risk‑management programs are teaching, is that relying on a single gauge doesn’t work very well anymore. Watching only cheese production, or only Cold Storage, or only the Class III board is a good way to be surprised. The producers who seem most comfortable navigating this changing landscape tend to watch a mix of signals—USDA Milk Production and Dairy Products reports, Cold Storage updates, USDEC and USDA export statistics, plus the information they get from their buyers and co‑ops.
That’s why much of the extension work focuses on partial hedging strategies rather than “all in” or “all out” approaches. The idea isn’t to guess the exact top or bottom; it’s to lock in a portion of your milk—often something in that 30% to 50% range—for a few months ahead when futures or Dairy Revenue Protection coverage levels line up with your cost structure, and leave the rest open to the market. That way, a nasty price surprise doesn’t hit 100% of your volume, but you’re not completely locked into a price that might look too low if markets rally later. For a 500‑cow herd shipping around 80,000 pounds a month, covering even a third of that volume means several hundred hundredweights are insulated if Class III falls apart for a few weeks, which can be the difference between a bad month and a really rough one.
Of course, none of those tools are free. Hedging carries costs and margin requirements, and stepping up your risk‑management program means investing more time in tracking markets and working with advisors. Improving fresh cow management and the transition period requires investing time, training, and often capital in facilities, rations, or monitoring, as on-farm case studies and extension bulletins regularly point out. But when you line those costs up next to the revenue swings that come with a volatile Class III and the kind of structural shifts we’re seeing in cheese markets, a lot of farms are deciding it’s worth putting at least some of those tools to work.
On top of price tools, butterfat performance and protein yield are still right at the center of most advisory conversations, and for good reason. Research and on‑farm work from programs such as Penn State, Cornell, and Wisconsin consistently show that better transition‑period management, less stress on fresh cows, and careful ration balancing are among the most reliable levers you’ve got for improving components and overall milk value. You can’t control where CME cheddar settles next week. You absolutely can influence how your cows come through calving, what their transition period looks like, and how efficiently they convert feed into fat and protein.
It’s also worth talking directly with your buyer or co‑op. Producers who ask questions such as, “Roughly what share of your cheese output is cheddar versus mozzarella or other styles?” and “How much of your volume is tied to export programs or food‑service contracts?” usually walk away with a much clearer picture of what drives their basis and premiums. You’re not asking them to hand over their business plan; you’re trying to understand whether your milk check is more exposed to CME cheddar swings, changing export demand, or shifts in domestic retail and food‑service patterns.
If you want to get even more practical, here are a few simple starting points producers are using:
- If you’re a Midwest farm heavily tied to cheddar:
Keep a close eye on CME block and barrel prices, USDA Cold Storage cheese stocks, and Class III futures, and ask your co‑op how much of their output is still commodity cheddar versus mozzarella or specialty styles. That helps you judge how quickly a cheddar price break could hit your basis compared with a neighbor shipping to a plant with a more mixed product portfolio. - If you’re shipping to a Western plant focused on mozzarella and exports:
Add USDEC export summaries, global cheese price comparisons, and port or logistics updates to your watch list, and ask how much of your milk ends up in export programs under long‑term contracts. That gives you a better handle on how trade disputes, freight issues, or foreign demand swings might show up in your mailbox, even when domestic stocks look comfortable. - If you’re a smaller Northeast or grazing‑based operation:
Track Class I, III, and IV prices plus regional blend prices, and talk with your buyer or co‑op about how their product mix—fluid, regional brands, or specialty cheese—feeds back into your over‑order premiums. That helps you see whether your check is more sensitive to local fluid demand or to the same cheese and export forces driving the national conversation.
For co‑ops and processors, the same November data push in a similar direction. Channel mix is now a strategic decision, not just an operational detail. Knowing how much of your product mix goes into retail grocery, food‑service, industrial ingredients, and export programs helps you decide which data streams you absolutely need on your dashboard—Cold Storage, Dairy Market News, Global Dairy Trade auctions, USDEC export statistics, scanner data for retail cheese and butter, and even global futures where appropriate. It’s why more co‑ops and plants are building simple internal dashboards that put USDA production and inventory reports next to export volumes and global price indices, something extension economists and industry consultants have been encouraging in board‑room and planning sessions.
The Bottom Line
What’s encouraging in all this is that the system isn’t broken; it’s evolving.
We’ve got more milk and more cheese than we did a year ago, according to the USDA’s Milk Production and Dairy Products reports for November 2025. Butterfat performance and protein levels have improved on many farms after years of work on genetics, fresh-cow management, and the transition period, a trend reflected in both research and industry commentary. U.S. cheese exports have pushed past the billion‑pound mark for the first time, with Mexico and a growing list of other countries playing major roles, as documented by USDEC‑linked trade summaries. New plants worth billions of dollars are coming online, many of them designed to make mozzarella and other value‑added cheeses along with powders and concentrated components for both domestic and global markets.
So when someone says, “Forty‑four million pounds of cheese disappeared in November,” you know the cheese didn’t vanish. It moved through channels that our old mental shortcuts don’t always capture very well—contract‑driven mozzarella destined for pizza ovens, record‑level export programs, fast‑turn food‑service and ingredient sales, and value‑added dairy products that don’t pile up in the Cold Storage bins we all grew up watching.
If you keep that bigger picture in mind while you’re checking USDA reports, talking with your buyer, and planning your own risk and herd management, you’ll be in a better spot to decide what to lock in, what to leave open, and where to invest your time and dollars—whether that’s tightening transition‑cow protocols, tweaking rations to support stronger butterfat performance, or asking a few more pointed questions at your next co‑op meeting about where your milk really goes once it leaves the yard.
Key Takeaways:
- Production up, stocks flat: November 2025 cheese hit 1.22 billion pounds (+5.9% YoY), yet Cold Storage didn’t set new records—roughly 40-50 million pounds moved through exports, contract mozzarella, and fast-turn channels that bypass traditional tracking.
- Exports are a second-home market: U.S. cheese exports topped 1 billion pounds in 2024 for the first time; Mexico took 38% of the volume, absorbing supply before it piles up in storage.
- CME cheddar no longer tells the whole story: Class III reflects a shrinking slice of total U.S. cheese—if Cold Storage and block prices are your only signals, you’re flying partially blind.
- Regional exposure varies: Midwest cheddar-heavy farms still need CME and Cold Storage; Western and export-linked operations should weight USDEC data and global demand equally.
- Control what you can: butterfat performance, transition-cow protocols, partial hedging (30-50%), and knowing where your milk actually goes matter more than guessing where cheddar will settle next week.
Learn More
- Why Milk Components Are Your Best Friend Now (and Why Chasing Volume is Yesterday’s News) – Arms you with the math to pivot from volume to value. This breakdown reveals how hitting 4.2% butterfat targets delivers an immediate $2,200 daily revenue boost for mid-sized herds, turning your bulk tank into a high-margin cash machine.
- 2025’s Dairy Dilemma: Record Exports, Falling Checks, and What Every Producer Must Decide Next – Exposes the structural shift behind the “Asian processing pivot” and record exports. This analysis prepares you for a market where global demand is evolving, ensuring your operation isn’t blindsided by the disconnect between warehouse stocks and pricing.
- Genetic Revolution: How Record-Breaking Milk Components Are Reshaping Dairy’s Future – Delivers the blueprint for the 2025 genetic reset that is redefining herd profitability. This deep dive into shifting Net Merit weights reveals how to breed the high-component, feed-efficient cow required to dominate the next decade’s market.
Complete references and supporting documentation are available upon request by contacting the editorial team at editor@thebullvine.com.
Learn More
- Why Milk Components Are Your Best Friend Now (and Why Chasing Volume is Yesterday’s News) – Arms you with the math to pivot from volume to value. This breakdown reveals how hitting 4.2% butterfat targets delivers an immediate $2,200 daily revenue boost for mid-sized herds, turning your bulk tank into a high-margin cash machine.
- 2025’s Dairy Dilemma: Record Exports, Falling Checks, and What Every Producer Must Decide Next – Exposes the structural shift behind the “Asian processing pivot” and record exports. This analysis prepares you for a market where global demand is evolving, ensuring your operation isn’t blindsided by the disconnect between warehouse stocks and pricing.
- Genetic Revolution: How Record-Breaking Milk Components Are Reshaping Dairy’s Future – Delivers the blueprint for the 2025 genetic reset that is redefining herd profitability. This deep dive into shifting Net Merit weights reveals how to breed the high-component, feed-efficient cow required to dominate the next decade’s market.
 The Sunday Read Dairy Professionals Don’t Skip.
 The Sunday Read Dairy Professionals Don’t Skip.
Every week, thousands of producers, breeders, and industry insiders open Bullvine Weekly for genetics insights, market shifts, and profit strategies they won’t find anywhere else. One email. Five minutes. Smarter decisions all week.