That’s real money. But my plant is on the closure list.’ The €185,000 decision 16,000 dairy farmers face on December 16.
EXECUTIVE SUMMARY: On December 16, roughly 16,000 dairy farming families face a vote they can’t take back: merge Milcobel into FrieslandCampina and collect €185,000+ in loyalty bonuses—or walk away and keep the flexibility to leave. For some farmers, the merger offers genuine upside: scale, technical resources, and substantial payments for operations near retained facilities with sustainability practices already in place. For others, plant closures could add thousands in annual hauling costs, and Foqus planet compliance ranges from minor documentation to six-figure capital investments. History provides both warnings and encouragement—DFA’s consolidation brought in $290 million in antitrust settlements, while Irish co-op mergers helped farmers reach export markets they couldn’t access on their own. Geography and current infrastructure determine which outcome you’re likely to see. This analysis provides the framework to run your own numbers, because the right answer depends on your specific situation—and once you vote yes, you can’t vote no later.
For one Milcobel member near Antwerp, the December 16 vote isn’t about spreadsheets. It’s about whether her family’s 80-year-old dairy operation will still make sense five years from now.
She milks 95 cows on a farm her grandfather started in 1946. Been a Milcobel member for eighteen years. And like thousands of other Belgian and Dutch dairy farmers, she’s got just over a week to decide whether to merge her cooperative into FrieslandCampina—creating what Dairy Reporter is calling a “€14 billion co-op” that would rank among Europe’s largest.
“They’re offering us €8 per hundred kilos to stay three years,” she told me last week, asking that her name not be used because she’s concerned about pushback from cooperative leadership. “That’s real money. But my nearest plant is on the closure list. So what am I actually voting for?”
You know, it’s the kind of question that doesn’t have an easy answer. What’s unfolding in Belgium and the Netherlands isn’t just one cooperative merger—it’s part of a broader consolidation wave reshaping how milk moves from farm to consumer. And the dynamics here offer a useful perspective for dairy producers everywhere, whether you’re milking cows in Flanders, Wisconsin, or New Zealand.
What’s Actually on the Table
Let me walk you through what FrieslandCampina and Milcobel are proposing, because there’s quite a bit of information floating around, and some of it gets confusing.
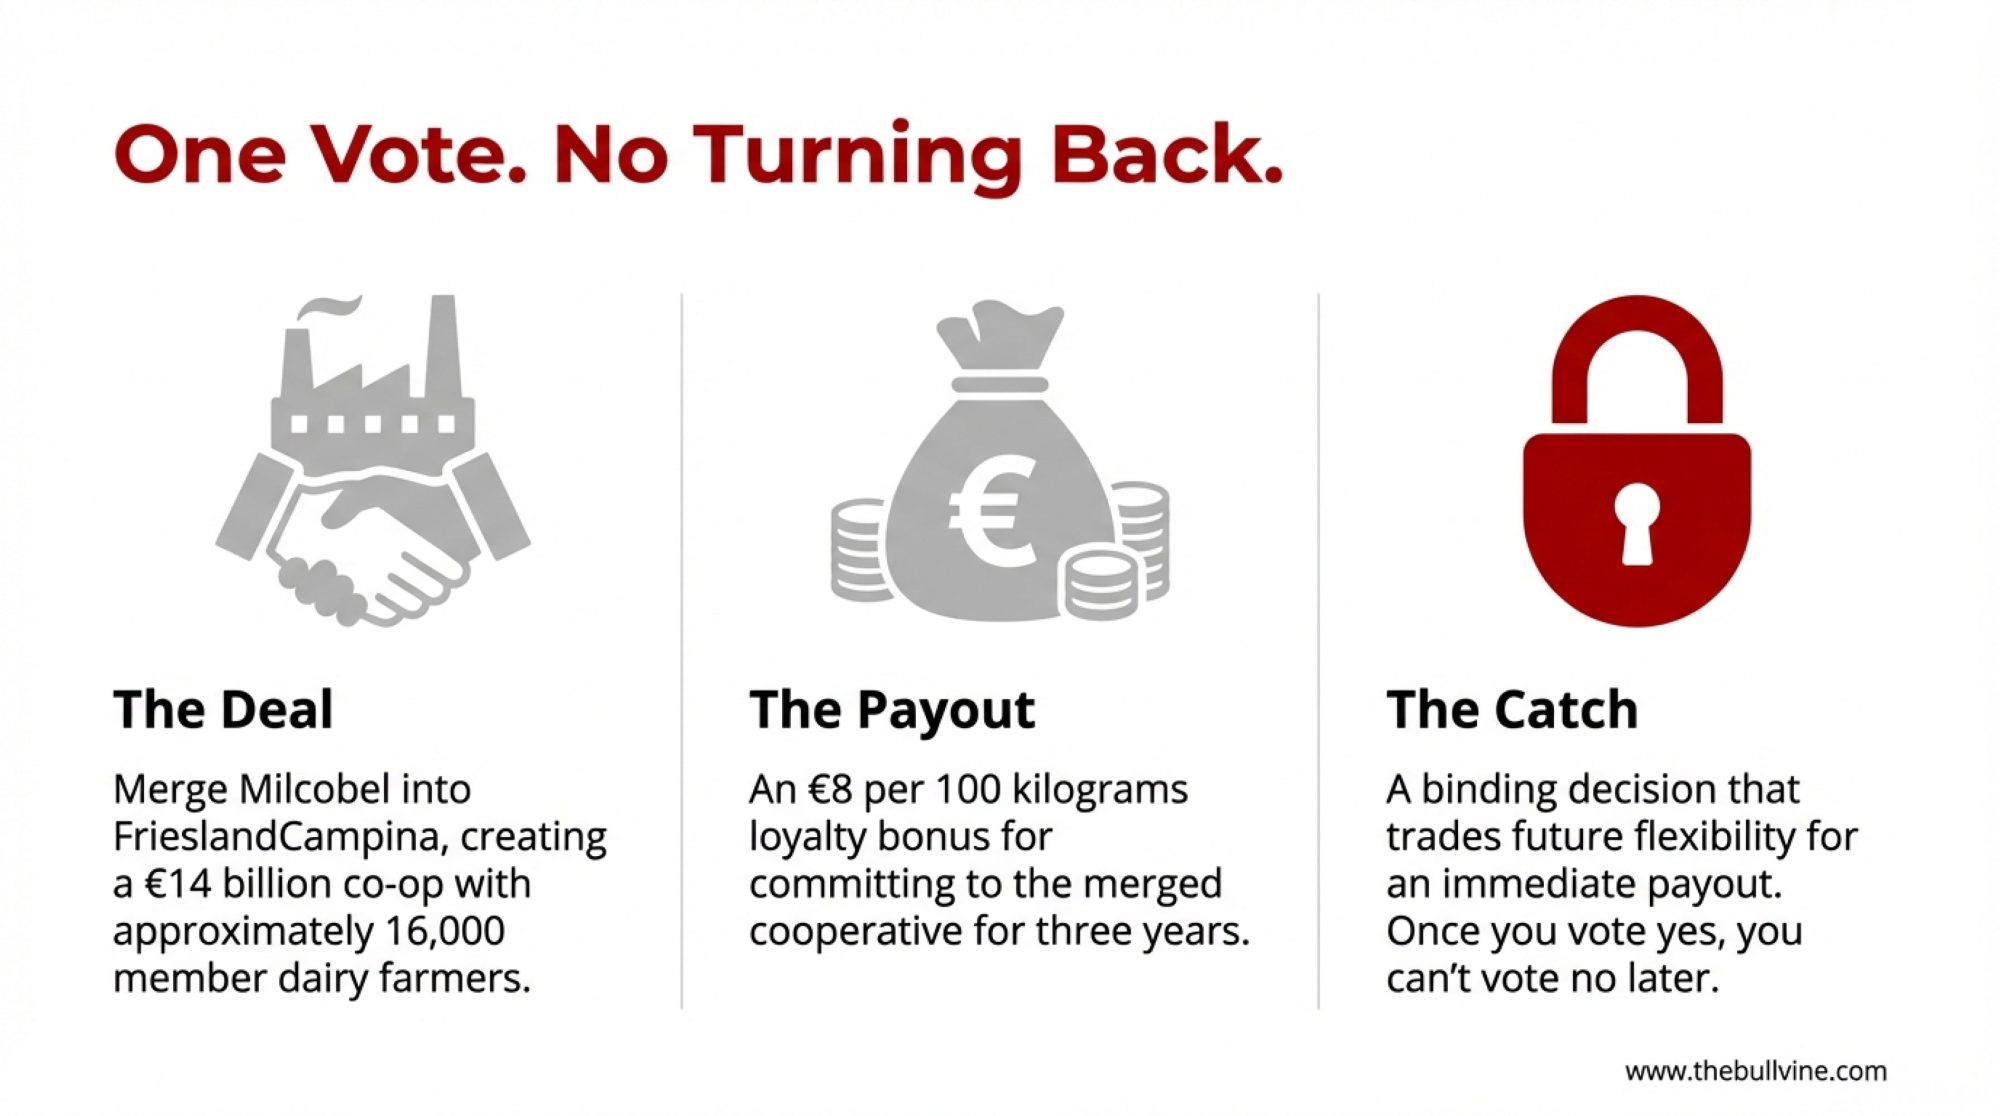
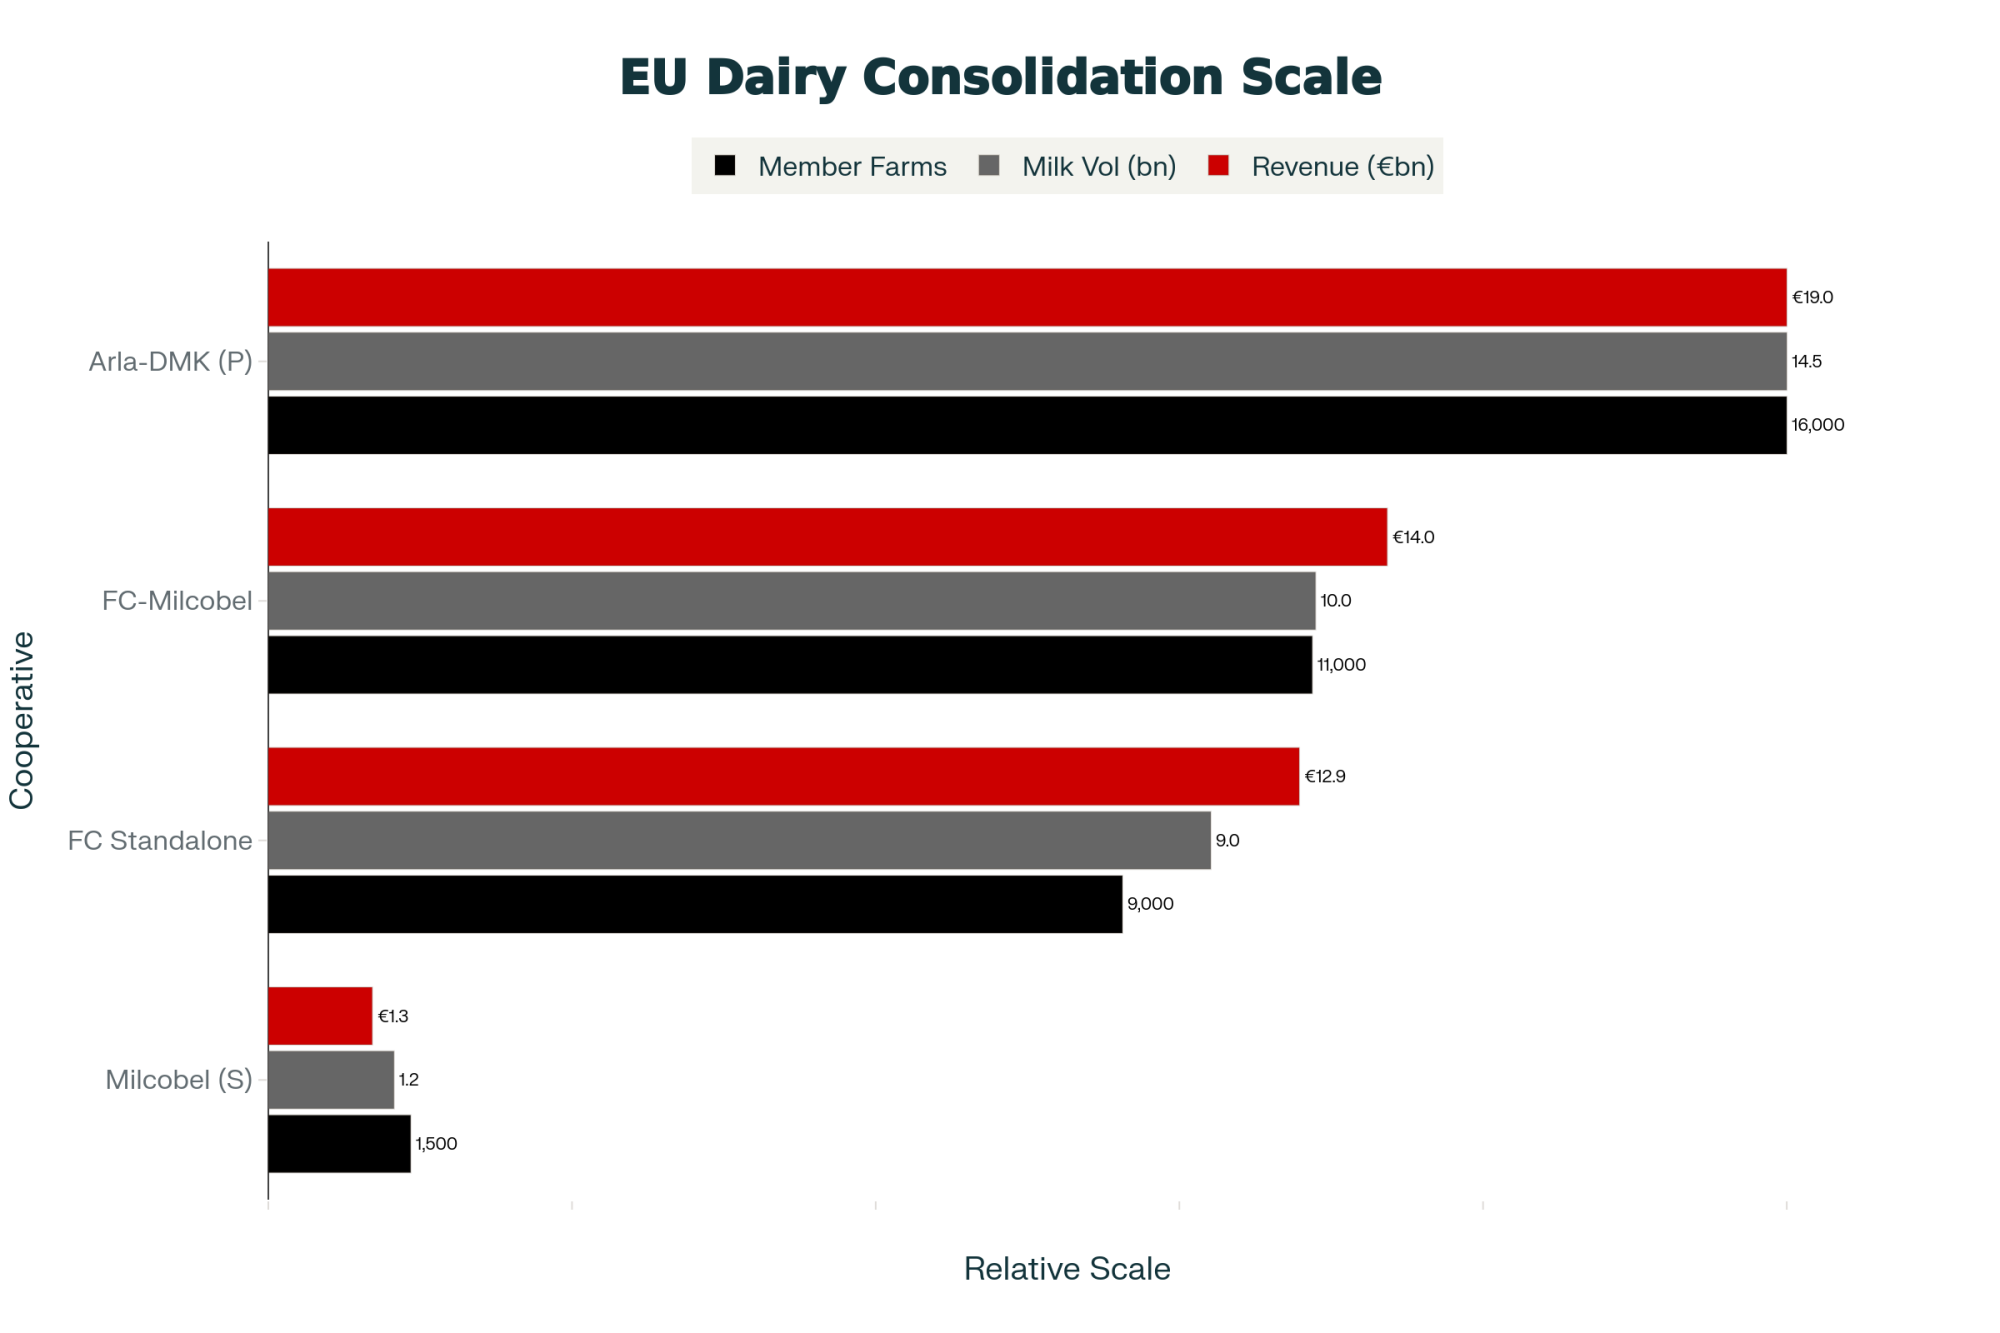
The merger would combine both cooperatives’ member farms into one organization. According to FrieslandCampina’s official announcement from December 2024, we’re talking about approximately 16,000 member dairy farmers processing around 10 billion kilograms of member milk annually. That’s across facilities in the Netherlands, Belgium, Germany, and northern France.
The headline incentive—and this is what most farmers are focused on—is an €8 loyalty bonus per 100 kilograms for farmers who commit to the merged cooperative for three years. Dairy Reporter confirmed these terms in their December 2025 coverage.
But here’s where it gets more complicated. The merger also involves what the proposal calls “network optimization”—consolidating processing facilities to improve efficiency. Several plants have been identified for potential closure or transition, according to reporting from Dairy Reporter and the Dutch publication Veeteelt. And that changes the math considerably depending on where you’re located.
EXAMPLE FARM SCENARIO: Mid-Sized Belgian Operation
| Factor | What It Looks Like |
| Annual production | 760,000 liters |
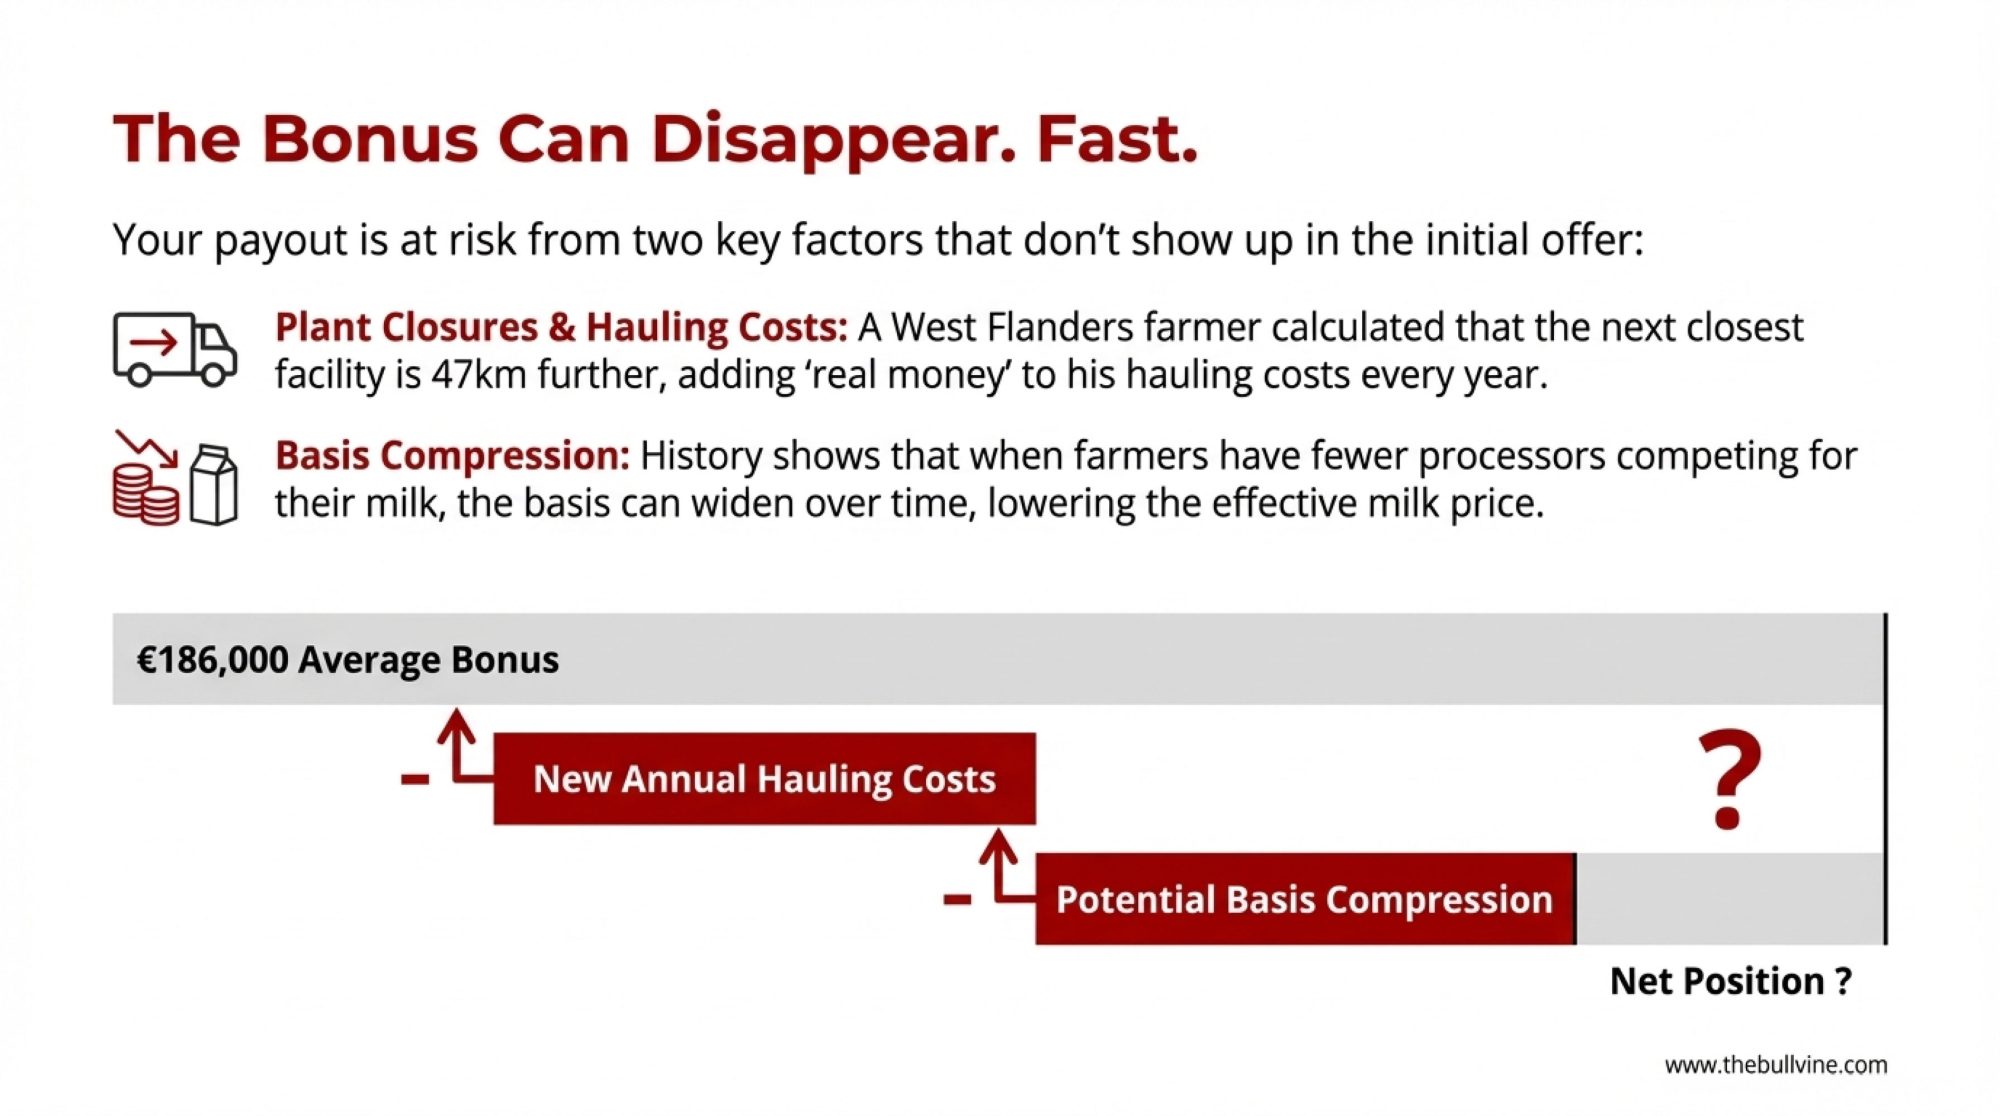
| Three-year loyalty bonus | €186,000 total (about €62,000/year) |
| If the nearest plant closes (+47km hauling) | Significant additional transport costs |
| Potential basis compression | Hard to predict, but historical patterns suggest concern |
| Net position | Depends heavily on your specific situation |
The outcome ultimately comes down to plant-closure decisions and post-merger pricing dynamics.
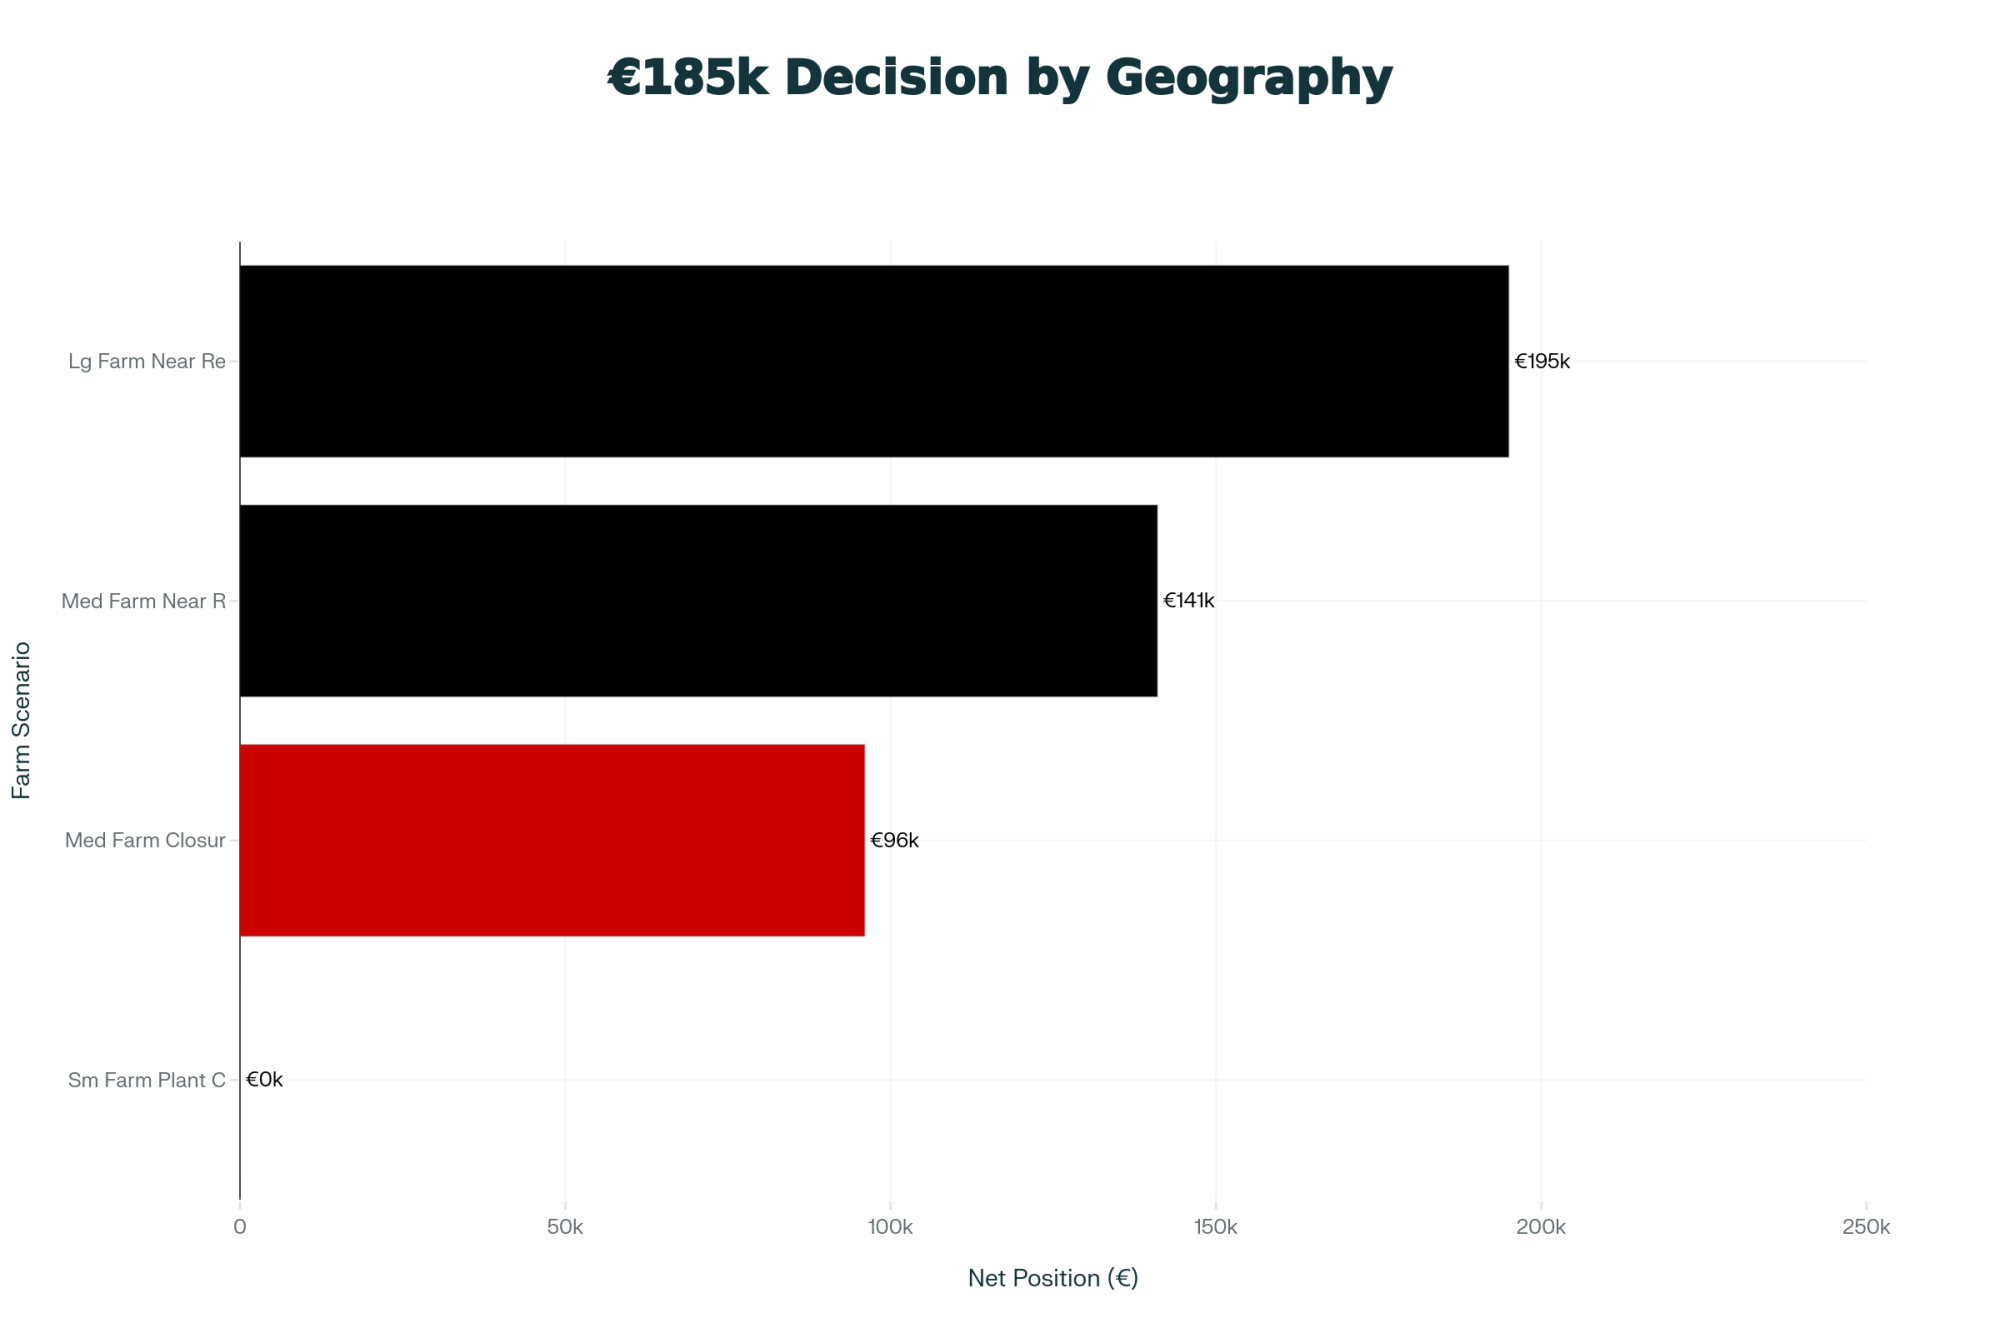
How Geography Shapes the Math
If your current receiving facility remains operational, the merger economics work in your favor. If your nearest plant is closing, you’re looking at a different calculation entirely. And right now, there’s still uncertainty about which facilities fall into which category.
Here’s what we know from previous consolidations—and as many of us have seen, there’s substantial experience with this from the United States and Oceania. Plant closures create real costs for affected farmers. The exact numbers vary quite a bit by region and contract structure, but the pattern is consistent: more distance means more money out of your pocket.
Dr. Marin Bozic, an assistant professor in dairy foods marketing and economics at the University of Minnesota, has extensively studied cooperative pricing dynamics. His work suggests that when farmers have multiple processors competing for their milk, basis stays tight. When options narrow, processors face less price-based competitive pressure. In regions where significant processing capacity has closed, the research indicates the basis can widen over time—sometimes meaningfully.
A farmer from West Flanders, whose nearest plant is on the consolidation list, walked me through his numbers: “The next closest facility is 47 kilometers further. That’s going to add real money to my hauling costs every year. Add potential basis compression, and I’m not sure the bonus covers it.”
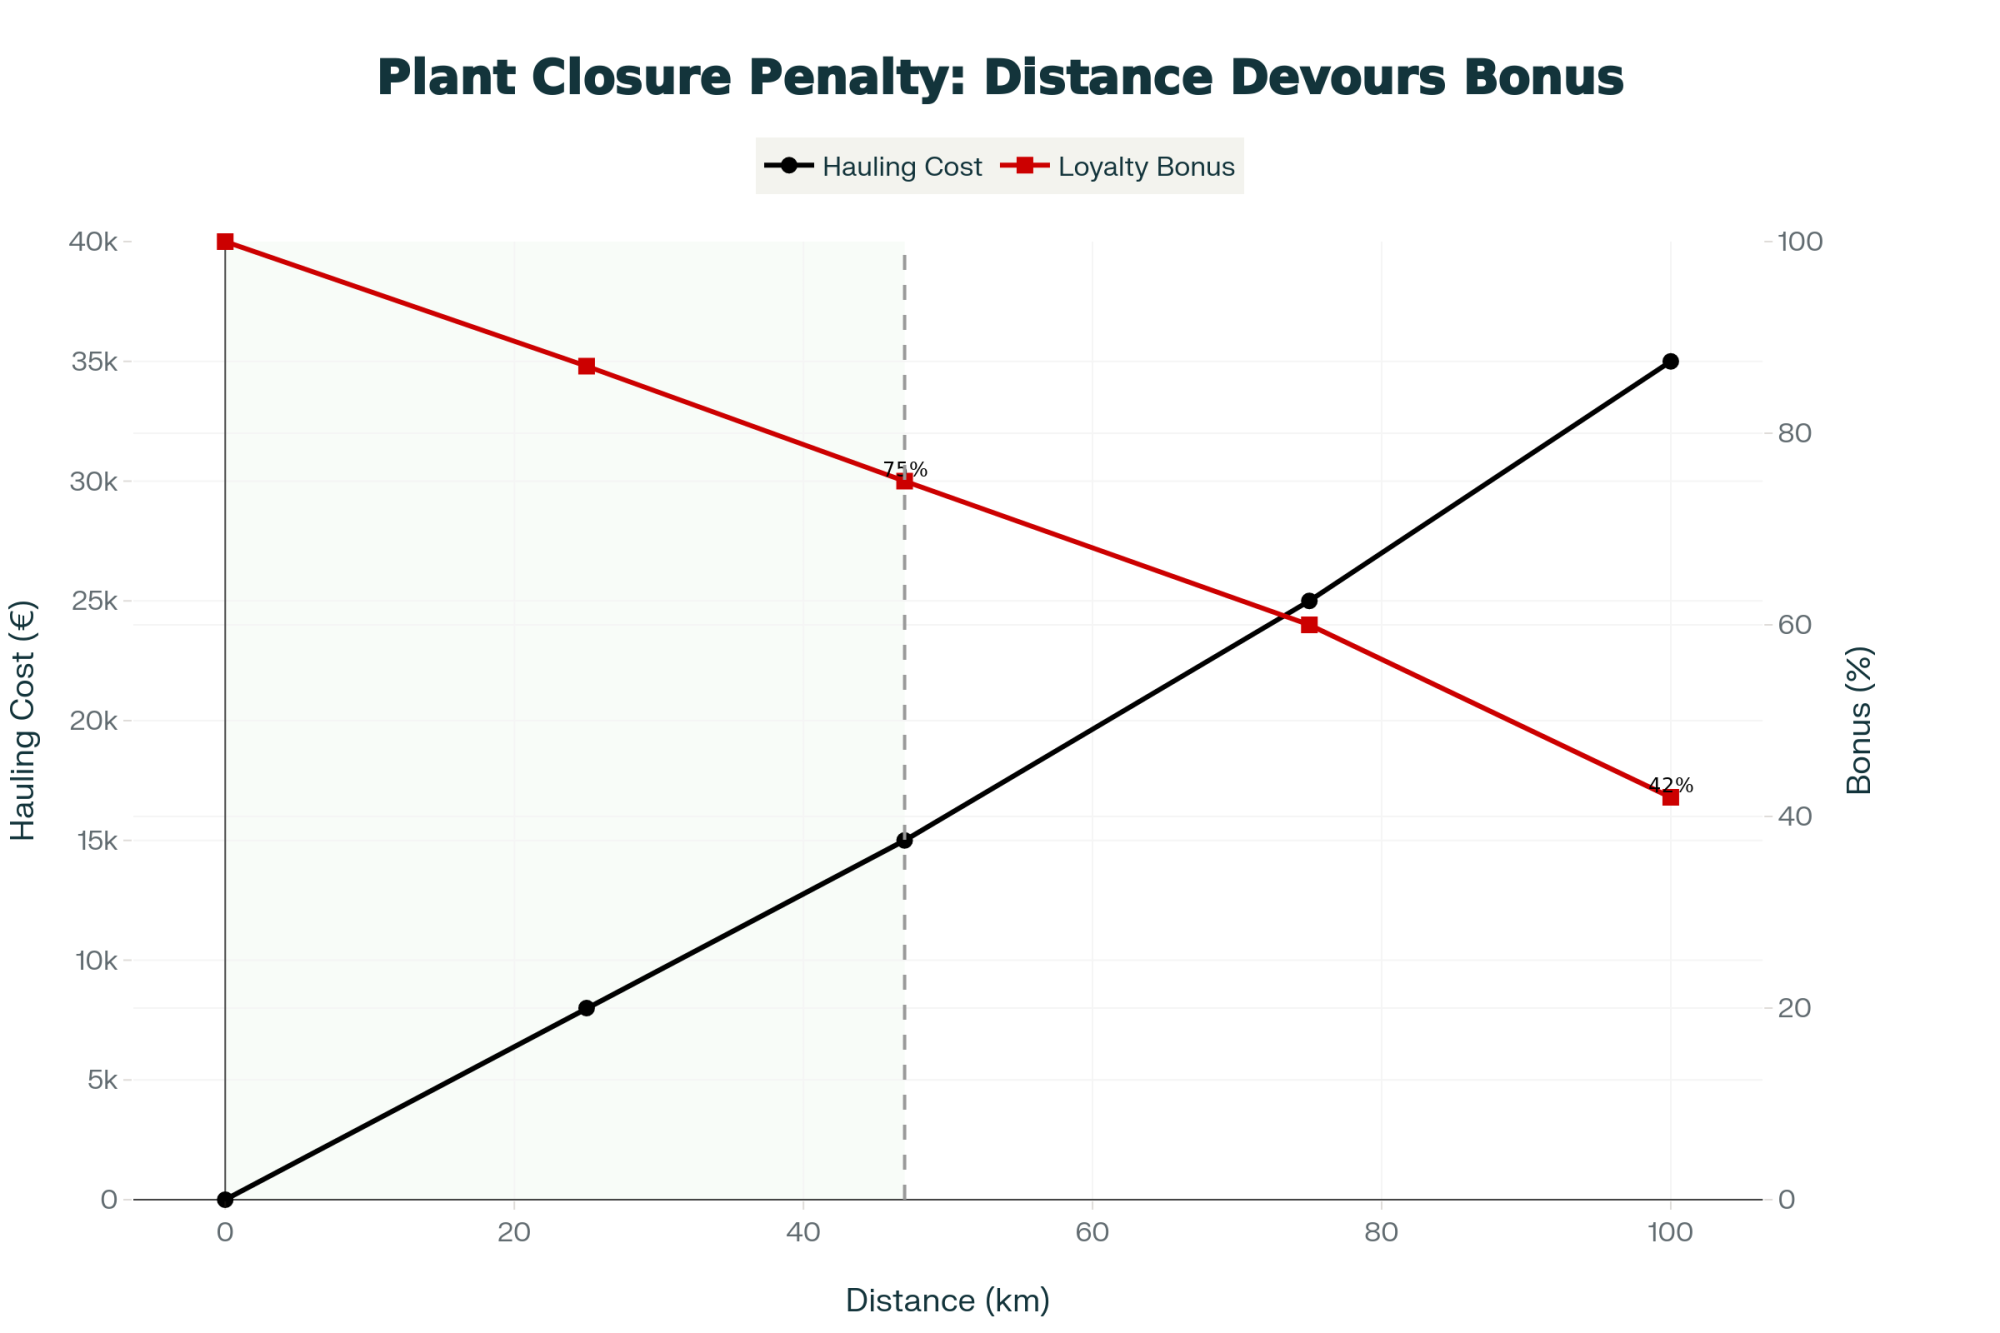
It’s the kind of calculation that keeps you up at night.
Understanding Sustainability Compliance Costs
The merger brings Milcobel farmers into FrieslandCampina’s Foqus planet sustainability program. And you know, this is worth understanding because similar programs are becoming increasingly common across European cooperatives—and many U.S. processors are moving in this direction too.
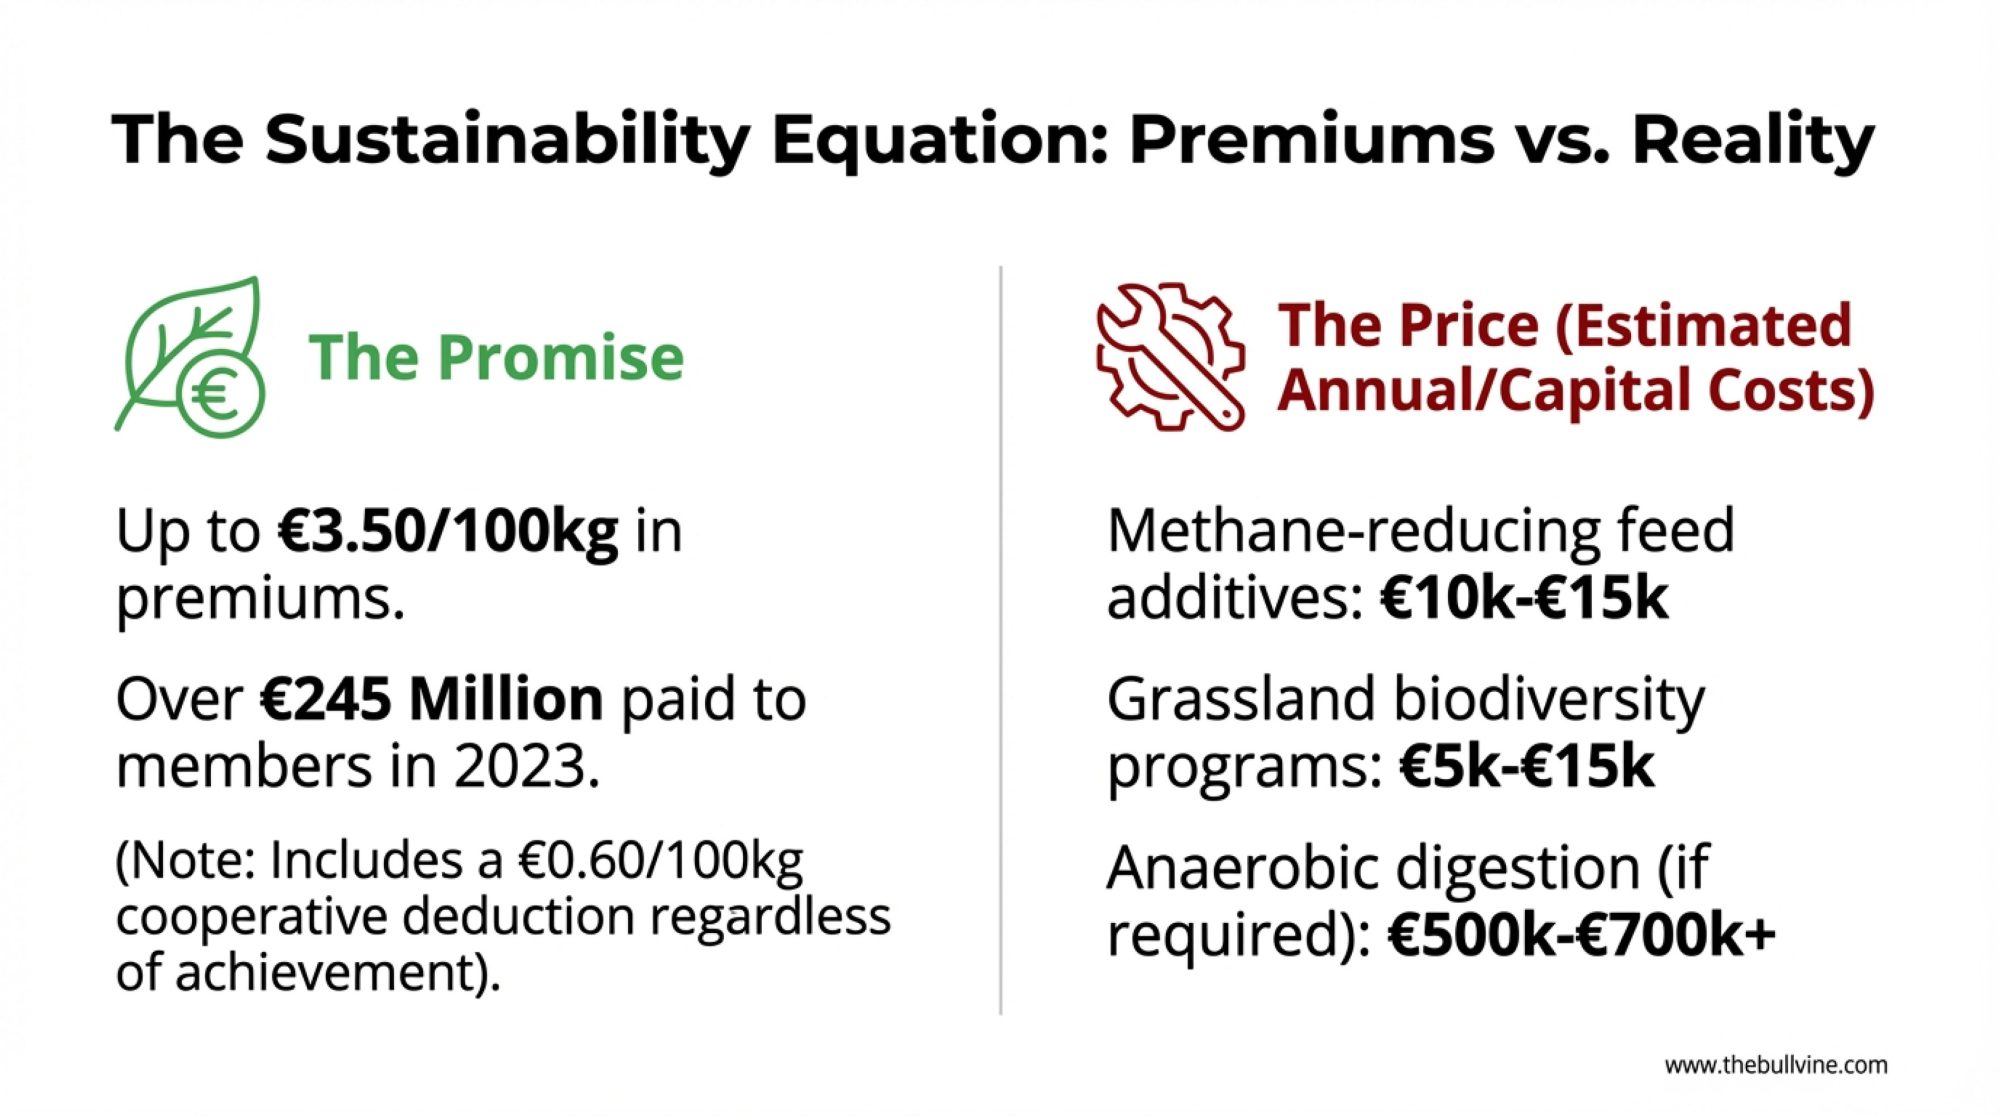
Here’s what’s encouraging. According to FrieslandCampina’s reporting—and FoodBev covered this in June 2024—member farms received over €245 million in sustainability premiums in 2023. That’s real money flowing to farmers who meet the criteria.
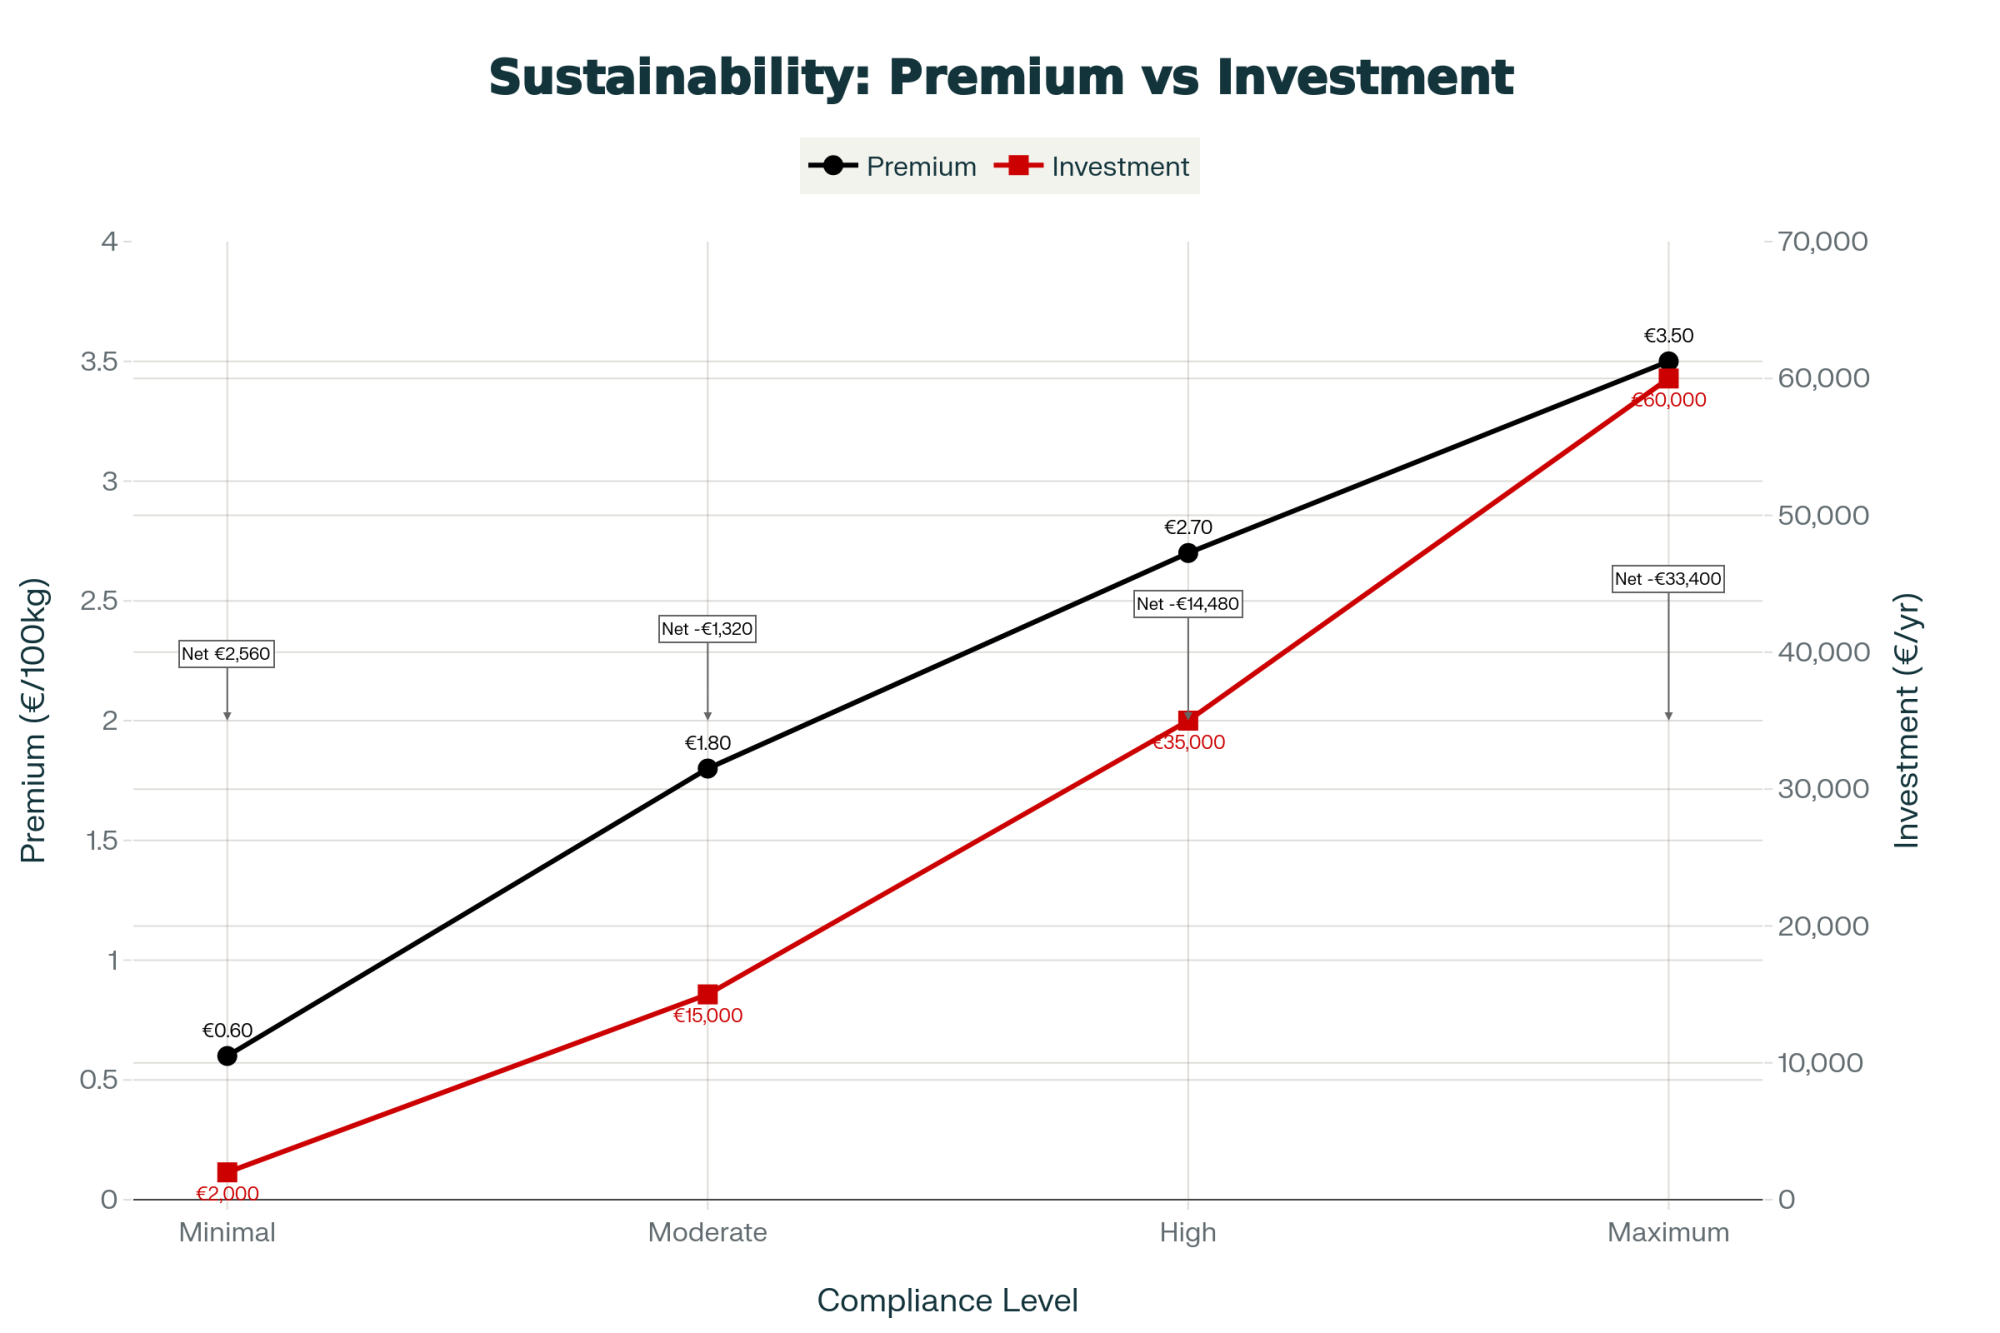
The program offers up to €3.50 per 100kg for full compliance, with a €0.60 per 100kg cooperative deduction regardless of achievement level. Those numbers come directly from FrieslandCampina’s milk price documentation.
What does compliance actually cost? Here’s where things get variable, and I think this deserves more attention than it typically gets in these discussions. Industry estimates and contractor quotes from the Benelux region suggest these rough ranges:
SUSTAINABILITY COMPLIANCE: What Farmers Are Seeing
| Requirement | Estimated Range | Context |
| Methane-reducing feed additives | €10,000-€15,000/year | For a 100-cow herd; pricing is still evolving |
| Grassland biodiversity programs | €5,000-€15,000 | Establishment plus ongoing management |
| Monitoring & documentation | €2,000-€8,000 | May overlap with existing herd management software |
| Anaerobic digestion (if required) | €500,000-€700,000+ | Capital cost; not required for all farms |
These are general industry estimates. Your actual costs will depend on your current infrastructure and practices.
Two Farmers, Two Very Different Situations
A 130-cow operator from the Netherlands told me he’s feeling optimistic: “I’ve already got most of the grassland practices in place, and my vet has us on a solid animal health monitoring program. We track everything from fresh cow management through the transition period. Hitting the premium tiers is realistic for me.”
His neighbor faces a completely different situation—needs a new slurry system just to get started. “We’re looking at the same merger,” the first farmer said, “but the economics couldn’t be more different.”
And that’s really the story of this whole thing, isn’t it? Same vote, vastly different implications depending on where you stand.
What Global Patterns Tell Us
One thing I’ve noticed covering dairy consolidation over the years: the patterns tend to repeat across regions. Understanding what’s happened elsewhere offers useful context—though not necessarily predictions—for farmers weighing this decision.
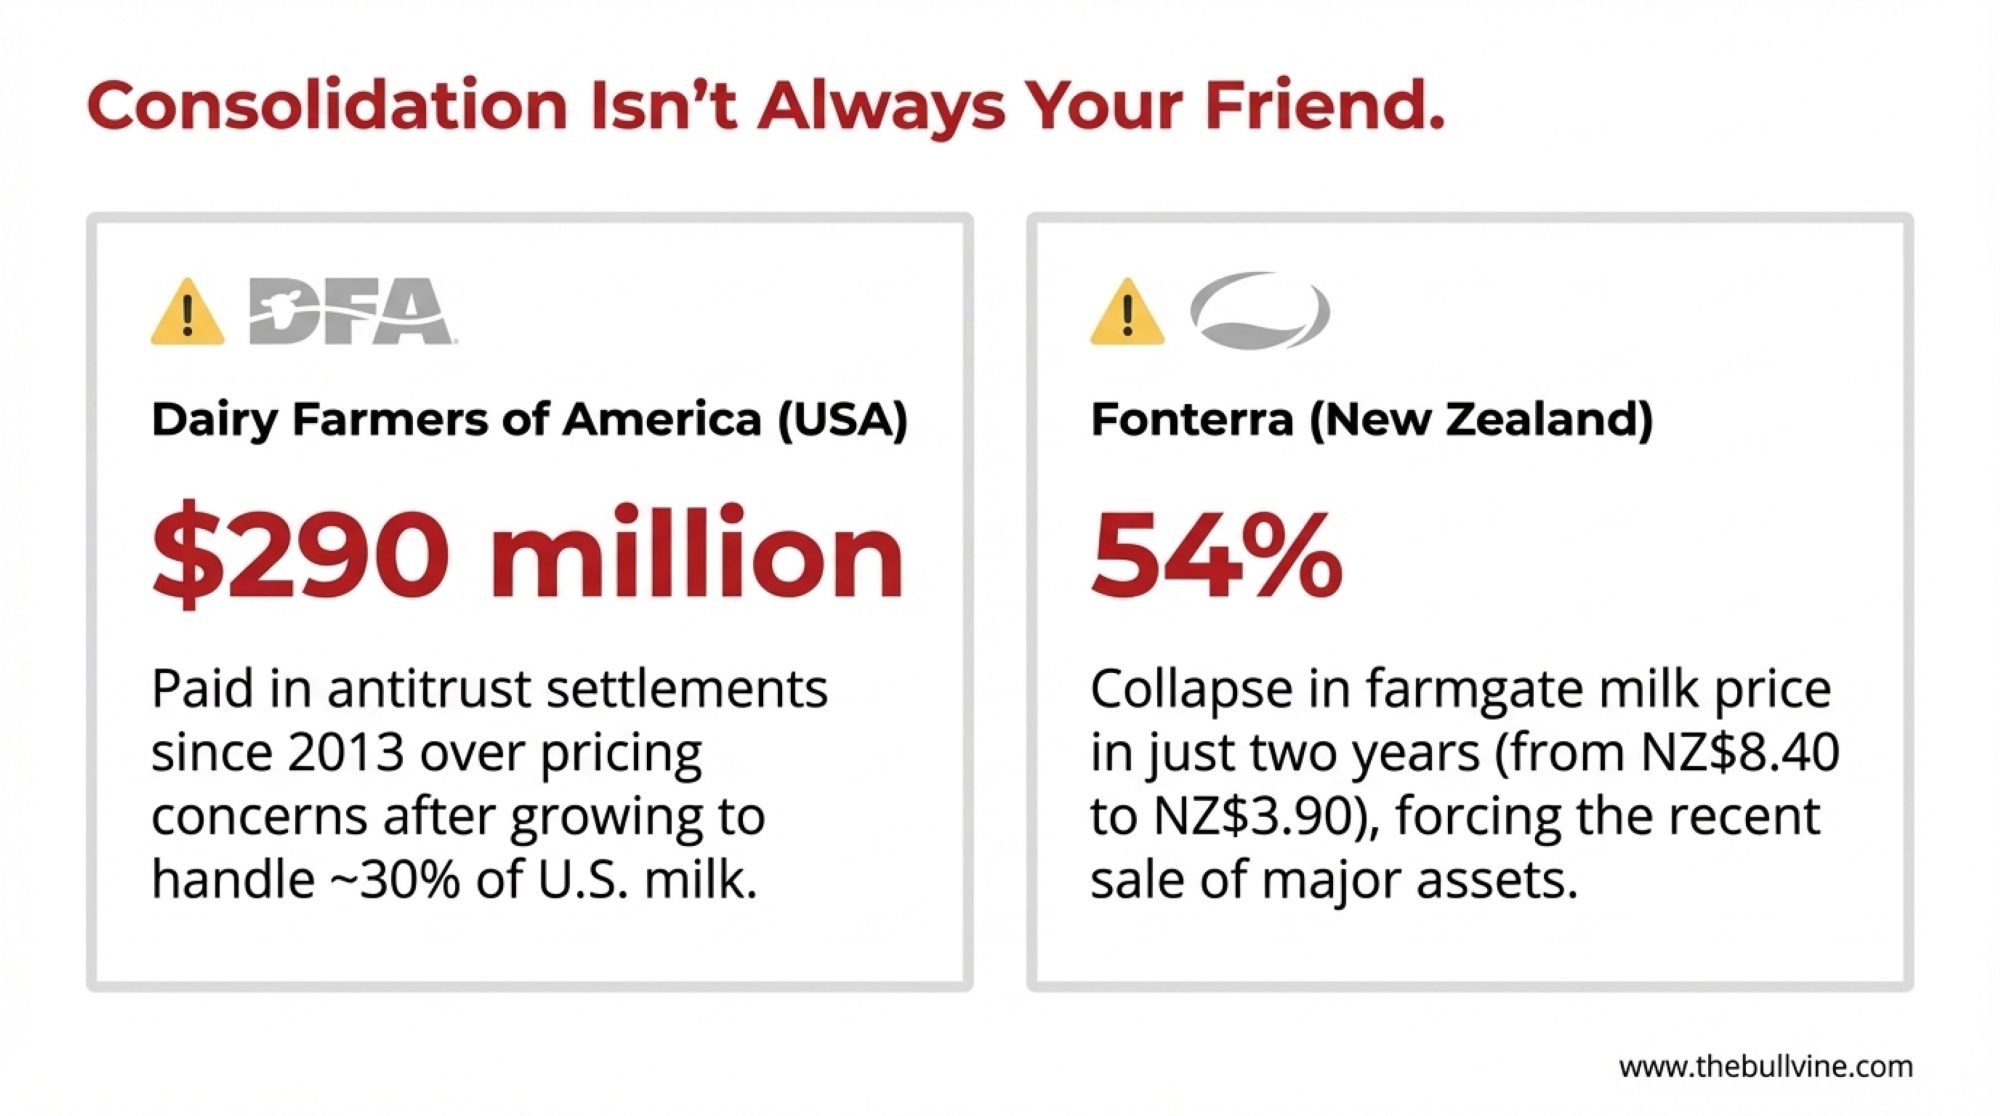
Dairy Farmers of America grew substantially in 2020 when they acquired 44 processing plants from bankrupt Dean Foods for $433 million, as Dairy Herd reported at the time. They now handle roughly 30% of U.S. milk production.
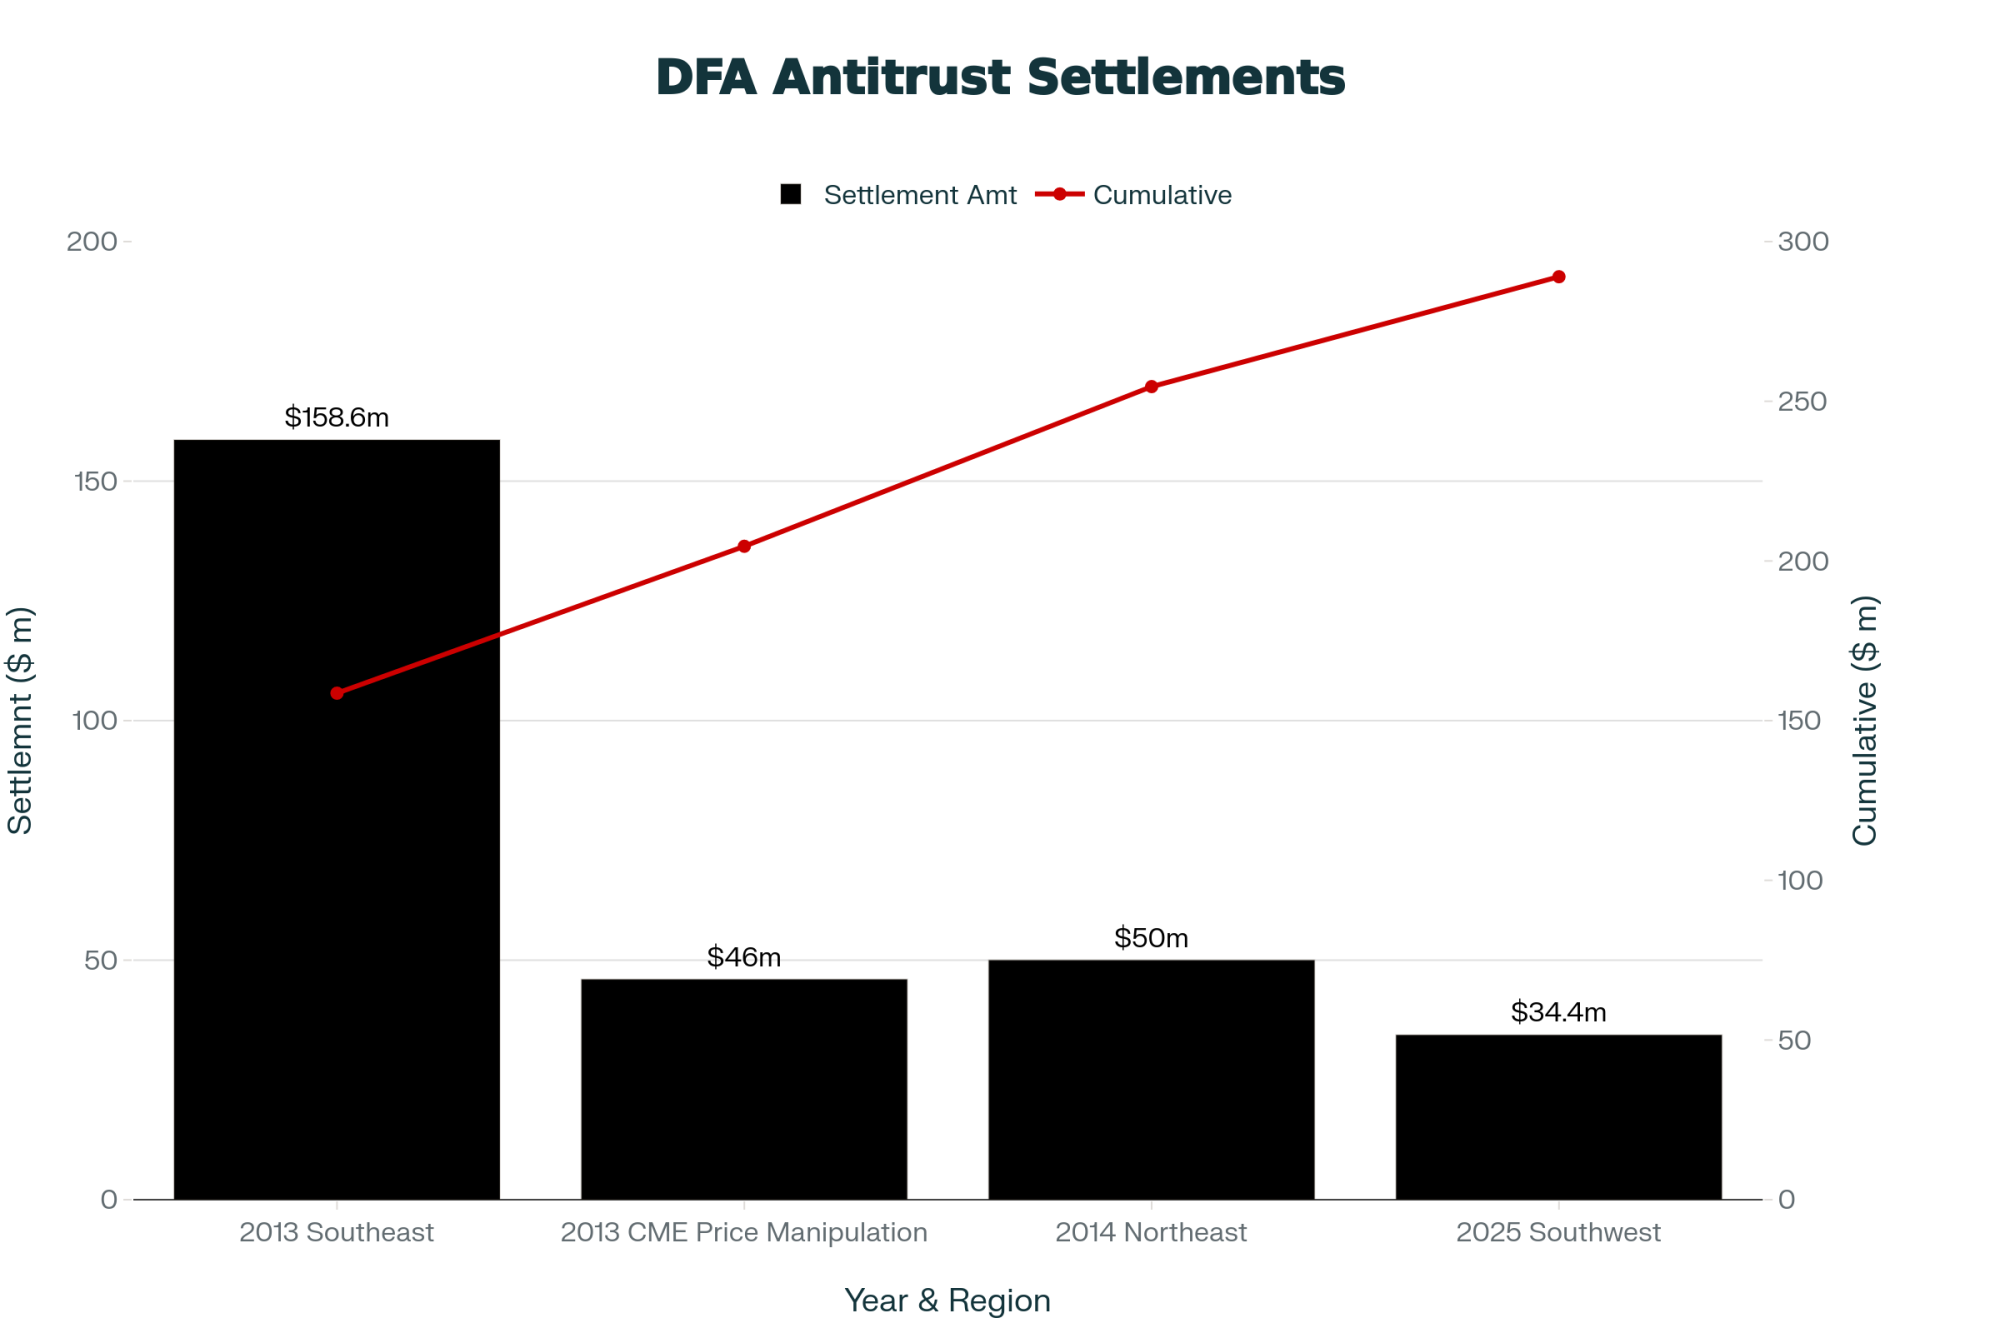
The legal record is worth knowing about. DFA has paid approximately $290 million in antitrust settlements since 2013:
| Settlement | Amount | What Happened |
| Southeast (2013) | $158.6 million | Farm and Dairy and Hoard’s Dairyman covered the court approval |
| Northeast (2014) | $50 million | Confirmed by Dairy Reporter and the National Agricultural Law Center |
| CME price manipulation (2013) | $46 million | Dairy Reporter reported on this one |
| Southwest (2025) | $34.4 million | Received preliminary court approval in August—DFA contributing $24.5 million, Select Milk Producers paying $9.9 million |
DFA settled each case without admitting wrongdoing—that’s standard legal practice. But the payments themselves tell you that regulators and courts found the concerns substantial enough to warrant significant compensation.
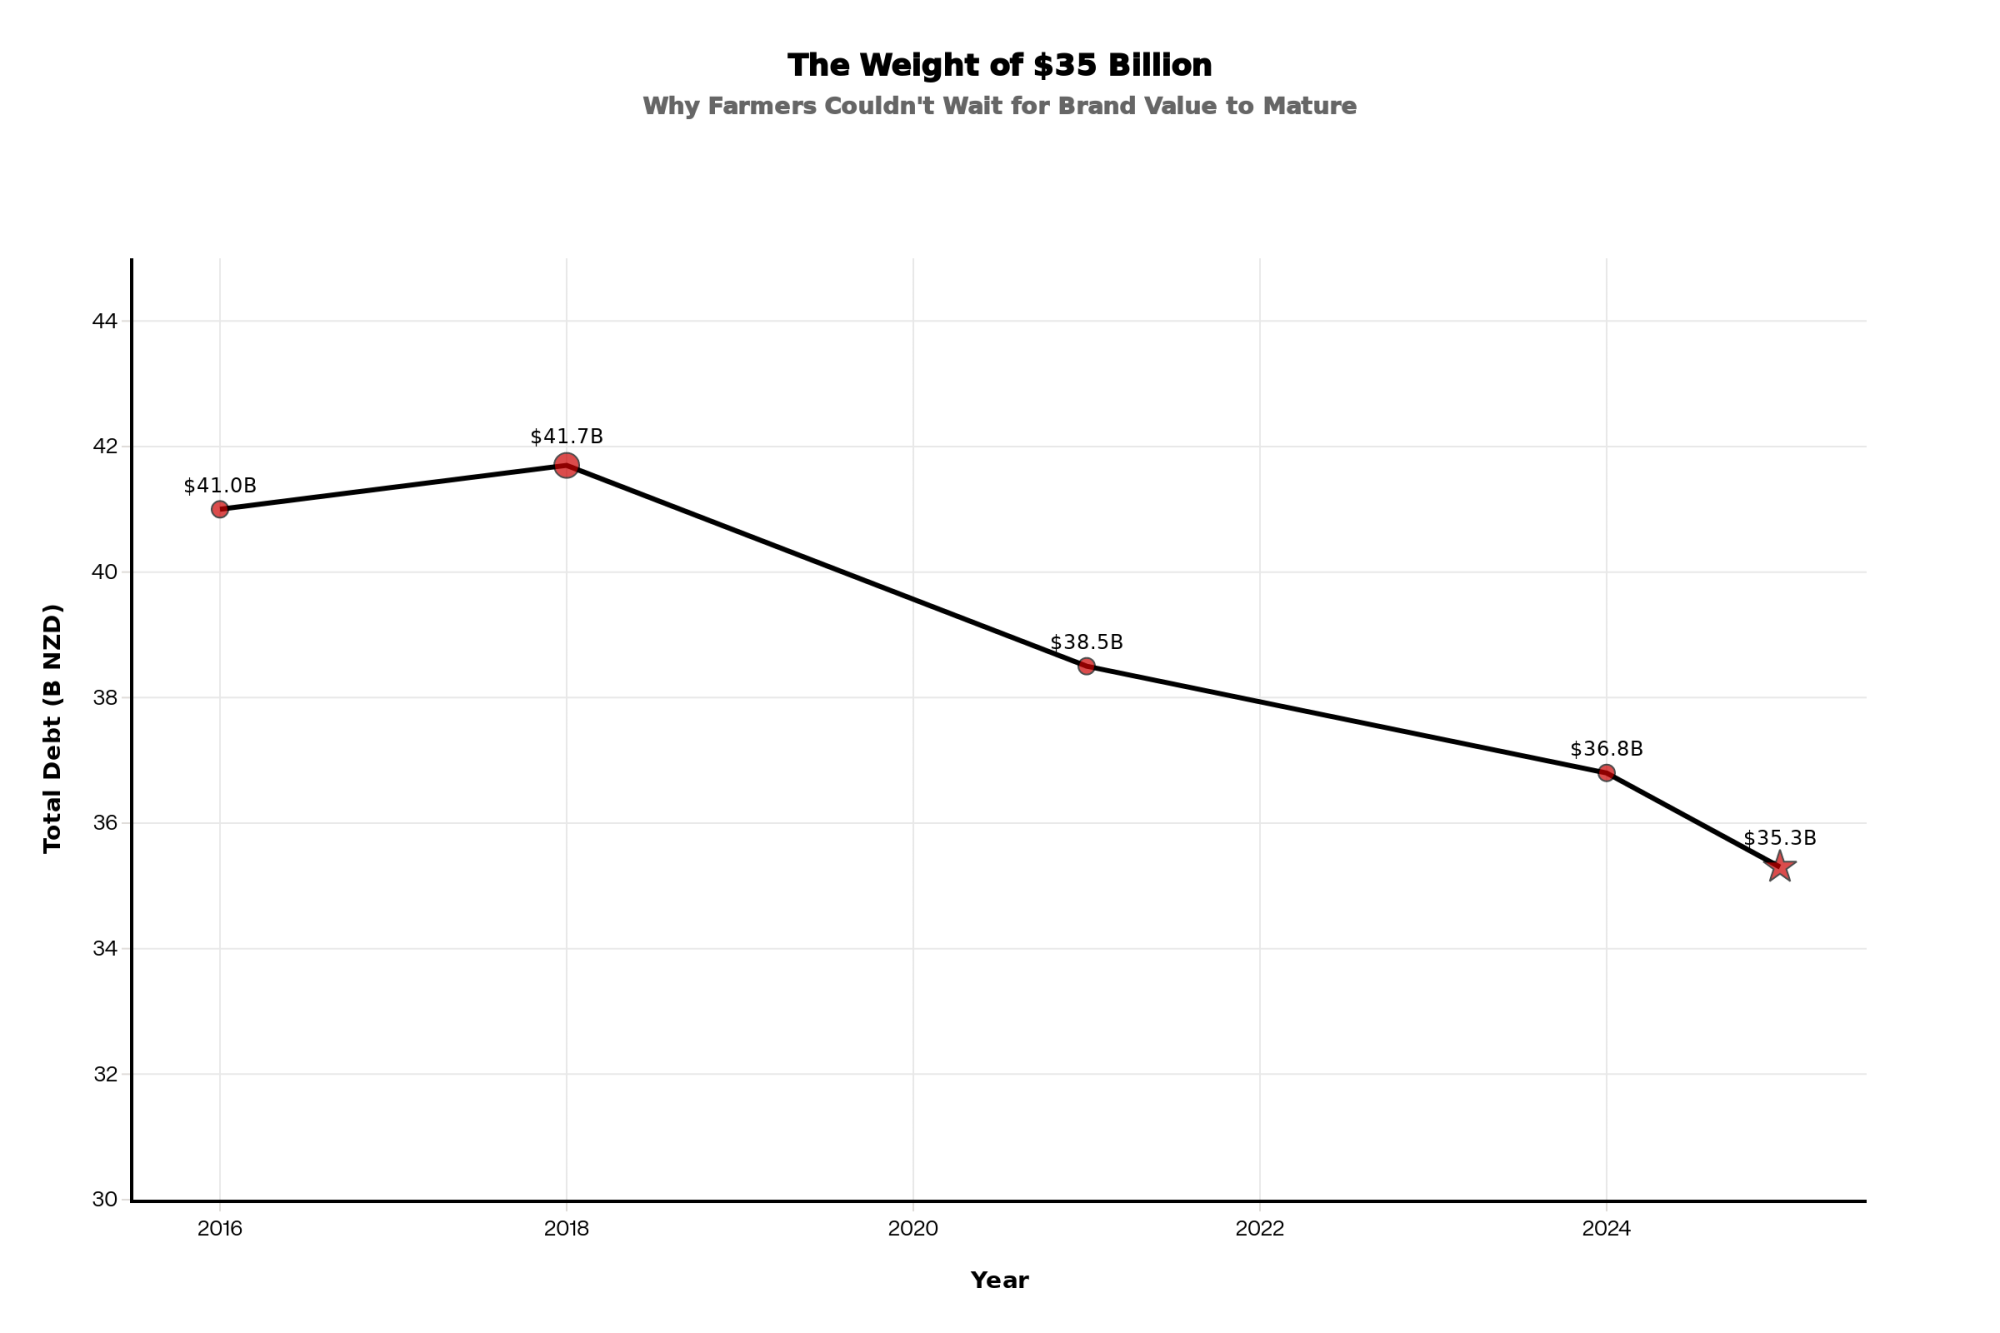
Fonterra in New Zealand offers another data point. Their farmgate payments dropped from a record NZ$8.40 in the 2013-14 season to NZ$3.90 by 2015-16—a 54% decline in just two years. CowSmo and the New Zealand Commerce Commission both documented this painful period.
And just this October, 88% of Fonterra farmers voted to sell the cooperative’s consumer brands to Lactalis for NZ$4.22 billion. Dairy Reporter covered that vote extensively. The decision reflected, at least in part, the need for capital relief after years of volatile returns.
Now, let me be direct here: I’m not suggesting FrieslandCampina will follow these exact patterns. European dairy operates in a different policy environment—the legacy of milk quotas, CAP support structures, and generally more regional processor competition than you see in parts of the U.S. or New Zealand’s highly concentrated market. But the structural dynamics—processor consolidation, farmer lock-in periods, margin pressure during downturns—are similar enough that the history is worth considering.
When Consolidation Has Actually Worked
It’s equally important to acknowledge that not every consolidation story involves the challenges I’ve described. Some have delivered genuine benefits, and that perspective deserves fair representation.
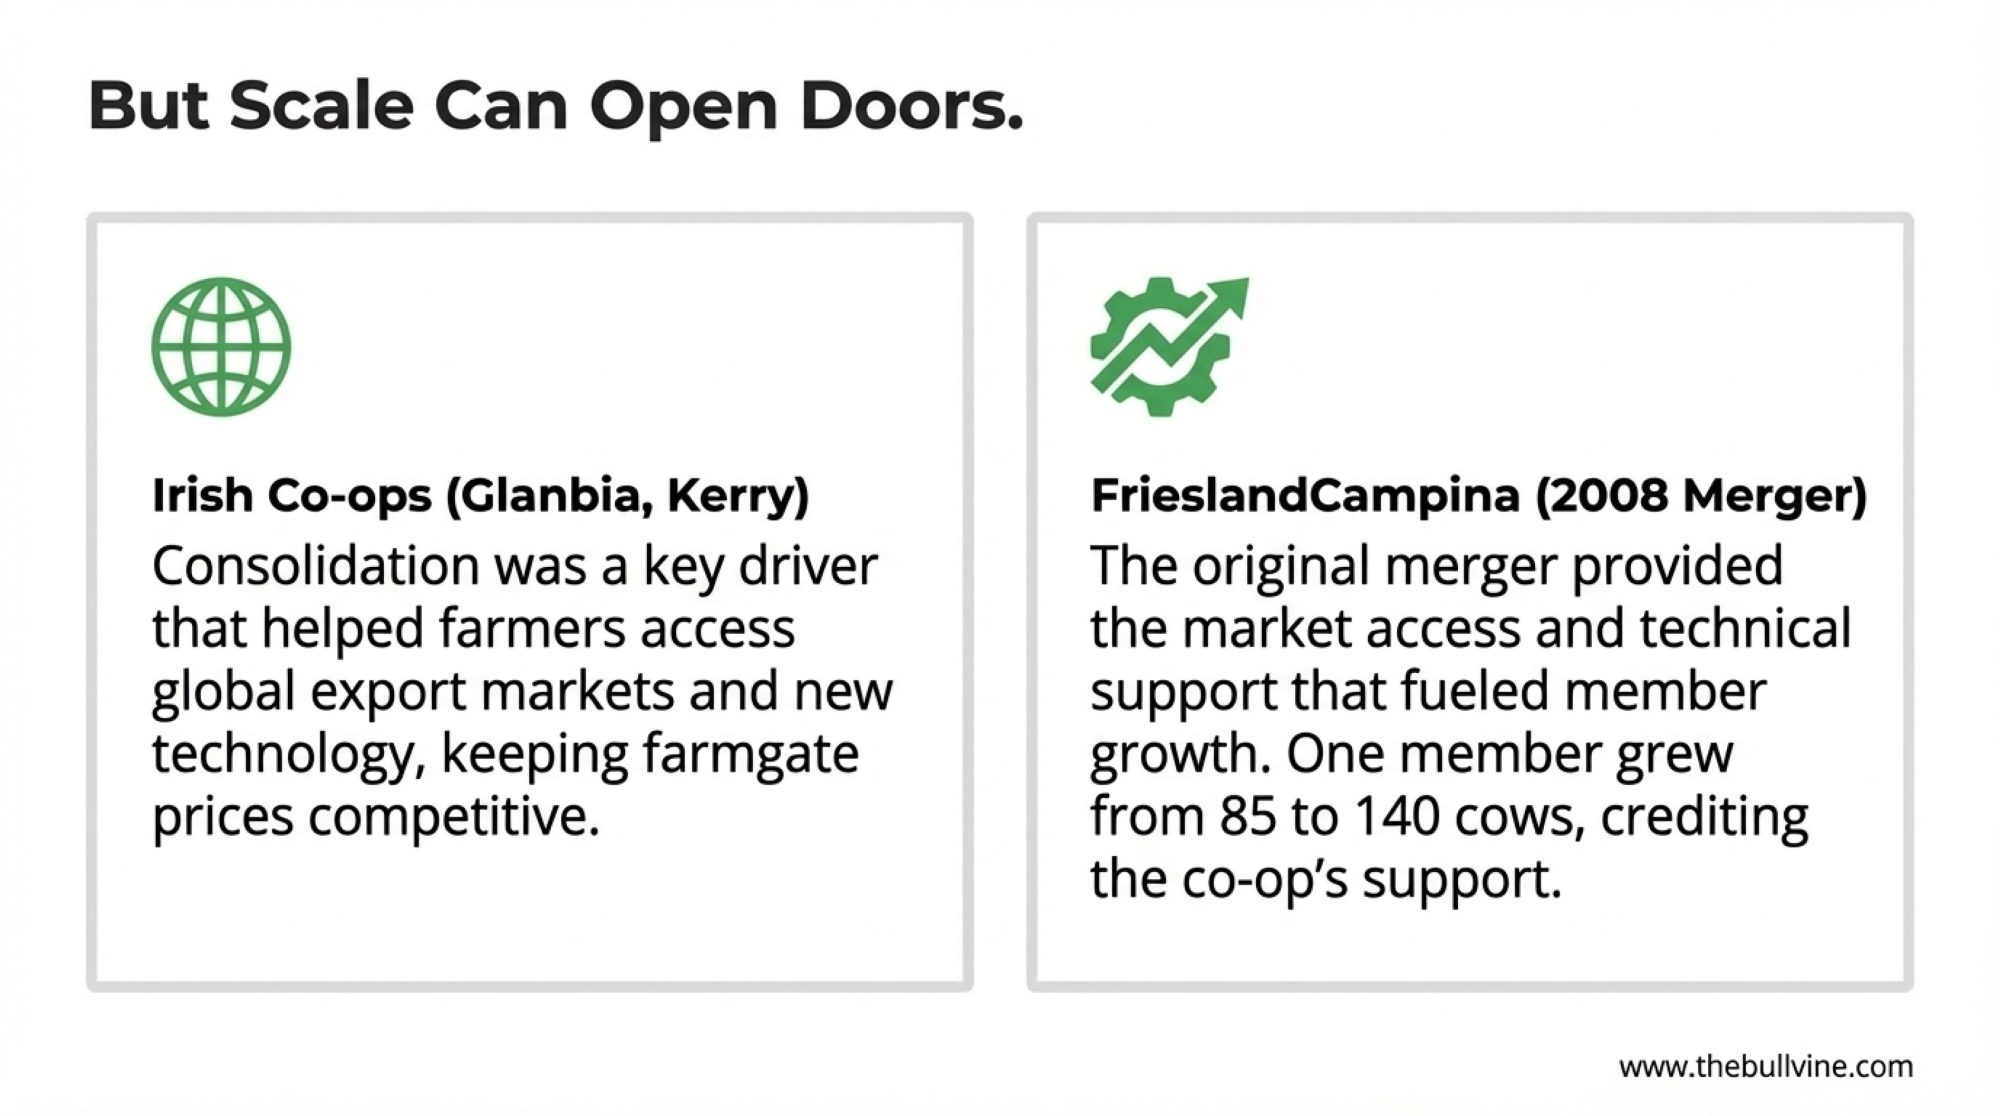
In Ireland, consolidation into entities like Glanbia and Kerry Group helped farmers access export markets and technology that would’ve been impossible at smaller scale. Farmgate prices have generally remained competitive within Europe.
A Dutch producer who went through the original FrieslandCampina formation back in 2008—when Friesland Foods and Campina merged, as Dairy Reporter covered at the time—shared his experience: “The first few years were uncertain. But over time, the scale gave us market access we wouldn’t have had otherwise. My milk price has been competitive.” His operation has grown from 85 to 140 cows since then, and he credits cooperative technical support for improving his herd’s butterfat performance and component quality.
What seems to distinguish successful consolidations? Market structure appears to be key. When the merged entity still faces meaningful competition—either from other processors or export alternatives—farmers tend to fare better. In parts of Belgium and the Netherlands, Arla, Lactalis, and smaller regional processors still compete for milk. That’s a meaningful difference from some U.S. regions where DFA dominates.
Governance at 16,000 Members
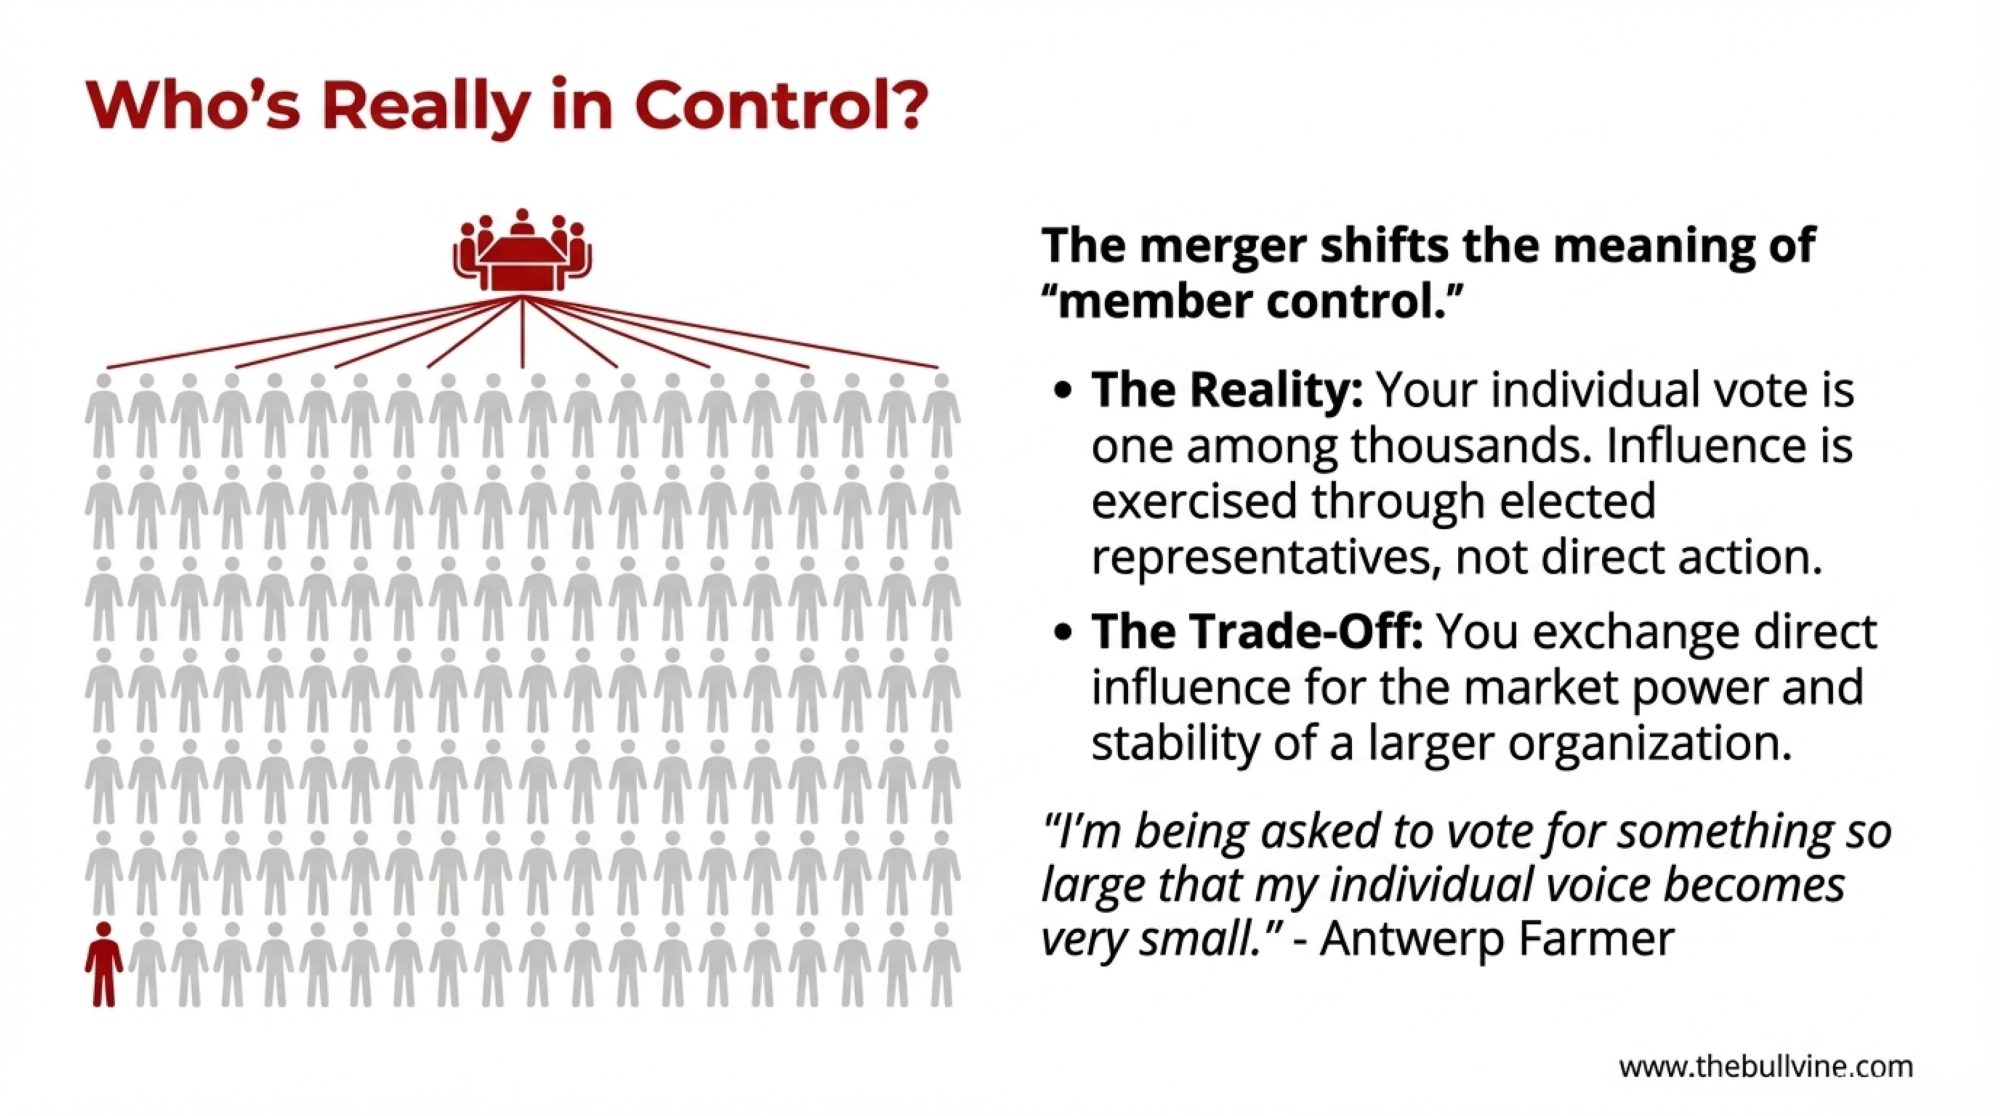
Here’s something that doesn’t get discussed enough: what “member control” actually means when cooperative membership reaches the thousands.
With 16,000+ members, each farmer’s direct influence is naturally spread thin. You’re one voice among hundreds in your district, electing representatives who are one voice among many. Some of those representatives become farmer voices on a board that also includes professional directors and relies on executive management for operational decisions.
Farmer advocacy organizations across Europe have raised questions about this dynamic. FrieslandCampina representatives counter that their district structure provides a meaningful local voice, and point to farmer-directors who actively shape major strategic decisions.
Both perspectives have merit. The question for individual farmers: what kind of influence matters most to you, and how does that factor into your decision?
Why This Is Happening Now
Understanding the timing helps contextualize what’s being proposed.
U.S. milk production surged 4.2% year-on-year in September 2025, according to the USDA NASS report—that’s 18.3 billion pounds in the 24 major dairy states. But globally, the picture is more varied. Chinese dairy imports remain well below their 2021-2022 peaks. Processors face margin pressure from multiple directions.
This merger is being proposed because market conditions are difficult and consolidation offers a path to cost reduction—not because times are good and there’s bounty to share.
That’s not necessarily bad for farmers. Cost reduction can translate to competitive milk pricing over time. But it’s worth understanding the motivation clearly.
When the Merger Might Work Well
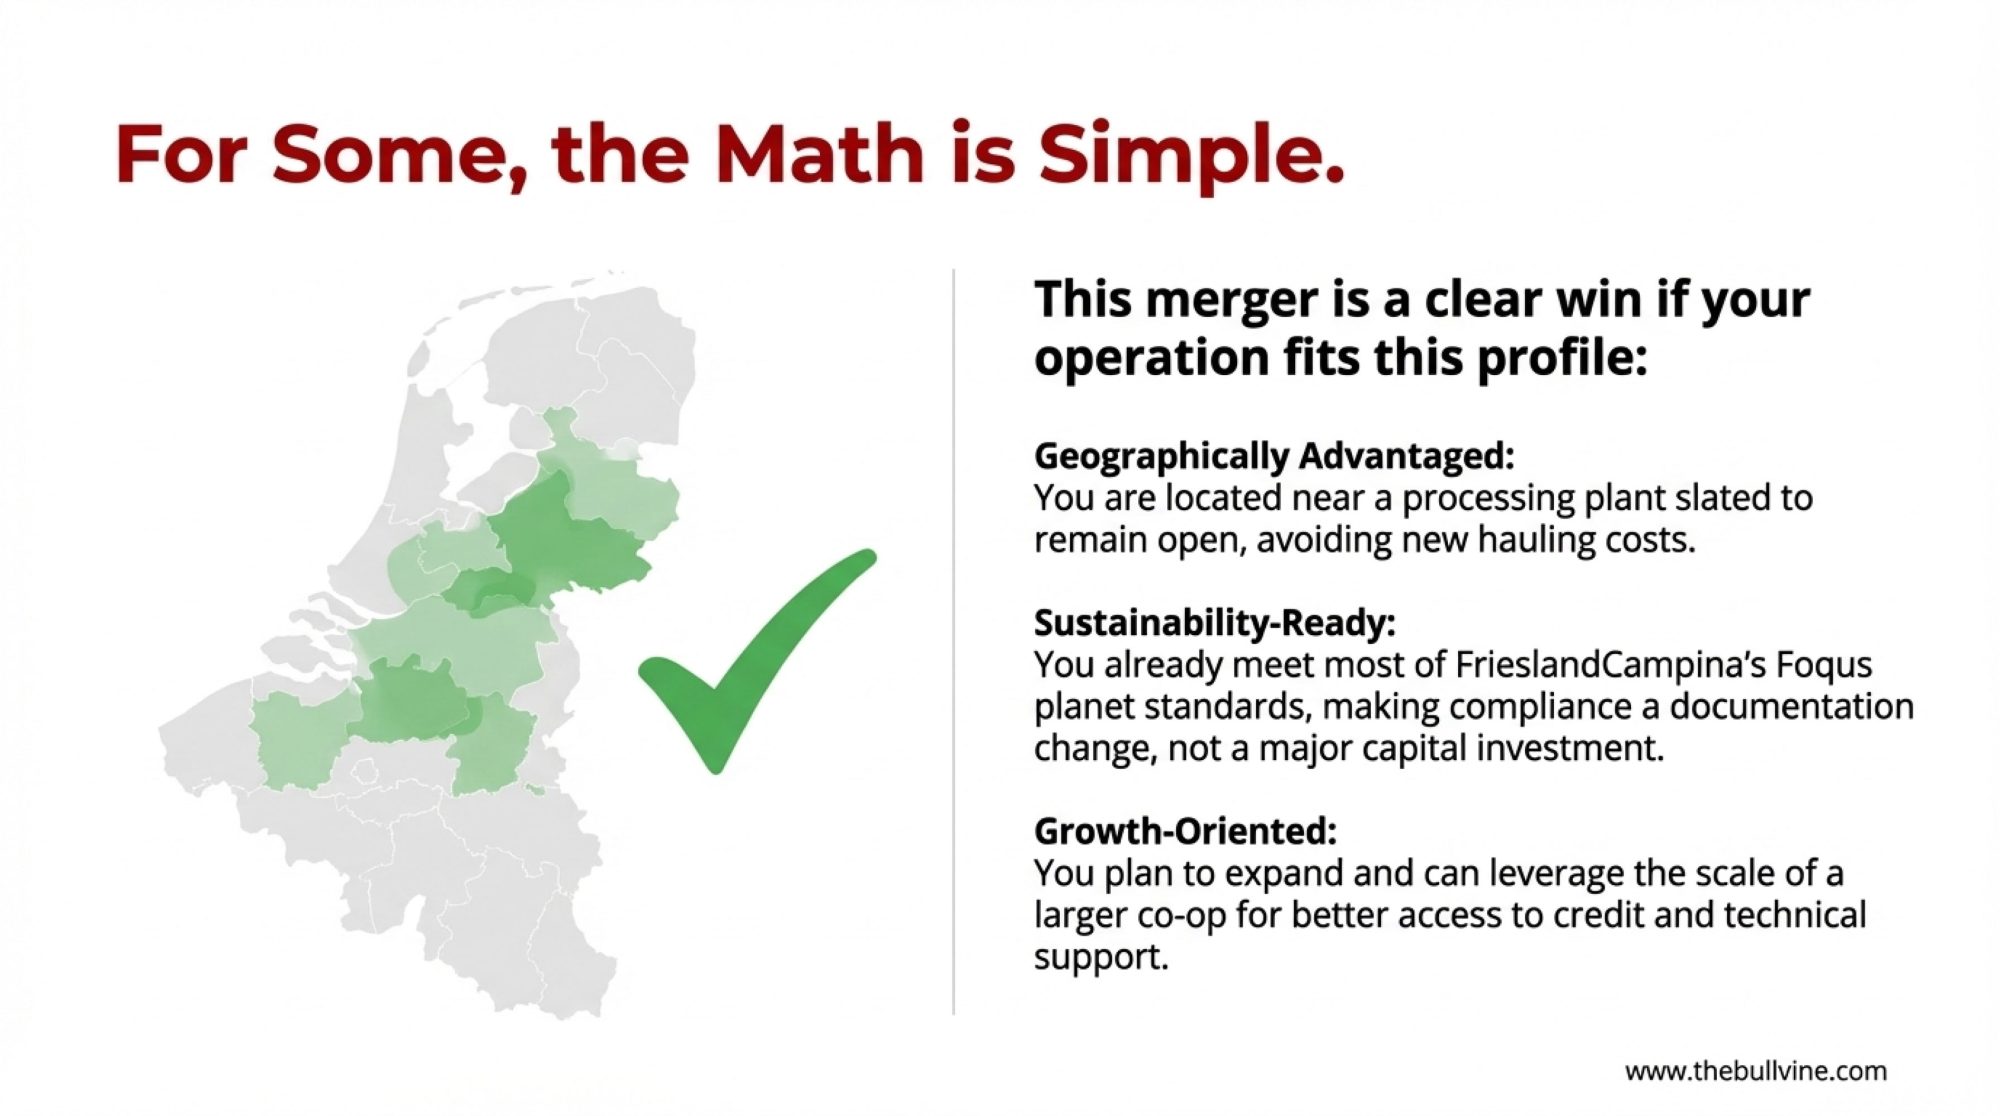
This merger will likely work well for some farmers:
- Large operations near retained facilities: The €8 bonus is largely an additive income
- Farmers already meeting sustainability targets: Compliance means documentation changes, not capital investment
- Operations planning to expand: Larger cooperatives often offer better access to credit and technical support
- Succession situations: Three years of predictable bonus payments during transition has real value
Five Questions Worth Asking Yourself
| Question | What to Think About |
| What’s my actual baseline? | Real farmgate price after all deductions—not the announced price |
| What’s my plant closure risk? | Distance to the next facility if yours closes |
| What will sustainability cost me? | Investment needed vs. the premium I can realistically achieve |
| What’s my net position? | Bonus minus added costs |
| What’s flexibility worth? | Once you’re locked in, your options narrow |
The Part That Doesn’t Fit in Spreadsheets
The Antwerp farmer I spoke with shared something that’s stayed with me: “My grandfather started this farm because he wanted to be his own boss. My father kept it going because he believed in the cooperative model—farmers working together as equals. Now I’m being asked to vote for something so large that my individual voice becomes very small.”
That feeling deserves respect. It doesn’t override economics. But it’s not irrational either.
What It Comes Down To
- Run your own numbers. Generic promises don’t translate uniformly across all operations.
- Know your geography. Plant closure risk matters more than almost anything else.
- Be realistic about sustainability costs. Premium programs create genuine opportunities—but so do the investments required to qualify.
- Learn from history, but don’t assume it repeats. Every situation has unique elements, and European dairy markets differ meaningfully from U.S. and New Zealand structures.
- Understand the trade. You’re exchanging flexibility for scale benefits and transition payments.
The Antwerp farmer will cast her vote on December 16. She’s still undecided—running numbers, talking with neighbors, trying to separate what matters from background noise.
“Once I vote yes, I can’t vote no later,” she said. “That’s worth sitting with.”
She’s right. The financial analysis matters. But so does understanding clearly what you’re being asked to exchange—and whether what you’re getting back genuinely works for your operation and your family.
Have you experience with cooperative mergers? We’d like to hear from you. Contact our editorial team at www.thebullvine.com—farmer perspectives help the entire industry better understand these decisions.
KEY TAKEAWAYS:
- €185,000+ in real money: Loyalty bonuses for farmers committing three years to the merged cooperative—enough to ease debt loads, fund equipment, or smooth a succession transition
- A lock-in you can’t escape: Three years committed with no exit clause, even if your plant closes, hauling costs spike, or circumstances change dramatically
- Geography determines your math: Farmers near retained facilities see the bonus as additive income; those facing plant closures may watch it disappear into hauling costs and basis compression
- History offers both warnings and models: DFA’s $290 million in antitrust settlements shows consolidation risk; Irish co-op mergers demonstrate that scale can genuinely benefit farmers when competition remains
- Run your numbers before December 16: Plant closure risk, Foqus planet compliance costs, and current infrastructure determine your actual outcome—and once you vote yes, you can’t vote no later
Learn More:
- The Great American Dairy Heist – Who Really Owns Your Milk Check in 2025? – Analyzes the “66% Rule” of dairy consolidation, exposing how mega-dairies and processor monopolies are structurally shifting leverage away from mid-sized family operations—and provides three specific survival paths for independent producers.
- Why 83% of Dairy Farms Will Disappear: How to Beat the Succession Odds Before It’s Too Late – Provides a brutal but necessary roadmap for protecting family legacy, detailing the specific legal structures, asset-split strategies, and “successor trial periods” needed to prevent your farm from becoming a liquidation statistic.
- How Dairy Farmers Are Finally Breaking Free From the 365-Day Grind – and Finding More Time and Profit – Breaks down the real ROI of automation beyond the hype, offering case studies on how robotic systems can cut labor costs by $95,000+ while solving the chronic staffing shortages that drive many producers to sell.
 The Sunday Read Dairy Professionals Don’t Skip.
 The Sunday Read Dairy Professionals Don’t Skip.
Every week, thousands of producers, breeders, and industry insiders open Bullvine Weekly for genetics insights, market shifts, and profit strategies they won’t find anywhere else. One email. Five minutes. Smarter decisions all week.