USMCA gave us access to dairy markets in Canada. We’re using 42% of it. New Zealand just showed it can be fixed. The 2026 review is our window.
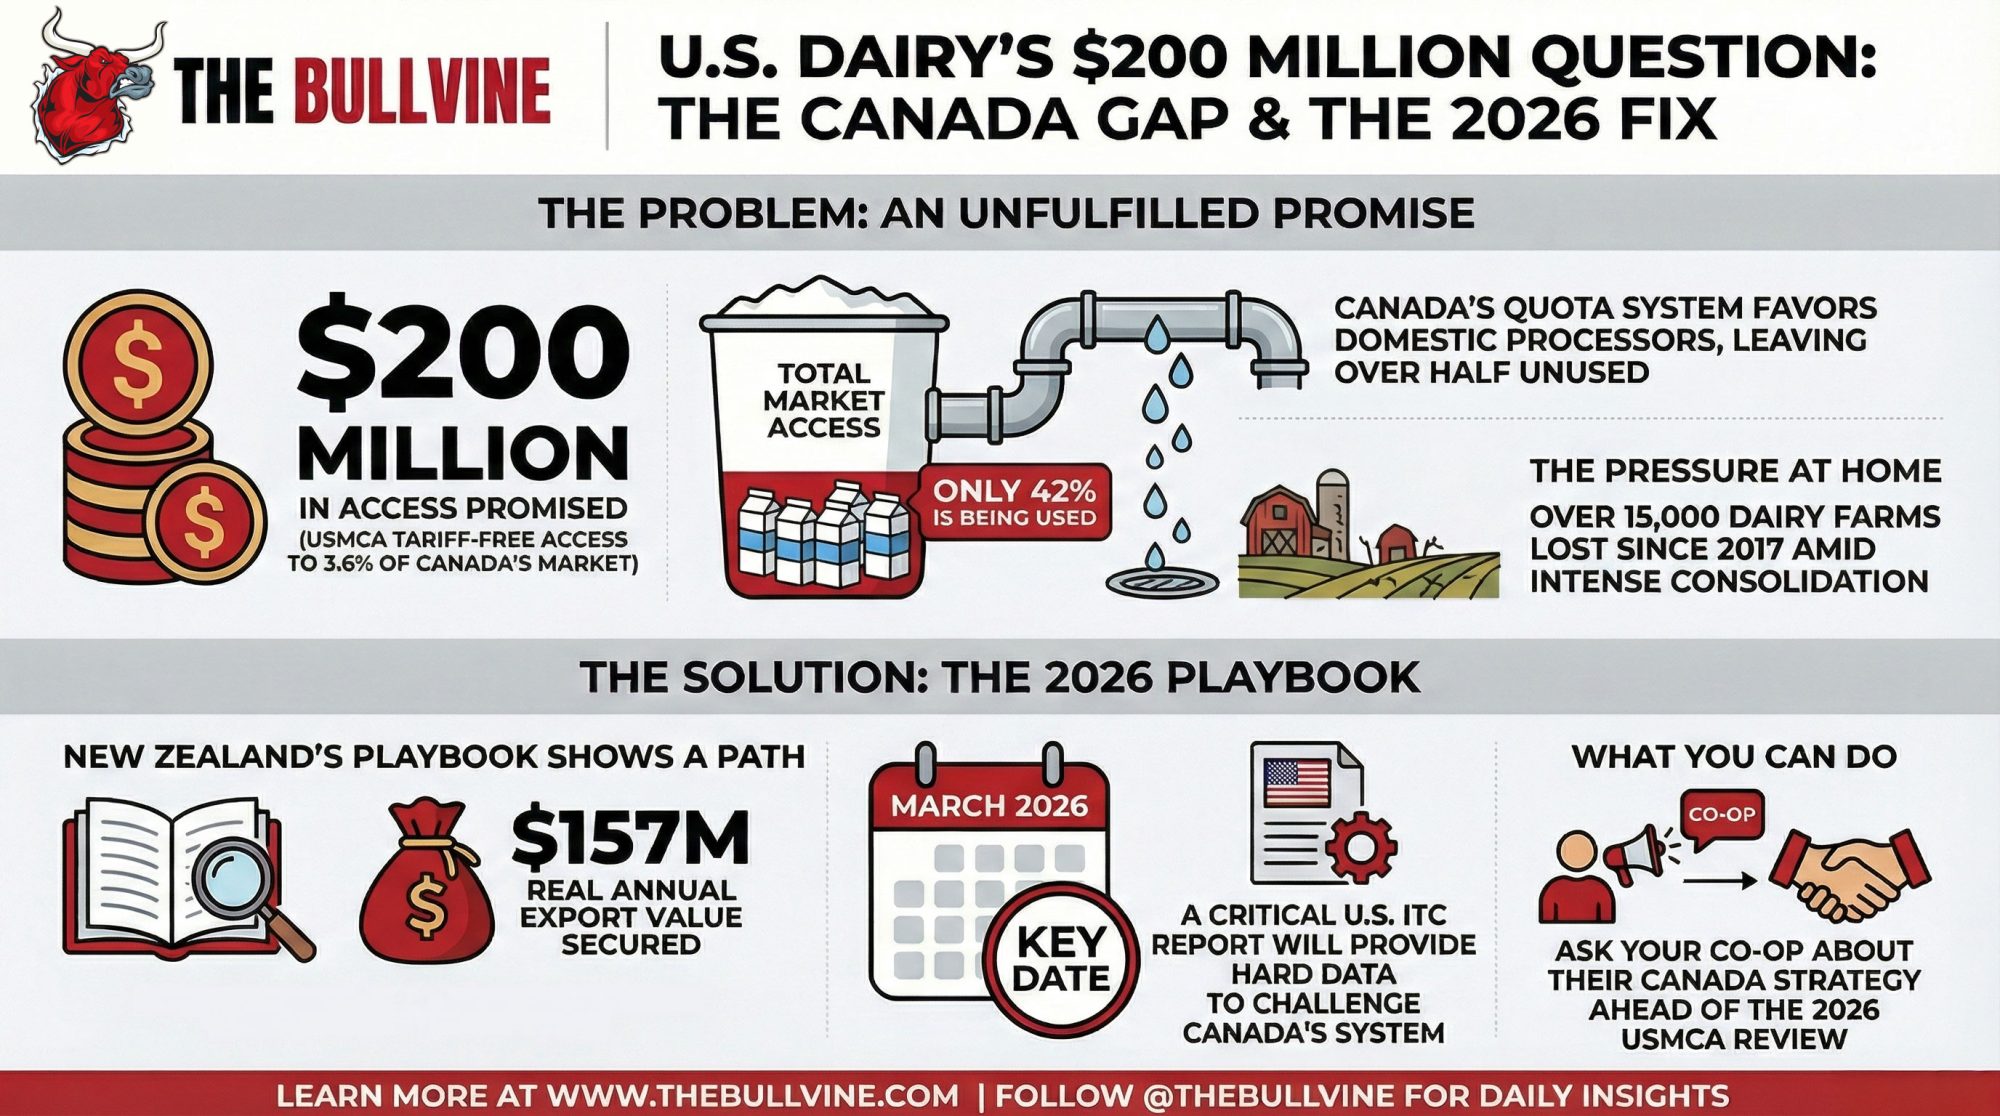
EXECUTIVE SUMMARY: USMCA promised U.S. dairy approximately $200 million in new annual access to Canada’s market. We’re using less than half. TRQ fill rates averaged just 42% in 2022/23, with Canada’s allocation system still favoring domestic processors—despite two dispute panels that exposed loopholes in the agreement’s original language. There’s reason for cautious optimism, though: New Zealand just pushed Canada past cosmetic adjustments through CPTPP, securing $157 million in annual export value. The 2026 USMCA review, combined with the ITC’s nonfat solids report due March 2026, gives U.S. dairy its clearest window to turn paper access into real orders. With consolidation accelerating—Wisconsin and Minnesota each lost 7.4% of their dairy farms in 2023—what happens in this review will ripple from trade policy down to your milk check. Here’s what happened, what’s possible, and what producers should watch as 2026 approaches.
You know how it goes. You’re out in the barn at 4 a.m., making sure the fresh cows are settling in, keeping an eye on that heifer that’s been off her feed. And somewhere in the back of your mind, you’re wondering what decisions being made in Ottawa or Washington might mean for next month’s milk check.
Trade deals get signed, politicians shake hands, there’s talk about “wins”—and then we wait to see if any of it actually turns into orders that need our milk.
Here’s what’s interesting about USMCA when you dig into the numbers. The University of Wisconsin Extension put out a detailed review earlier this year that adds up all the dairy tariff-rate quotas. They conclude that once everything’s fully phased in, U.S. exporters can ship up to about 3.6% of Canada’s annual dairy consumption into that market tariff-free. We’re talking milk, cream, cheese, butter, yogurt, powders—the works. Canadian trade law firms looking at the same schedules land on essentially that same number.
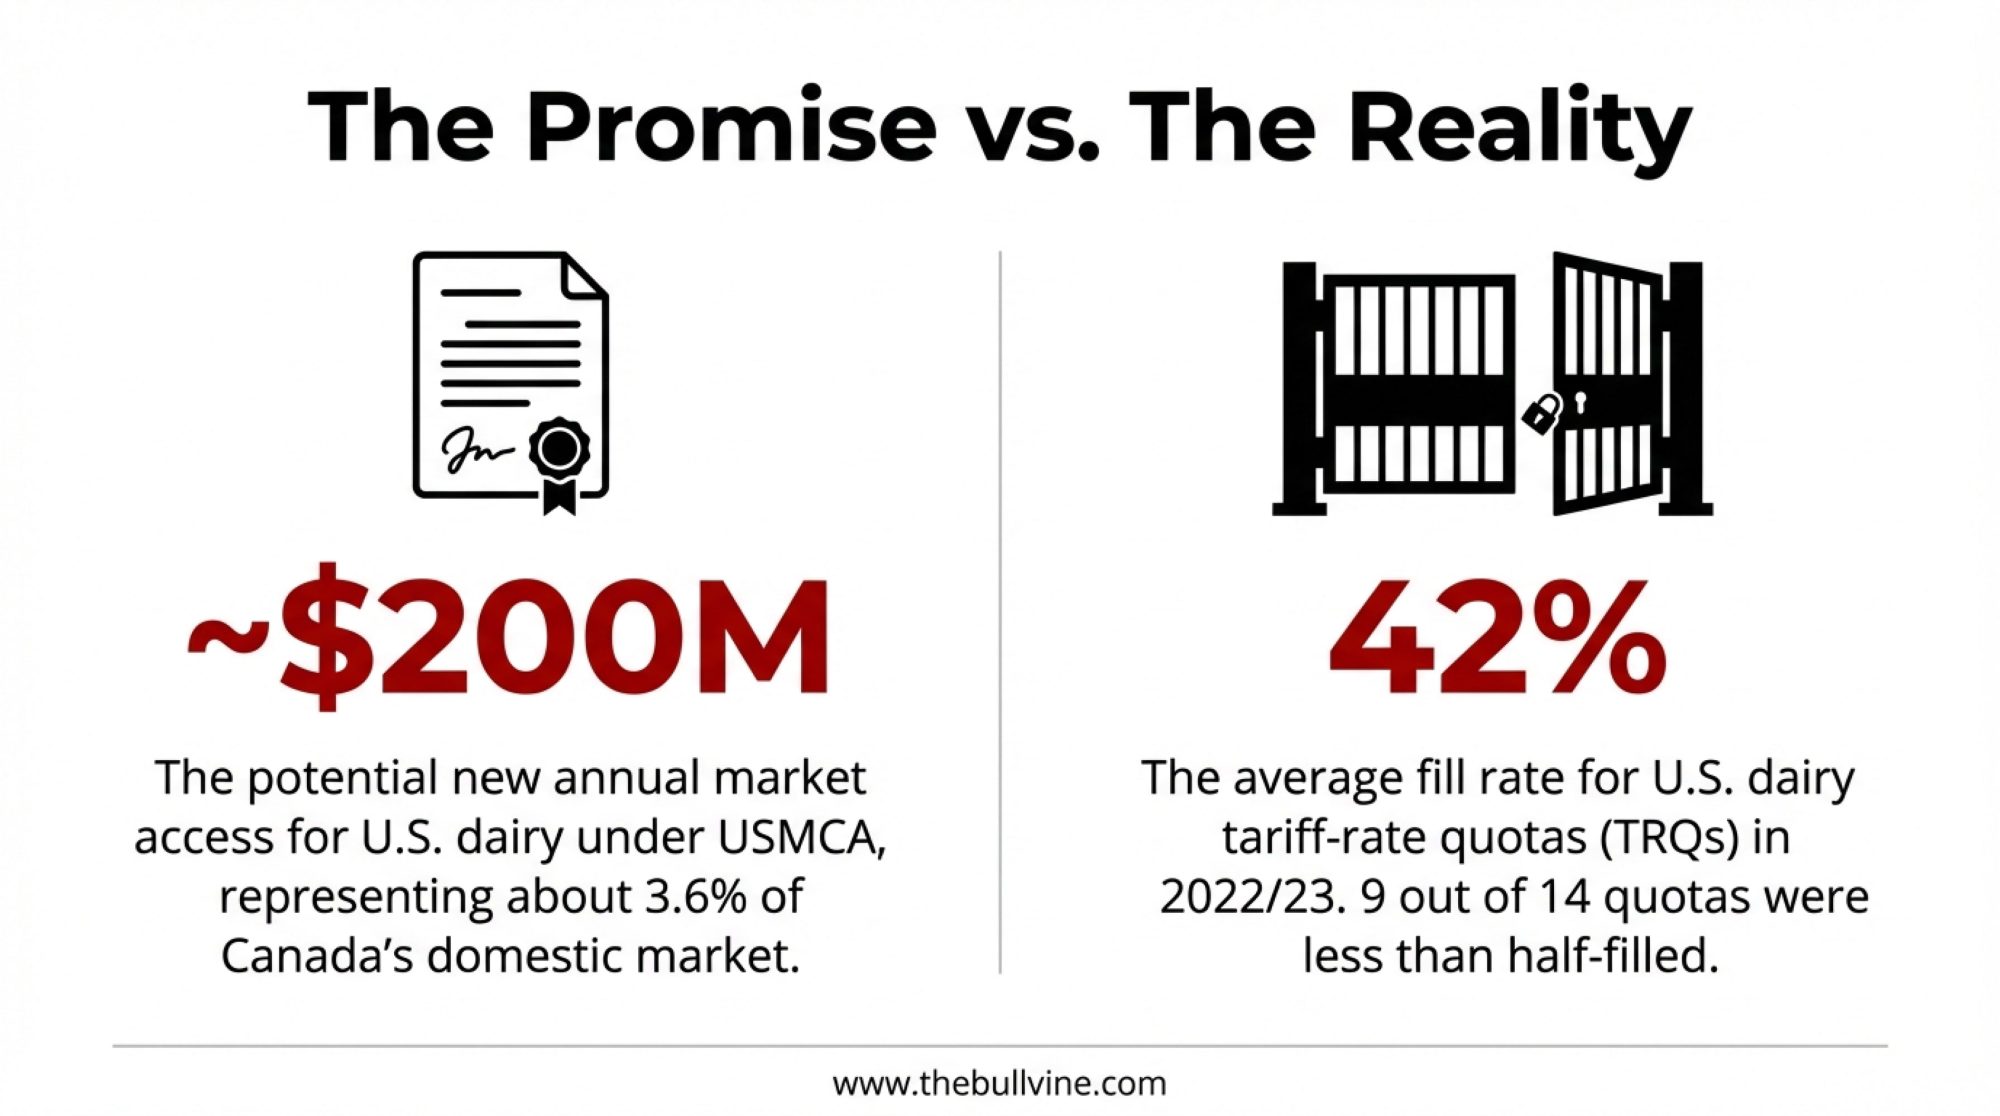
Now, Canada’s domestic dairy market runs around $17 billion, according to Dairy Reporter’s coverage earlier this year. So that 3.6% works out to roughly $200 million in potential new annual access for American dairy, based on Wisconsin Extension’s analysis.
And here’s the thing—total U.S. dairy exports to Canada have already climbed to an estimated $877 million in 2024, up from around $525 million back in 2021. That’s 67% growth in three years, which isn’t nothing.
But—and this is important—there’s a real difference between access on paper and orders that actually show up at the plant. That gap is where this whole story gets complicated, and honestly, where it starts to matter most for your operation.
USMCA Dairy at a Glance
- Market access: 3.6% of Canada’s dairy market (~$200M in new annual access)
- Total U.S. exports to Canada (2024): $877 million (up 67% since 2021)
- TRQ fill rate (2022/23): Just 42% average; 9 of 14 quotas below 50%
- Key date: ITC nonfat solids report due March 23, 2026
- U.S. farm losses: 15,000+ dairies gone since 2017
The Spring That Changed Everything
You probably remember hearing about this, or maybe you lived through it yourself. Spring of 2017, when Canada’s policy changes stopped being something you heard about at meetings and started showing up in mailboxes.
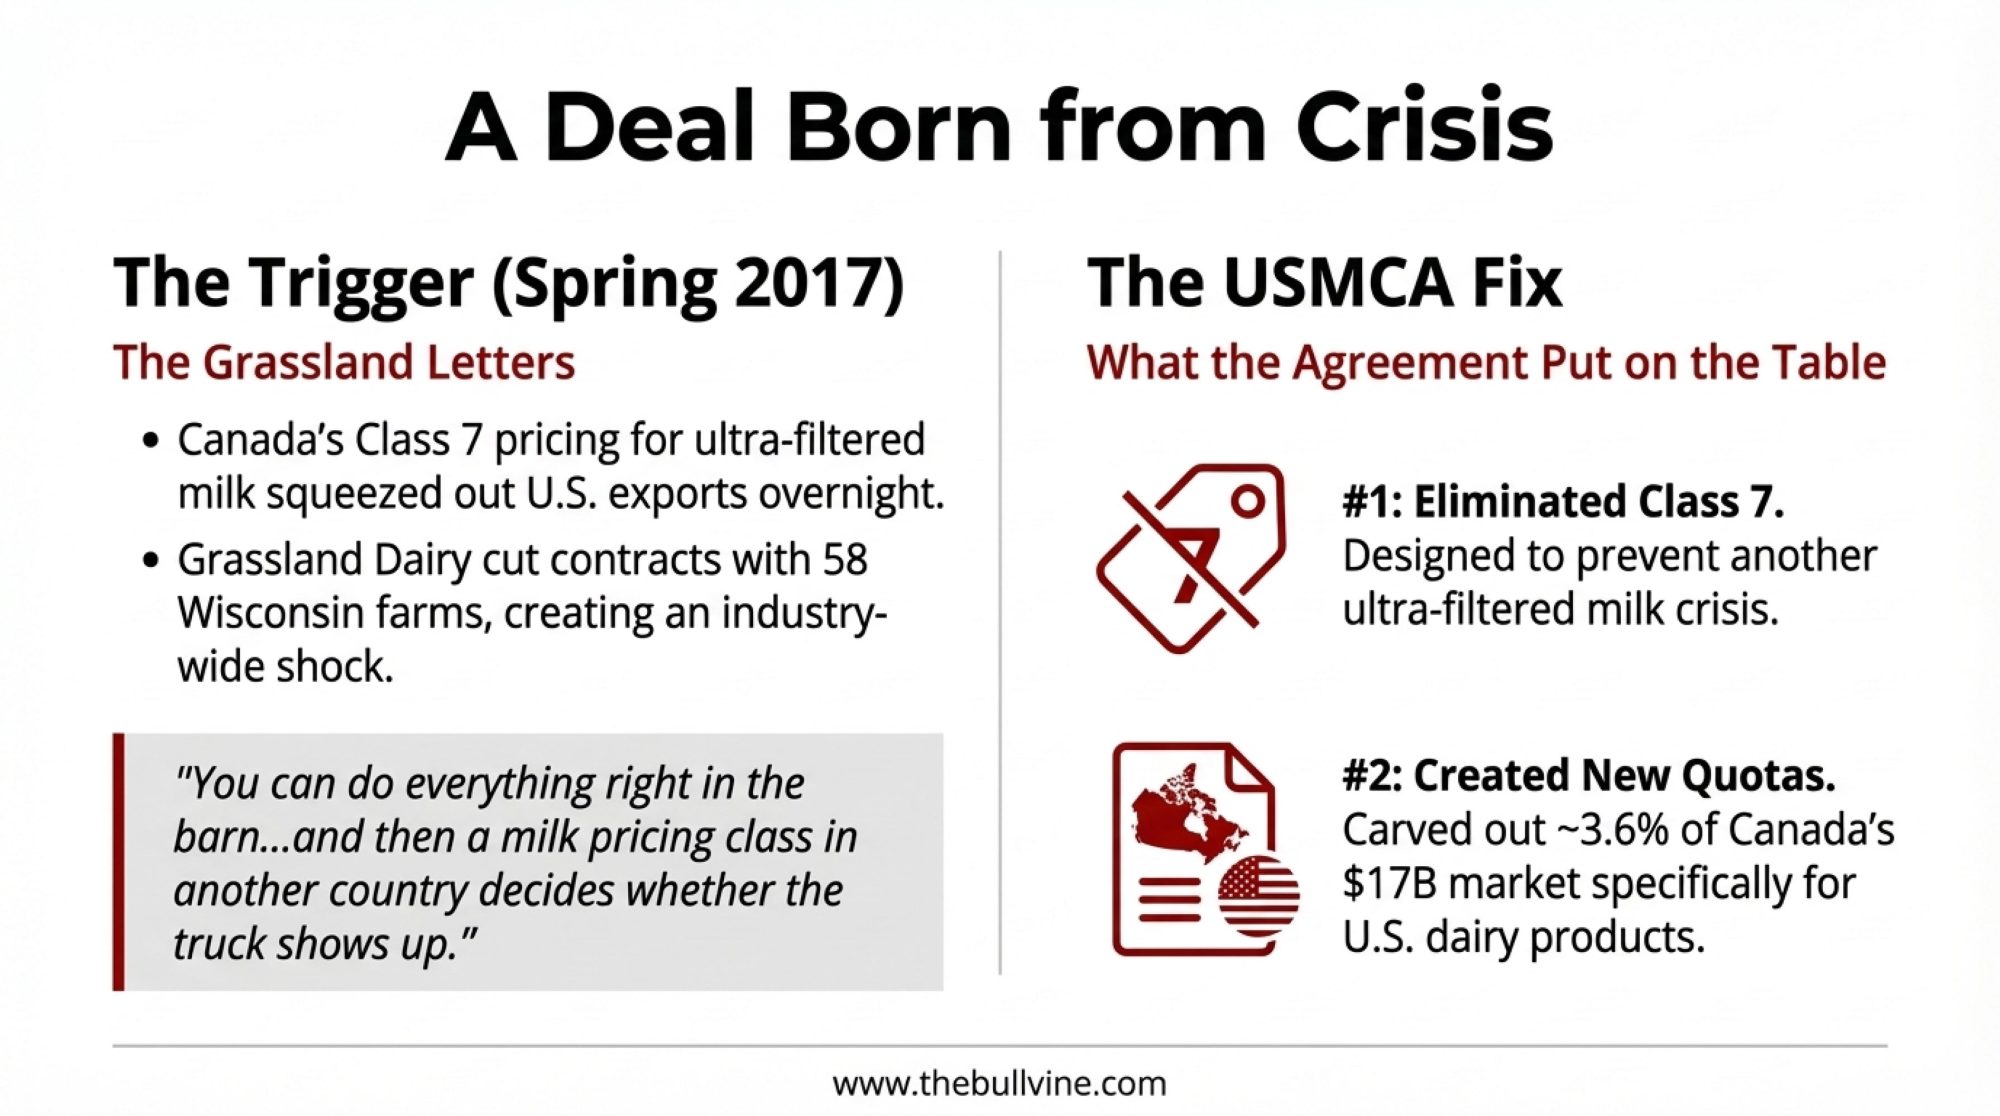
Grassland Dairy sent letters to dozens of producers in Wisconsin and neighboring states saying their milk wouldn’t be picked up after May 1. Wisconsin Public Radio reported at the time that Grassland officially ended contracts with around 58 Wisconsin farms after giving them about a month’s notice. The Wisconsin Department of Agriculture, Trade, and Consumer Protection confirmed those numbers.
Grassland’s leadership told reporters the trigger was Canada’s new Class 7 pricing for ultra-filtered milk, which suddenly made Canadian-sourced protein ingredients cheaper and essentially squeezed out U.S. exports overnight.
What happened next showed something about our industry, though. State officials and dairy groups moved fast to line up alternatives. Dairy Farmers of America signed contracts with a significant number of the affected farms, and the Dairy Business Milk Marketing Cooperative helped coordinate other placements. By late spring, all but two of those Wisconsin herds had found new buyers—though many landed on shorter-term or trial contracts, which isn’t exactly the same as having that steady relationship you’d built over years.
I’ve spoken with producers who lived through that period, and many still describe it as a turning point. The frustration runs deep. You can do everything right in the barn—strong butterfat levels, solid fresh cow management, healthy transition periods—and then a milk pricing class in another country decides whether the truck shows up.
Stories like that are a big part of why dairy ended up so prominent in the USMCA negotiations.
What USMCA Actually Put on the Table
So what did the agreement really change?
First, Canada agreed to eliminate its Class 7 milk category—and, in some provinces, the related Class 6—and fold those volumes back into the existing pricing system. Analysis points out that this was specifically designed to prevent another situation like the ultra-filtered milk mess that had undercut U.S. exports.
Second, USMCA created new dairy tariff-rate quotas specifically for American products. Wisconsin Extension’s 2025 analysis goes line by line through the agreement and concludes that when all those TRQs are phased in over roughly six years, they add up to about 3.5–3.6% of Canada’s dairy market reserved for U.S. exporters. That covers milk, cream, cheese, butter, skim milk powder, yogurt, whey, and other products.
Now, most of us aren’t sitting around with calculators figuring out percentages of another country’s market. But here’s how I think about it: if Canada’s dairy sector runs around $17 billion domestically, and the agreement carved out roughly 3.6% for U.S. access, we’re talking about approximately $200 million a year in potential new trade value if it’s actually used. That’s real money for the processors and co-ops that handle our milk.
Canadian farmers noticed too. Dairy Farmers of Canada president Pierre Lampron called the signing of USMCA “a dark day in the history of dairy farming in Canada.” DFC’s statement said that, taken together, CETA, CPTPP, and USMCA had opened approximately 18% of Canada’s domestic dairy market to foreign competition, which they argued would destabilize supply management.
So from the U.S. side, USMCA’s dairy chapter looked like a major opportunity. From the Canadian side, it felt like one more cut into a carefully managed system. Both reactions are rooted in the same numbers—just different perspectives on what those numbers mean.
The Quota Puzzle: Access vs. Gatekeeping
Here’s where things get frustrating, and honestly, where the agreement shows its limitations.
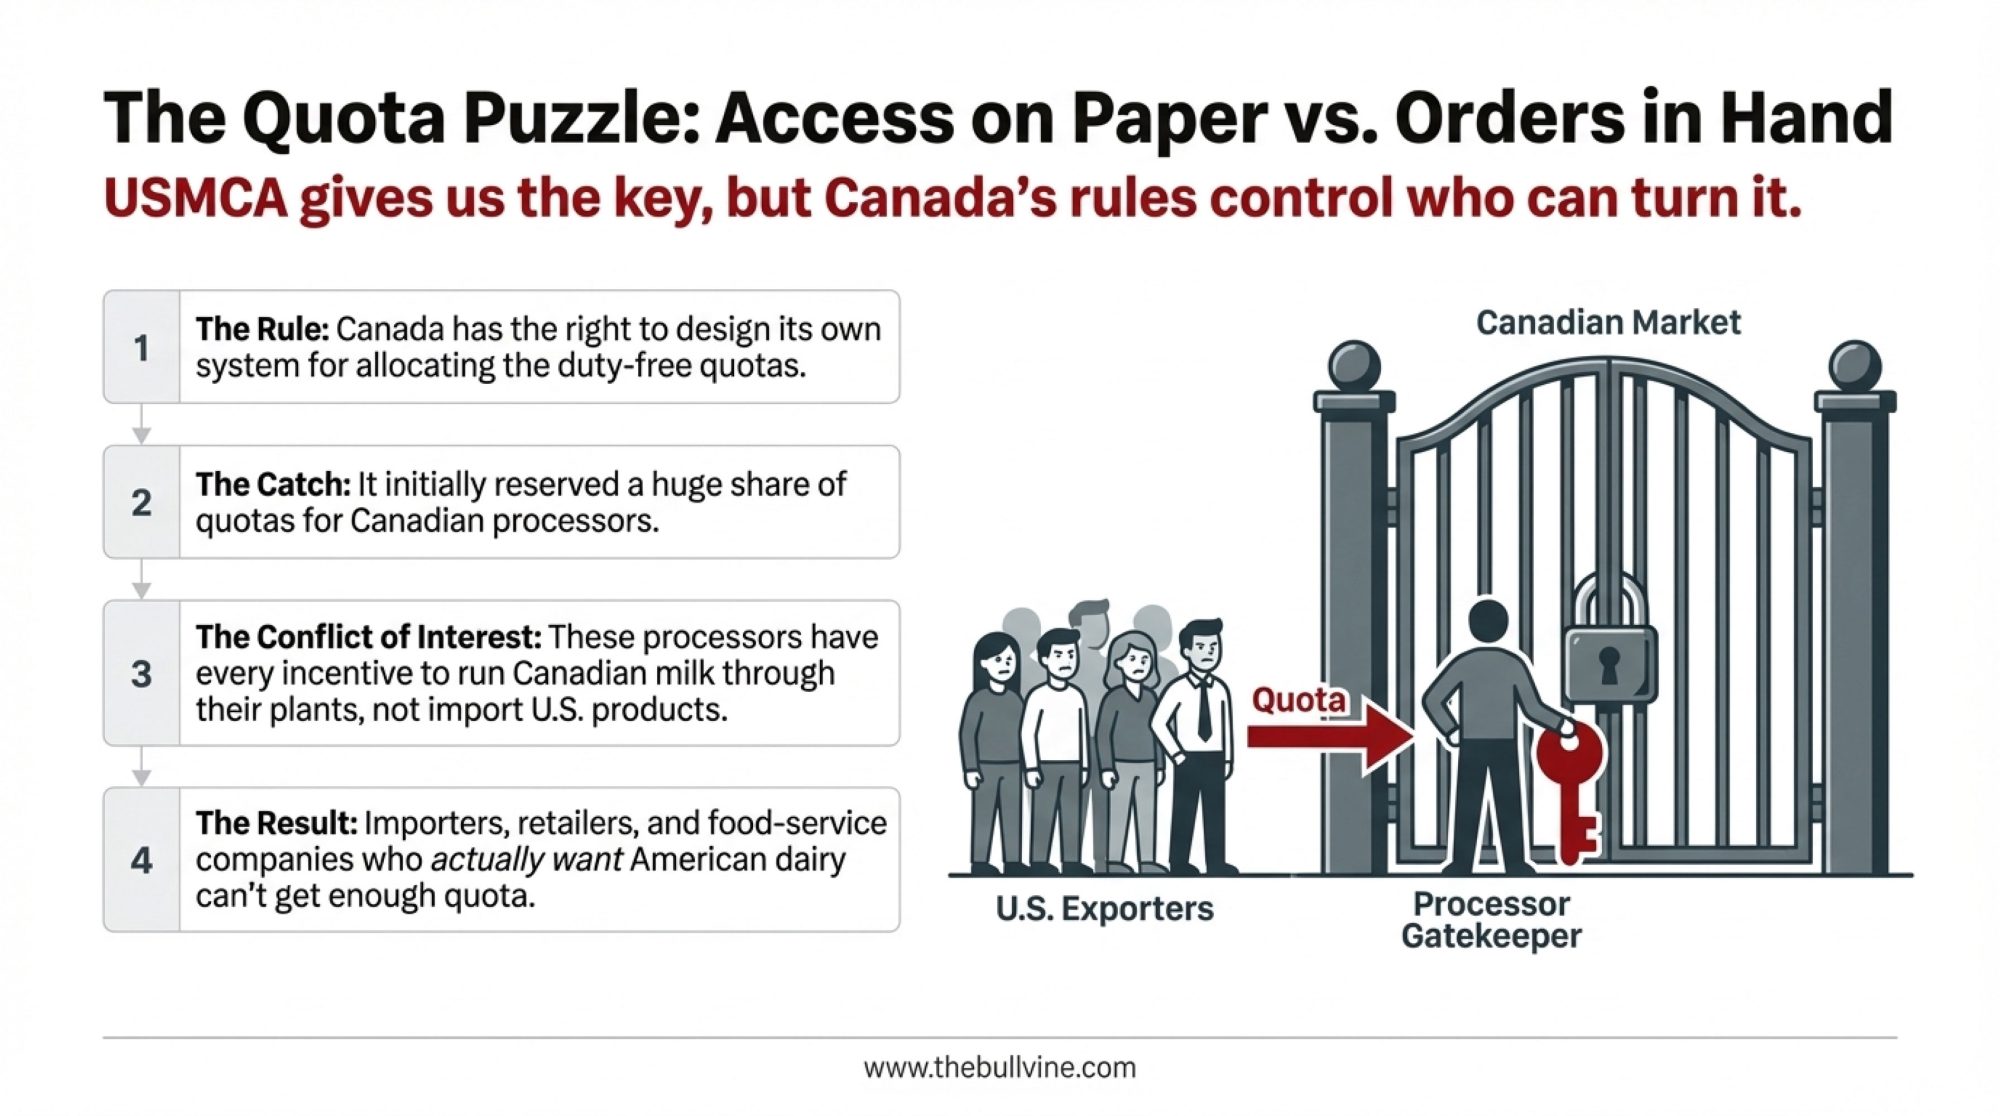
On paper, USMCA’s dairy TRQs are pretty clear—they spell out how many tonnes of each product category can come into Canada each year at low or zero tariffs, and how those volumes grow over time. In practice, what matters just as much is who gets those quotas inside Canada.
Canada has the right to design its own TRQ allocation system, provided it complies with the agreement’s general rules. In its first go-round, Global Affairs Canada set up allocation rules that reserved a significant share of many dairy quotas for Canadian processors and “further processors.”
You can probably see where this is going. U.S. negotiators and dairy groups argued that this effectively put much of the access in the hands of companies that already had every reason to run Canadian milk through their plants, leaving less opportunity for importers, retailers, or food-service companies that actually wanted to bring in American product.
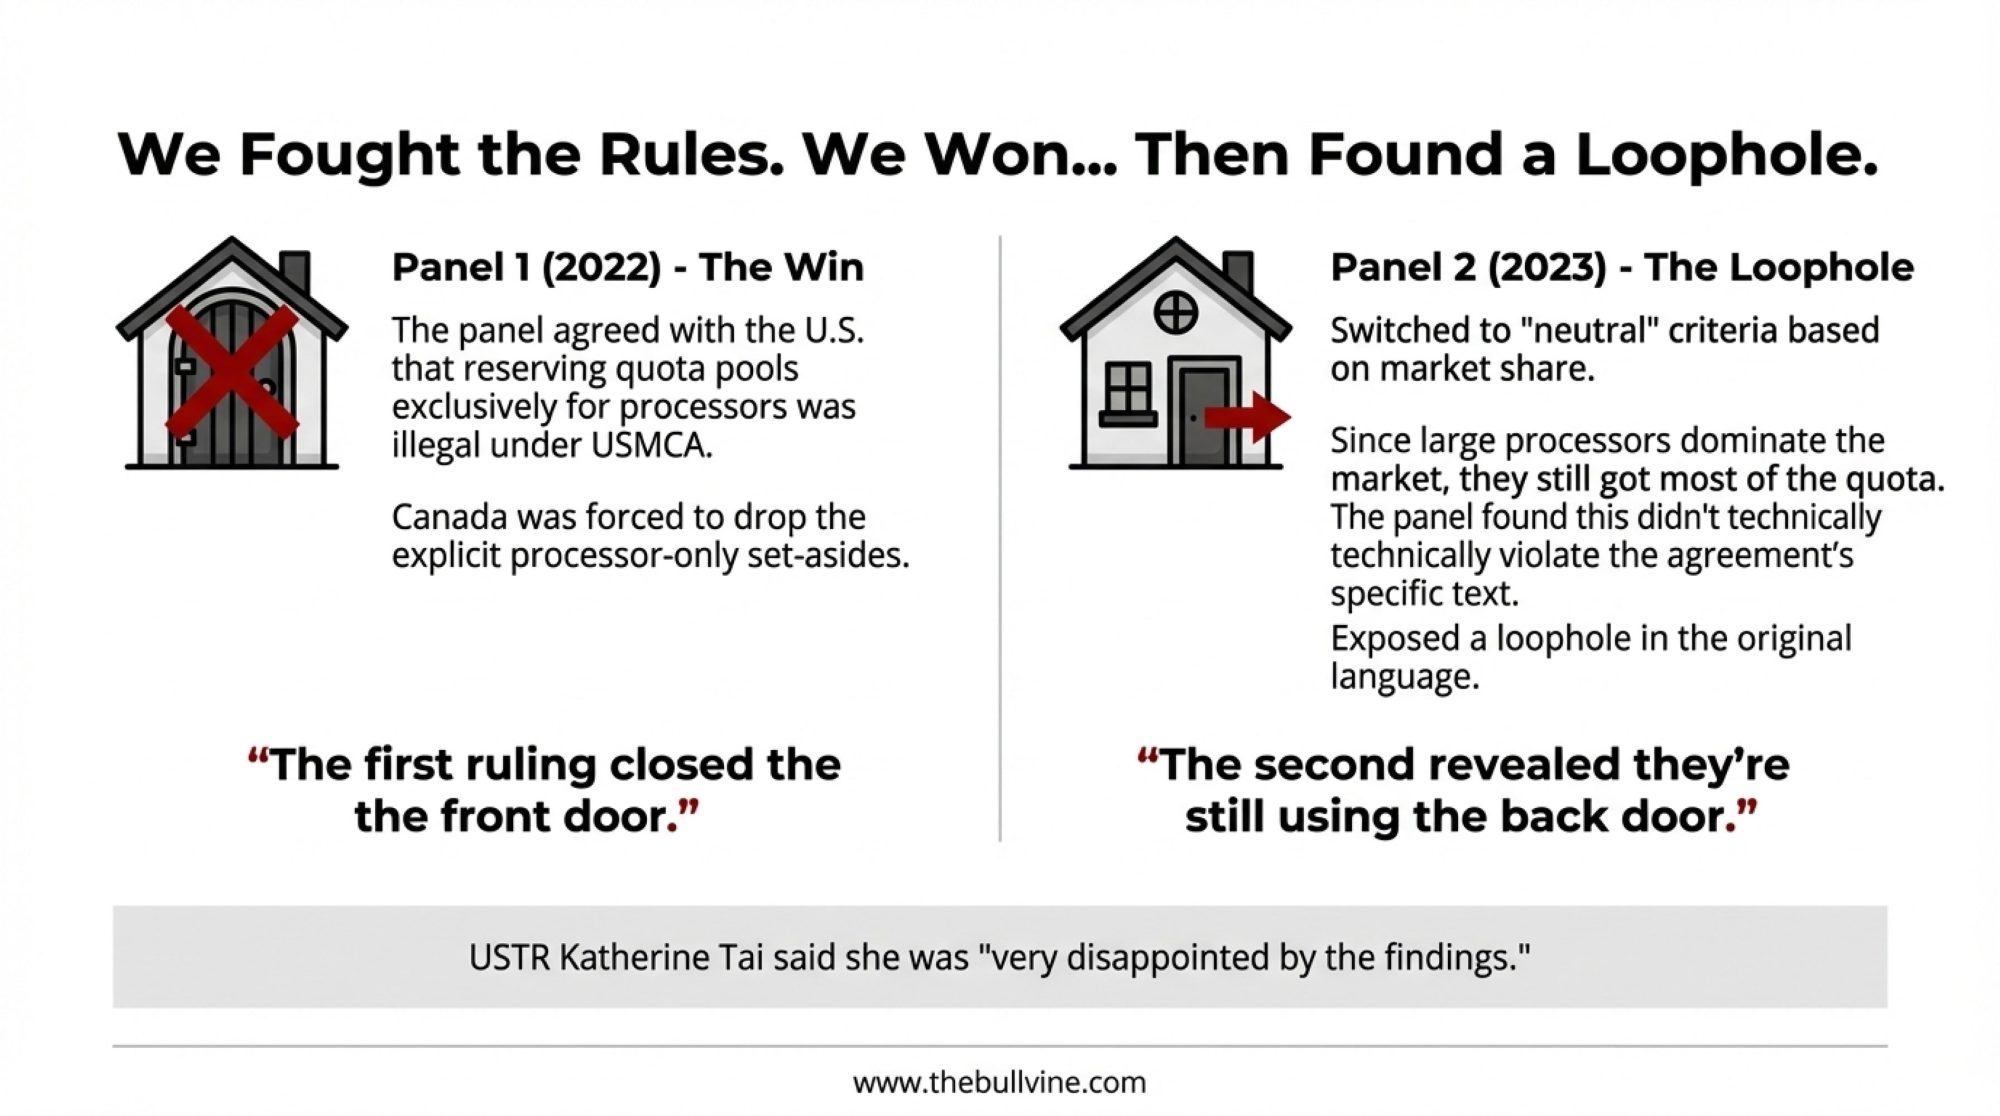
The United States requested a USMCA dispute panel. In early 2022, that panel released a report agreeing with the U.S. and Canada’s practice of reserving quota pools exclusively for processors, which conflicted with Article 3.A.2.11(b), which says countries shouldn’t limit access to allocations to processors. Hoard’s Dairyman described that panel result as an important step toward making the dairy quotas actually usable.
Canada rewrote its allocation policies. They removed the explicit processor-only set-asides and introduced “neutral” eligibility criteria based on market share and dairy trade activity. On paper, that was a shift.
In reality—and this is the part that still bothers many people—since large processors already dominate the market, they continued to receive most of the quota anyway.
The U.S. wasn’t satisfied and requested another panel in late 2022. This time, the second panel concluded that Canada’s usage of market-share calculations, while still favoring processors, didn’t technically violate the specific text of USMCA. It exposed a loophole in the original drafting of the agreement.
USTR Katherine Tai said she was “very disappointed by the findings,” and U.S. dairy organizations called the ruling a dangerous precedent.
So you end up with this real gap between a legal win and a commercial win. The first panel forced Canada to drop explicit processor-only pools, which mattered. The second panel showed that even with those pools gone, Canada can design rules that keep most of the quota in processor hands—and unless the agreement’s language is tightened, there’s not much the dispute system can do about it.
What’s the practical result? The International Dairy Foods Association reported that the average tariff fill rate was only 42% across all 2022/23 quotas, with 9 of the 14 TRQs falling below half the negotiated value. That’s a lot of access sitting unused.
The Protein Side: Export Caps and What’s Coming
Alongside TRQs into Canada, USMCA also tried to address something many of us worry about—the impact of surplus skim solids and proteins flooding world markets.
Under the agreement, Canada accepted limits on exports of skim milk powder and certain milk protein products. Reports breakdown notes that Canada agreed to cap combined exports of skim milk powder and milk protein concentrates at 55,000 tonnes in the first year and 35,000 tonnes in the second, with exports above those thresholds facing hefty charges.
For infant formula, the limits start at 13,333 tonnes in year one and rise to 40,000 tonnes in later years. The idea is to keep a supply-managed system from dumping excess solids into global markets at prices that drag down everyone’s Class IV.
In the early years after USMCA took effect, Canadian export volumes stayed under those caps—at least on paper. But Wisconsin Extension’s 2025 review points out that some processed food and blend categories containing milk solids have grown. U.S. analysts have raised questions about whether some of those flows are consistent with the spirit of USMCA’s export rules, even if they technically fit within defined product categories.
Why the ITC Report Matters
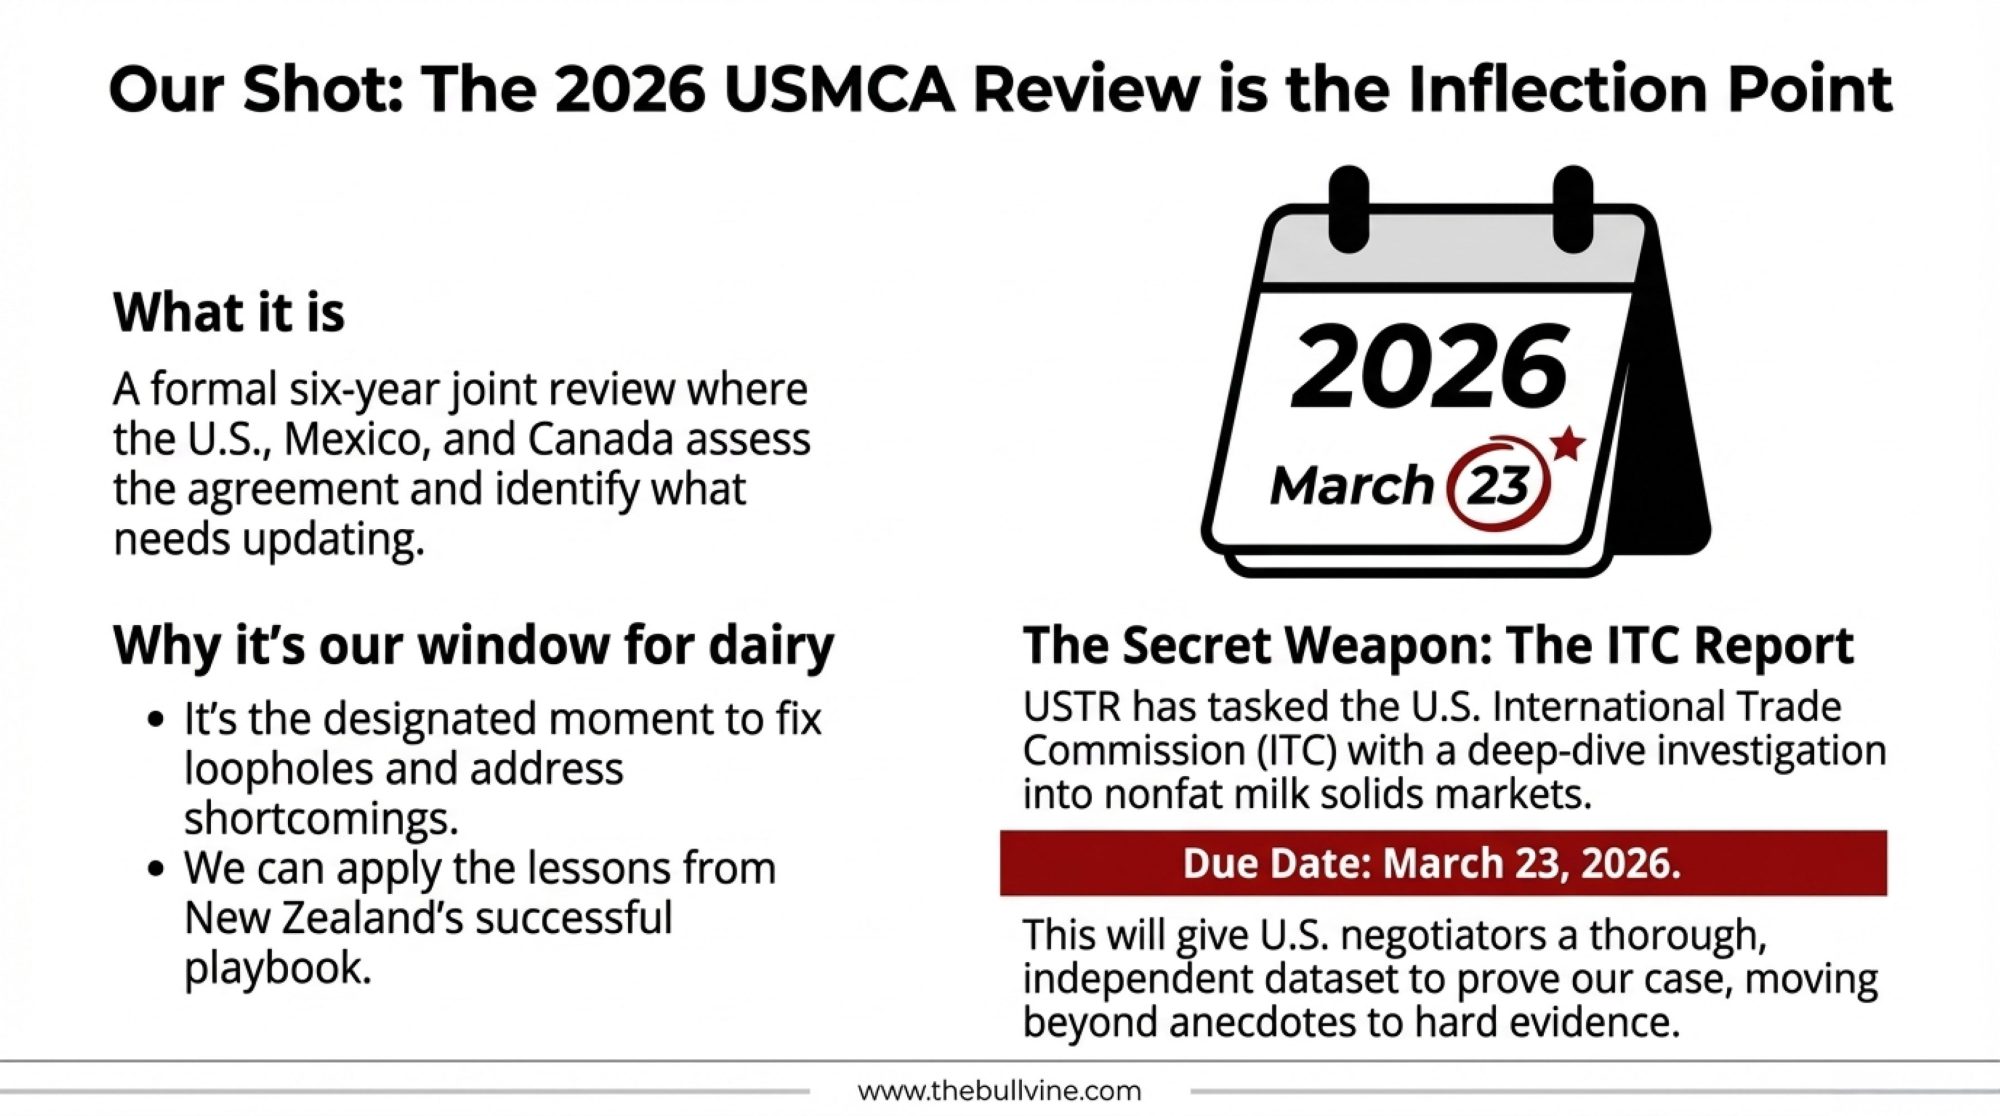
To move beyond questions and into actual evidence, USTR asked the U.S. International Trade Commission to conduct a deep dive. In May 2025, the ITC announced a new investigation into competitive conditions for nonfat milk solids covering 2020–2024. The report is due to USTR by March 23, 2026.
This is worth paying attention to. In July 2025, senior staff from the U.S. Dairy Export Council and the National Milk Producers Federation testified before the ITC, outlining how they believe foreign export policies—including Canada’s—shape global nonfat solids markets.
By the time USMCA’s formal review gets going, negotiators won’t just be leaning on anecdotes. They’ll have a thorough, independent dataset on how nonfat solids have actually moved under current rules.
What New Zealand Just Demonstrated
Sometimes, to see what’s actually possible, it helps to watch how another dairy-heavy country handled the same trading partner.
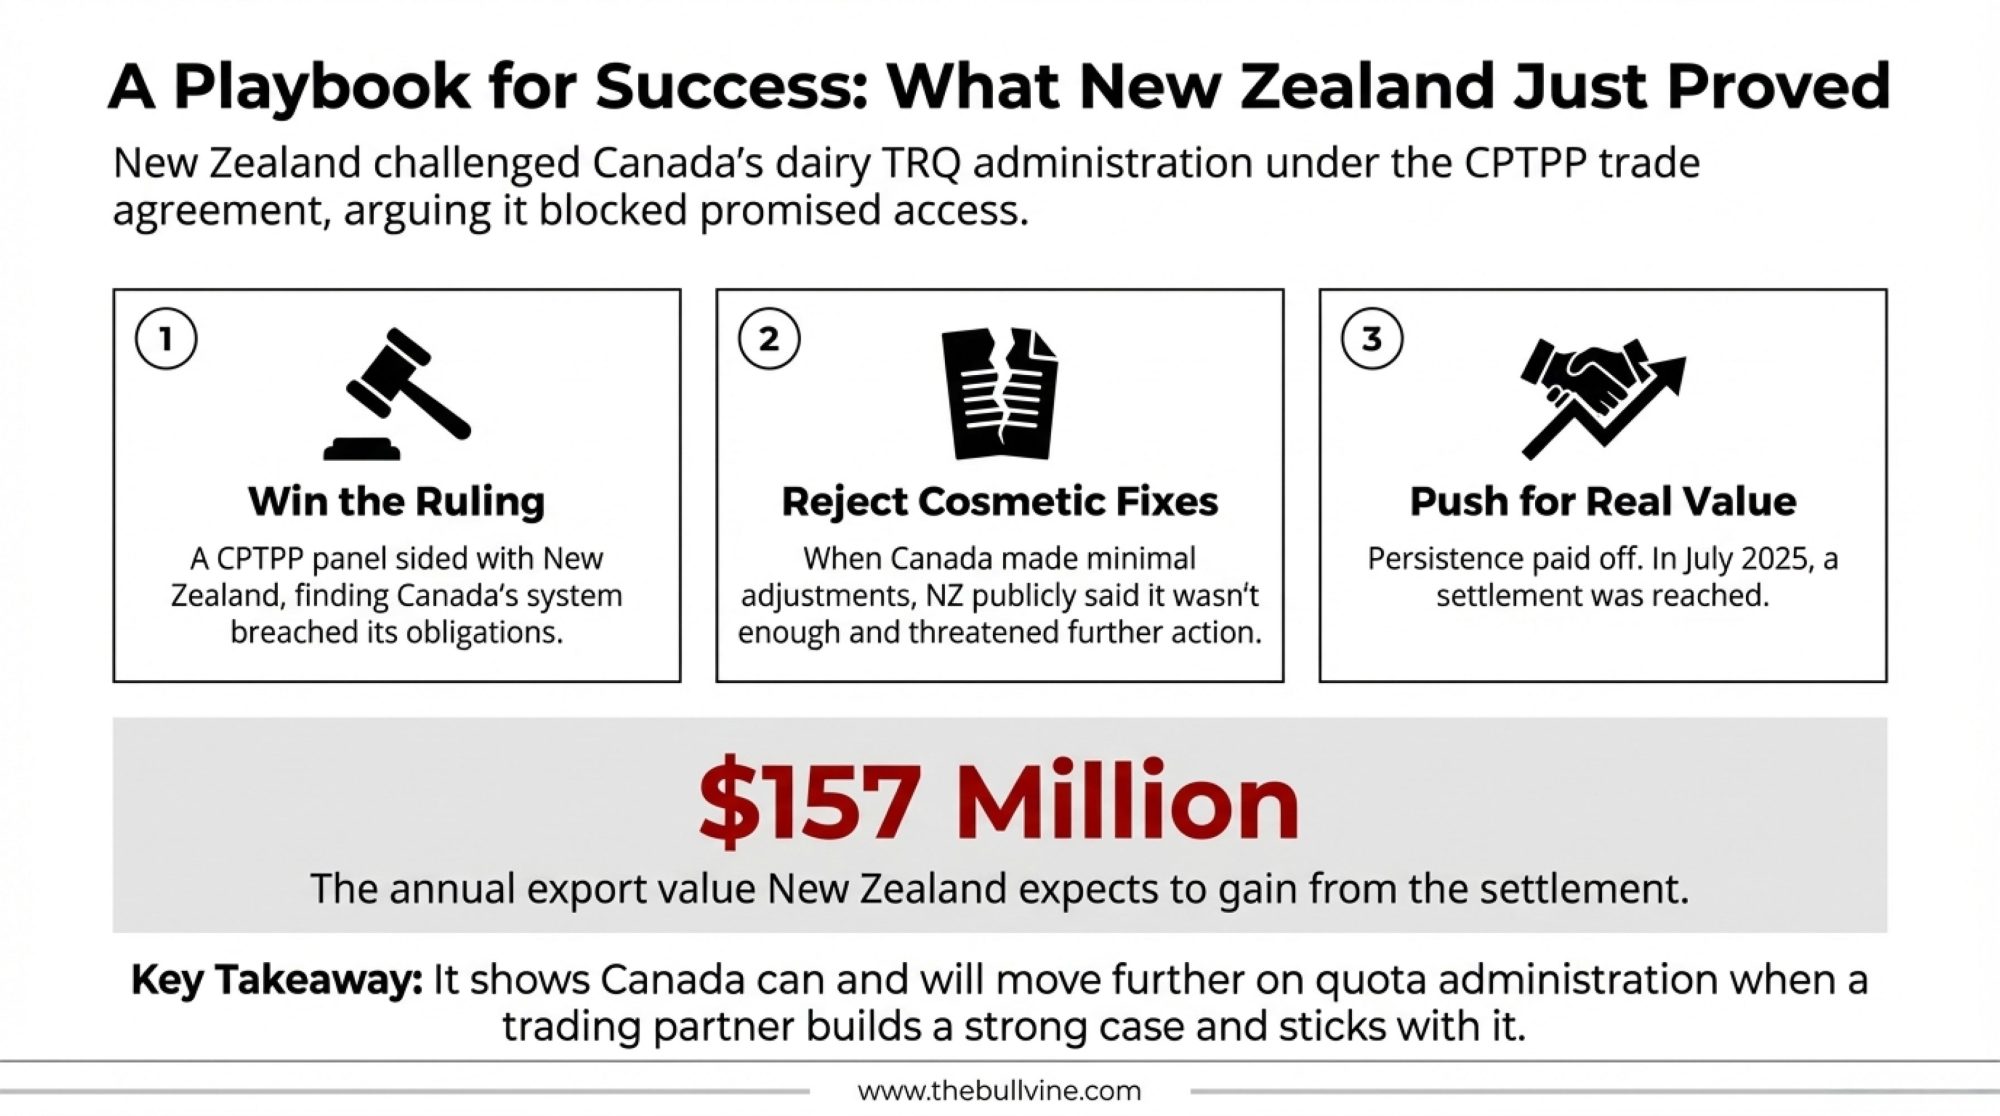
New Zealand brought a dispute under CPTPP over Canada’s dairy TRQ administration. They argued Canada’s allocation system was so restrictive that it effectively blocked much of the access promised on paper. A CPTPP panel sided with New Zealand, finding that several elements of Canada’s system breached its obligations.
At first, Canada made minimal adjustments. New Zealand officials—including Trade and Investment Minister Todd McClay—publicly said those changes didn’t go far enough and signaled they were prepared to keep pressing, including toward potential retaliatory steps.
That persistence paid off.
In July 2025, New Zealand announced it had reached a settlement with Canada. The Ministry of Foreign Affairs and Trade said Canada is committed to modify how it manages dairy TRQs, including how quota is allocated and reallocated when it goes unused. McClay stated that the agreement would deliver “up to $157 million per year in export value” for New Zealand’s dairy industry.
Cheese Reporter covered the announcement, noting that Canadian officials described the changes as “technical policy changes” that maintain the core of supply management. The modifications to Canada’s TRQ process will be published on October 1, 2025, for implementation with the 2026 calendar year quotas.
What jumps out to me in that story is the combination: clear panel rulings, solid data, and a government willing to push hard enough to get beyond cosmetic tweaks. It shows Canada can and will move further on quota administration when a trading partner builds a strong case and sticks with it.
For U.S. dairy, that’s an encouraging precedent heading into the 2026 review.
Why 2026 Is the Inflection Point
USMCA includes a formal six-year joint review. The three countries agreed to return to the table to assess how the agreement is working, where it’s falling short, and what needs updating.
That review isn’t limited to dairy—it’ll likely touch autos, labor provisions, dispute mechanisms, and supply-chain concerns tied to China.
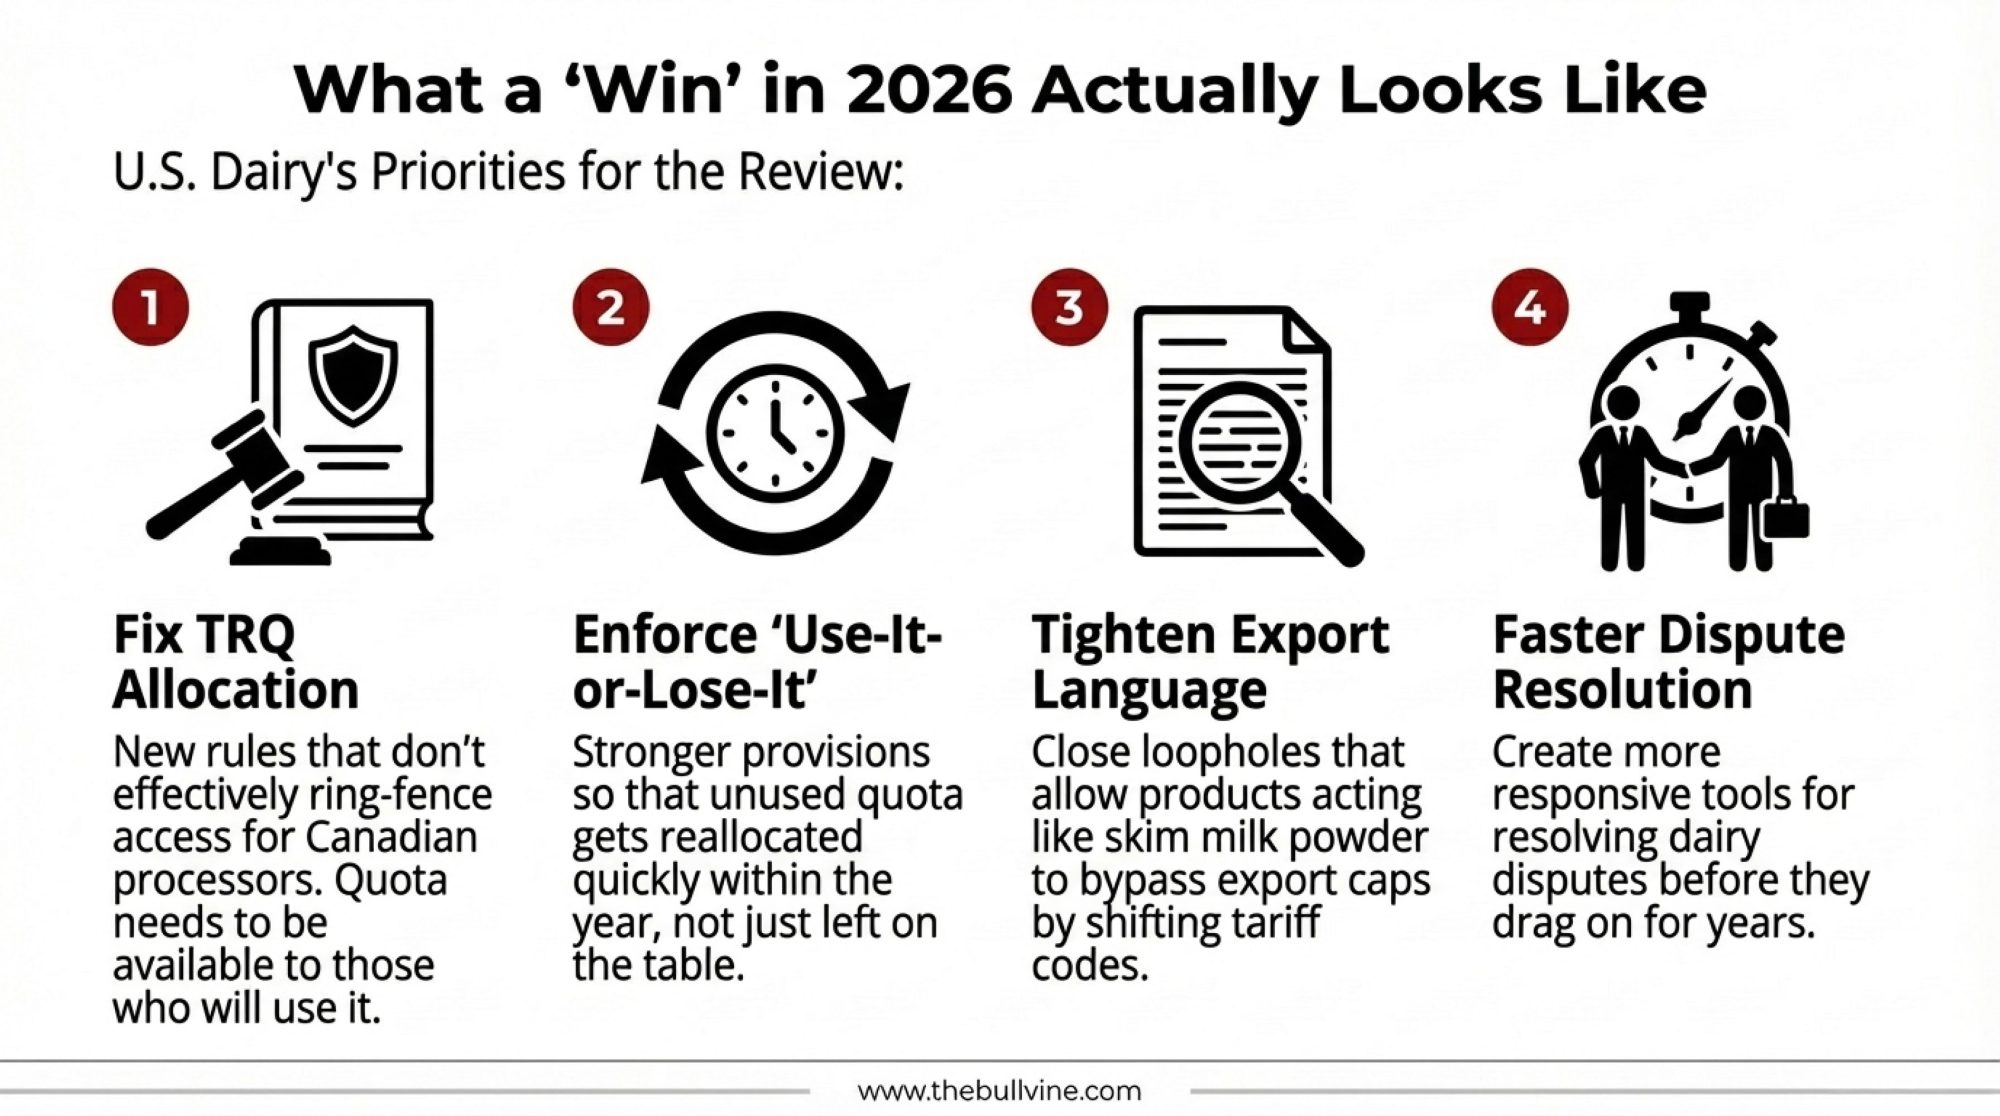
On dairy specifically, U.S. groups have already sketched out their priorities. Looking at policy statements from the National Milk Producers Federation, U.S. Dairy Export Council, and regional organizations, a few themes keep coming up:
- TRQ allocation rules that don’t effectively ring-fence most access for Canadian processors
- Stronger “use-it-or-lose-it” provisions so unused quota gets reallocated in time, actually to be used
- Clearer language on export disciplines so products that act like skim milk powder can’t bypass caps by shifting tariff codes
- More responsive tools for resolving dairy disputes before they drag on for years
At the same time, dairy has to compete with other sectors for attention. Trade specialists note that autos and labor enforcement could dominate parts of the review.
That’s where the ITC report and farm-state congressional engagement become critical. Brownfield has reported that dairy-state lawmakers are asking for clear resolutions to cross-border disputes and signaling that they want USMCA’s renewal tied to stronger enforcement.
The Consolidation Reality Behind All This
While policy discussions play out in hearing rooms, the structure of our own industry keeps changing in ways you can see when driving from one township to the next.

USDA’s 2022 Census of Agriculture shows that U.S. farms with milk sales fell from 39,303 in 2017 to 24,082 in 2022—a loss of over 15,000 dairies in five years. Dairy Reporter’s analysis of that data, drawing on Rabobank research, notes that “almost 12,000” of those losses came from smaller operations.
Over that same period, total milk output grew, and the milking herd held near 9.4 million cows. The cows moved; they didn’t vanish.
Rabobank estimates that farms with more than 1,000 cows now produce about 67–68% of U.S. milk, up from around 60% in 2017. Reports essentially the same number. Cheese Reporter’s summary of the Rabobank work notes that the very largest operations—those with more than 2,500 cows—are a small slice of all dairies but produce close to half the milk.
In Wisconsin, the story is obvious. DATCP data shows the state lost 455 dairy farms in 2023, a 7.4% drop in licensed herds, while cow numbers and total production stayed roughly steady. That left Wisconsin with 5,895 dairies at the start of 2024.
Minnesota lost 146 dairies in the same period—also about 7.4% of its dairy farm base. Many of those exits were smaller family herds under 200 cows.
USDA’s Economic Research Service has tracked this “fewer but bigger” trend for years. Their research shows that economies of scale in feed handling, housing, and labor help explain why larger operations often have lower costs per hundredweight. Rabobank’s analysis reaches a similar conclusion and notes that newer technologies—from milking systems to data-driven management—tend to favor bigger herds that can spread the costs.
In many Midwest and Northeast communities, you can see it in the farm auction ads and the empty milk houses. In Western states, you see it in new freestall and dry-lot systems being built near export-oriented plants.
Trade policy isn’t the only driver—not by a long shot—but it’s part of the environment we’re all trying to navigate.
How It Looks from the Canadian Side
From our side of the border, Canadian supply management can look like a wall. From their side, the story has more layers.
Under supply management, Canada uses national and provincial quotas to align production with domestic demand, sets target prices through cost-of-production formulas, and relies on high over-quota tariffs—up to 300% —to limit imports, according to Dairy Reporter.
Dairy Global’s discussion of the system notes that it has historically provided more stable milk cheques than U.S. producers typically see, and it’s often credited with helping keep dairy herds across multiple provinces rather than allowing rapid regional hollowing out.
But Canadian economists have been pointing to serious weaknesses within that system.
Sylvain Charlebois, professor and director of the Agri-Food Analytics Lab at Dalhousie University, has written that Quebec now produces close to 40% of Canada’s milk even though its share of the population is just over 20%. Roughly 90% of the country’s dairy farms are concentrated in a small number of provinces.
In a column earlier this year, he warned that if current trends continue, Canada could lose nearly half of its remaining dairy farms by 2030—even with supply management—because high quota costs and structural pressures make it harder for smaller and younger producers to enter or stay in.
On the other side, Dairy Farmers of Canada and provincial organizations stress that supply management has shielded their farmers from the worst price collapses. It’s also allowed the federal government to design compensation programs tied directly to trade concessions.
Government of Canada announcements confirm that total compensation measures to dairy farmers for market access granted under CETA, CPTPP, and USMCA amount to $3.2 billion CAD—roughly $330,000 per dairy farm, according to USDA Foreign Agricultural Service analysis. DFC has argued these payments, combined with controlled borders, are essential to preserving viable dairy farms in rural communities.
As Canada heads into the 2026 review, its negotiators are trying to protect a system many producers view as vital, while also facing internal voices calling for modernization. That context matters when we think about how far they can realistically move on TRQs and export rules.
What This Means on Your Farm
From a practical standpoint, here are three things worth keeping in mind:
- USMCA created real, measurable access—about 3.6% of Canada’s dairy market, worth approximately $200 million annually in new opportunities—but TRQ design has limited how fully that access gets used. Fill rates averaged just 42% in 2022/23.
- U.S. dairy is consolidating fast—over 15,000 farms gone since 2017, with large herds now producing most of the milk.
- Wisconsin and Minnesota’s 7.4% herd losses in 2023 show how intense the pressure remains on small and mid-size dairies, even when total production holds steady.
Smaller Herds (Under ~200 Cows)
In many Midwest and Northeast operations of this size, the daily focus is on keeping feed costs in line, managing labor, and getting fresh cows through the transition period without problems. You’re working on butterfat performance, trying to keep cows out of the hospital pen, because every health issue shows up on the milk check.
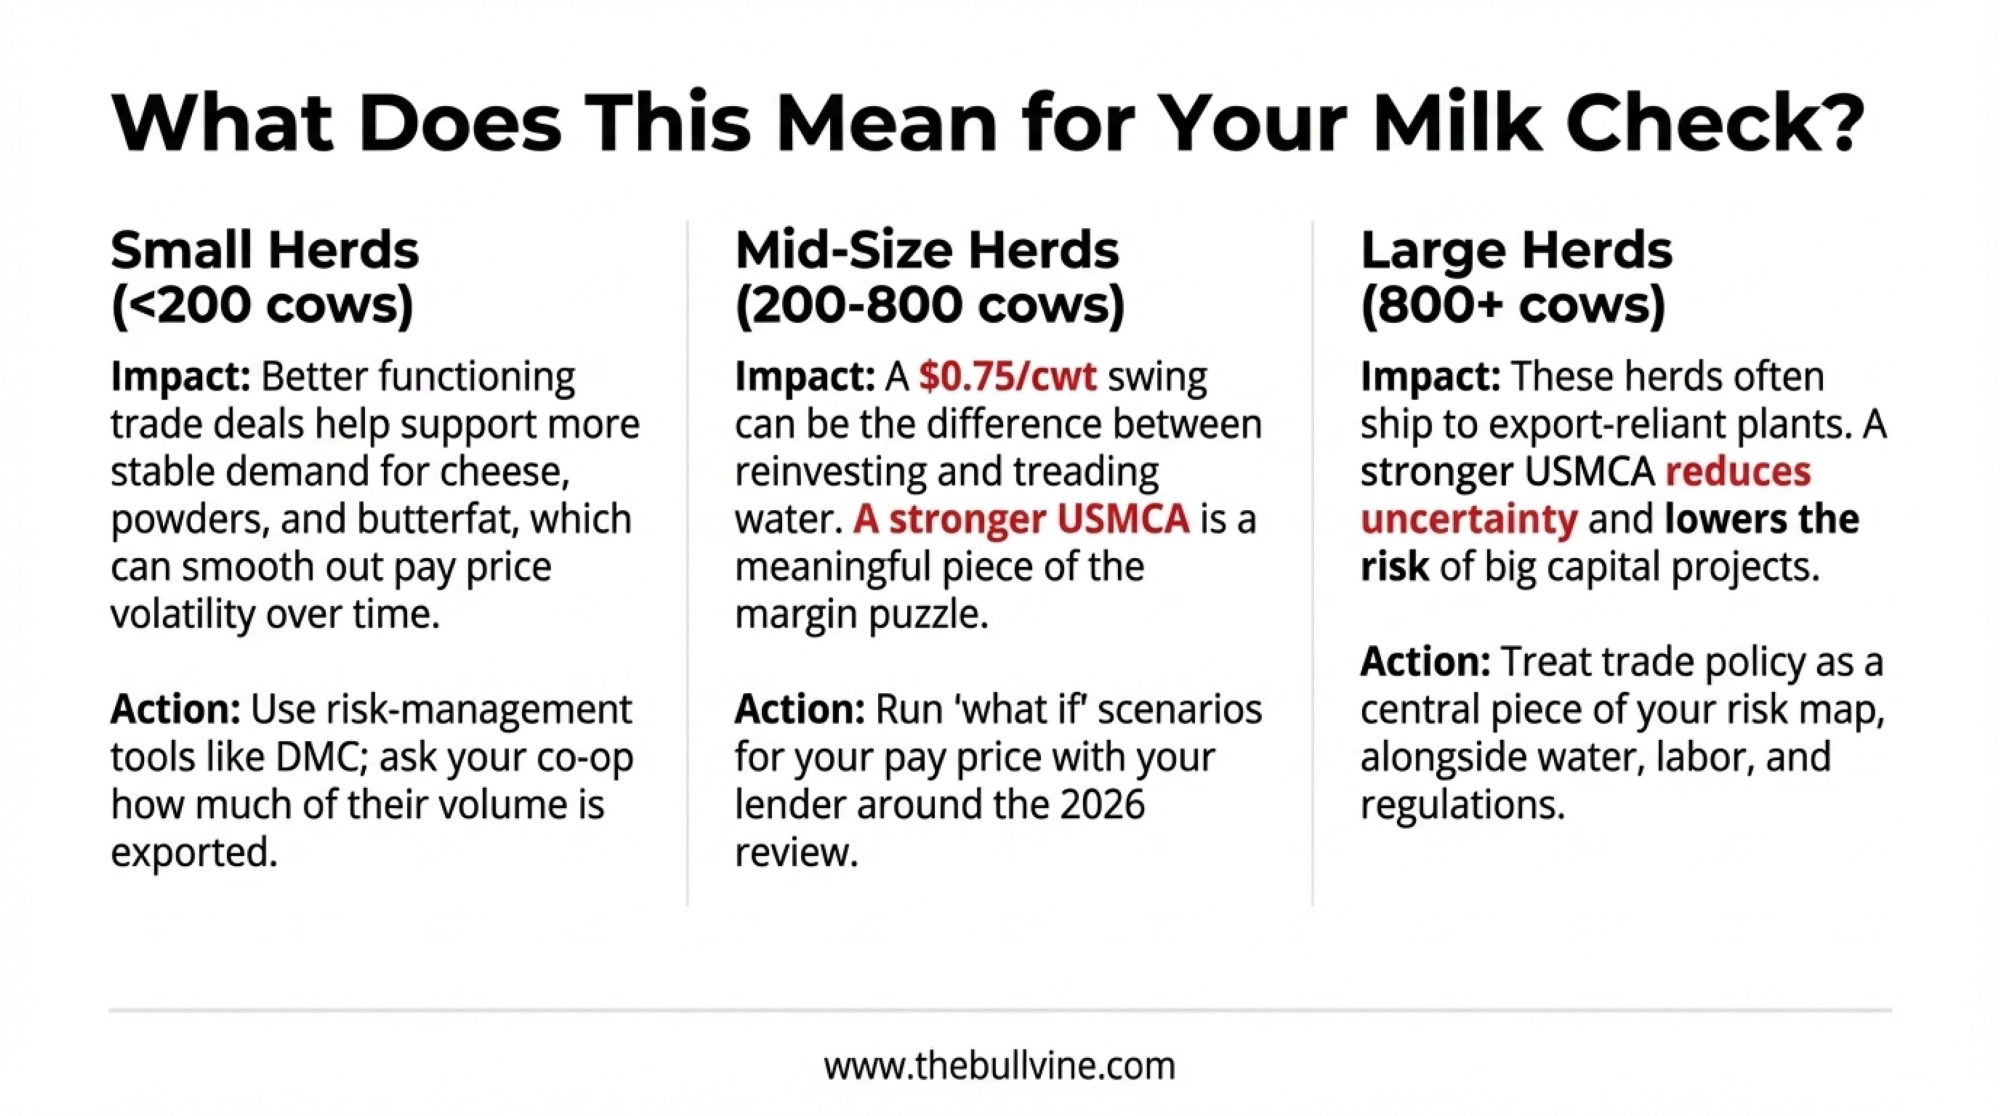
For herds this size, trade policy usually shows up as background volatility in the pay price rather than something you feel directly every week. A better-functioning USMCA can’t fix tight local basis or labor headaches, but it can help support more stable demand for cheese, powders, and butterfat—which, over time, makes planning a little easier.
It’s often helpful for operations this size to ask your buyer or co-op how much of their volume ends up in export channels, including Canada. And risk-management tools that fit your scale—such as Dairy Margin Coverage and simple forward contracts through your co-op—can help cushion the impact when global markets shift.
Mid-Size Herds (Roughly 200–800 Cows)
In Wisconsin or New York, a 400-cow freestall herd might ship somewhere around 9 million pounds of milk per year. A $0.50 per hundredweight swing in average price adds or subtracts roughly $45,000 annually; a $1.00 swing is about $90,000.
That’s the kind of money that can decide whether you move ahead with a parlor upgrade, improve transition-cow facilities, or keep nursing along older infrastructure.
Conversations I’ve had with mid-size producers across the Northeast and Upper Midwest often come back to a similar theme—they’re not big enough to ride out a bad year on volume alone, and not small enough to just tighten the belt and wait it out. A $0.75 swing per hundredweight can mean the difference between reinvesting and treading water.
For these farms, the way USMCA performs becomes a meaningful piece of the margin puzzle. Worth considering: sitting down with your lender or financial adviser and running a couple of “what if” scenarios for pay price over the next five years, especially around the 2026 review window.
And talking with your processor or co-op about how they’re currently using USMCA access and where they see Canada fitting into long-term plans.
Large Herds (800+ Cows)
In Idaho, California, the Texas Panhandle, and eastern New Mexico—large freestall and dry lot systems often ship to plants that rely heavily on exports. USDEC data and industry coverage indicate that these plants depend on markets such as Mexico, Canada, and various Asian and Middle Eastern countries to balance their solids.
Operations at this scale already treat trade policy as a central piece of their risk map, alongside water, labor, and environmental regulations.
The sentiment I hear from managers running these larger operations is that they watch USMCA the way they watch their water supply. It’s not the only thing that matters, but when it moves, it affects everything downstream.
For large herds, a stronger USMCA dairy chapter can reduce uncertainty about where incremental solids can go, encourage processors to invest in new dryers and cheese capacity that need dependable outlets, and lower the risk that policy shocks derail expansion plans.
It won’t change the need for good cow comfort or people management, but it does affect how risky that next big capital project feels.
What to Watch as 2026 Approaches
With everything else on your plate, here are three signals worth tracking—plus a few questions you can take straight to your next co-op or lender meeting.
The ITC’s Nonfat Solids Report
When the ITC releases its report, look at whether it clearly documents how foreign support and export practices—including Canada’s—are influencing nonfat solids markets.
Does it identify specific product categories that appear to be carrying milk solids in ways that don’t match USMCA’s intent? Does it quantify competitive effects on U.S. Class IV and powder markets?
The more concrete and specific it is, the more leverage U.S. negotiators will have.
Dairy-State Lawmakers’ Engagement
Brownfield and other outlets are already reporting that dairy-state legislators are asking for stronger enforcement on Canadian TRQs and export caps.
Watch for formal hearings or bipartisan letters tying USMCA’s long-term renewal to measurable improvements in dairy access.
When elected officials start using the same numbers you see in farm papers—like the 7.4% herd losses in Wisconsin and Minnesota—that’s a sign dairy is on their radar.
How Canadian Officials Frame the Review
Canadian ministers and Dairy Farmers of Canada have typically described past trade-driven dairy changes as “technical” or “administrative” adjustments while insisting supply management’s core remains untouched.
It’ll be telling to see whether they talk about the 2026 review purely as housekeeping, or whether you start hearing language about making quotas “function commercially” for trading partners—similar to the framing that emerged after the New Zealand settlement.
Questions to Ask Your Processor
To bring this closer to where your own milk truck turns in, here are three questions worth asking your plant or co-op:
- How important is Canada in your current and planned export mix compared to Mexico and Asia?
- Are you using USMCA dairy quotas now? If not, what would need to change—on TRQ rules or export caps—to make them worth pursuing?
- If USMCA’s dairy chapter gets stronger or weaker in 2026, how would that change your investment plans over the next five to ten years?
Their answers will tell you a lot about what the review might mean for your milk check.
The Bottom Line
When you step back from all the numbers and panel rulings, the picture is reasonably clear.
USMCA did open a real, quantified slice of Canada’s dairy market—around 3.6%, worth approximately $200 million in new annual access—to U.S. exporters and forced the elimination of Class 7. Total U.S. dairy exports to Canada have grown to an estimated $877 million in 2024, up 67% from 2021. That’s genuine progress.
The first USMCA panel showed that Canada’s original processor-heavy allocation wasn’t acceptable under the agreement. The second panel showed the limits of what legal text alone can achieve when the specific wording leaves loopholes.
New Zealand’s CPTPP experience demonstrated that a combination of solid evidence, favorable rulings, and persistent follow-through can push Canada into changes with real commercial value—not just cosmetic adjustments.
At the same time, consolidation on both sides of the border is a reality, not a forecast. U.S. data show over 15,000 dairies gone since 2017, with most milk now coming from herds over 1,000 cows. Wisconsin and Minnesota’s 7.4% herd losses in 2023 are just one sharp snapshot.
In Canada, economists like Sylvain Charlebois are warning they could lose nearly half their remaining dairy farms by 2030 if nothing changes—even under supply management.
The honest takeaway is this: USMCA isn’t going to decide, all by itself, whether you milk cows next year. That still comes down to your forage program, butterfat performance, fresh cow management, your debt load, your labor situation, and the people around your kitchen table.
What this agreement can do—especially if the 2026 review delivers targeted improvements—is narrow the range of bad surprises. It can make it less likely you wake up to another shock like those Grassland letters, or find that the access that looked good in a press release never made it past the quota gatekeepers.
In a business where we’re already juggling weather, feed, labor, and regulations, having one more piece of the puzzle behave a bit more predictably is worth paying attention to.
And as many of us have seen over the years, when producers speak up—to co-ops, to farm organizations, to lawmakers—it does shape how these agreements evolve. As 2026 gets closer, it’s not a bad time to think about what you’d like this deal to do for the people who actually care for the cows, and to make sure those voices are heard.
KEY TAKEAWAYS
- The Access Gap: USMCA promised U.S. dairy $200 million in new annual access to Canada. Fill rates average just 42%—more than half goes unused because of how Canada allocates quota to domestic processors
- The Enforcement Limit: The first dispute panel ruled in our favor. The second exposed a loophole: Canada can design allocation rules that favor processors without technically violating USMCA’s language
- New Zealand’s Playbook: Their CPTPP settlement forced Canada past cosmetic fixes, securing $157 million in annual export value. Persistent, evidence-backed pressure works
- The 2026 Window: The formal USMCA review and the ITC’s nonfat solids report (due March 2026) give U.S. dairy its clearest shot at turning paper access into real orders
- Your Move: Ask your processor about their Canada strategy. Run price scenarios with your lender around the 2026 timeline. Make sure dairy-state lawmakers hear from producers—not just lobbyists
Complete references and supporting documentation are available upon request by contacting the editorial team at editor@thebullvine.com.
Learn More:
- Decide or Decline: 2025 and the Future of Mid-Size Dairies – Provides a survival playbook for mid-size herds facing consolidation pressure, detailing why “standing still” drains equity and contrasting the specific ROI of expansion versus efficiency-focused technology adoption.
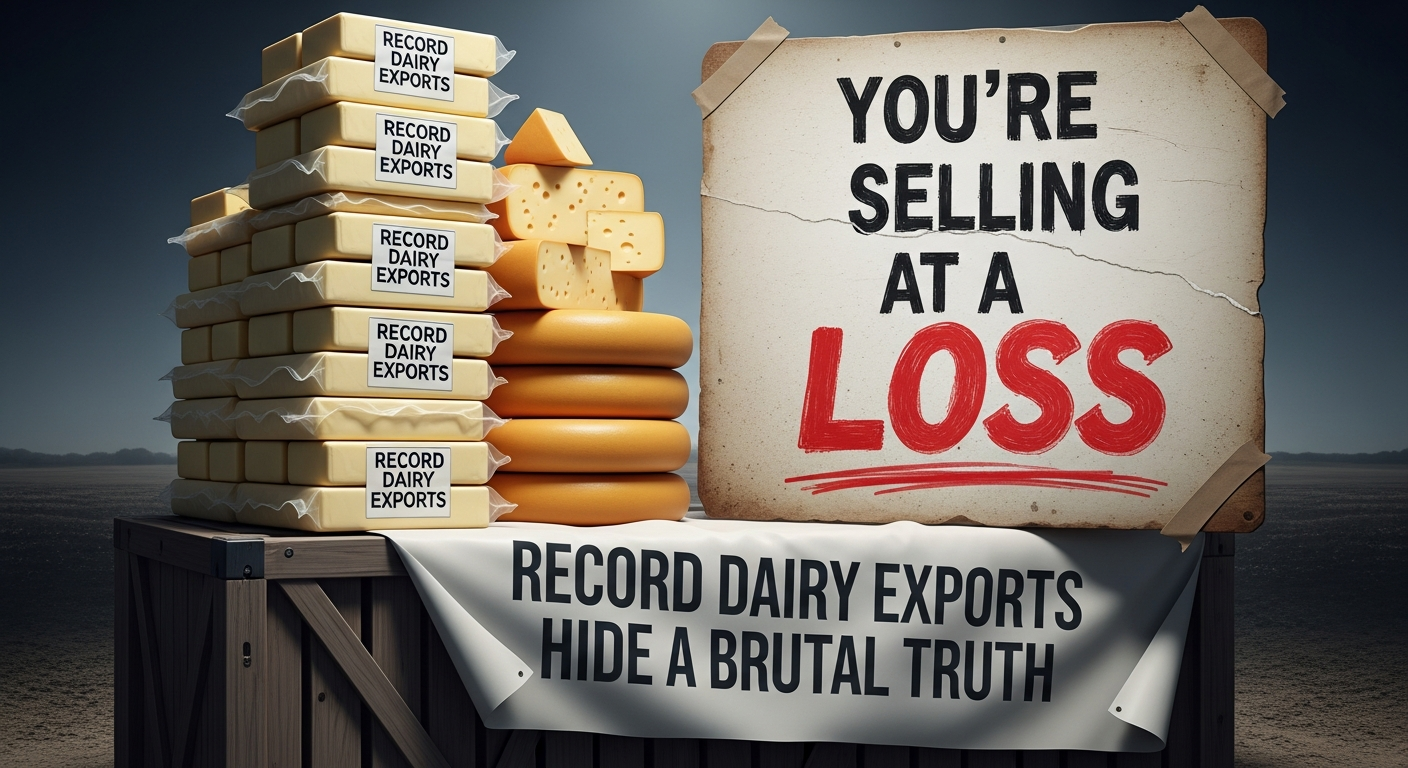
- The Wall of Milk: Making Sense of 2025’s Global Dairy Crunch – Uncovers the disconnect between record exports and lower milk checks, helping producers understand global supply dynamics to better anticipate price volatility and adjust their risk management strategies accordingly.
- AI and Precision Tech: What’s Actually Changing the Game for Dairy Farms in 2025? – Demonstrates how to combat labor shortages and tight margins with specific ROI timelines for precision feeding and AI monitoring, shifting technology from a luxury to a necessary survival tool.
 Join the Revolution!
 Join the Revolution!
Join over 30,000 successful dairy professionals who rely on Bullvine Weekly for their competitive edge. Delivered directly to your inbox each week, our exclusive industry insights help you make smarter decisions while saving precious hours every week. Never miss critical updates on milk production trends, breakthrough technologies, and profit-boosting strategies that top producers are already implementing. Subscribe now to transform your dairy operation’s efficiency and profitability—your future success is just one click away.