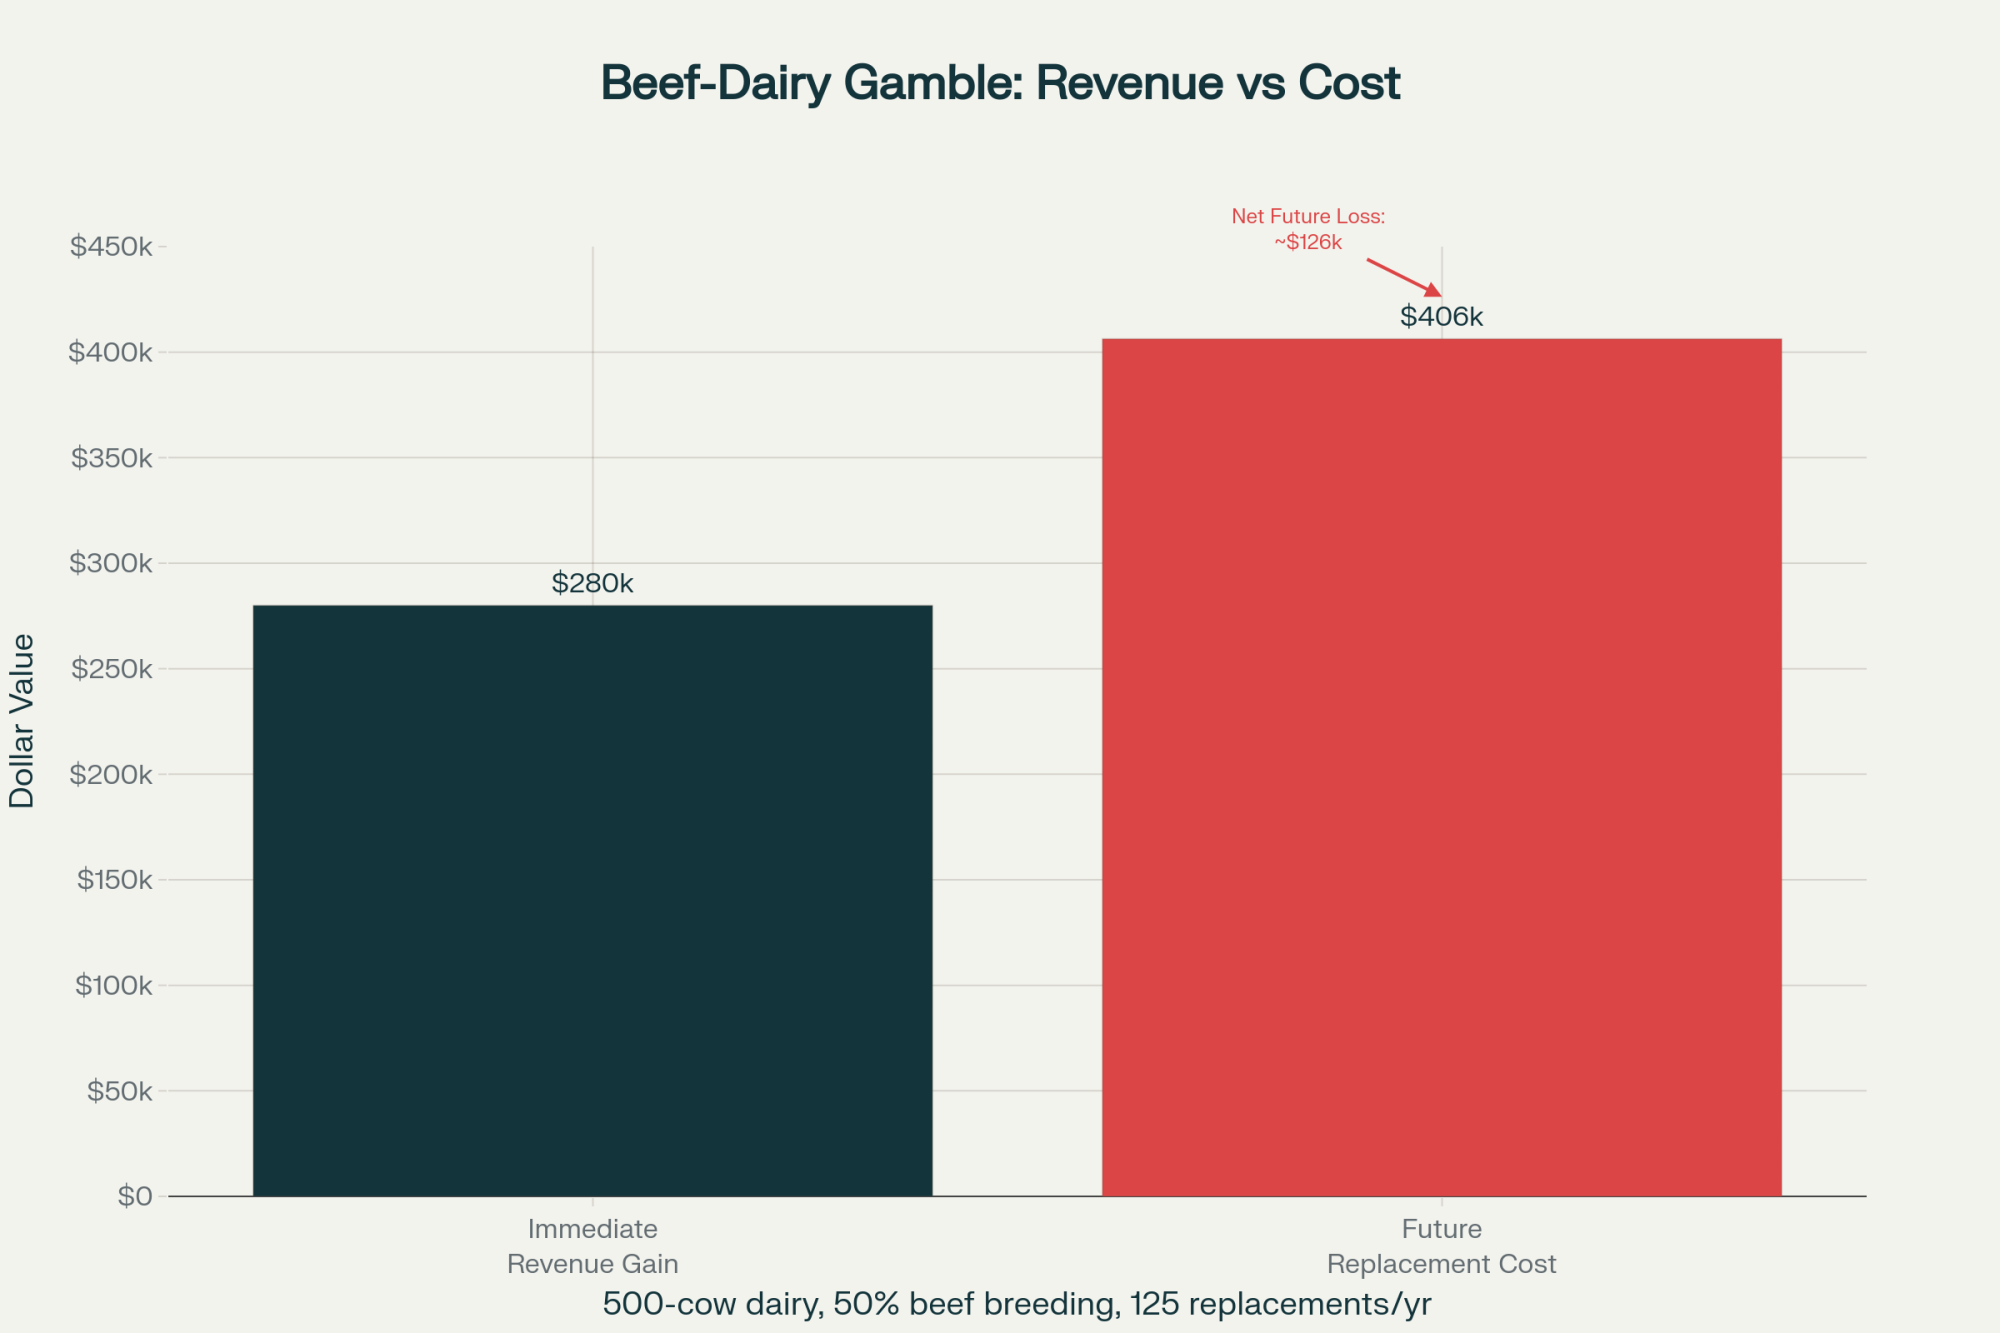
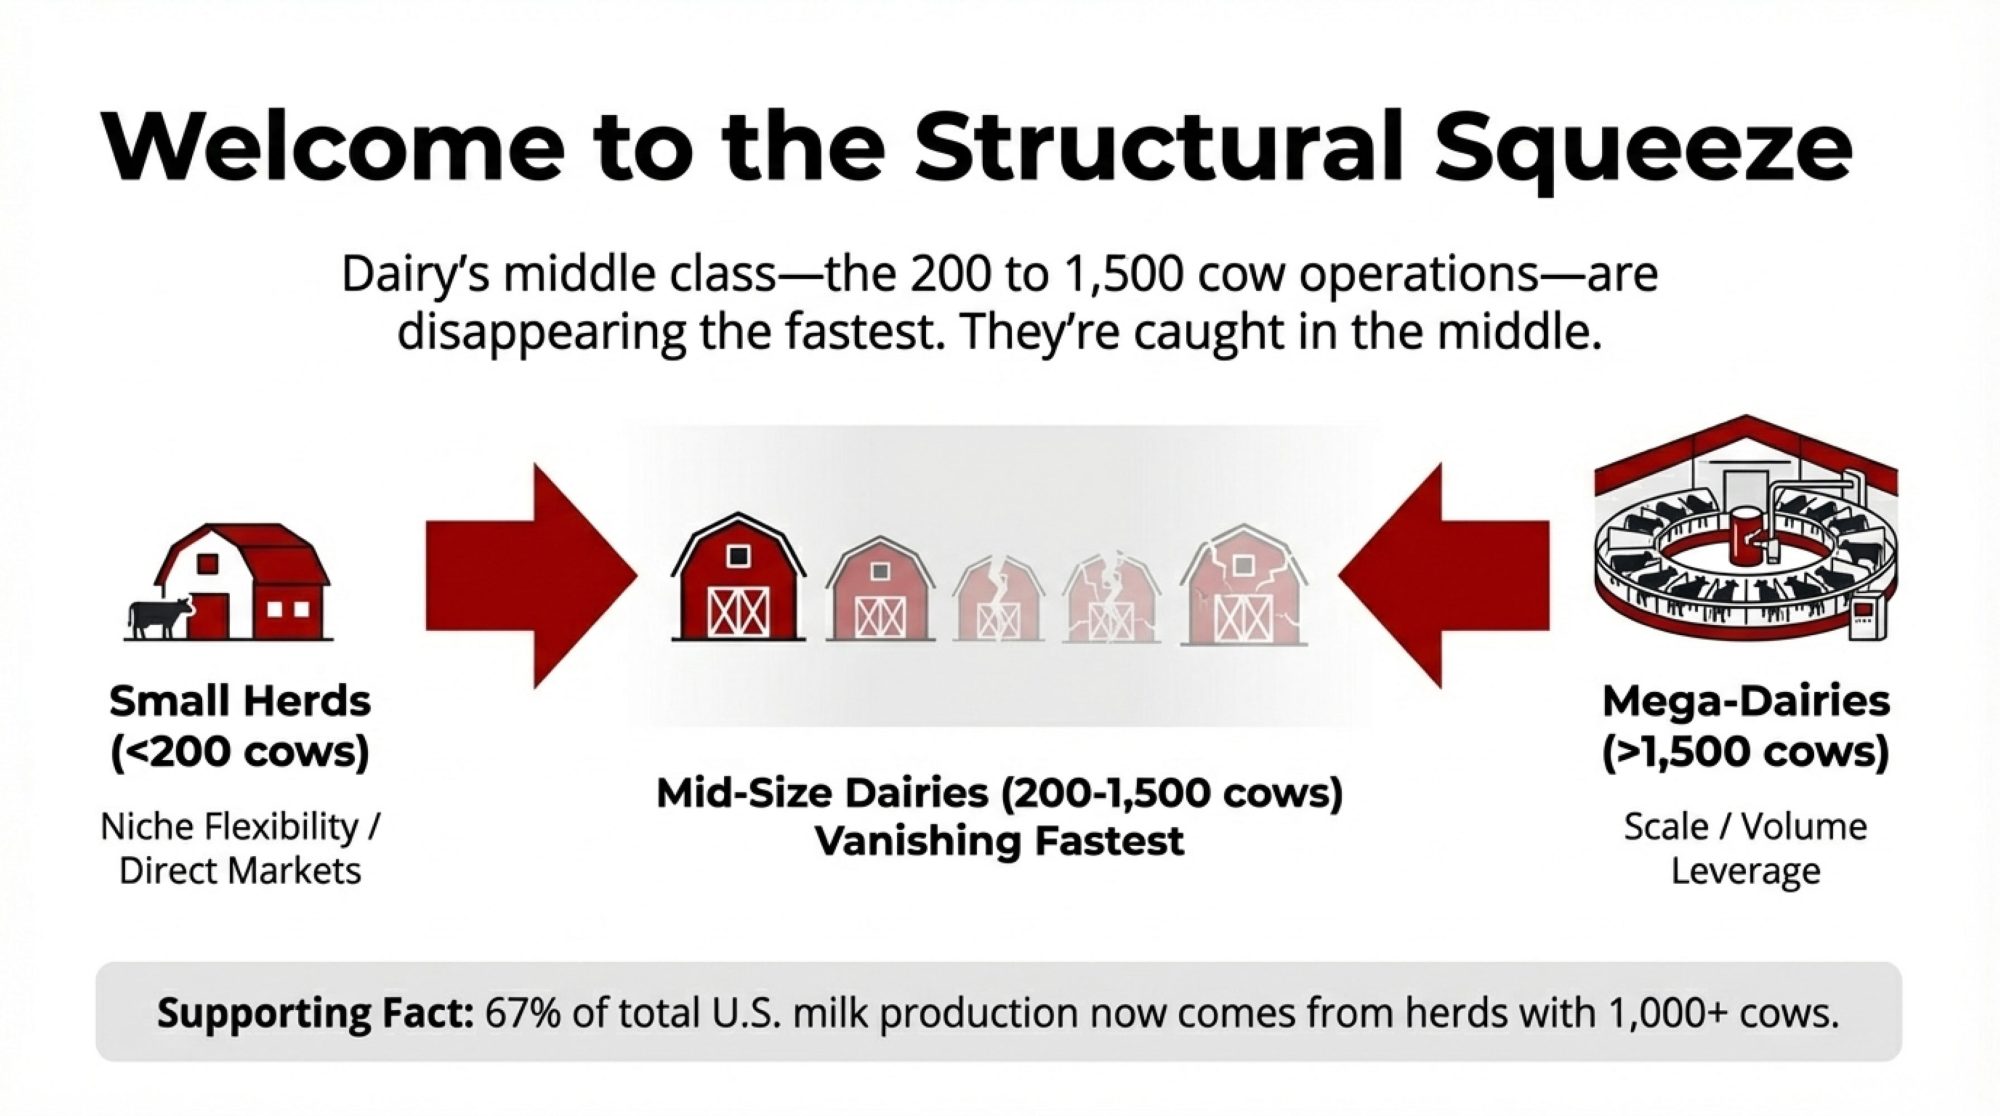
Too big for local markets. Too small for volume deals. The 200-1,500 cow dairies—dairy’s middle class—are disappearing fastest. Here’s why.

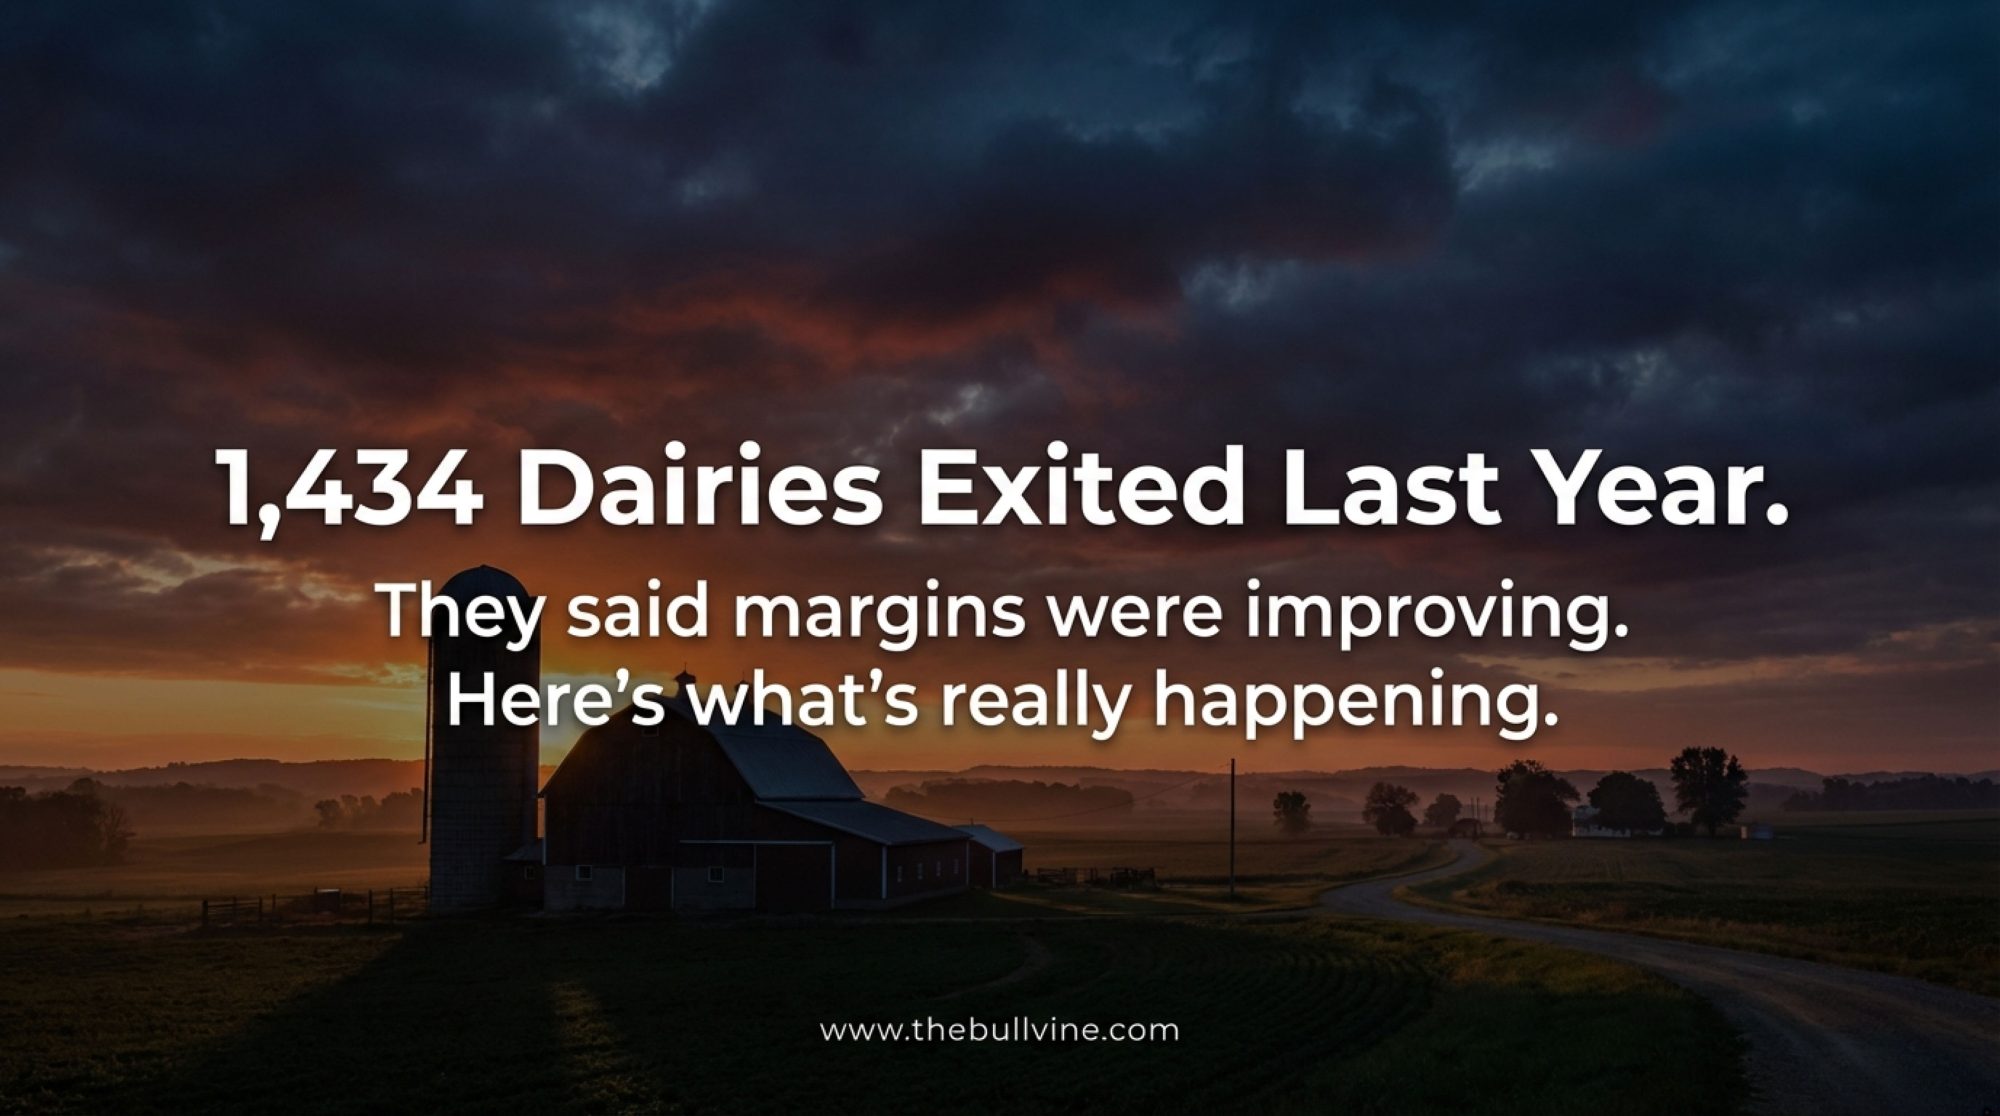
EXECUTIVE SUMMARY: Something doesn’t add up. Last year, 1,434 U.S. dairies exited—a 5% drop—even while margins were supposedly improving. That’s not a rough patch; it’s a structural squeeze. Mid-size family operations (200-1,500 cows) are disappearing fastest, caught between the flexibility of small herds and the leverage of mega-dairies. Ownership is aging—22% of producers are now 65 or older—while more than half of on-farm labor comes from immigrant workers, quietly reshaping the traditional family farm model. The economics keep tightening too: farmers capture just 25 cents of every retail dairy dollar on average, yet absorb rising input and compliance costs that never show up in the milk check. With Chapter 12 bankruptcies in 2025 already exceeding last year’s full total, the warning signs are impossible to ignore. This analysis breaks down what’s really driving these exits—pricing structures, policy gaps, regulatory burdens, succession cliffs—and provides concrete early-warning indicators and financial benchmarks to help you evaluate what comes next.
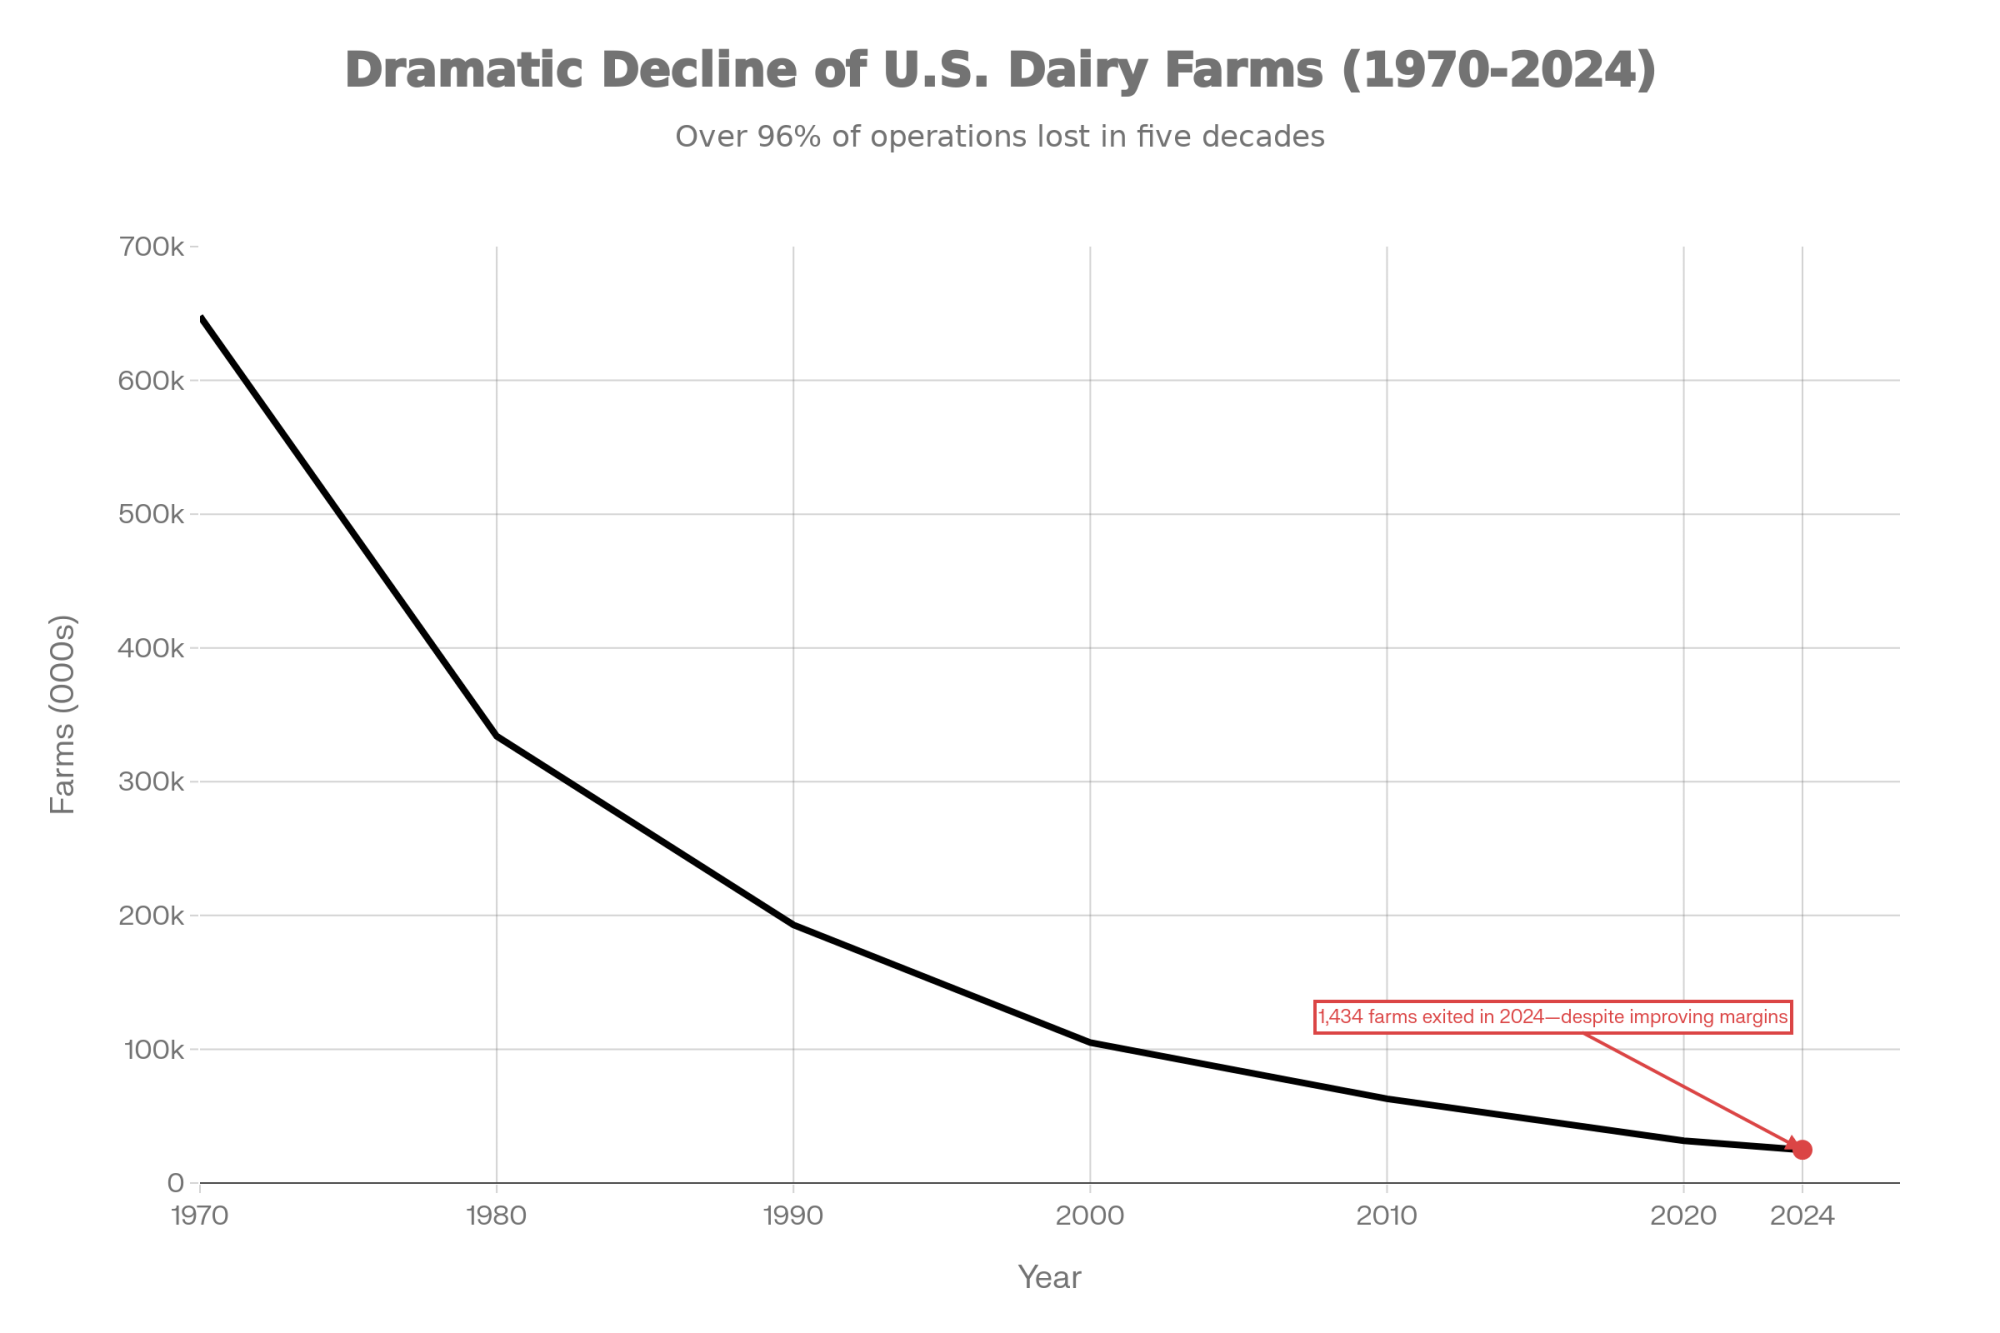
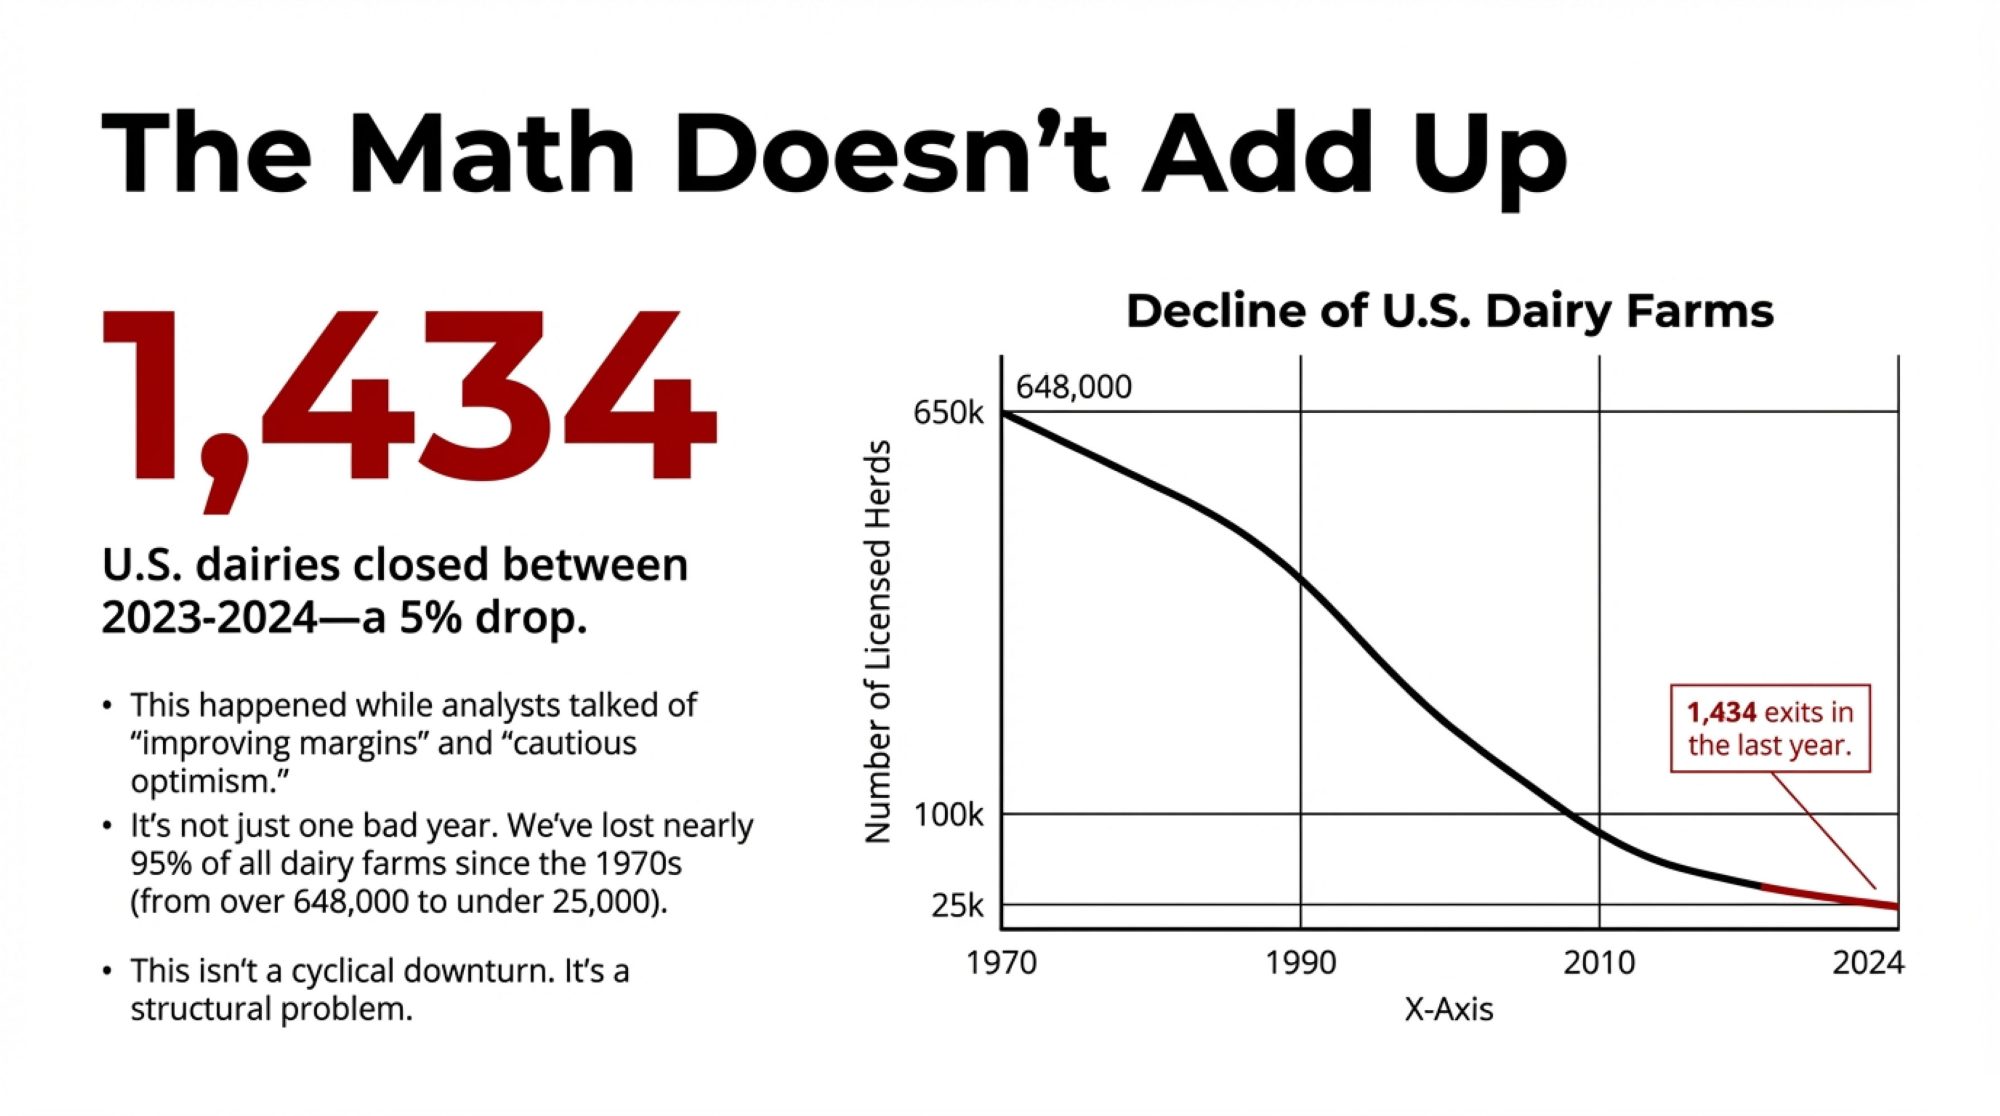
Here’s a number that should give every dairy producer pause. The United States now has roughly 24,800 licensed dairy herds, down about 5% from just a year ago—that’s according to Progressive Dairy’s 2024 statistics and confirmed by USDA’s milk production reports. And if you zoom out further, we’ve lost close to 95% of our dairy farms since the early 1970s. Back then, over 648,000 operations were milking cattle. Today? Fewer than 25,000.
And yet—here’s what’s puzzling—national outlooks for 2024 and into 2025 have talked about “improving” margins. Feed costs came down a bit. Wholesale prices firmed up. Analysts started using phrases like “cautious optimism.” So why did roughly 1,400 more dairies still exit last year? Why are so many families I talk with saying they’re drawing down equity just to keep the lights on?
I’ve had versions of this conversation with producers from small tie-stalls in Vermont to large dry lot operations out West and mid-size freestalls across Wisconsin. And what’s becoming clear is that we’re not just dealing with another bad price year in one region. We’re looking at something more structural: the collision of 365-day biology, equipment, and regulatory realities, cheap-food expectations, reactive subsidy programs, and a market structure that has steadily shifted bargaining power away from the farm gate.
The goal here is to unpack those pieces and pull them together into something practical—warning signs to watch, questions to ask, and options to consider, whatever your herd size or region.
Where We Really Stand: Fewer Farms, More Milk, and Thinner Buffers
Let’s start with the big picture, because it sets the stage for everything else.
USDA economists have been documenting this shift for three decades now. According to their consolidation research, about 65% of the nation’s dairy herd now lives on operations with 1,000 cows or more—Rabobank’s analysis puts it even higher, around 67% of total U.S. milk production. Average herd size keeps climbing in almost every region, while total farm numbers decline between censuses.
Analysis of the 2022 Ag Census showed the same pattern in sharper detail: fewer dairy farms, higher total output, and production increasingly concentrated in states that favor large confinement or dry lot systems—California, Idaho, Texas, and parts of the High Plains.
Recent 2024 statistics added some granularity: about 1,434 dairies closed between 2023 and 2024, a reduction of roughly 5%, even though total U.S. milk production ticked up thanks to gains in per-cow output. Those gains are coming from exactly the things many of you have invested in—better forage quality, more consistent fresh cow management, tighter reproduction programs, and genetics that support higher butterfat performance.
Who’s Actually Leaving—and Who’s Staying
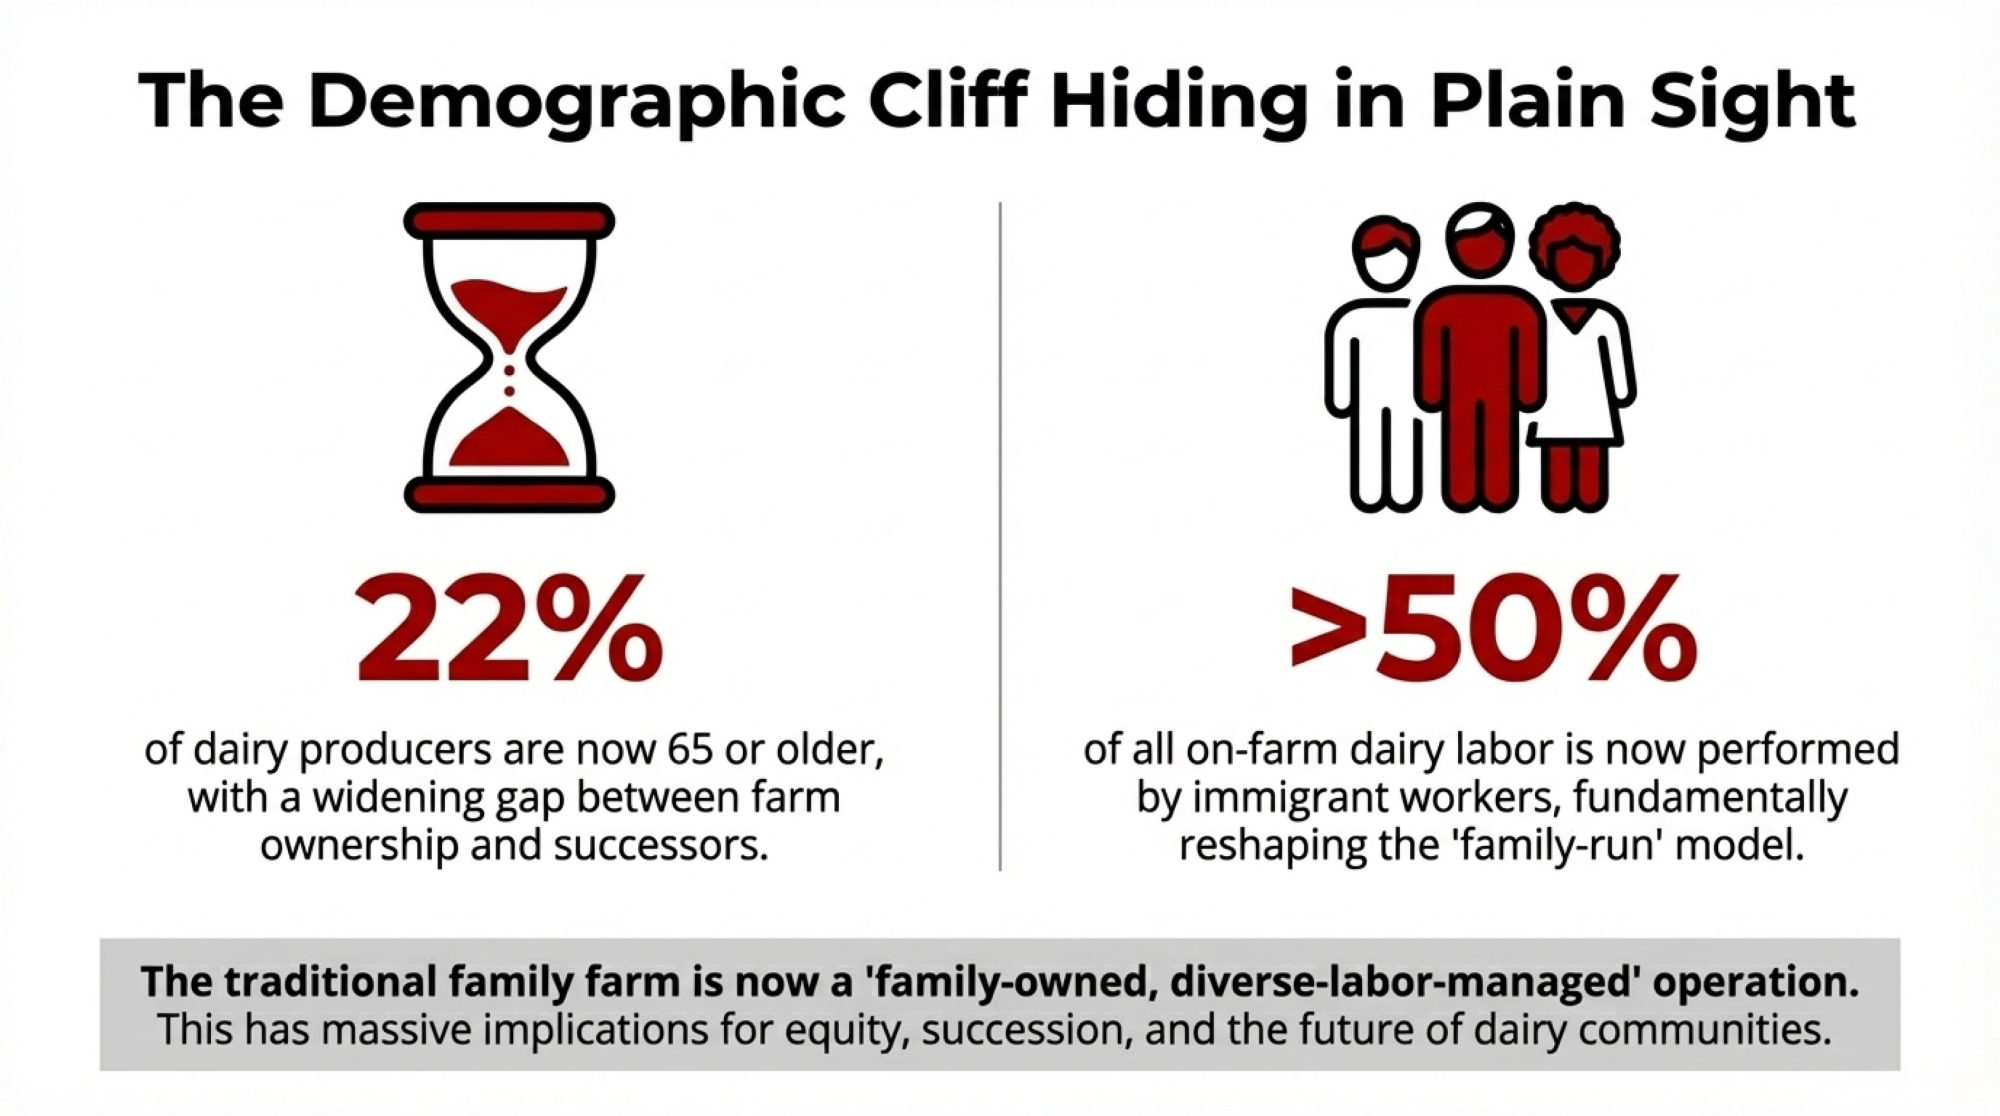
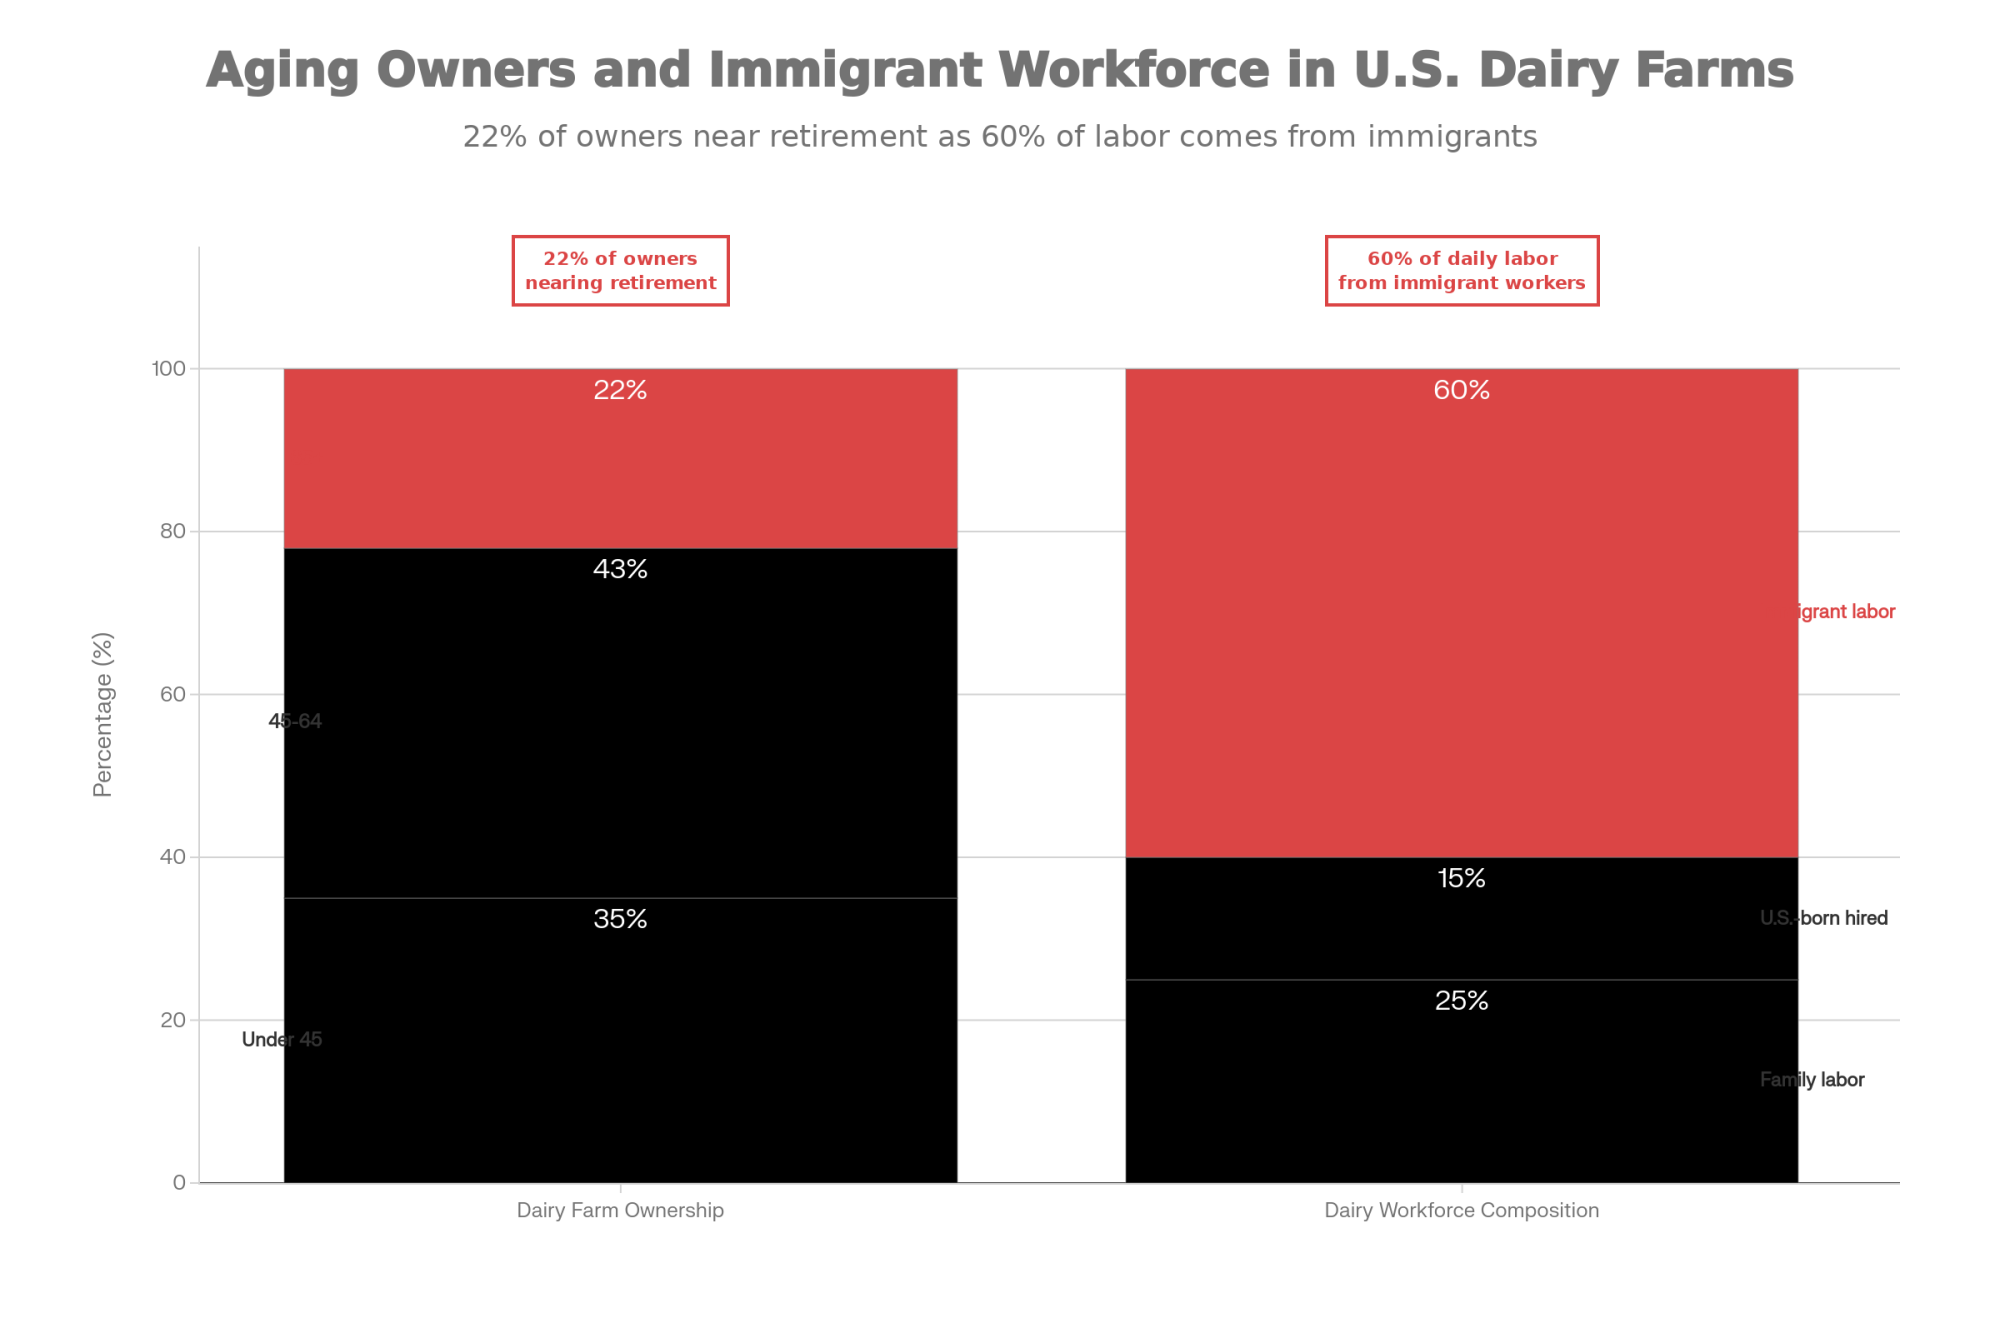
There’s a demographic story underneath these numbers that’s worth understanding. According to the USDA’s 2022 Census of Agriculture dairy highlights, 99% of dairy farm producers are white, and while dairy producers skew younger than farmers overall—averaging 51.4 years compared to 58.1 for all U.S. producers—22% are already 65 or older. That’s a significant portion of the industry approaching retirement age.
Here’s what makes this particularly challenging: the exits are heavily concentrated among older operators who lack identified successors. When you combine aging ownership with the capital intensity of modern dairy, you get a widening gap between who holds the farm titles and who actually does the daily work.
The 2024 Farmworker Justice report and National Milk Producers Federation research—going back to their 2014 labor survey and confirmed by more recent industry estimates—tell the other half of this story: more than half of all dairy labor is now performed by immigrant workers, predominantly Hispanic and Latino. Cornell University’s Richard Stup, who studies dairy labor extensively, puts the figure at 50-60% in the Northeast and Midwest, and closer to 80% in the Southwest and Western states. On large operations, especially, the workforce keeping those herds milked, fed, and managed looks very different from the families whose names are on the deeds.
These dynamics play out differently depending on the operation type as well. Large confinement dairies and dry lot systems in the West tend to have higher reliance on hired immigrant labor, while smaller grazing-based operations in the Northeast and Upper Midwest often still depend more heavily on family labor—though even many of those have shifted toward hired help for milking and feeding as family members pursue off-farm careers.
This isn’t a criticism—it’s a structural reality. What we used to call “the family farm” is increasingly becoming a “family-owned, diverse-labor-managed” operation. And that shift has real implications for how we think about equity, succession, and the long-term sustainability of dairy communities.
The Consolidation Math
From a national efficiency standpoint, these structural shifts have lowered average costs per hundredweight by spreading fixed investments—parlors, manure systems, feed centers—over more cows. From a family-business standpoint, the picture looks different. Mid-size operations in the 200 to 1,500-cow range have been exiting at significantly higher rates than very small lifestyle herds or the very largest facilities.
| Attribute | Small Operations (<200 cows) | Mid-Size Operations (200-1,500 cows) | Large Operations (1,000+ cows) |
|---|---|---|---|
| Herd Size | 50-200 milking cows | 200-1,500 milking cows | 1,000-10,000+ milking cows |
| Labor Model | Primarily family labor; occasional part-time help | Mixed family + hired labor—high wage pressure, management complexity | Fully professionalized hired workforce; structured HR systems |
| Capital Intensity | Lower fixed costs; older facilities often fully depreciated | High fixed costs with inadequate scale to spread them; deferred cap-ex common | Very high fixed costs, but spread over large volumes; access to institutional capital |
| Milk Marketing Leverage | Can pivot to direct sales, on-farm processing, local co-ops | Too large for niche markets; too small for volume premiums or bargaining power | Strong negotiating position; dedicated hauling; premium access |
| Revenue Diversification | Agritourism, farmstead cheese, direct retail, CSA models viable | Limited flexibility—committed to commodity production without scale advantages | Vertical integration opportunities; partnerships with major processors |
| Fixed Cost per CWT | $9-12/cwt (higher per-unit, but lower total exposure) | $11-15/cwt—worst of both worlds: high per-unit costs + large total debt load | $8-10/cwt (economies of scale in feed, facilities, management) |
| Primary Vulnerability | Succession risk; aging infrastructure; isolation from supply chain | Caught in structural vise: can’t pivot like small farms, can’t compete on cost like large farms | Regulatory exposure; environmental permits; commodity price swings |
| Exit Rate Trend | Stable or slowly declining (lifestyle/legacy farms) | Exiting fastest—5-7% annual decline in many regions | Growing slowly; acquiring exiting mid-size operations |
In the Upper Midwest, where processing infrastructure has consolidated significantly over the past decade, this dynamic plays out in real time. When a regional cheese plant closes, or a co-op consolidates routes, the ripple effects hit mid-size operations hardest—they’re too big to pivot to direct marketing easily, but not big enough to justify dedicated hauling arrangements or negotiate volume-based premiums.
You know, I was talking with a group of extension economists recently, and one of them put it pretty well: from a national efficiency standpoint, consolidation looks neat and tidy on paper. From a family business standpoint, it often looks like the ladder is missing a few crucial rungs in the middle.
That’s worth sitting with for a moment.
Dairy’s 365-Day Biology: Why Downtime Hurts More Than It Looks on Paper
When we start talking about regulations, equipment costs, or subsidy programs, the conversation can drift into abstractions pretty quickly. Let’s bring it back to the cows for a minute, because that’s where the rubber meets the road.
Row-crop producers manage a biological asset that, once harvested, becomes inventory. Corn can sit in a bin for months without changing its metabolic state. Dairy is fundamentally different. A high-producing Holstein or Jersey in early lactation is closer to a marathon runner than a pallet of grain—her rumen pH, energy balance, and immune function can swing quickly if feed timing or quality shifts even modestly.
The research on transition periods and feeding behavior is pretty consistent on this. Even moderate disruptions in feeding time or abrupt ration changes can reduce dry matter intake, bump up subacute ruminal acidosis risk, and depress milk yields for days, particularly in fresh cow groups. Poorly timed or executed silage harvest—chopped too wet or too dry, packed insufficiently—reduces fiber digestibility and energy density. That can cost you one to several pounds of milk per cow per day for as long as you’re feeding that forage.
And inadequate manure scraping or holding capacity? That leads to longer standing times in wet alleys or stalls, which correlates with higher lameness, digital dermatitis, and elevated somatic cell counts.
Here’s what I’ve noticed in talking with producers across different regions: any disruption that delays feeding, degrades forage quality, or compromises cow comfort quickly becomes more than today’s problem. It affects the entire lactation curve and, through reproduction, the next generation of calves.
That’s as true on a 120-cow freestall in upstate New York as it is on a 3,000-cow dry lot in west Texas.
So when your feed mixer won’t start before the morning milking, it doesn’t just shuffle your chore schedule. It upsets the biology of every cow in that pen. When a chopper breakdown pushes corn silage harvest half a week later than planned, the economic cost isn’t just the repair bill—it’s tied directly to metabolism for the next twelve months.
DEF Systems: When Compliance Technology Meets the Feed Alley
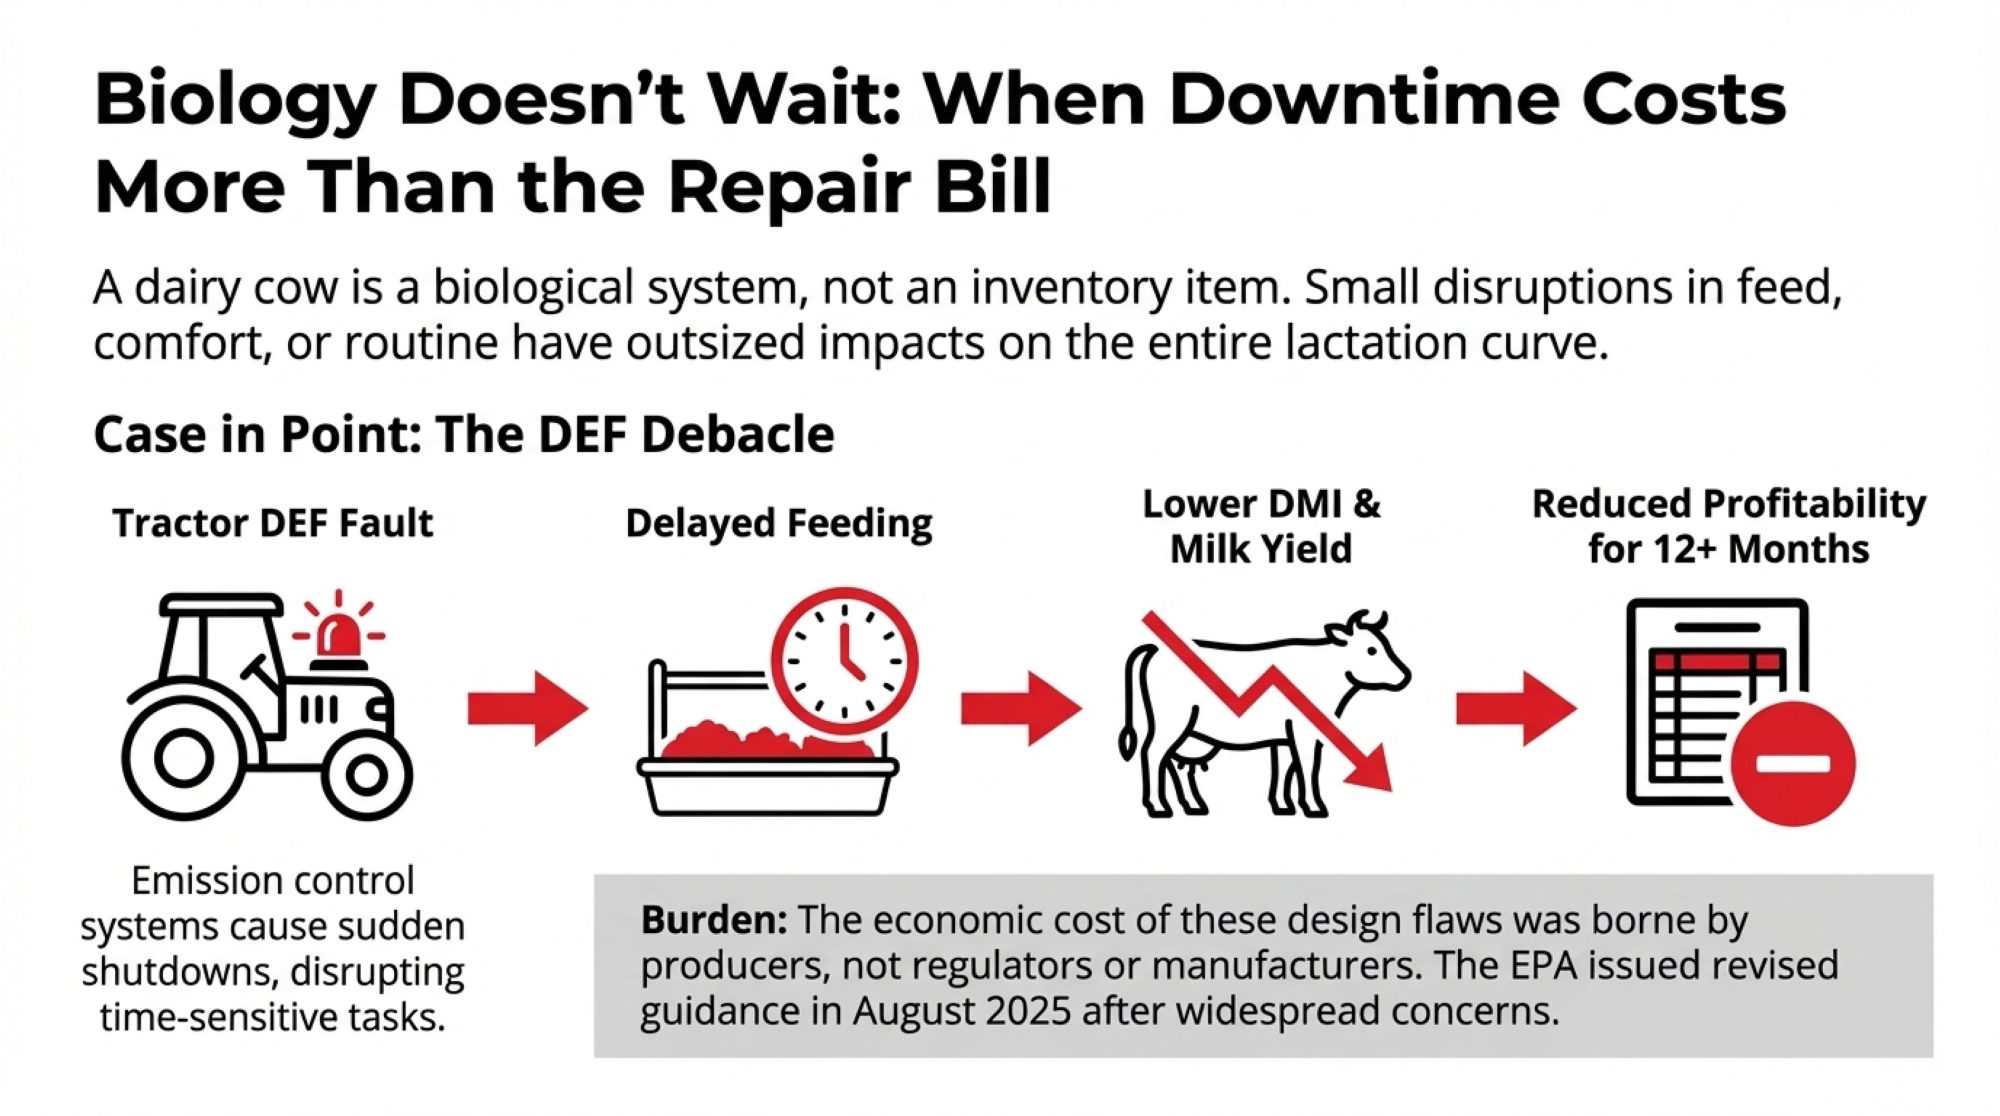
This brings us to diesel exhaust fluid, or DEF. If you’ve spent any time around dairy operations or rural trucking in the last few years, you’ve probably heard the stories: tractors, TMR mixers, or milk trucks derating or shutting down because of DEF-related faults, even when the engine itself was mechanically sound.
These problems typically involve sensors, heaters, or software in the DEF system triggering power reductions or full shutdowns meant to enforce emissions compliance—but doing so at exactly the wrong moments.
In August 2025, the EPA responded to these sustained concerns. According to the agency’s official announcement, confirmed by DieselNet’s technical coverage, EPA Administrator Lee Zeldin—speaking at the Iowa State Fair—announced revised guidance requiring engine and vehicle manufacturers to update software and control strategies. The goal was to prevent many DEF failures from causing sudden power loss or stalls, especially in conditions critical to agriculture and freight.
The EPA’s own documentation acknowledges what many of us have experienced firsthand: “widespread concerns from farmers, truckers, and other diesel vehicle operators about a loss of speed and power, or engine derates.”
Looking at this development, a couple of things stand out.
The original implementation of DEF shutdown logic didn’t fully account for the continuous, time-sensitive nature of dairy operations—particularly around feeding and harvest logistics. The economic burden of those design choices has been borne primarily by producers and rural businesses, not by those who designed the regulatory framework or the equipment.
From an environmental perspective, the general scientific consensus is that tailpipe emissions from individual farm machines constitute a relatively small portion of dairy’s total greenhouse gas footprint, compared with enteric methane, manure storage, and feed production. That doesn’t mean emissions controls don’t matter. But it does suggest the highest climate return per dollar for dairy likely comes from investments in manure management—lagoon covers, digesters—along with improved feed efficiency and methane-reducing feed additives, rather than from single-point exhaust controls alone.
What’s encouraging is that some of the most forward-thinking farms are pushing on both fronts now. They’re advocating for uptime-aware emissions policy and equipment accountability, while simultaneously exploring digesters, improved covers, and ration strategies that can generate new income streams where the economics pencil out. It’s still early days for many of these technologies, but the direction is promising.
The Hidden Cost of “Cheap” Milk
Let’s talk about what happens between your bulk tank and the supermarket shelf, because this is where much of the producer frustration comes from—and it’s worth understanding the dynamics clearly.
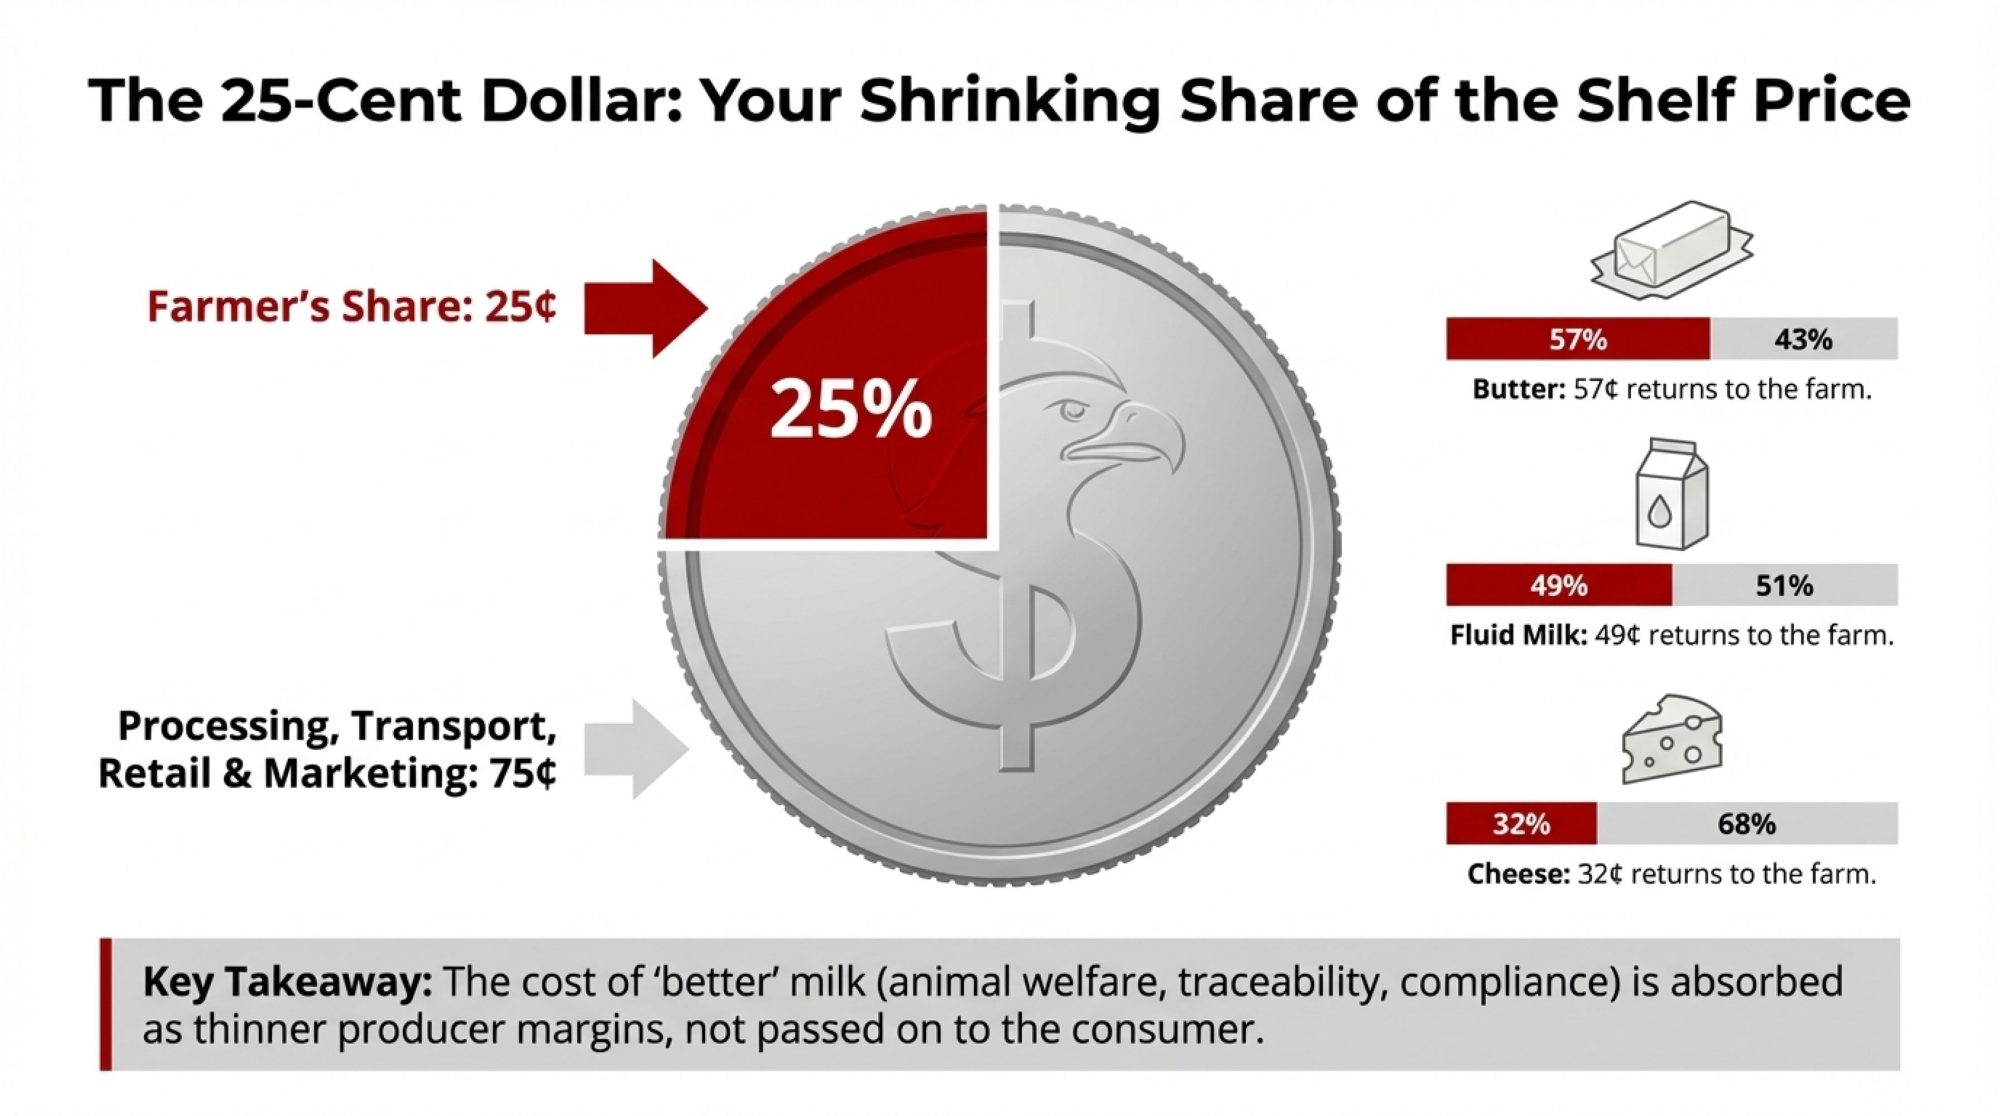
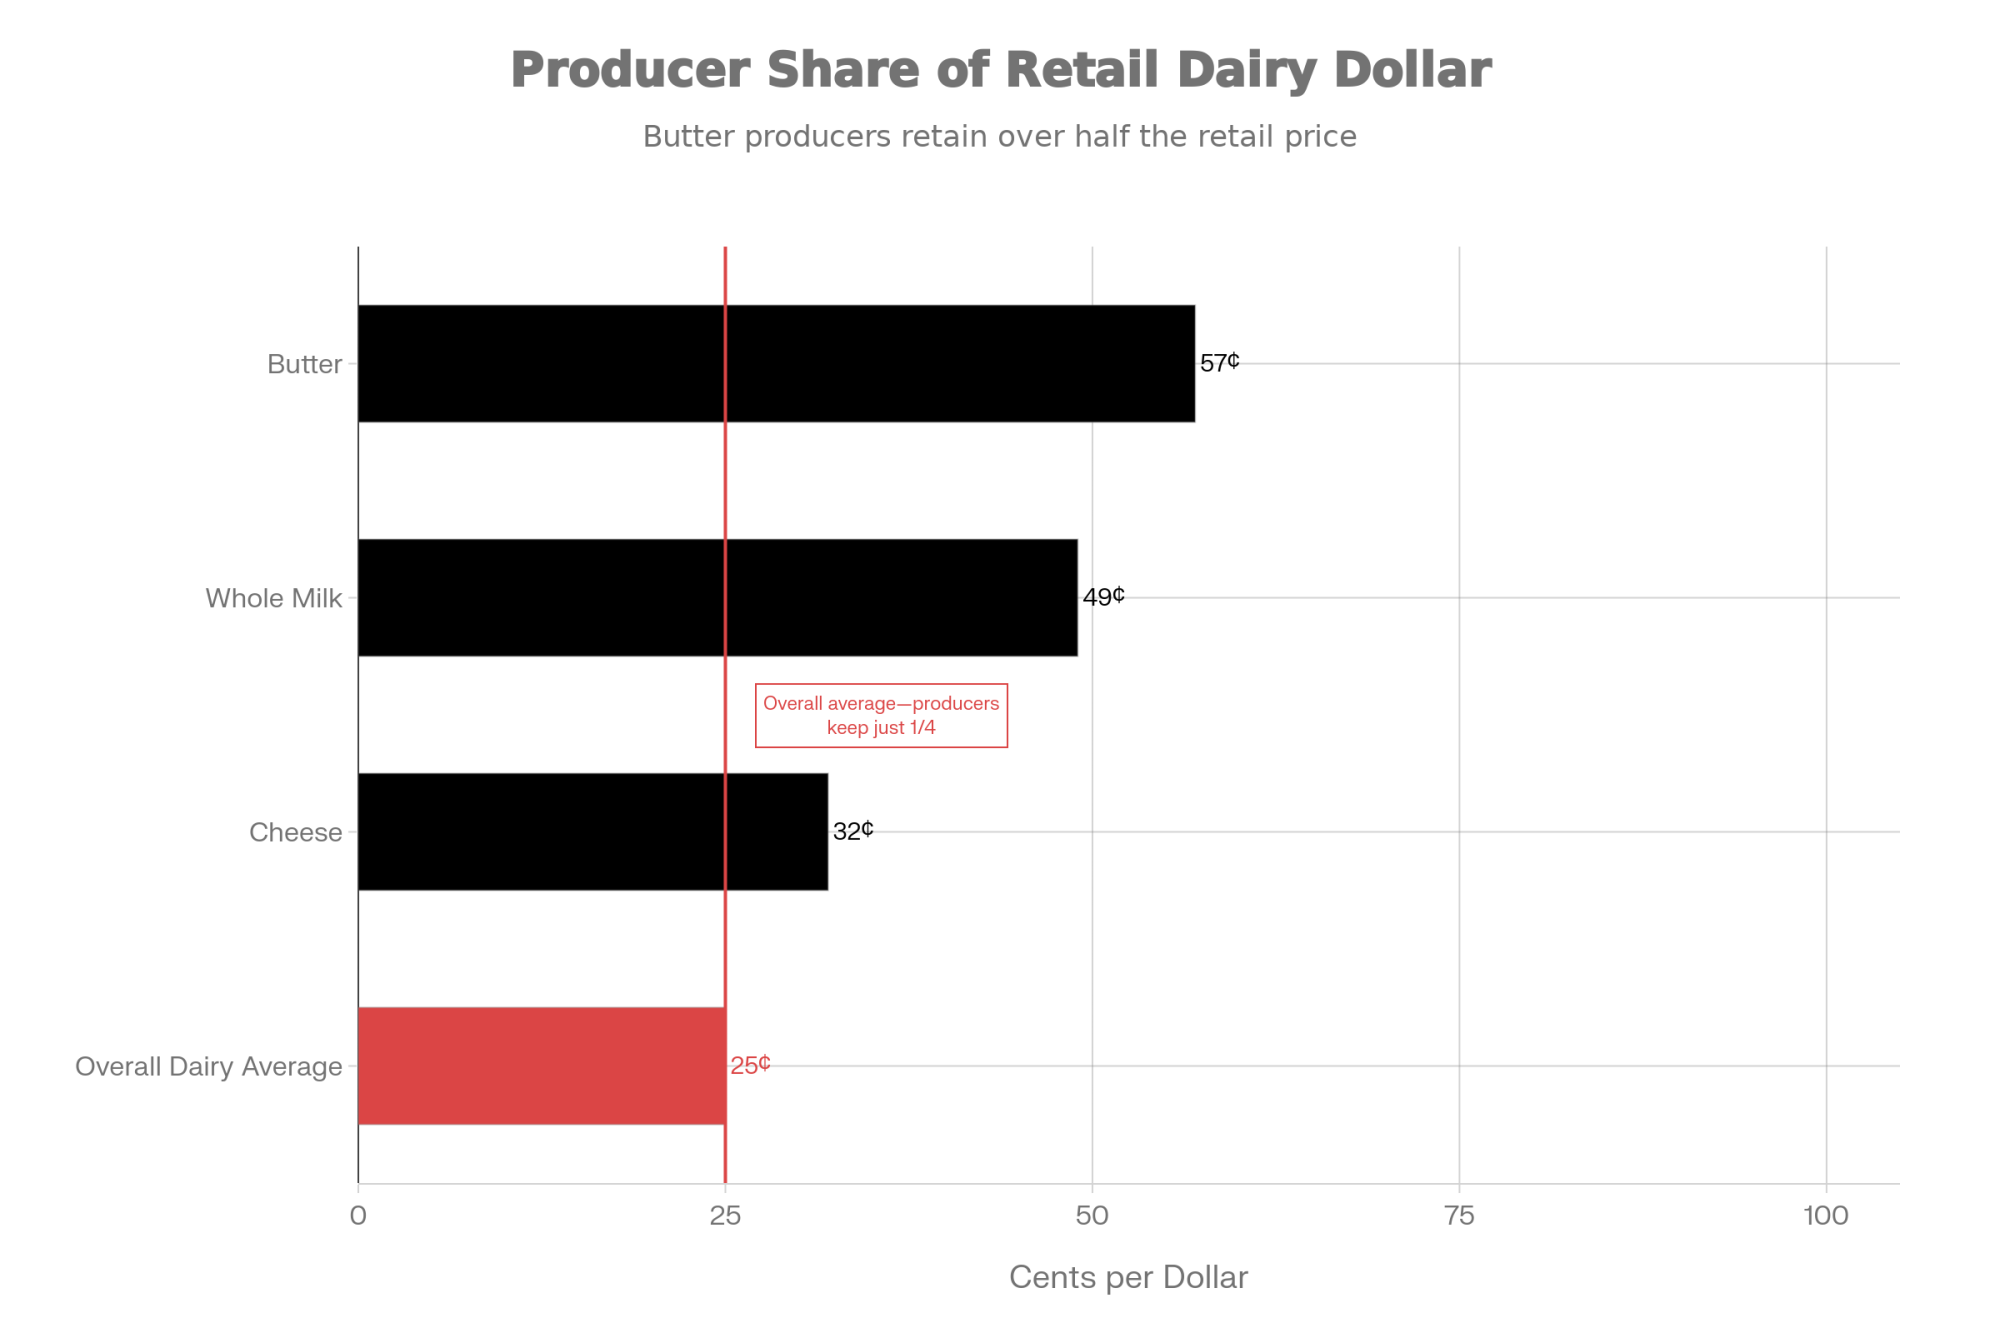
USDA’s Economic Research Service tracks price spreads from farm to consumer, and the numbers are revealing. According to their 2024 data, the share of the retail dollar that actually reaches the farm varies dramatically by product. What jumps out from this data is the extent of variation across products. Butter returns the most to producers at 57 cents on the dollar—partly because it’s less processed and has fewer intermediary steps. Whole milk comes in around 49 cents. But once you get into cheese (32 cents) and the overall dairy basket average (just 25 cents), you’re looking at a system where three-quarters of what consumers pay goes to processing, packaging, transportation, wholesale and retail margins, and marketing.
So when you hear figures about farmers getting “30 cents on the dollar,” the reality depends a lot on what’s being measured. For fluid milk, it’s closer to half. For the processed products that dominate grocery dairy cases, it’s considerably less.
Meanwhile, consumer research tells an interesting story. A 2024 PwC Voice of the Consumer survey—and this has been widely reported—found that respondents were willing to pay about 9.7% more for products they considered genuinely sustainable, even amid inflationary pressures. Studies on dairy specifically suggest that animal welfare and local sourcing claims can raise stated willingness to pay in survey environments.
Here’s the disconnect, though. When input and compliance costs rise—energy, labor, animal care programs like the National Dairy FARM Program, new traceability requirements—processors and retailers can often pass some of those higher costs into the shelf price. Farm-gate prices, though, remain heavily anchored to commodity values for cheese, powder, and butter that respond to global supply and demand, not necessarily to local regulatory costs.
The net result? A lot of the cost of “better” milk—documented welfare practices, carbon tracking, rigorous food safety systems—gets absorbed as thinner producer margins and greater income volatility, rather than being fully and transparently reflected in retail pricing.
I was talking with a producer group in the Northeast recently, and one of them made a point that stuck with me: consumers think paying 50 cents more for a gallon is lining the farmer’s pockets. In reality, we’re often the last ones to see that extra dime.
For many family dairies, that’s exactly where the feeling comes from that they’re subsidizing cheap milk with their own balance sheets.
Subsidies, Bridge Payments, and Why the Math Still Feels Tight
When farm incomes come under pressure, federal policy typically reaches for supplemental payments. Over the past several years, we’ve seen quite a few.
The Market Facilitation Program responded to trade tensions in 2018 and 2019. Coronavirus Food Assistance Program rounds during the pandemic provided significant support to dairy producers. Dairy Margin Coverage kicks in when national milk-over-feed margins fall below elected trigger levels, and Dairy Revenue Protection offers another insurance layer.
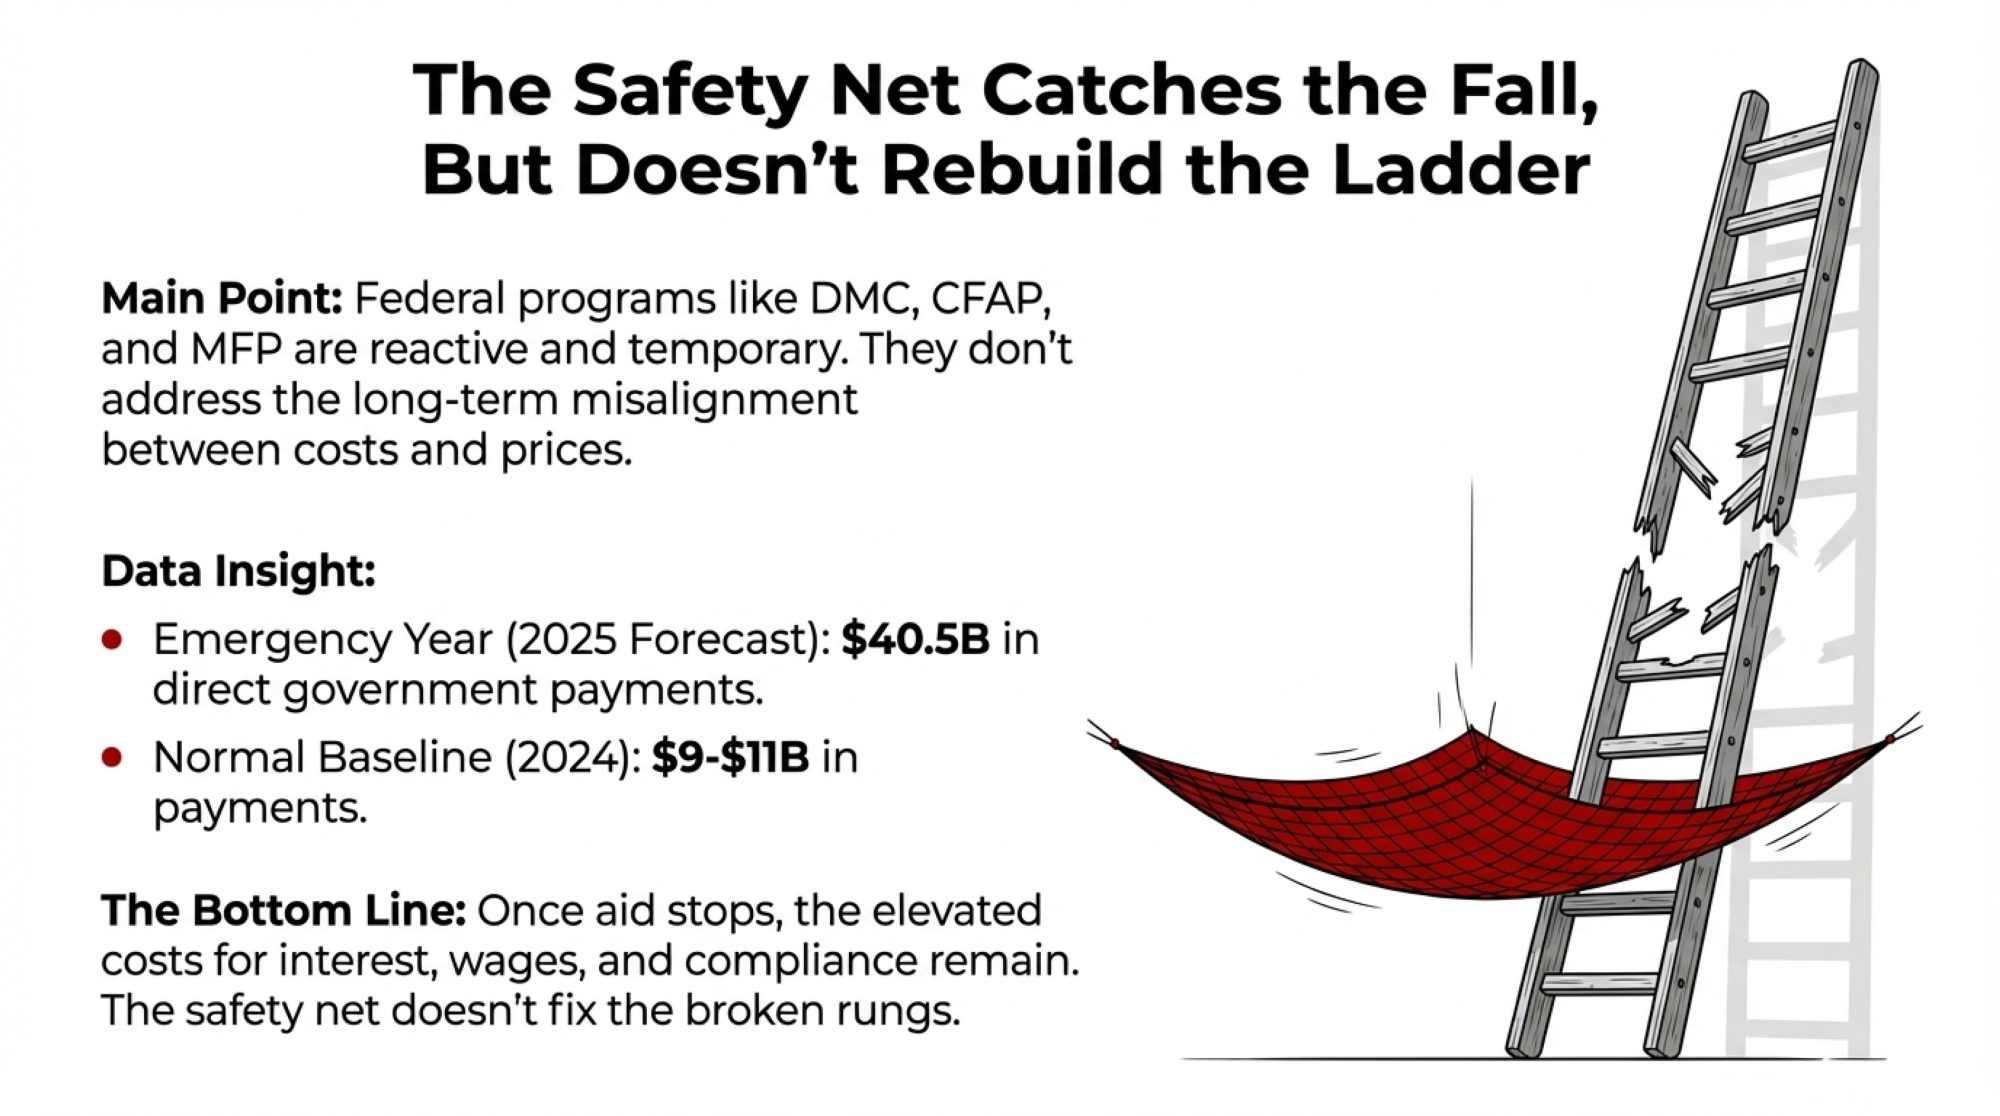
Here’s the thing about government payments, though—and this is where context matters. According to the USDA’s Economic Research Service, direct government payments are forecast at about $40.5 billion for 2025. But that’s an exceptional year with significant emergency support programs. In 2024, government payments across all of agriculture were considerably lower—in the range of $9 to $11 billion, according to USAFacts analysis of federal farm subsidy data.
During pandemic years like 2020, payments were dramatically higher, and yes, at those peak moments, government support did represent an unusually large share of net farm income. But those were crisis-response situations, not the normal baseline.
The pattern most producers experience is that these tools are reactive and temporary by design. They kick in when margins drop below certain levels or when specific events—such as tariffs, pandemics, or droughts—trigger relief. They don’t kick in when long-term cost structures gradually drift out of alignment with average prices.
Once prices recover above a DMC trigger or an aid window closes, payments stop—even if interest, wages, insurance, and environmental compliance costs remain elevated.
Policy researchers have noted that while such subsidies can stabilize incomes in the short run, they don’t rewrite the underlying pricing rules. They can even encourage more leverage and land-cost inflation if they’re treated as permanent rather than emergency measures.
That’s part of why many mid-size dairies feel like they’re always one interest-rate move or one equipment breakdown away from serious trouble. The safety net might catch a fall, but it doesn’t rebuild the ladder’s rungs.
The Structural Squeeze: Consolidation Isn’t an Accident
Here’s an important point that sometimes gets lost: today’s dairy structure isn’t random drift. It’s the outcome of long-running economic forces that have shaped investment patterns, technology adoption, and market relationships for decades.
Larger herds tend to have lower fixed costs per hundredweight for parlors, manure systems, feed centers, and management overhead—at least up to a point. New technologies like automated milking and feeding systems, fresh cow monitoring tools, and advanced reproductive programs often deliver their best returns when spread over more cows.
As a result, the “median” efficient herd size in cost-of-production data has marched steadily upward, and many risk-management tools, co-op contracts, and lender products have been quietly built around that larger baseline. A recent Dairy Global overview noted that access to technology and capital intensity now create a sharper divide between operations able to keep reinvesting and those that struggle to maintain core infrastructure.
It’s worth stressing that large doesn’t automatically mean “bad,” and small doesn’t automatically mean “good.” I’ve visited well-run 5,000-cow dry lot operations out West that manage cow comfort, reproduction, and butterfat performance exceptionally well, with sophisticated fresh cow protocols and strong employee training programs. I’ve also seen 80-cow tie-stall herds in the Northeast that are profitable and deeply connected to local markets—and others struggling in outdated facilities with no clear successor.
The challenge many 200 to 1,200-cow family operations face is that they sit in the middle of this spectrum. They’re large enough to need hired labor, structured management protocols, and regular capital replacements. But they may not yet have the scale or bargaining leverage of the very largest units.
That’s where questions about whether the current system still works for their model become most pointed.
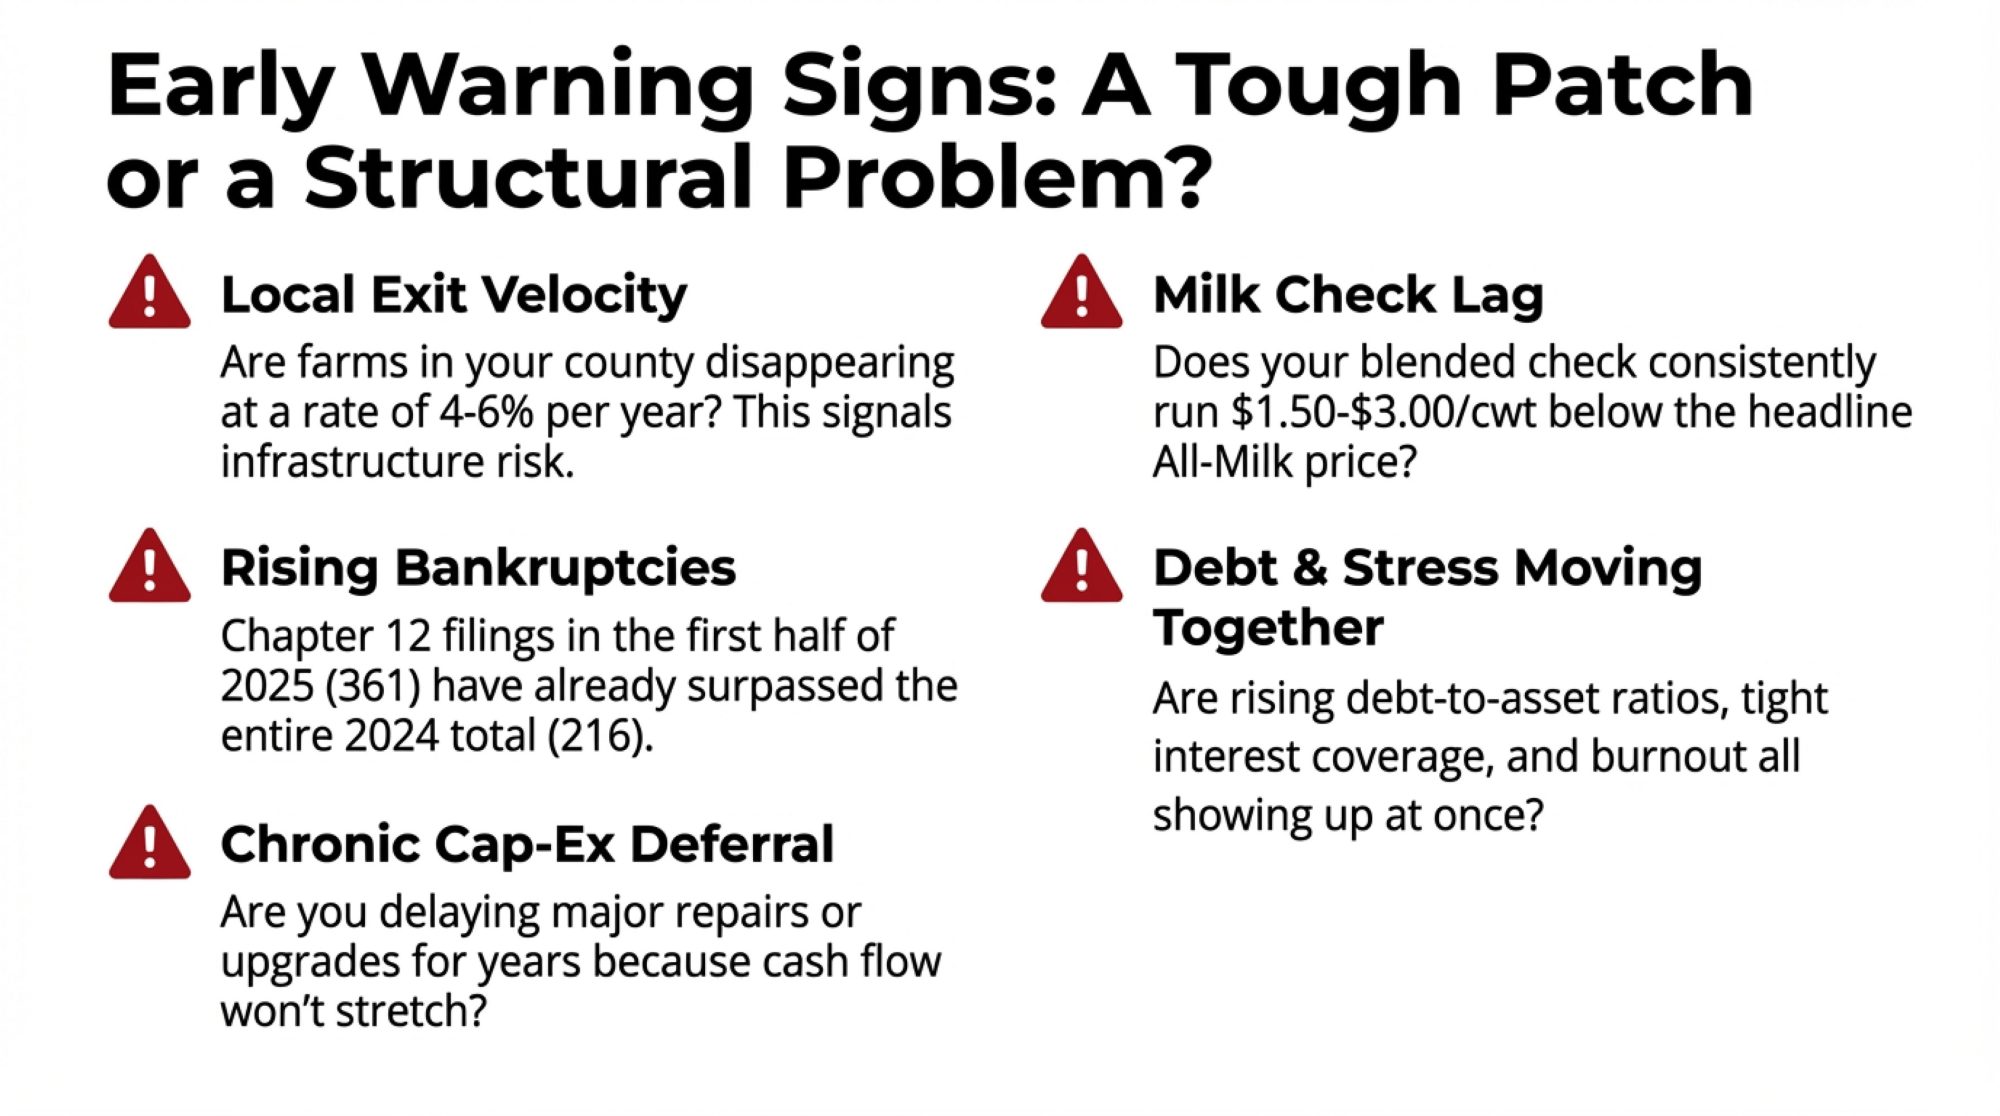
Early Warning Signs: Is This a Tough Patch or a Structural Problem?
This is one of the most important questions producers can ask themselves, and there’s no single metric that definitively answers it. But there are some early-warning signs worth watching—patterns that show up consistently in both the data and in conversations with lenders and advisers.
Local Exit Velocity
If your county or region is seeing dairy farm numbers fall 4 to 6 percent per year for several years running—similar to or worse than the national rate—that signals potential infrastructure risk. When too many mid-size herds disappear, processors may consolidate plants, haulers reduce routes, and local service providers struggle to justify coverage. That can increase costs and vulnerabilities for those who remain.
Bankruptcies Ticking Up Again
This one’s getting attention. According to American Farm Bureau Federation data, farm bankruptcies declined after 2019, and 2020—2023 was actually the lowest since 2008. But they’ve started climbing again. Nationwide, 216 farmsfiled Chapter 12 bankruptcy in 2024, up 55% from the previous year, according to industry coverage of the court data.
And here’s what’s concerning: the Farm Trader reported in July 2025 that 361 Chapter 12 cases were filed in just the first half of this year—already exceeding the entire 2024 total. When legal filings increase while analysts are talking about “decent” average margins, it often suggests that structural factors such as debt levels, interest costs, and local market concentration are pushing some operations into distress.
Chronic Cap-Ex Deferral
If you and neighboring farms have delayed major barn repairs, parlor upgrades, manure storage expansions, or equipment replacements for multiple years—not because the investments aren’t needed, but because cash flow simply won’t stretch—that’s a warning sign. Extension economists describe “feeding dead-weight debt” when working capital is used to service old loans rather than maintaining productive capacity. That pattern often precedes forced restructuring.
Milk Check Lagging the Headline Number
If the announced All-Milk price suggests healthy margins, but your blended check—after basis, hauling, quality adjustments, and pooling—runs consistently $1.50 to $3.00 per hundredweight lower, it’s worth asking why. Sometimes the answer involves legitimate differences in product mix or quality. Other times, it may reflect processing concentration, contract structures, or transportation arrangements worth revisiting through your co-op or buyer relationships.
Debt and Stress Moving Together
This one’s harder to quantify but may be the most important. Studies on rural mental health consistently link financial stress, high debt burdens, and a sense of powerlessness to increased depression and suicide risk among farmers. When rising debt-to-asset ratios, tight interest coverage, and burnout all show up simultaneously, that’s more than a rough patch. That’s usually when it pays to bring in a broader advisory team—lender, accountant, extension specialist, sometimes a counselor—to help clarify options.
Looking Over the Fence: What Other Systems Are Teaching Us
Producers often look north to Canada because it offers a fundamentally different model operating in real time.
Canada’s dairy sector operates under a supply-management system that combines production quotas with administered farm-gate prices based on cost-of-production formulas. The Canadian Dairy Commission regularly reviews cost data from representative farms—feed, labor, energy, capital—and recommends support prices implemented through provincial marketing boards.
According to Agriculture and Agri-Food Canada’s official dairy sector profile, there are about 9,256 dairy farms in Canada as of 2024. Dairy Farmers of Canada puts the average at roughly 105 milking cows per farm—considerably smaller than the U.S. average, but operating with much lower year-to-year price volatility at the farm level. The sector remains dominated by family operations with relatively stable debt levels and a higher rate of successful intergenerational transfers.
Canadian economists and policy analysts are also clear about the trade-offs. Consumers pay somewhat higher prices on certain products. Trade commitments constrain export opportunities. And significant capital is tied up in quotas, which new entrants must finance—creating barriers to entry that the U.S. system doesn’t.
In Europe, the 2014 to 2016 milk market crisis prompted the EU to deploy crisis reserve funds and voluntary supply-reduction schemes within the Common Agricultural Policy. Evaluations suggest these tools helped reduce some volatility but also highlighted challenges with targeting and timeliness.
None of these models can simply be transplanted into the U.S. context. But here’s what they do demonstrate: policy design—how prices are set, how supply is managed, how bargaining power is structured—has real impact on how risk and reward are shared across the chain.
That’s a useful lens to keep in mind whenever we hear that current outcomes are purely the inevitable result of “the market.”
There are signs of experimentation closer to home, too. Some U.S. cooperatives are pushing for more flexible, transparent federal milk pricing and stronger collective bargaining tools. Others are investing in value-added channels and direct-to-retail partnerships to capture a larger share of the consumer dollar for producers. Early days, but these efforts hint at ways the rules might evolve.
Succession, Identity, and the Hardest Questions on the Table
Behind all the economics and policy discussions are families deciding what comes next. This is where the numbers meet real life.
Surveys from Progressive Dairy and land-grant extension programs suggest that a majority of producers hope to pass their farms to the next generation. Yet only a minority have written, formal succession plans. Broader research on family enterprises finds that only about one in six survives as a healthy business into the third generation—and farms aren’t immune to that pattern.
The demographic data makes this more urgent. With 22% of dairy producers already 65 or older according to the 2022 Census, and with exits concentrated among operators without identified successors, the next decade will see a significant wave of transitions—planned or otherwise.
Meanwhile, cooperatives like Agri-Mark have felt compelled to include suicide hotline and counseling information on milk checks, responding to real mental-health concerns in their membership. Policy briefs and studies link financial strain, long working hours, and social isolation to elevated mental-health risks in agricultural communities.
Given that backdrop, some of the most constructive conversations families are having right now revolve around three questions:
If this operation were a startup your son or daughter was considering buying—same balance sheet, same cash flow—what would you tell them?
If you could exit or significantly scale down in the next 18 to 24 months and preserve substantially more equity than waiting until a lender forces the issue, would that change how you view your options?
What does “success” really mean for your family at this stage—owning a certain number of cows, maintaining a particular way of life, or building flexible wealth and health for the next generation?
For some families, the answers lead toward doubling down: investing in scale or specialization, engaging more actively in co-op governance and policy debates, positioning the dairy to compete under whatever rules emerge. For others, a strategic sale, a shift into specialized niches like on-farm processing or direct marketing, or even a full pivot out of milking may make more sense.
What’s encouraging is that more advisers, lenders, and producer groups are normalizing these discussions. They’re emphasizing that choosing a planned exit or transition can be a strategic business decision—not a personal failure. That shift in attitude makes it easier for families to talk openly about options before they’re forced into them.
Three Numbers to Review With Your Lender This Winter
As a practical takeaway, here are three metrics worth putting on paper before your next advisory meeting:
Debt-to-asset ratio: Where are you today, and how has that moved over the last five years? Many extension resources flag ratios above 60 percent as elevated risk territory for dairy operations.
Interest coverage: How many dollars of operating income are available to service each dollar of interest expense? Rising rates over the past couple of years have tightened this metric for many otherwise solid operations.
Cap-ex backlog: What major replacements or upgrades have you deferred—parlor, manure storage, feed center, housing—and what’s the realistic cost to bring those systems up to standard over the next five to ten years?
These numbers don’t decide your future. But they make it much easier to have honest, fact-based conversations about whether to expand, hold, restructure, or plan a managed exit.
The Bottom Line
Looking across all of this, a few grounded lessons stand out.
Dairy isn’t struggling because the biology stopped working. The cows, land, and genetics on many U.S. operations are performing at remarkably high levels. The strain comes from how pricing, policy, and bargaining power are configured around that biology.
Uptime and reliability are strategic concerns now, not just repair headaches. Tracking DEF-related and other critical downtime—including downstream effects on forage quality and fresh cow performance—gives you leverage in equipment decisions and conversations about policy reform.
Knowing your true cost of production is non-negotiable. Full-cost budgets that include family labor and realistic depreciation let you evaluate milk prices, insurance tools, and investment opportunities against your actual situation—not the “average.”
Early-warning signs are already visible in many regions. Rising bankruptcies, steady annual farm losses, chronic cap-ex deferral, and milk checks that lag headline prices all point toward structural pressure, not just bad luck.
Alternative policy designs show that different outcomes are possible. Canadian supply management, EU crisis tools, and emerging U.S. discussions around federal order reform and co-op bargaining all demonstrate that rules shape results.
And succession decisions are about people as much as they are about numbers. Honest conversations about equity, risk, mental health, and family goals matter just as much as any spreadsheet when deciding whether to grow, hold, or exit.
The goal here isn’t to say there’s one correct path for every dairy. It’s to put as much of the big picture on the table as possible—so that when you sit down with your family or your team, you’re making decisions with clear eyes and solid information.
The system around dairy will evolve. It always does. The more producers understand how it works today, the more influence they can have on what it becomes tomorrow.
For tools and resources mentioned in this article, check with your state’s land-grant university extension service. Wisconsin’s Center for Dairy Profitability offers FINPACK-based financial analysis, Penn State Extension provides dairy cost-of-production worksheets, and Cornell’s PRO-DAIRY program has succession planning guides—all available at low or no cost and adaptable to your specific operation.
KEY TAKEAWAYS
- Exits are accelerating despite “better” margins. One thousand four hundred thirty-four dairies closed in 2024—a 5% drop—while analysts talked of improvement. That’s not a bad year; it’s structural pressure.
- Dairy’s middle class is vanishing fastest. Operations running 200-1,500 cows are caught in the squeeze—too large for niche flexibility, too small for volume leverage.
- You’re keeping less than you think. Farmers capture just 25 cents of every retail dairy dollar on average, yet absorb rising costs that never reach the milk price formula.
- A demographic cliff is coming. 22% of producers are 65+, few have written succession plans, and more than half of daily labor now comes from immigrant workers, reshaping what “family farm” means.
- The warning signs are flashing now. Chapter 12 bankruptcies in 2025 have already exceeded last year’s total. Three numbers to review with your lender: debt-to-asset ratio, interest coverage, and deferred cap-ex.
Complete references and supporting documentation are available upon request by contacting the editorial team at editor@thebullvine.com.
Learn More:
- Your 2025 Dairy Gameplan: Three Critical Areas Separating Profit from Loss – Provides immediate tactical adjustments for forage density, transition cow spacing, and amino acid use. This guide offers actionable benchmarks to protect margins on the production floor while broader structural issues play out.
- 2800 Dairy Farms Will Close This Year—Here’s the 3-Path Survival Guide for the Rest – Moves beyond the problem to the solution, outlining the three viable business models left for mid-size producers: scaling for efficiency, pivoting to premium differentiation, or executing a strategic exit before equity erodes.
- The Tech Reality Check: Why Smart Dairy Operations Are Winning While Others Struggle – Delivers a hard look at the ROI of automation and the cybersecurity risks facing modern dairies. This article demonstrates how to evaluate technology investments based on labor savings and operational resilience rather than hype.
 The Sunday Read Dairy Professionals Don’t Skip.
 The Sunday Read Dairy Professionals Don’t Skip.
Every week, thousands of producers, breeders, and industry insiders open Bullvine Weekly for genetics insights, market shifts, and profit strategies they won’t find anywhere else. One email. Five minutes. Smarter decisions all week.