Butter inventories: lowest since 2016. Butter prices: falling fast. Your milk check: shrinking. We connect the dots.
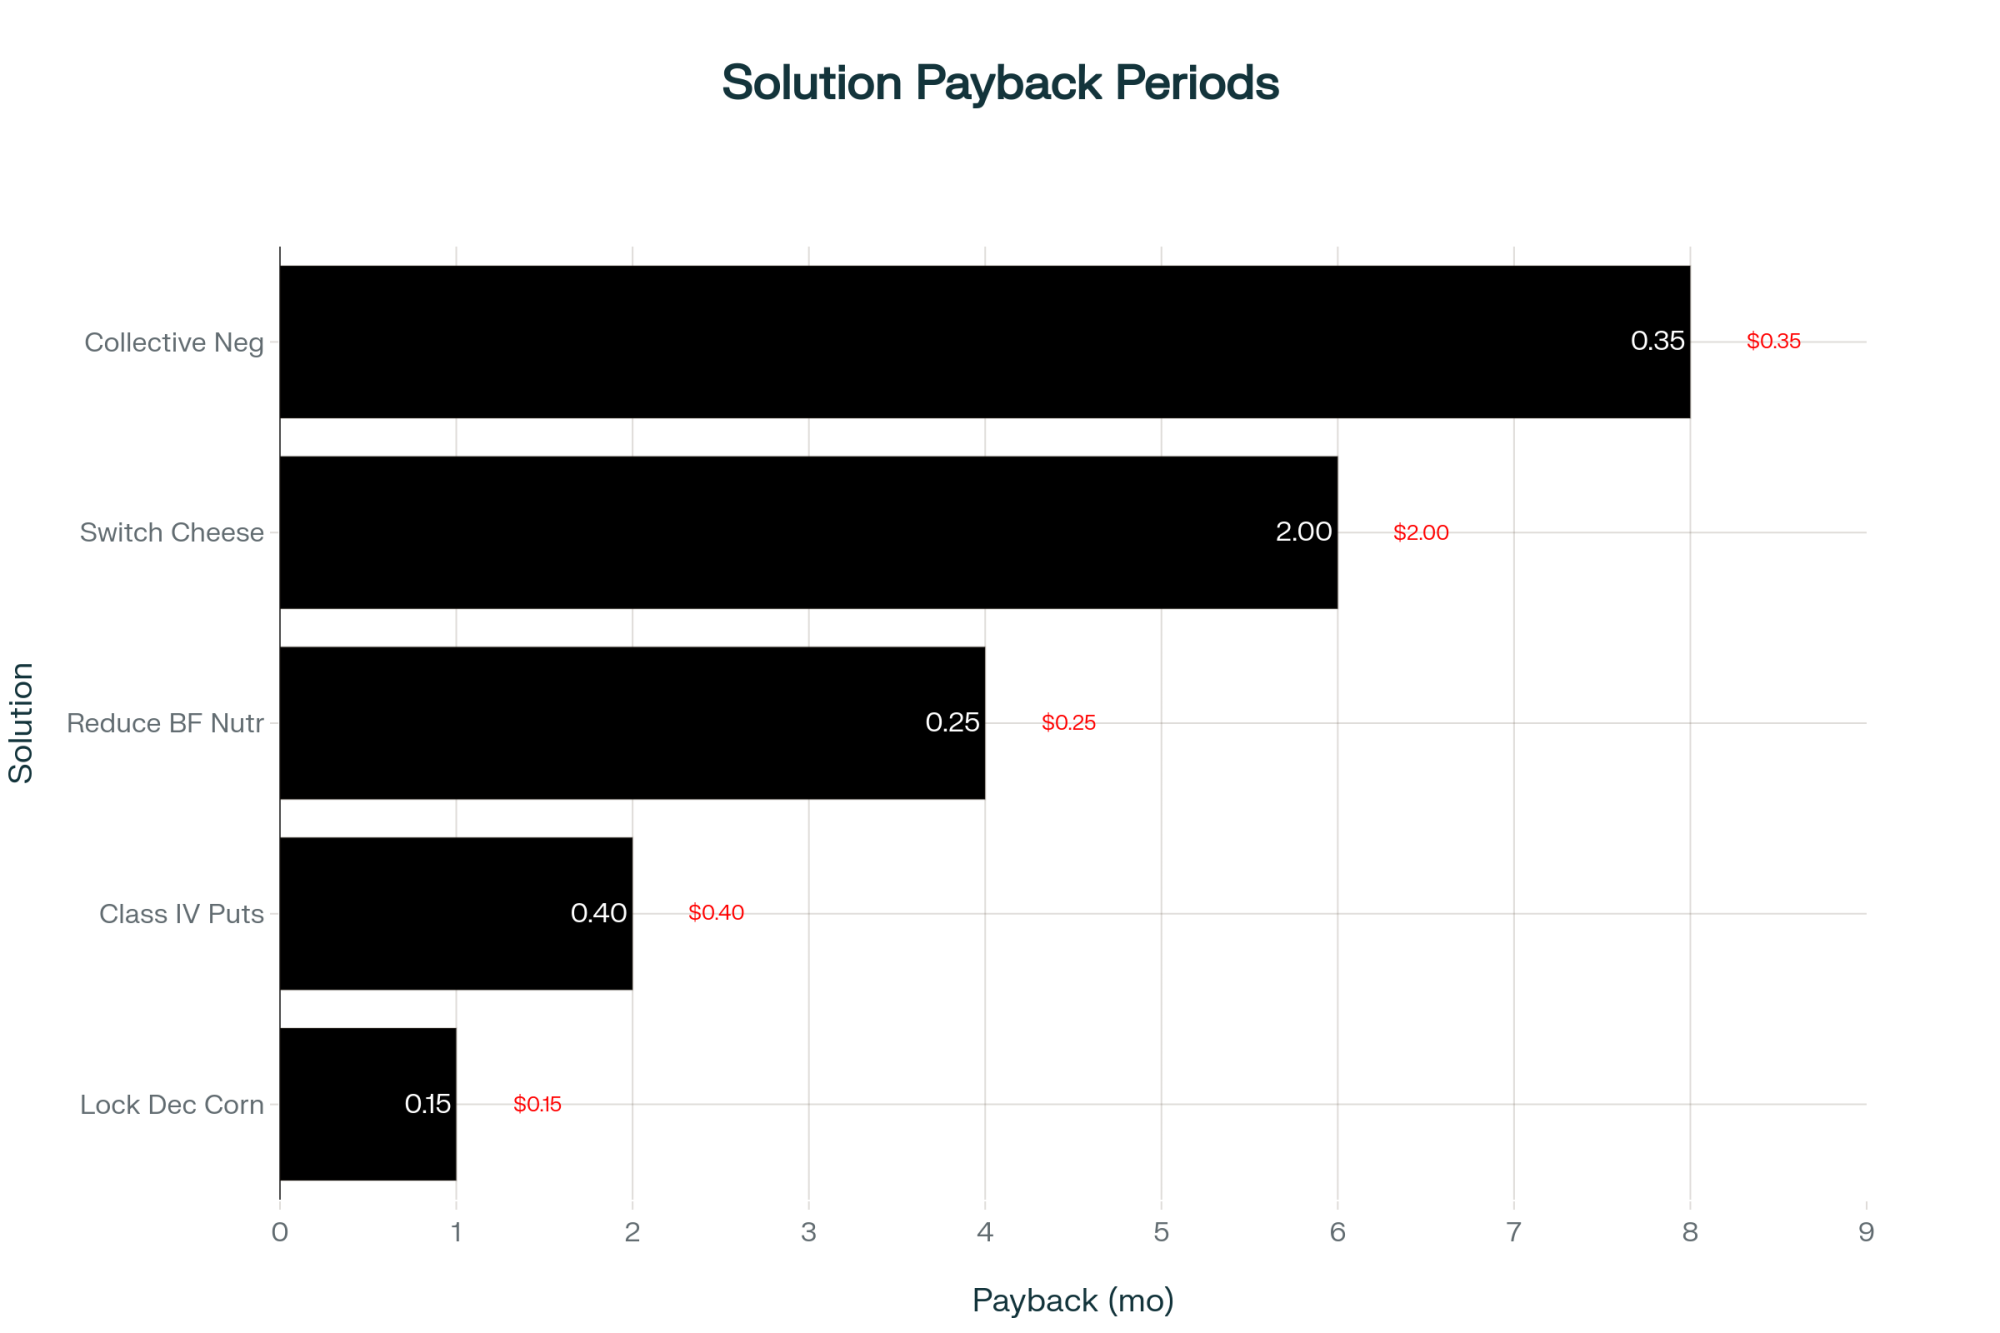
Executive Summary: Something broke in dairy markets this October: butter crashed to $1.60 despite the tightest inventories since 2016. Just 15 CME trades triggered the drop, opening a massive $2.47 gap between Class III and Class IV milk prices—the widest since 2011. Jersey farms shipping to butter plants now lose up to $500,000 annually, while Holstein neighbors shipping to cheese plants gain from the exact same market. Why? Algorithmic trading dominates these thin markets, punishing the high butterfat we spent decades breeding for. Smart farms are adapting fast: switching processors (6-month payback), negotiating collectively ($0.35/cwt gains), and even reducing butterfat through nutrition. The message is clear—understand these new market dynamics or get left behind.

I was chatting with a Jersey producer near Mondovi, Wisconsin—been in the business 28 years—and he told me something that’s really stuck with me. “For the first time,” he said, “I genuinely don’t understand what’s driving my milk check.”
That’s a powerful statement coming from someone who’s weathered every market cycle since the mid-90s. And he’s not alone. I’ve been hearing similar frustrations from producers all across the dairy belt lately, from the Great Lakes down through Texas.

Why Are Butter Prices Falling When Inventories Are Tight?
So here’s what happened this October that’s got everyone talking. According to CME Group’s daily reports, spot butter prices fell from $1.6950 in mid-September to $1.6025 on October 9th. Pretty significant drop.
But what makes this genuinely puzzling is what else was happening. USDA’s Cold Storage report, released September 24th, showed butter inventories at 305.858 million pounds for August. That’s the tightest August inventory we’ve seen since 2016.
Tight inventories should support prices, shouldn’t they? That’s how it’s always worked. But not this time.

And the timing… October is traditionally when we see butter prices strengthen. Retailers start building holiday inventory, and demand picks up through Thanksgiving. We’ve all seen that pattern. This October? Complete opposite.
What’s particularly interesting is the global picture. While our butter was trading around $1.60 in early October, industry reports suggest European prices were holding near $2.60 per pound. New Zealand’s Global Dairy Trade auction from October 1st showed butter equivalent prices in the $3.40 to $3.50 range after conversion.
That’s a massive disconnect. And according to USDA Foreign Agricultural Service data through August, it’s been driving butterfat exports way above last year’s levels—increases of over 200% in some months. You’d think that kind of export demand would support domestic prices, but apparently not in this market.
The recent trade agreements, particularly USMCA provisions, have actually made cross-border dairy movement easier, which you’d expect would help price discovery. But even with those improvements, we’re seeing these wild disconnects.
How Can 15 Trades Set Prices for an Entire Industry?
At a recent University of Wisconsin Extension meeting, several producers raised good questions about how these price movements could occur with such thin trading volume. Let me walk you through what I’ve been observing.
On October 9th, CME’s daily report showed selling pressure that drove prices down 4.75 cents in just one session. We’re talking about spot loads of 40,000 pounds each, and on a busy day, maybe 15 loads change hands. That’s 600,000 pounds of butter, setting the tone for an industry producing 1.8 billion pounds of milk daily, according to USDA production statistics.
Academic research increasingly suggests electronic trading has fundamentally changed these markets. A good chunk of trading volume in futures markets now comes from algorithmic systems rather than traditional commercial hedging. It’s not farmers hedging production or cheese plants covering forward needs anymore—it’s computers trading momentum patterns.
You can actually see it in the data. Days when butter prices drop sharply often show heavier volume—maybe 12 to 15 loads trading. But when prices try to recover? Volume frequently drops to just 5 or 6 loads. That’s not normal commercial hedging, where you’d expect consistent volume regardless of price direction.
The Class III/IV spread really tells the story. USDA’s Agricultural Marketing Service data showed that spread widening to $2.47 per hundredweight on October 9th—the largest gap since 2011. Class III milk for cheese was $17.01, while Class IV milk for butter-powder was $14.54.
In a market where butter supplies are supposedly tight, that kind of spread doesn’t make fundamental sense. I’ve been in this industry long enough to remember when a 50-cent spread was considered wide. Now we’re looking at nearly $2.50.
Who’s Getting Hit Hardest—And Who’s Finding Solutions?
What I’ve found eye-opening is how differently this affects farms depending on location and milk destination.
There’s a Wisconsin Jersey producer I work with—let’s call him Tom—who runs about 480 cows, averaging 4.8% butterfat. Beautiful production numbers. Based on Federal Order 30 component pricing, his milk should be worth significantly more than the Holstein operation down the road, which is testing at 3.8% fat.

But when he’s shipping to a butter-powder plant and that Class III/IV spread hits $2.47 per hundredweight, that advantage completely reverses.
Using calculation tools from UW-Madison’s Center for Dairy Profitability (excellent resources at cdp.wisc.edu), we can quantify this. A 100-cow Jersey operation faces nearly $60,000 less income annually under these conditions. Mid-size farms with 300 cows could be down about $175,000. That 500-cow operation? Close to $300,000 annually. And if you’re running 1,000 head? Over half a million dollars in lost revenue.
These are real losses affecting real families. We’re not talking about missed opportunities here—we’re talking about actual cash flow gaps that affect everything from feed purchases to equipment payments.
But here’s what’s encouraging—creative solutions are emerging all over. A producer group in Pennsylvania negotiated a shift from shipping to a butter-powder plant to accessing a cheese cooperative. They invested in equipment upgrades to meet new specs, but told me the investment paid for itself within six months once they escaped that Class IV pricing penalty.
In California, more operations are exploring value-added opportunities. Farmstead cheese, on-farm processing, direct sales. It requires significant capital and a different business model, but those making it work see premiums of $3 to $5 more per hundredweight over commodity pricing.
And in the upper Midwest, I recently visited a 650-cow operation near La Crosse that’s taking a different approach. They’ve partnered with two neighboring farms to collectively negotiate milk marketing, giving them leverage they wouldn’t have individually. “We’re still shipping Class IV,” the owner told me, “but we negotiated quality premiums that offset about 40% of the spread disadvantage.”
Down in Texas, where I was last month, producers face different challenges. The heat stress on butterfat production actually works in their favor when these spreads widen—their naturally lower butterfat levels mean less exposure to the Class IV penalty. One producer near Stephenville told me, “We used to curse our 3.5% fat tests in summer. Now it’s actually protecting us from worse losses.”
I’ve also been talking with Holstein producers who are navigating this differently. A 1,200-cow operation in Michigan shared its strategy—they’ve actually benefited from maintaining moderate butterfat levels around 3.7% while focusing on volume. “Everyone was chasing components,” the owner explained, “but we stuck with balanced production. Now that’s paying off.”
And it’s not just Jerseys and Holsteins feeling this. A Brown Swiss producer in Vermont mentioned their breed’s protein-to-fat ratio has actually become an advantage in this market. “We naturally produce closer to what processors want,” she said. Even some Guernsey operations with their golden milk are finding niche markets that value their unique component profile beyond commodity pricing.
Why Did Everyone Breed for Butterfat If This Was Coming?
Looking at USDA National Agricultural Statistics Service data from 2014 forward, butterfat prices beat protein prices in eight of ten years through 2024. The whole industry was singing the same tune—breed for components, maximize butterfat.
I remember reading CoBank’s November 2023 report titled “The Butterfat Boom Has Just Begun.” They documented that butter consumption grew 43% over 25 years, and that cheese was up 46%; according to USDA Economic Research Service data, Americans now eat about 42 pounds of cheese per person annually. Double what we ate in 1975.
But by September 2024, CoBank published a follow-up with a different tone, warning that butterfat production might be growing too fast. According to analysis from CoBank and other industry sources, the protein-to-fat ratio in U.S. milk has shifted. It held steady around 0.82-0.84 for nearly two decades, but recent data suggests we’re now closer to 0.77.
Metric | Jersey | Holstein |
|---|---|---|
| Milk Production | 18,000 lbs/yr | 25,000 lbs/yr |
| Butterfat | 4.8% | 3.8% |
| Feed Efficiency | 1.75 ECM/lb | 1.67 ECM/lb |
| Feed Cost per lb Fat | $1.82 | $1.97 |
| Normal Market | -$456/yr | $0 |
| At $2.47 Spread | -$956/yr | $0 |
I recently spoke with a cheese plant manager in Central Wisconsin who explained their perspective. “We’re not trying to penalize high-butterfat milk,” he said, “but our process is optimized for certain ratios. When milk comes in with too much fat relative to protein, we’ve either got to add milk protein concentrate—which isn’t cheap—or skim off cream. Either way, it’s an added cost.”
This seasonal component shift matters too. Spring flush typically brings lower components as cows transition to pasture—you know how it goes, that first lush grass drops butterfat like a rock. We’d normally see fat tests drop from 4.0% to 3.6% or lower in grazing herds. Then, fall milk traditionally shows higher butterfat as cows return to TMR and corn silage.
But with year-round confinement becoming standard in larger operations, these seasonal patterns are flattening. A nutritionist I work with in Idaho told me that their 5,000-cow clients now maintain 3.8% butterfat year-round, plus or minus 0.1%. That consistency sounds good, but processors built their systems around predictable seasonal variation. Now they’re scrambling to adjust.
What Can You Actually Do About This Right Now?
Risk management has become essential. Looking at CME quotes in late October, Class IV put options at the $14.00 strike were trading around $0.15 per hundredweight. That’s affordable insurance—maybe 6% of what you’d lose if prices really tank. Worth discussing with your milk marketing cooperative.
On the feed side, December corn futures were trading near $4.19 per bushel in early November. Given where feed markets have been, locking in at least some costs makes sense. When milk pricing is this volatile, having one side of your margin equation fixed helps you sleep at night.
Marketing flexibility is crucial, though limited for many. But it’s worth exploring whether you could shift even a portion of milk to different processors. Some regions have more options than folks realize—cooperatives and plants not considered because they’ve been shipping to the same place for decades.
A Northeast producer recently shared something interesting—they partnered with neighboring farms to collectively negotiate better terms with processors. Not feasible everywhere, but where geographic concentration allows, collaborative approaches deserve consideration. They told me payback on legal and consulting fees took eight months, but they’re now seeing $0.35 more per hundredweight.
I’ve also been seeing increased interest in adjusting components through nutrition. A farm in Ohio began working with its nutritionist to moderate butterfat production, reducing it from 4.1% to 3.85% through ration adjustments. Sounds counterintuitive after years of pushing components higher, but when that Class IV spread is wide, it can actually improve their milk check.
For those with Dairy Margin Coverage through FSA, it’s worth revisiting your coverage levels. The program calculations don’t fully capture these Class III/IV spread impacts, but higher coverage levels might provide some cushion when markets get this disconnected. With crop insurance interactions, some producers are finding ways to layer their risk protection more effectively.
Is This How Dairy Pricing Works Now?
October’s butter price action reveals fundamental questions about how dairy prices get discovered in modern markets.
When CME spot markets with thin daily volume—sometimes just a dozen trades—determine pricing for over 90% of U.S. milk production, the traditional relationship between supply and demand can become distorted.
Other commodities have addressed similar issues. The beef and pork industries implemented mandatory price reporting years ago, where packers report transactions to the USDA, creating broader datasets for price discovery. Some in dairy are asking whether we need something similar. Organizations like the National Milk Producers Federation have begun discussing potential reforms, and there’s growing support from state organizations as well.
The Canadian system offers an interesting contrast. They operate under supply management with administered pricing through the Canadian Dairy Commission. Their system has its own challenges—less export opportunity, higher consumer prices—but price volatility isn’t one of them. Canadian producers maintained stable component premiums throughout October while we dealt with wild swings.
Where Do We Go from Here?
Based on everything I’m seeing and hearing across the industry, here’s what we need to keep in mind:
Traditional price signals might not mean what they used to. When butter prices fall despite the USDA showing the tightest inventories in years, market structure issues go beyond normal supply and demand.
Component strategies need evolution. The protein-to-fat ratio processors want has shifted, and breeding programs might need adjustment. That feels like abandoning years of genetic progress, but markets change. The Jersey breeders I know are already talking about selecting for more moderate butterfat—targeting 4.5% instead of pushing toward 5%. Holstein operations that maintained balanced components are suddenly looking smart. Brown Swiss and Guernsey breeders are reassessing their component targets in response to processor feedback.
Risk management isn’t optional anymore. Even basic strategies like put options provide crucial downside protection. If you’re not working with someone on this, it’s time to start.
Mid-size commodity operations face the most pressure. You need either scale advantages of large operations or premium markets that reward quality differently than commodity channels.
I know this is challenging to process. Many built operations based on signals the market sent for over a decade—maximize components, breed for butterfat, invest in genetics. Now the market’s sending different signals, and adapting isn’t easy.
But dairy farmers are incredibly resilient. We’ve weathered droughts, surpluses, price crashes, and policy changes. This market structure challenge? It’s serious, but not insurmountable.
What encourages me is the innovative responses nationwide. Producers exploring new marketing arrangements, investigating value-added opportunities, and approaching risk management with fresh perspectives. A young producer in Minnesota recently told me, “My grandfather adapted when bulk tanks replaced milk cans. My father adapted when computers changed breeding programs. Now it’s my turn to figure out these new market dynamics.”
That perspective—acknowledging change while maintaining confidence—that’s exactly right.
October’s butter price action, with spot prices at $1.60 while inventories sit at six-year lows according to USDA data, shows the old rules might not apply. Understanding these new dynamics—electronic trading’s role, thin-market impacts, and the importance of component ratios—that’s crucial for smart decisions going forward.
The question isn’t whether markets return to the old ways. They probably won’t. It’s how quickly we adapt strategies to thrive where market structure matters as much as production efficiency.
We’ll figure it out. We always do. That’s what dairy farmers do—adapt, persevere, find a way forward. This time won’t be different.
For those interested in risk management tools, reach out to your cooperative or check CME Group’s educational resources. The University of Wisconsin’s Center for Dairy Profitability has excellent free tools for analyzing component pricing impacts at cdp.wisc.edu. Regional extension services provide valuable market analysis and decision-support resources tailored to local conditions. Organizations like the National Milk Producers Federation (nmpf.org) and your state dairy associations are actively working on market reform proposals worth following.
KEY TAKEAWAYS
- Your milk check isn’t broken—the market is: 15 CME trades (600,000 lbs) now set prices for 1.8 billion lbs daily production
- High butterfat became a liability overnight: Jersey farms lose $500K/year at current Class III/IV spreads ($2.47/cwt) while moderate-component Holsteins gain
- Three farms found solutions that work: Pennsylvania group switched processors (6-month payback), Wisconsin neighbors negotiated together (+$0.35/cwt), Ohio farm reduced fat through nutrition (4.1% to 3.85%)
- Risk protection costs less than you think: Class IV puts at $14 strike cost $0.15/cwt—that’s $450/month for a 500-cow dairy
- This isn’t temporary: Algorithmic trading owns these markets now—farms still breeding for maximum butterfat are planning for yesterday’s market
Complete references and supporting documentation are available upon request by contacting the editorial team at editor@thebullvine.com.
Learn More:
- Beef-on-Dairy Lost $196,000 Per Farm in October- Here’s How to Protect Your 2026 Revenue – This article provides a tactical playbook for managing the financial risks of diversification. It demonstrates how to use risk management tools and adjust breeding strategies to protect your operation when sudden market shocks devalue crossbred calf prices.
- Global Dairy Market Dynamics: Navigating Volatility and Strategic Opportunities in 2025 – For a strategic perspective, this piece reveals the global forces—from EU export pressures to Asian demand shifts—that influence domestic prices. It provides the crucial context for understanding why U.S. market signals are becoming disconnected from international trends.
- From Milk Machines to Component Champions: How Genomics and Sexed Semen Are Remaking the Dairy Cow – This innovation-focused article details the solution to the breeding challenge highlighted in the main piece. It explains how to leverage modern genomics and sexed semen to precisely target the specific component ratios that processors now reward, moving beyond outdated volume-based models.
 Join the Revolution!
 Join the Revolution!
Join over 30,000 successful dairy professionals who rely on Bullvine Weekly for their competitive edge. Delivered directly to your inbox each week, our exclusive industry insights help you make smarter decisions while saving precious hours every week. Never miss critical updates on milk production trends, breakthrough technologies, and profit-boosting strategies that top producers are already implementing. Subscribe now to transform your dairy operation’s efficiency and profitability—your future success is just one click away.