As 8,000-12,000 mid-sized operations prepare to exit by 2030, successful farmers are discovering that traditional optimization strategies no longer work—and the real winners are those managing total margins, not just feed costs
EXECUTIVE SUMMARY: Wisconsin dairy farmer Dave Miller’s $180,000 investment in automation for just 1,100 cows seemed irrational—until it increased his net income by $165,000 annually and revealed why 12,000 farms face exit by 2030. The new reality: traditional feed cost optimization is obsolete, as successful producers focus on total margins, where labor exceeds $20/hour, hauling costs have doubled, and feed accounts for only 35-40% of true costs. Three models will dominate 2030: mega-operations (3,500+ cows) achieving $14.20/cwt costs through scale, niche producers capturing $35-50/cwt premiums through direct marketing, and multi-family partnerships sharing resources and risk. Mid-size single-family farms (500-700 cows) face a crushing $250,000-375,000 annual profit gap and must choose among five strategic paths immediately. As California loses 350,000 cows to water restrictions while Wisconsin gains 180,000, the geographic and economic landscape is transforming rapidly—and every year producers delay strategic decisions, they cost them $200,000-300,000 in equity.

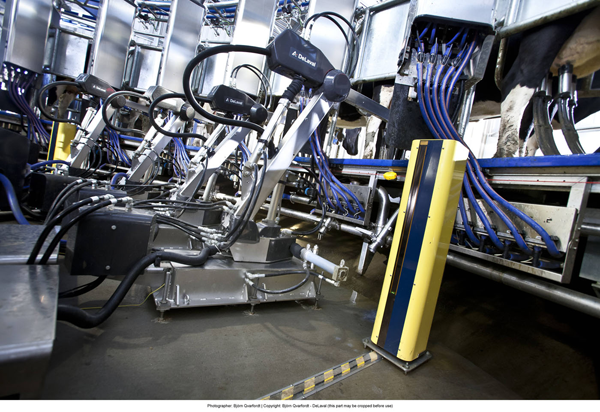
I recently spoke with a Wisconsin dairy producer who invested $180,000 in automation technology while running only 1,100 cows in a barn designed for 1,500. His neighbors initially questioned the decision.
Three years later, he’s maintaining profitability with manageable 65-hour work weeks while operations twice his size are experiencing burnout or considering exits.
Dave’s approach reflects a broader pattern I’ve been observing across the industry. The optimization strategies we’ve relied on for decades are evolving.
And producers adapting to these new economic realities are finding sustainable paths forward.
What’s particularly noteworthy is the convergence of data we’re seeing. The USDA National Agricultural Statistics Service reports dairy cow numbers at 9.36 million head as of December 2024. University of Wisconsin dairy economic studies and Cornell’s Dairy Farm Business Summary all point to significant structural changes.
Statistics show the annual average number of commercially licensed dairy farms fell to 24,811—part of a consolidation trend that deserves careful attention.
This transformation raises important questions about operational strategies, regional dynamics, and what success looks like moving forward. The data tells a compelling story about who’s thriving, who’s struggling, and perhaps most importantly, which assumptions may need updating.
The Feed Cost Discussion: Examining Traditional Metrics

For generations, we’ve focused intently on feed cost per hundredweight as a primary performance metric. The benchmarks are well-established—Cornell and Wisconsin extension programs suggest feed should account for 45-55% of total costs, and efficient operations can achieve $6.50-7.00/cwt, according to recent enterprise analyses.
This approach has served the industry well. Yet conversations with producers and emerging data suggest we might benefit from a broader perspective.
Consider the economics facing a typical 500-cow operation. They might spend $7.20/cwt on feed and achieve $0.40 savings through optimization—roughly $25,000 annually on 12.5 million pounds of production.
Meanwhile, USDA Economic Research Service data shows agricultural labor costs exceeded $53 billion in 2025, with dairy-specific wages averaging $17.55/hour—representing a 30% increase since 2021.
Transportation costs present another consideration. Producers across multiple regions report that hauling fees have increased from $0.35 to $0.65/cwt as processing plants consolidate.
Processing premiums have shifted as well, with many areas seeing reductions from $0.45 to around $0.20/cwt as competition for plant capacity evolves.
“We’re observing producers who optimize feed costs effectively but encounter challenges in overall profitability. Operations might save $0.30/cwt on rations, yet experience breeding rate declines of 3% or cull rate increases of 5%, resulting in larger losses in areas they’re monitoring less closely.”
— Dr. Mark Stephenson, University of Wisconsin’s Center for Dairy Profitability
Wisconsin’s June 2025 dairy sector assessment provides additional context: feed accounts for approximately 35-40% of total costs when debt service, family living expenses, and working capital needs are included.
These comprehensive costs often determine long-term viability. They suggest the value of holistic margin management.
Individual Cow Economics: A Developing Approach
An interesting development among progressive producers involves shifting from herd averages to individual cow economics. This approach, enabled by recently more accessible monitoring technology, reveals nuanced profitability patterns.
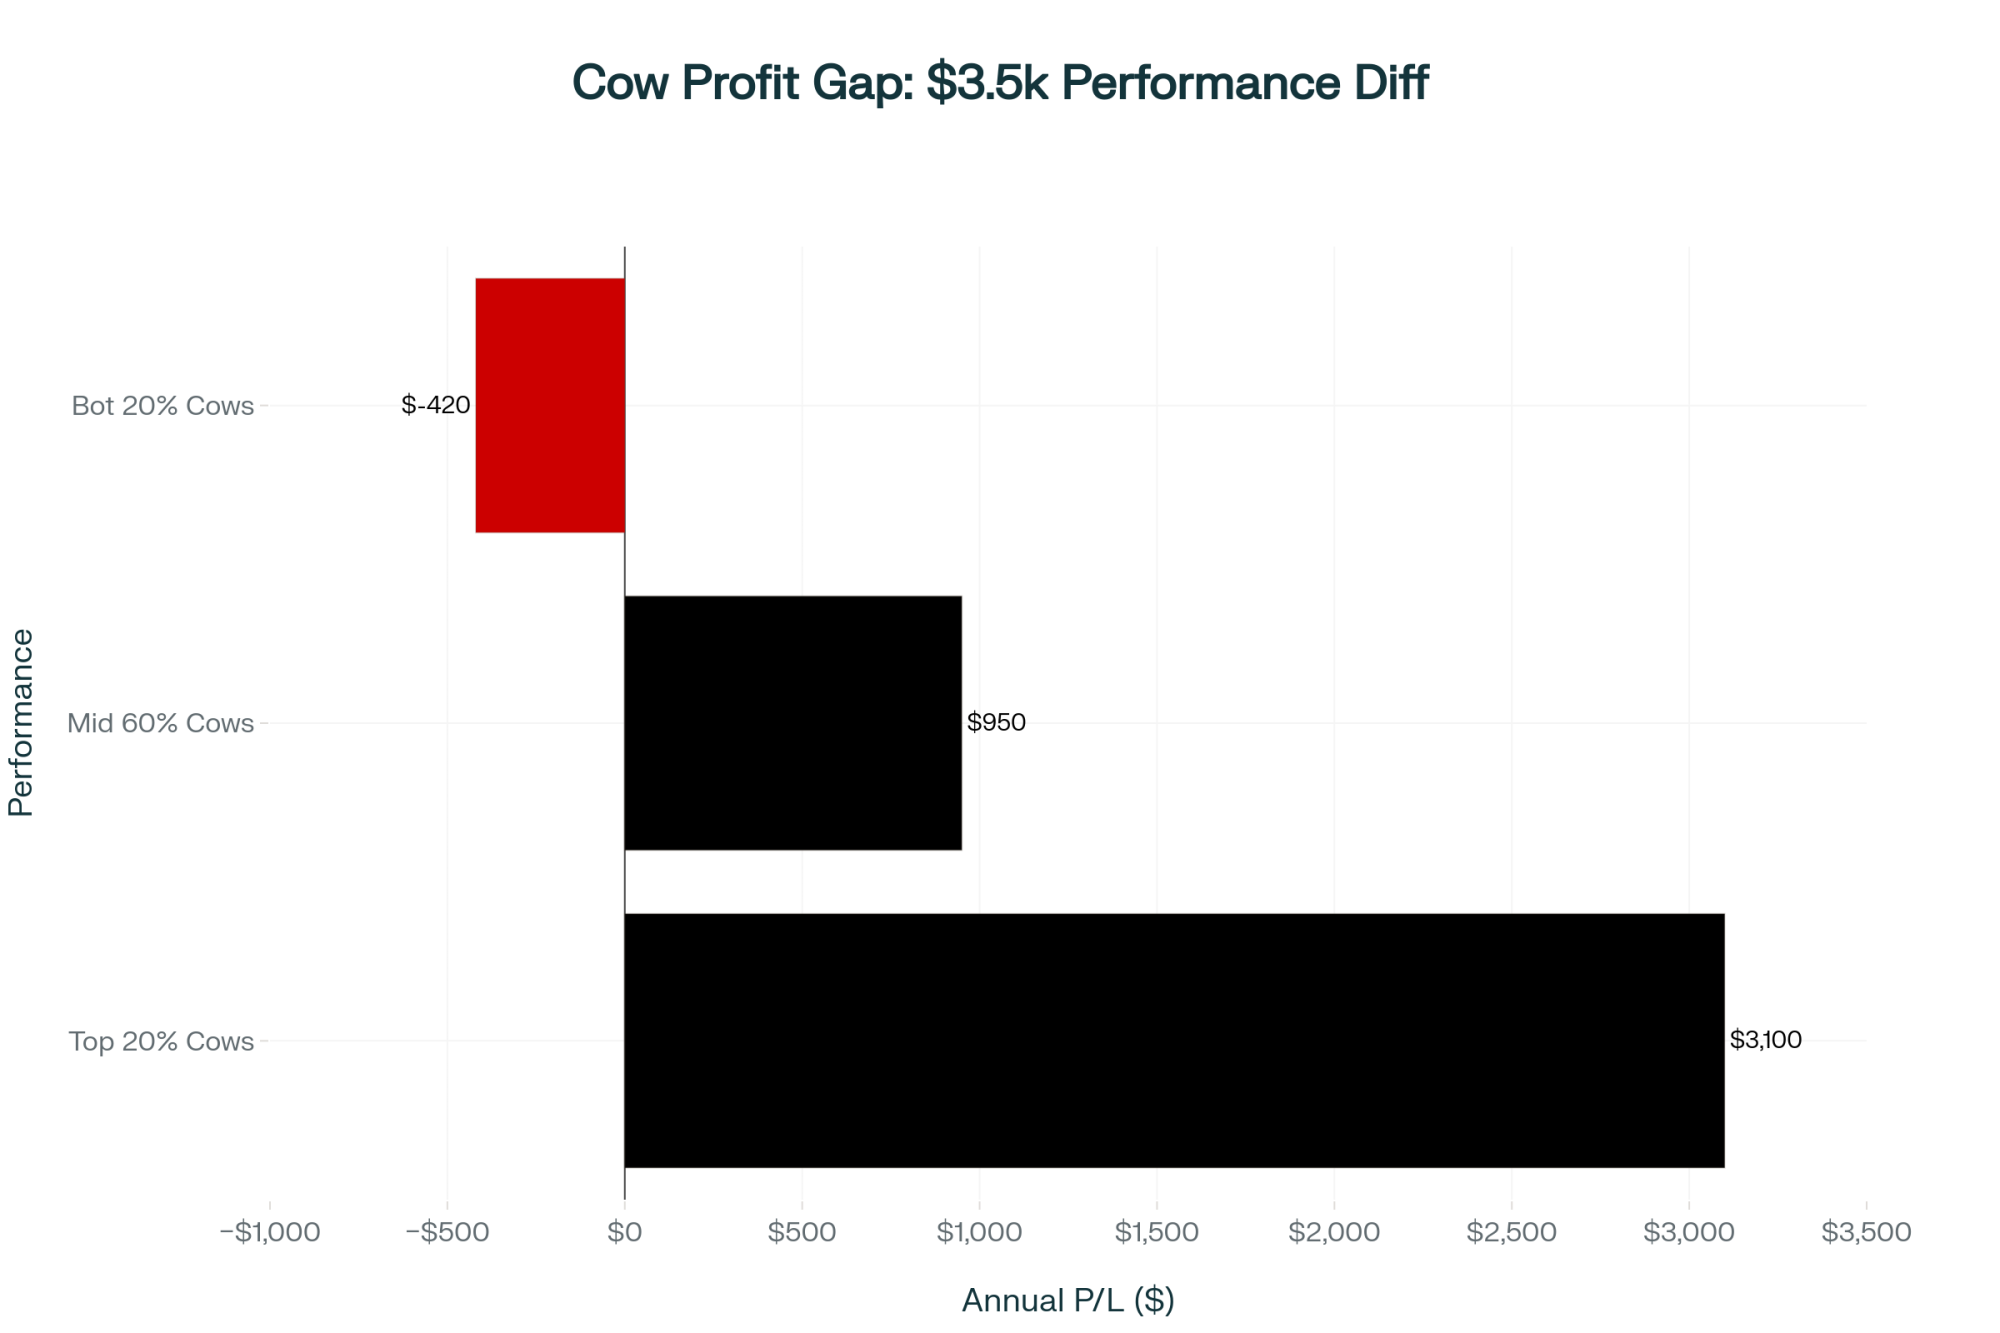
I visited a 1,200-cow Michigan operation using individual cow monitoring systems—technology similar to that documented by the Journal of Dairy Science in smart dairy farm analyses. Their data revealed striking variations:
- Top 20% of cows generated $3,100 annual profit each
- Middle 60% generated $950 profit
- Bottom 20% showed losses of $420 per head annually
The producer—let’s call him Steve to respect his privacy—took an innovative approach based on this data.
“We reduced our herd from 1,200 to 1,050 cows by identifying chronic underperformers,” he explained during my visit. “Total milk production decreased 8%, but net income increased $165,000 because we eliminated negative-margin animals that were affecting overall profitability.”
This individual-animal strategy extends beyond culling decisions. Progressive operations now adjust feeding programs, breeding protocols, and housing assignments based on profitability projections.
High-performing cows receive premium nutrition and genetic improvements. Marginal performers might receive commodity feed and beef semen—a practice that’s created its own market dynamics, with National Milk Producers Federation data showing beef-on-dairy calves commanding $1,400 premiums.
Technology Adoption: Finding Practical Solutions
While industry publications often feature multi-million-dollar robotic installations, the reality for most producers is more modest investments. NASS data indicate that approximately 70% of U.S. dairy farms operate with fewer than 200 cows and an annual capital budget of under $50,000.
Through farm visits this year, I’ve identified what many call a “minimum viable technology stack” that delivers measurable returns for mid-sized operations:
Practical Investments ($30,000-60,000 total):
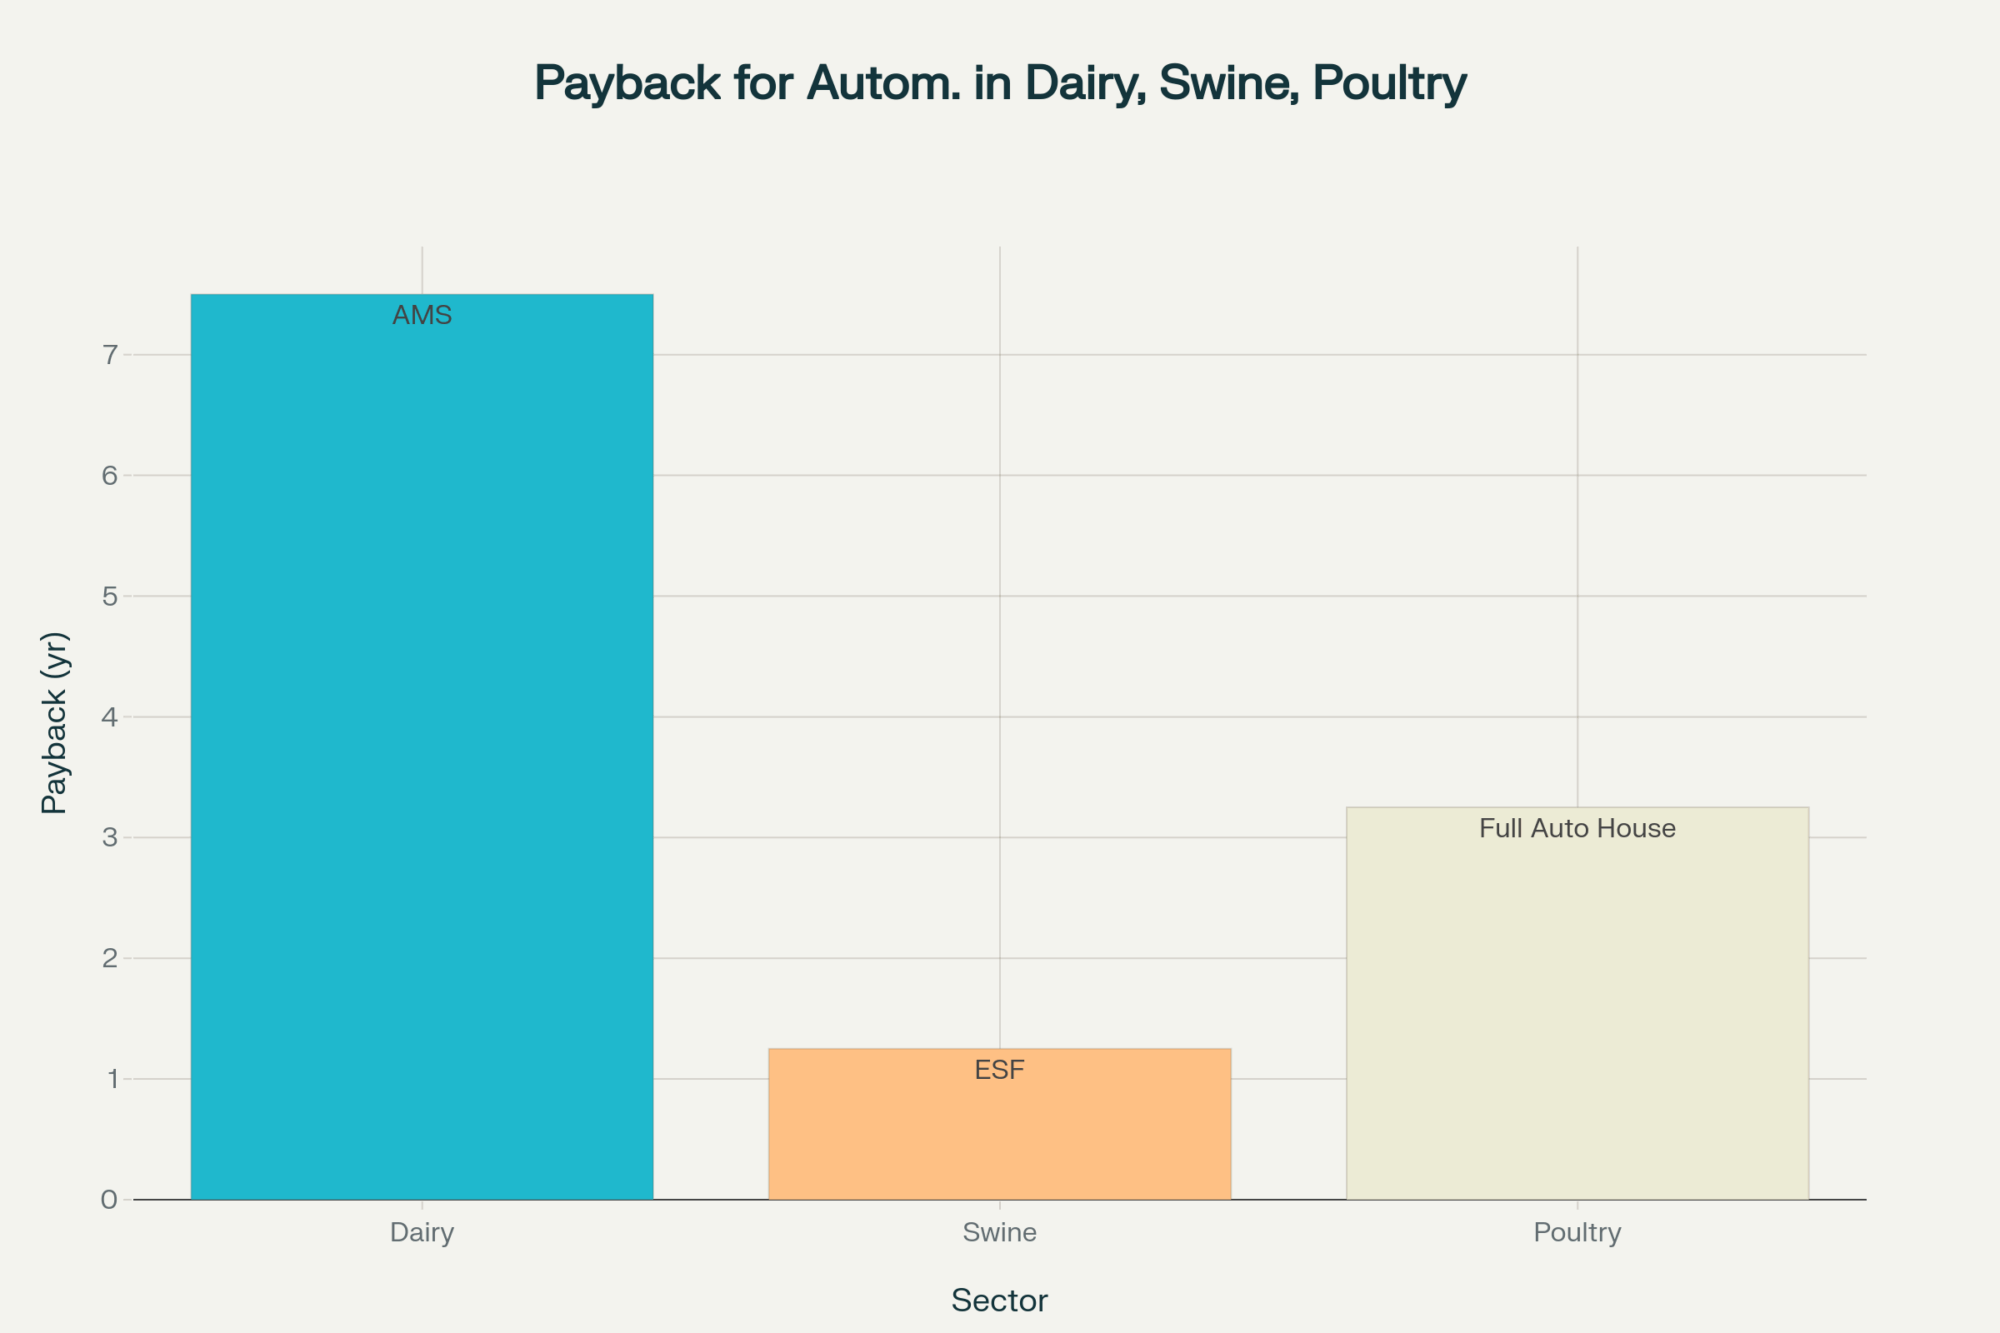
- Basic activity monitors for breeding detection: $8,000-12,000 (typical payback within 14 months through improved conception rates)
- Used plate cooler and variable speed milk pump: $15,000-25,000 (energy cost reductions of 20-30% commonly reported)
- Automated feed pusher: $12,000-18,000 (saves approximately 2 hours of daily labor)
- Margin tracking systems: $0-500 (spreadsheet templates providing valuable decision support)
A 400-cow Wisconsin operation shared their experience: $45,000 in basic automation reduced labor requirements by 20 hours weekly—valued at $31,200 annually at current wages—while improving breeding rates by 15% and reducing feed waste by 8%.
“Everyone discusses robots and advanced genetics, but my most valuable investment was a $3,000 used generator for power outage protection. It’s prevented milk dumping three times this year—preserving about $40,000 in revenue. Sometimes, straightforward solutions address real challenges effectively.”
— Tom Peterson, Pennsylvania dairyman managing 380 cows
Regional Dynamics: Understanding Geographic Shifts
The geographic distribution of dairy production continues evolving, influenced by water availability, regulatory frameworks, and processing infrastructure. USDA milk production reports and state-specific data from June 2025 reveal emerging patterns worth monitoring through 2030.
Regions Experiencing Growth:
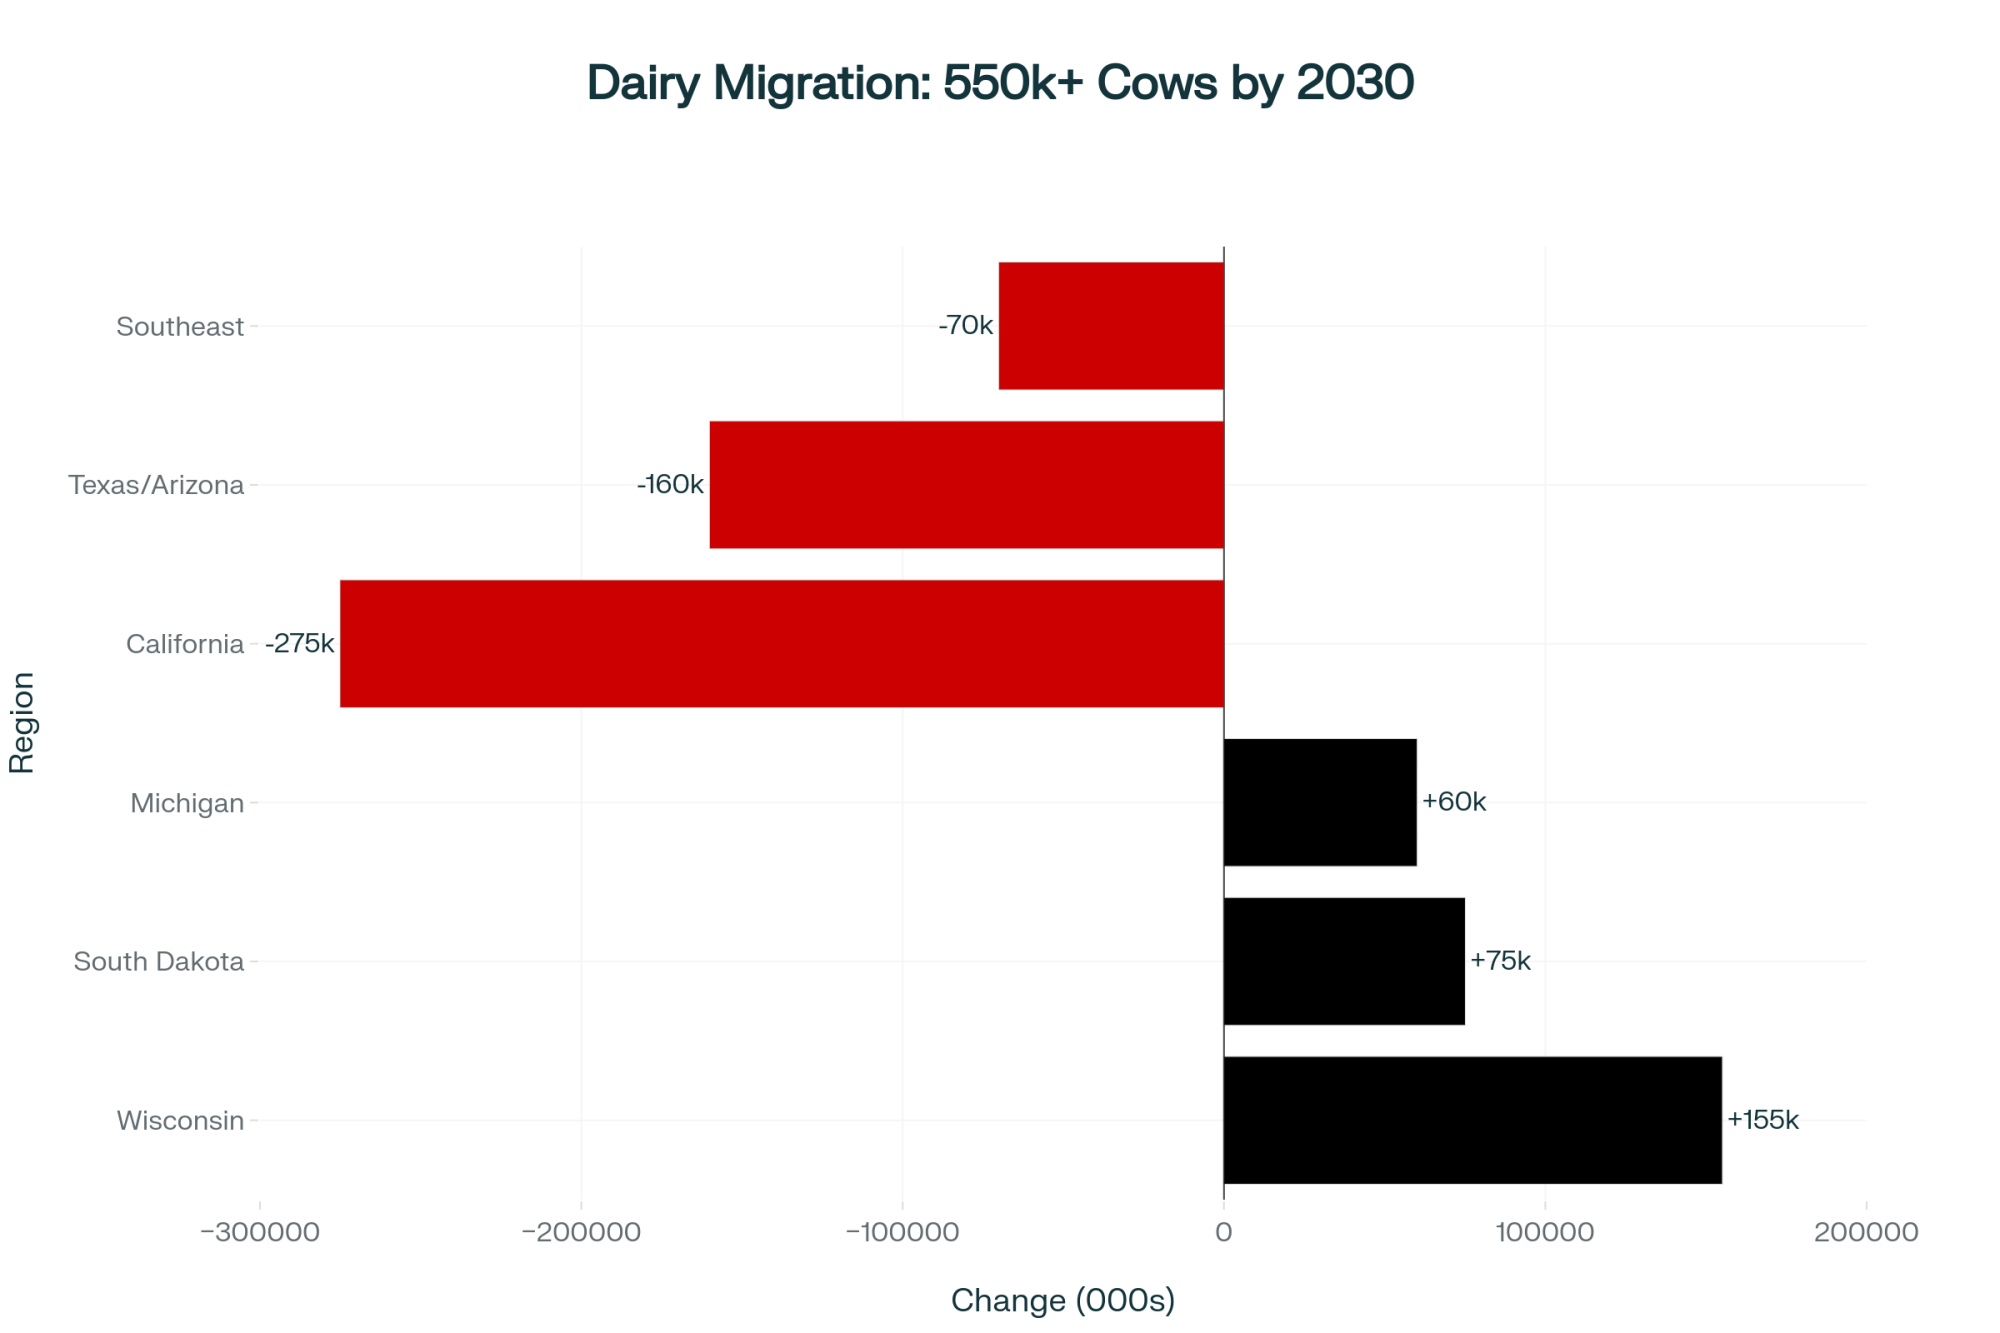
Wisconsin appears poised to add 130,000-180,000 cows between now and 2030, benefiting from factors such as water availability. University of Wisconsin studies indicate the state’s dairy industry contributes $52.8 billion in economic impact—a substantial increase from five years ago.
South Dakota represents an unexpected growth area, potentially adding 60,000-90,000 cows given favorable regulatory conditions and new processing investments.
Michigan shows expansion potential of 45,000-75,000 cows, leveraging Great Lakes water access and existing infrastructure advantages.
Regions Facing Challenges:
California confronts difficult decisions as the Sustainable Groundwater Management Act (SGMA) potentially removes 500,000 to 1 million acres from irrigation by 2040, according to UC Davis and ERA Economics research. This could result in 200,000-350,000 fewer dairy cows.
The Southwest, particularly Texas and Arizona, faces a contraction of 120,000-200,000 cows due to concerns about water scarcity.
Southeastern states continue gradual adjustments, potentially losing 50,000-90,000 cows to heat stress and feed cost pressures.
The Northeast presents an interesting case. Vermont and New York operations are finding success with value-added production and agritourism, though total cow numbers remain relatively stable.
A New York producer recently told me, “We can’t compete on volume, but our proximity to Boston and New York City markets gives us premium opportunities California can’t match.”
A Wisconsin processor shared an observation that captures the transformation: “When California loses a 5,000-cow operation, we typically don’t see a single 5,000-cow dairy relocate here. Instead, we might see three 1,500-cow operations emerge, each requiring different infrastructure support. It represents structural transformation, not simple geographic relocation.”
This fragmentation creates complex dynamics. Regions gaining production face intensified labor competition, increased regulatory attention, and community adaptation challenges.
Areas losing production experience, processor consolidation, and service reductions that can accelerate further exits.
Mid-Size Operations: Evaluating Strategic Options
The 500-700 cow operations that have long anchored American dairying face particularly complex decisions. Cornell’s Dairy Farm Business Summary and related financial analyses reveal that these farms occupy a challenging position—scale limitations for certain efficiencies, yet size constraints for niche-market approaches.
Recent extension analyses suggest that a typical 500-cow operation experiences:
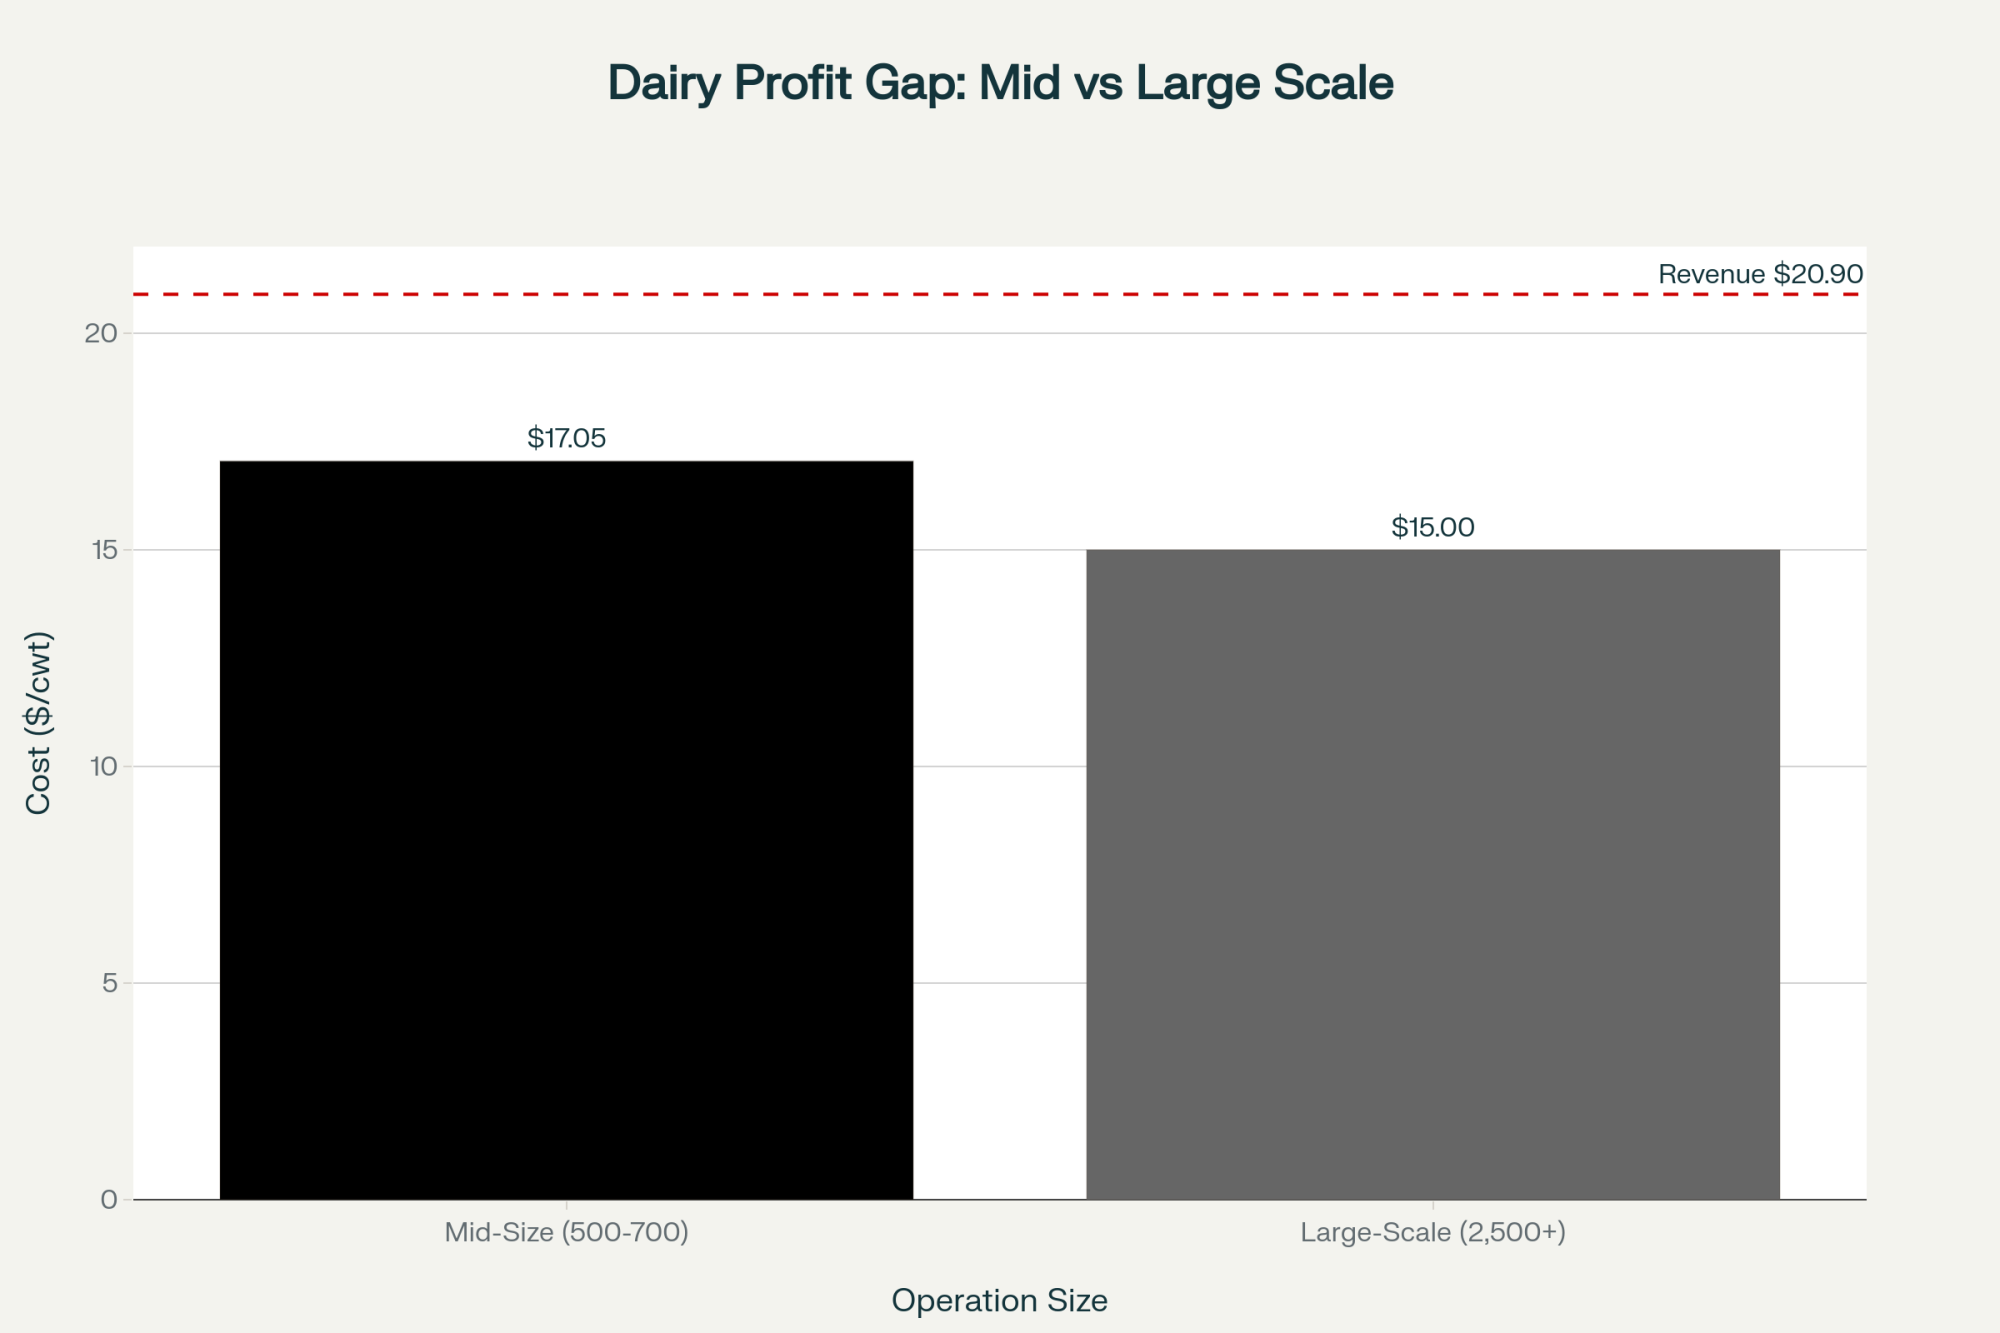
- Production costs: $16.30-17.80/cwt
- Large-scale operations (2,500+ cows): $14.20-15.80/cwt
- Average revenue: $20.90/cwt (based on June 2025 Class III pricing at $18.82/cwt)
- Resulting margins: $3.10-4.60/cwt
That $2-3/cwt cost differential translates into $250,000-375,000 in annual profit lost compared to larger operations—ironically, approximately the capital needed for modernization investments.
Working with producers, we’ve identified five primary strategic paths:
- Scale expansion (to 1,500+ cows): Requires $6-8 million investment, with industry data suggesting 60-70% success rates for well-planned expansions
- Niche market transition (organic/direct marketing): Requires proximity to urban markets, with approximately 20-30% of attempts achieving sustainable success
- Efficiency optimization (robotics at current scale): $1.5 million investment potentially extends viability 8-12 years
- Partnership formation (combining with neighbors): Offers shared resources, though approximately 40% encounter challenges within five years
- Strategic exit (while retaining equity): Can preserve $2-4 million for life’s next chapter
“The most difficult conversations involve 50-year-old producers who believe market cycles will improve their situation. Each year of delayed decision-making can reduce equity by $200,000 to $ 300,000. By the time action feels necessary, options have often narrowed considerably.”
— Dr. Wayne Knoblauch, farm management specialist at Cornell University
Understanding Expansion Challenges: Learning from Experience
Industry data and lender interviews suggest 30-40% of major expansions encounter significant challenges. Through analysis of expansions from 2018 to 2023, patterns emerge that deserve careful consideration.
A typical challenge sequence often unfolds like this…
- Initial phase (Months 1-6): Construction frequently exceeds budgets by 15-20% due to weather delays or supply chain issues, affecting working capital before operations commence.
- Staffing phase (Months 7-12): Labor recruitment proves more difficult than anticipated. Facilities designed for eight workers might operate with four, creating unsustainable workloads.
- Operational phase (Months 13-18): Production often falls 15-20% below projections due to transition stress, learning curves with new facilities, and management bandwidth constraints.
- Stress phase (Months 19-24): Family and personal stress intensifies. Health impacts, relationship strains, and succession uncertainties become pronounced.
- External pressure phase (Months 25-30): Market changes (milk price adjustments, disease challenges, equipment issues) expose accumulated vulnerabilities.
- Resolution phase (Months 30-36): Financial covenants trigger lender discussions, though operational challenges typically preceded financial ones.
A producer who experienced expansion difficulties shared powerful insight: “The financial pressure arrives last. Before that comes health impacts, family stress, and loss of purpose. The paperwork simply documents what already occurred.”
Analysis suggests successful expansions share common elements: 20-30% budget contingencies (versus 5-10% in struggling expansions), 10-15% excess labor capacity from day one, management teams sharing responsibilities, and 10-12 months working capital reserves.
The difference often lies in maintaining adequate buffers—financial, operational, and personal.
Future Operating Models: Three Viable Paths for 2030
Looking toward 2030, current trends and economic modeling suggest three primary operating models will emerge, each with distinct characteristics.
Large-Scale Operations (3,500-8,000 cows)
These operations achieve $14.20-15.80/cwt costs through scale efficiencies and automation. Many generate $800,000-1.8 million annually from renewable energy credits via anaerobic digesters.
The investment requirements are substantial—$25-$35,000 per cow—and management resembles agricultural business leadership more than traditional farming. IDFA’s 2025 report indicates these operations collectively employ 3 million people nationally, generating nearly $780 billion in economic impact.
Premium Niche Operations (40-120 cows)
These farms capture $35-50/cwt through direct marketing, compared to $21/cwt under commodity pricing. They generate $220,000-650,000 family income with minimal debt, according to Cornell’s organic dairy studies.
Marketing and customer relations consume 25-35% of time—it’s farming combined with retail business management. Success requires proximity to metropolitan areas where customers value and can afford premium products.
USDA organic price reports from September confirm these premiums remain stable.
Strategic Mid-Scale Partnerships (800-1,800 cows)
This model involves 2-3 families collaborating to share resources and responsibilities. They achieve $200,000-250,000 income per family with 50-60 hour work weeks.
Technology adoption is selective—perhaps 50-70% robotic milking, 30-50% conventional systems. While these partnerships provide operational scale and lifestyle benefits, they haven’t eliminated all structural pressures.
Notably, the 200-700 cow single-family operations that historically defined American dairying face the most challenging path forward, caught between scale requirements and market opportunities.
| Model | Herd Size | Cost ($/cwt) | Revenue ($/cwt) | Annual Income | Capital Need | Work Hours/Week | Success Factor |
| Mega-Operations | 3,500-8,000 | $14.20-15.80 | $20.90 (commodity) | $800K-1.8M+ | $25-35K | Mgmt role | Scale/automation/bili… |
| Premium Niche | 40-120 | N/A | $35-50 (premium) | $220K-650K | <$5K | 60-70 hrs | Metro/direct marketing |
| Mid-Scale Partnerships | 800-1,800 | $15.50-16.80 | $22-25 (value-added) | $200K-250K | $15-20K | 50-60 hrs | Shared resource/risk |
Emerging Considerations: Factors to Monitor
While the industry focuses on immediate challenges such as labor and milk prices, several emerging factors deserve attention.
Immigration policy represents significant uncertainty. The National Milk Producers Federation estimates that 70% of dairy labor depends on immigrant workers, which could lead to disruption if policies shift dramatically.
Recent enforcement actions reported by industry media in June 2025 provided early indicators of possible impacts.
Replacement heifer availability has become constrained following years of beef-on-dairy breeding programs. Those $1,400 beef-cross calves seemed profitable, but now replacement heifers command $4,000 or more in some regions,according to recent market reports.
This affects expansion possibilities and disease recovery capacity.
Environmental regulations continue evolving. California’s experience with digester requirements and proposed discharge rules requiring 10 mg/L nitrogen limits may preview broader regulatory trends.
Compliance costs could affect financing availability for highly leveraged operations by 2028-2030.
The technical skills gap presents ongoing challenges. Operations investing in automation sometimes struggle finding qualified technicians.
I visited one farm where a $2 million robotic system remained idle for three days awaiting a specialist from Europe. This dependency represents an underappreciated vulnerability.
Practical Considerations: Strategic Planning for 2025-2030
Based on comprehensive industry analysis, producer experiences, and economic projections, several key considerations emerge for dairy farmers navigating this transition.
Decision timing matters significantly. Strategic choices about expansion, market positioning, partnerships, or transitions have relatively narrow windows.
USDA projections showing 1.1% production growth in 2025, ahead of processing capacity, suggest timing considerations remain critical.
Comprehensive margin management supersedes single-metric optimization. Wisconsin’s dairy market assessments emphasize total cost consideration, including labor (exceeding $20/hour in many markets), transportation, premiums, and capital requirements.
Scale positioning requires honest assessment. Operations with 200-700 cows lacking clear succession plans benefit from proactive transition planning.
Farms with 500+ cows and strong financials need a clear strategic direction—whether pursuing scale or niche opportunities.
Adequate reserves prove essential. Cornell studies indicate successful operations maintain 20-30% financial contingencies, 10-15% excess labor capacity, and 10-12 months working capital.
Monitoring emerging risks provides an advantage. Immigration policy, disease risks (particularly HPAI in dairy), replacement availability, and environmental regulations could trigger disruptions.
California’s SGMA implementation offers valuable lessons for planning.
Adapting to new models requires flexibility. Wisconsin economic impact studies show successful operations evolving into diverse models—large-scale operations function as agricultural businesses, niche producers combine farming with marketing, and mid-scale operations rely on complex partnerships.
Success depends on matching capabilities with chosen strategies.
The industry continues consolidating from approximately 35,000 farms today toward a projected 24,000-28,000 by 2030, alongside $11 billion in new processing investments. These changes create both opportunities and challenges.
What emerges from observing hundreds of operations navigating this transition is the importance of recognizing when fundamental business model evolution—not just operational refinement—becomes necessary. Producers actively adapting to new realities position themselves more favorably than those hoping traditional approaches will remain viable.
A successful producer who recently navigated significant transitions shared a valuable perspective: “The question isn’t whether traditional farming methods can continue. The question is whether we’re prepared to evolve to meet the requirements of the 2030 market. That decision—and acting on it promptly—shapes everything that follows.”
The transformation continues, and the industry’s evolution won’t pause for individual decisions. Yet within this change lies opportunity for those prepared to embrace new approaches while honoring agriculture’s enduring values.
Key Takeaways for Dairy Producers
- Focus on total margins, not just feed costs—labor now exceeds $20/hour in many markets and represents 35-40% of true cost structure (Wisconsin Extension, June 2025)
- Adopt individual cow economics to identify top 20% profit cows ($3,100/head) vs. bottom 20% losses ($420/head) (Cornell Dairy Farm Business Summary)
- Invest in practical technology—$30,000-60,000 stack can yield $31,200 annual labor savings (producer case studies)
- Regional shifts are accelerating—Wisconsin is gaining 130,000-180,000 cows, while California faces 200,000-350,000 cow reductions due to SGMA (UC Davis/ERA Economics)
- Mid-size farms (500-700 cows) face $2-3/cwt disadvantage—choose from five strategic paths with 60-70% success rates for expansions (Cornell analyses)
- 30-40% of expansions fail—build 20-30% budget buffers and 10-12 months working capital to succeed (industry lender data, 2018-2023)
- Three 2030 models emerge: Large-scale ($14.20-15.80/cwt costs), niche ($35-50/cwt premiums), mid-scale partnerships ($200K-250K/family income)
- Monitor blind spots: 70% immigrant labor dependency (NMPF), $4,000+ replacement heifers (market reports), evolving environmental rules (California preview)
- Act now—1.1% production growth projected for 2025 leaves narrow decision windows (USDA projections)
Complete references and supporting documentation are available upon request by contacting the editorial team at editor@thebullvine.com.
Learn More:
- 2025 Dairy Market Reality Check: Why Everything You Think You Know About This Year’s Outlook is Wrong– This strategic analysis expands on the main article’s economic themes, detailing how component economics (butterfat and protein) are replacing volume thinking. It provides critical context on milk pricing, FMMO reform, and strategic supplier relationships in a rapidly evolving market.
- AI and Precision Tech: What’s Actually Changing the Game for Dairy Farms in 2025? – For producers ready to invest, this article delivers a tactical deep-dive into the “minimum viable technology stack.” It reveals the hard ROI numbers for precision feeding, health monitoring, and virtual fencing, helping you prioritize capital for the fastest payback.
- Simple LED Lighting Can Boost Production 8% – Here’s Why Most Farms Haven’t Switched – This piece offers a practical, low-cost innovation strategy that complements the high-tech focus. It demonstrates how a simple, often-overlooked investment in barn lighting can yield a significant production increase, providing a tangible, immediate action for boosting efficiency.
 Join the Revolution!
 Join the Revolution!
Join over 30,000 successful dairy professionals who rely on Bullvine Weekly for their competitive edge. Delivered directly to your inbox each week, our exclusive industry insights help you make smarter decisions while saving precious hours every week. Never miss critical updates on milk production trends, breakthrough technologies, and profit-boosting strategies that top producers are already implementing. Subscribe now to transform your dairy operation’s efficiency and profitability—your future success is just one click away.