Archive for beef on dairy genetics

Colostrum. Lameness. Beef Sires. The December 2025 Journal of Dairy Science Just Changed All Three.

At 4 liters, calves kick in pain. Collars miss lameness 23 days early. The wrong beef sire erases your premium. The December 2025 Journal of Dairy Science has the proof—and the fix.

You know how it goes. You settle into a protocol that works, run it for years, and then someone publishes research that makes you question everything. That’s where we are right now.

The December 2025 Journal of Dairy Science published a collection of studies that should make many of us rethink practices we’ve taken for granted. Colostrum volumes. Lameness detection timing. Beef-on-dairy sire selection. Methane genetics. And here’s what’s interesting—these aren’t separate issues anymore. They’re interconnected pieces of an economic puzzle that either fits together or costs you.

Let me walk you through seven findings that carry genuine financial weight.

1. We’ve Been Overfeeding Colostrum—And the Science Finally Proves It

Here’s something that goes against what many of us learned: that “more is better” approach to first-feeding colostrum? The data suggests we’ve pushed past the point of diminishing returns.

Frederick and colleagues at the University of Guelph published their findings in the Journal of Dairy Science, tracking 88 Holstein heifer calves fed colostrum at 6%, 8%, 10%, or 12% of birth body weight. The apparent absorption efficiency of immunoglobulin G peaked in the 6-8% range—calves fed 8% of body weight reached 24-hour serum IgG concentrations of 37.4 g/L. Push to 12%, and you only reach 43.4 g/L despite feeding 50% more volume.

You’d expect a straight line up. That’s not what happened.

What the researchers documented next matters more than the absorption numbers, honestly. Calves in the 10% and 12% groups showed behavioral distress—specifically, kicking behavior indicating gastrointestinal discomfort. The 10% group recorded 21 total kicks; the 12% group had 40. None in the 6-8% groups. That’s not a subtle signal.

For a 40 kg Holstein calf, 8% body weight works out to 3.2 liters maximum in that first feeding. Push beyond that, and you’re overwhelming the gut’s pinocytosis capacity. The excess antibodies pass through unabsorbed, while the calf shows signs of colic.

40 Kicks vs. Zero: The Data That Should Change Your Colostrum Protocol Today. Frederick et al. (JDS, Sept 2025) measured what happens when you push past the gut’s absorption capacity. At 12% body weight (4.8L), you get 40 colic-like kicks and only 16% more IgG than the 8% protocol—while absorption efficiency crashes 19%. The sweet spot? 3.2 liters. Your calves’ guts have been telling you this for years.

I’ve heard from producers who discovered they’d been feeding 4 liters at the first meal for years. The common thread when they switched to 3.2 liters was first feeding with a second feeding at 8 hours? Calf behavior improved noticeably.

The protocol adjustment is straightforward: Weigh the calf. Calculate 8% of body weight. If your colostrum program calls for larger total volumes, split them into smaller volumes. This respects the biology of absorption without sacrificing total IgG delivery.

Now, here’s some important context. Sandra Godden, DVM, at the University of Minnesota, has done foundational work establishing that adequate colostrum volume matters—her research helped move the industry away from underfeeding. Her guidance of feeding up to 10% body weight was a significant advance. What Frederick’s newer research adds is refinement at the upper boundary: the 8% target may be the sweet spot for both absorption efficiency and calf comfort.

Worth noting for those in colder regions: operations with extended birth-to-feeding intervals may need to adjust their timing accordingly. Wisconsin Extension notes that colostrum production tends to slump in fall months, so banking high-quality colostrum from multiparous cows during the peak season makes sense.

And here’s what still matters most—colostrum quality trumps volume every time. A Brix refractometer runs $150-300 and pays for itself the first time it catches a low-quality batch.

Read more: Effects of feeding colostrum volume at 6%, 8%, 10%, or 12% of birth body weight on efficiency of immunoglobulin G absorption, gastric emptying, and postfeeding behavior in Holstein calves

2. The Cellular Reality Behind Chronic Lameness—And Why It Keeps Coming Back

This one gets into the cellular level, and frankly, it explains something that’s frustrated a lot of us—why lameness keeps coming back in certain animals, no matter what we do with footbaths and hoof trimming.

Wilson and colleagues at the University of Nottingham published work in the December Journal of Dairy Science examining collagen composition in the digital cushions of 54 cull dairy cows. The finding that jumped out: Animals with lifetime histories of hoof horn lesions had significantly lower Type I collagen proportions.

So why does that matter for your bottom line? Type III collagen is essentially scar tissue. It lacks the tensile strength of Type I, which is necessary for proper shock absorption. When a cow’s digital cushion shifts toward Type III dominance, she’s walking on a compromised foundation—creating a vicious cycle in which each lameness event further degrades the cushion structure.

Here’s where the numbers get uncomfortable. Robcis and colleagues calculated lameness costs at approximately €307.50 per case (roughly $330-340 USD) through comprehensive bioeconomic modeling of 880 farm scenarios, published in the Journal of Dairy Science in 2023. One of their key conclusions: prevention dramatically outperforms treatment in delivering financial returns. That’s probably not surprising to anyone who’s dealt with chronic lameness cases, but having the economic modeling to back it up helps.

The detection gap is what really gets me. Research consistently shows that automated systems significantly outperform human observation for catching lameness early. Farmers typically detect only about one-third of lame cows identified by researchers using standardized scoring—and that’s not a criticism, that’s just the reality of trying to catch subtle gait changes during a busy day. CattleEye’s AI-powered system, now owned by GEA, can detect mobility changes up to 23 days before human detection. That’s more than three weeks of intervention opportunity we’re currently missing.

And here’s something worth thinking about: activity-based monitoring systems measure quantity of movement, not quality. A cow can maintain her step count while fundamentally changing how she distributes weight. By the time activity actually drops enough to trigger an alert, you’ve usually missed the optimal intervention window.

23 Days. $350. The Detection Gap Bleeding Your Bottom Line Daily. CattleEye’s AI gait analysis catches mobility changes 23 days before human observers or activity monitors—the difference between a $50 footbath intervention and a $400+ hoof trimming case. Activity collars measure how much cows move. Gait AI measures how they move. That distinction is worth $350 per case.

The question to ask any monitoring technology vendor: “What specific behavioral change does your system detect, and at what stage of disease progression does that change become measurable?”

Read more: A history of lameness is associated with reduced proportions of collagen type I relative to type III in the digital cushions of dairy cattle

3. Beef-on-Dairy Economics: Where the Real Money Gets Made or Lost

I’ve noticed that beef-on-dairy conversations tend to focus almost exclusively on the calf premium while glossing over what happens at the calving pen. The honest answer is more conditional than either the “always profitable” or “too risky” camps suggest.

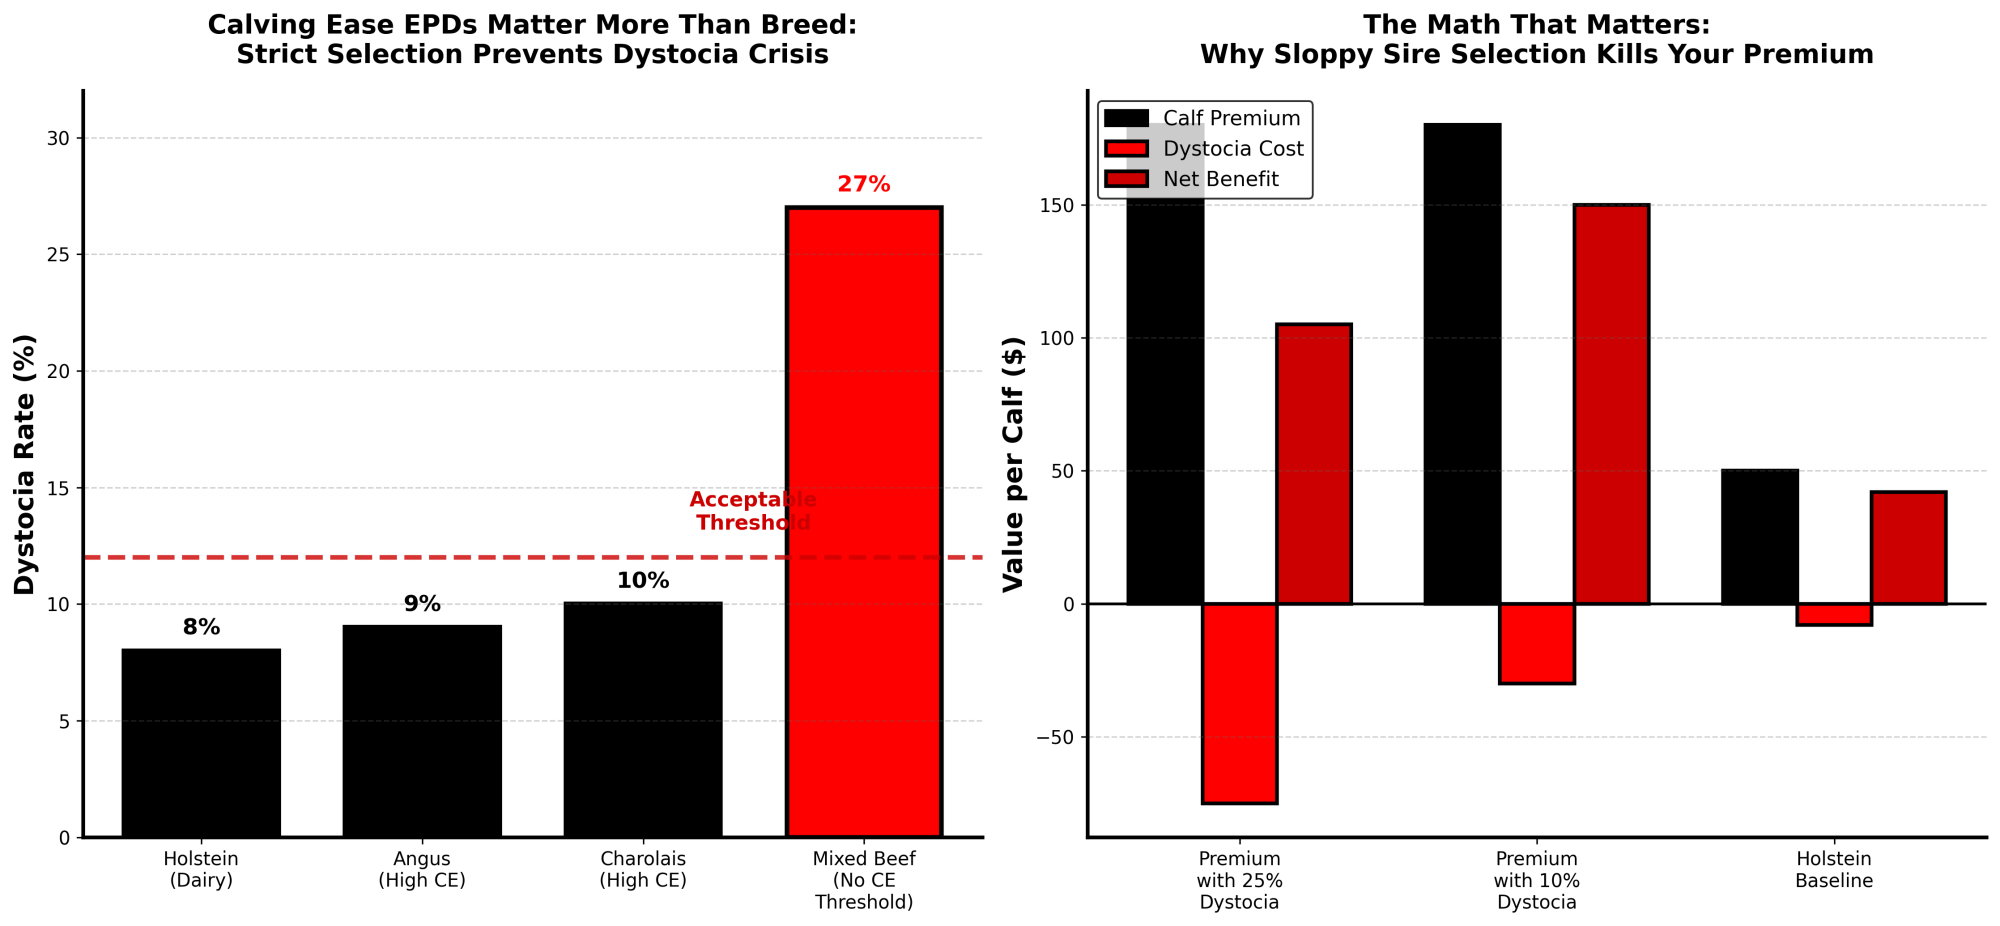
A December 2025 Journal of Dairy Science study analyzed 231,000 calving ease records from first-lactation Holstein and Jersey cows inseminated with Angus, Charolais, or Simmental semen, plus 1.2 million records across the first three lactations. What the genetic analysis revealed is that dystocia outcomes depend heavily on sire selection—not just breed, but the calving ease genetics within that breed.

And here’s what’s encouraging: Research from Penn State and the University of Kentucky found that when producers select beef sires with favorable calving ease indices for mature dairy cows—not heifers, cows—dystocia rates showed no significant increase compared to dairy semen. As Tara Felix, Associate Professor of Animal Science at Penn State, noted in her research summary, “Our results suggest that current beef-dairy sire selection parameters in the United States are not negatively affecting the dairy cow.”

But you can’t just grab any beef semen and expect good results. I’ve heard versions of this story from producers across the Midwest—early adopters who chased maximum premiums without paying close attention to calving ease scores, then watched their heifer dystocia rates climb toward 25-30%. The common thread in the operations that turned it around: switching to strict CE requirements and limiting beef breedings to mature cows made the program profitable. “We got greedy on the calf side and forgot about the cow side” is how one producer put it.

Beef-on-Dairy Conditional Framework

The program generally works if you:

  • Select beef sires with documented calving ease EPDs—don’t just use whatever semen is cheapest
  • Limit beef-cross breeding to mature cows or heifers you’re confident can handle the calf
  • Actually monitor your dystocia rates and adjust breed selection if they start climbing

Angus and Hereford with strong CE scores? The economics generally work. Charolais or Belgian Blue without careful selection? That premium can evaporate fast.

The $45 Question: Is Your Beef-on-Dairy Program Actually Profitable? Penn State/Kentucky research found zero dystocia increase when CE EPDs are enforced. But operations ignoring CE thresholds saw dystocia climb past 25%. The math: $180 calf premium minus $75 dystocia costs = $105 net. Same bull with proper CE selection: $150 net. That $45 difference compounds fast in a 1,000-cow herd.

Read more: A comparative analysis of dairy production systems: Milk production tiers and their impact on dairy calf and heifer cost of production in Brazil

4. Methane Genetics: More Tractable Than Most of Us Assumed

There’s been considerable hand-wringing about methane emissions in cattle—you’ve probably seen the headlines. But the genetics work emerging from Canada, Ireland, and New Zealand suggests we have more selection leverage than many assumed. And here’s the part that matters most: it doesn’t require sacrificing production.

Semex UK, working with Lactanet and the University of Guelph, analyzed over 700,000 milk mid-infrared spectroscopy records. The finding that matters most for practical selection decisions: Methane efficiency traits show heritability of approximately 23%—comparable to production traits and dramatically higher than fertility or health traits, which typically run 3-8%.

Permanent vs. Rented: Why Genetic Selection Beats Feed Additives in the 20-Year Game. Lactanet’s genomic evaluation proves methane traits are 23% heritable—1.5% annual reduction compounding to 20-30% by 2050. Meanwhile, feed additives costing $100-150/cow/year deliver 15-20% reduction while you’re paying. The math favors genetics: permanent, cumulative, zero recurring cost after semen investment.

That heritability number caught my attention. Semex projects that a 20-30% reduction in methane by 2050 is achievable through genetic selection, depending on selection intensity.

The timeline to meaningful herd-level impact looks something like:

  • Generation 1 (2 years): 3-4% reduction in daughters’ methane output
  • Generation 3 (6-8 years): 10-12% cumulative herd reduction
  • Long-term potential: 20-30% reduction through genetics alone

Here’s what should reassure production-focused farmers: The genetic correlation between methane efficiency and milk yield is essentially zero. You can select for high production and low emissions simultaneously without compromise. No trade-off required.

In practice, it’s simpler than overhauling your breeding program. Keep selecting for your primary profit drivers—fat, protein, NM$, health traits. Use Methane Efficiency as a tie-breaker. If two bulls look equivalent on everything that matters to your bottom line today, pick the one with the better Methane Efficiency score. You get the same profitable cow while quietly stripping carbon footprint from your herd with every generation.

International programs are moving fast on this. New Zealand—where pasture-based systems make feed additives impractical at scale—is pursuing genetics as a primary pathway, with their major AI companies developing methane indices for widespread use.

Read more: Comparing the genetic architecture of energy balance predicted by mid-infrared spectrometry, a novel energy deficiency score, and several biomarkers

5. Evaluating Methane Feed Additives: The Questions That Actually Matter

The methane-reduction market is flooded with products right now. Some deliver genuine results; many don’t. What I’ve found is that the difference often comes down to asking the right questions before signing purchase orders.

Four Questions Before You Buy Any Methane Additive

Print this. Bring it to your next sales meeting.

  1. “Show me the DMI data alongside the methane data.” If intake dropped proportionally, you might be looking at an expensive appetite suppressant rather than a real mitigation tool.
  2. “Is this reduction measured in g/day or g/kg DMI?” The answer tells you whether it’s real mitigation or just feed intake depression. Total daily methane can drop simply because the cow eats less—methane yield per kilogram of dry matter intake is what proves the additive actually alters fermentation.
  3. “How long did the trials run?” Anything under eight weeks should raise some skepticism about persistence. The rumen microbiome adapts constantly—many oils and plant extracts show impressive 15-20% reductions initially, then methanogens figure out a workaround.
  4. “Where did the hydrogen go?” This one separates people who understand the biology from people reading a script. Blocking methane means blocking hydrogen disposal. That hydrogen has to end up somewhere—ideally in propionate, which the cow uses for energy and milk. If the vendor can’t explain the hydrogen sink, the rumen might just be becoming stressed rather than more efficient.

Here’s a useful way to think about it: the rumen is essentially a fermentation vat that’s been optimizing itself for millions of years. If someone’s going to claim they’ve fundamentally changed how it works, they need to prove the bugs didn’t just figure out a workaround within a few weeks.

Read more: Graduate Student Literature Review: Limitations in feeding red seaweed Asparagopsisspecies for enteric methane mitigation in ruminants

6. You’re Already Paying for Methane Data—You Just Might Not Know It

Most operations already collect Mid-Infrared spectral data through DHI testing. That’s how the lab measures fat and protein percentages. What’s becoming clear is that the same spectral signature can predict methane output—and you’re already generating and paying for those samples.

The biological mechanism is elegant: Acetate and butyrate production in the rumen releases hydrogen, which is converted to methane, while propionate production uses hydrogen as a sink. These metabolic pathways leave signatures in milk fatty acid profiles that MIR spectrometry can detect.

High-methane cow? Her rumen’s churning out acetate. Her milk is rich in de novo fatty acids.

Low-methane cow? More hydrogen is going to propionate. Different fatty acid profile in the tank.

What this means on your farm: The Methane Efficiency scores appearing on genetic evaluations are derived largely from this data you’re already generating. The infrastructure exists. The question is whether you’re using it.

Those de novo fatty acid readings, by the way, have value beyond methane prediction. They’re also indicators of rumen health. Too-low de novo percentages can signal rumen acidosis—something worth monitoring in your transition cows regardless of where you stand on carbon footprints.

Read more: Genetic parameters of mid-infrared-predicted methane production and its relationship with production traits in Walloon Holstein dairy cows

7. The BLV Connection: What We Know and What We’re Still Learning

Here’s one where I want to be careful about what we claim versus what we’re still figuring out. Some emerging research suggests associations between BLV status in dams and calf health outcomes, including respiratory disease. But the mechanisms remain unclear, and that uncertainty matters for how you respond.

Three potential pathways deserve consideration:

Altered colostrum immunity: BLV-infected dams may produce colostrum with compromised immune components.

Direct immune effects: Calves may experience some disruption of immune function.

Confounded management: High-BLV herds may systematically differ in biosecurity practices, calf housing density, and ventilation—factors that independently affect respiratory disease.

What we know with greater confidence comes from USDA NAHMS survey data and subsequent research: approximately 94% of U.S. dairy herds have at least one BLV-positive cow, with an average within-herd prevalence of approximately 46% (LaDronka et al., 2018). Economic analyses have found that each 10% increase in herd prevalence is associated with rolling herd average losses in the 430-540 pound range, depending on the study methodology.

My honest assessment: Monitor your herd’s BLV status alongside calf health records. If you’re already pursuing BLV reduction for production and longevity reasons—which the accumulating research supports—any potential calf health benefits would be a bonus. But I wouldn’t recommend major program changes based solely on the calf respiratory associations until we better understand what’s driving them.

Read more: The effect of bovine leukemia virus infection on health and growth of nonreplacement dairy calves

Three Things You Can Do This Month

  1. Pull your de novo fatty acid data from your last few DHI reports. If you’re not already looking at it, start. It’s a free window into rumen health—and eventually methane efficiency—that you’re already paying for.
  2. Review your beef-on-dairy sire stack. If you haven’t audited calving ease EPDs recently, do it now. Set a minimum threshold and stick to it. The premium isn’t worth much if you’re burning it on dystocia.
  3. Adjust your colostrum protocol. Cap first feeding at 8% body weight. Split larger volumes into a second feeding at 6-12 hours. And if you don’t have a Brix refractometer yet… well, you know what to add to the supply order.

Research Evaluation Checklist by Decision Type

For Monitoring Technology:

  • What biological change does it actually detect?
  • At what disease stage does that change become measurable?
  • Does early detection enable a cost-effective intervention, or are you just getting bad news faster?

For Feed Additives:

  • Is the effect on yield (per kg DMI) or just production (total daily output)?
  • How long did the trials run?
  • Can the vendor explain the biology, including what happens to displaced hydrogen?

For Genetic Indexes:

  • What’s the heritability and reference population size?
  • What are the correlations with traits you already prioritize?
  • Is this a new selection focus or a tie-breaker within existing goals?

Your experience matters: Does this match what you’re seeing on your operation? If your data differs—particularly on colostrum volumes, lameness detection, or beef-on-dairy outcomes—we want to hear from you. Regional variation is real, and producer feedback improves future coverage. Drop us a line at editorial@thebullvine.com.

Based on the image provided, here is the digitized data converted into a formatted table.

December 2025 JDS Evidence vs. Industry Standard Protocols

Practice AreaTraditional Protocol (Industry Standard)Research-Backed Protocol (December 2025 JDS)Key Impact (Risk/Benefit)
Colostrum First Feeding• 4+ liters
• (~10-12% body weight)
• Single feeding
• 3.2 liters max
• (8% body weight)
• Split into 2 feedings
• 40 kicks vs. 0 kicks(signifying pain)
•  Colic distress
•  IgG absorption 37-43 g/L
Lameness Detection Method• Visual locomotion scoring
• 2-3x per week
• Activity monitors
• AI gait analysis
• Daily automated scoring
• 2D camera systems
• 23-day earlier detection
• $350 cost savings
•  Chronic lameness cycle
Beef-on-Dairy Sire Selection• Any beef breed
• Focus on calf premium
• No CE threshold
• Strict CE EPD threshold
• Breed-agnostic
• Mature cows only
• 10% vs 25% dystocia
• +$108 net per calf
•  Heifer culling
Methane Mitigation Strategy• Feed additives
• $100-150/cow/year
• Ongoing cost
• Genetic selection
• 23% heritability
• One time investment
• 20-30% reduction by 2050
•  Milk production
•  Market access
Methane Cost Impact• Annual recurring cost
• Variable efficacy
• Potential DMI reduction
• Permanent improvement
• Compounding gains
• Zero production trade-off
• Feed additives: **-$0.35/day**
• Genetics: Permanent
•  Sustainability credentials

Key Takeaways:

  • Cap first-feeding colostrum at 3.2L (8% BW): Frederick et al. (2025) found calves fed 12% showed 40 colic-like kicks vs. zero at 8%—beyond that, you’re causing discomfort without improving immunity
  • Detect lameness 23 days earlier with gait analysis: Activity collars measure steps, not weight distribution; AI catches mobility changes in the $50 prevention window, not the $400 treatment stage
  • Enforce calving ease thresholds on beef sires: Genetic analysis of 231,000 records confirms CE EPDs—not breed—determine beef-on-dairy profitability; without strict thresholds, dystocia exceeds 25%
  • Add methane efficiency to your sire criteria: At 23% heritability with zero milk yield trade-off, it’s a cost-free addition—use it as a tie-breaker between otherwise equivalent bulls
  • Review your de novo fatty acid data: MIR spectral analysis in your DHI reports reflects rumen health and methane patterns—actionable insights you’re already generating

Executive Summary: 

The December 2025 Journal of Dairy Science delivers peer-reviewed findings that challenge three protocols most operations haven’t questioned in years—and the financial math demands attention. On colostrum: University of Guelph researchers found that calves fed 12% of body weight had 40 colic-like kicking episodes, versus zero at 8%, making 3.2 liters the new evidence-based first-feeding maximum for typical Holstein calves. On lameness detection: AI gait analysis identifies mobility changes 23 days before activity collars or human observation—that 23-day gap is the difference between $50 early intervention and $400+ treatment costs after lesions develop. On beef-on-dairy: analysis of 231,000 calving records shows profitability hinges on calving ease EPDs, not breed; operations with strict CE thresholds report no increase in dystocia, while those ignoring sire selection see rates climb past 25%. Additionally, methane efficiency is now validated at 23% heritability, with no correlation with milk production—a trait that costs nothing to add to your sire selection criteria. Each finding points to the same conclusion: standard practices are underperforming, and the December 2025 JDS provides the data to fix them.

Editor’s Note: The research discussed here comes from peer-reviewed studies in the December 2025 Journal of Dairy Science and related publications. Economic calculations represent illustrative estimates based on published methodologies and national averages—your costs and returns will vary by region, herd size, and management practices. We welcome producer feedback at editorial@thebullvine.com.

Learn More:

Join the Revolution!

Join over 30,000 successful dairy professionals who rely on Bullvine Weekly for their competitive edge. Delivered directly to your inbox each week, our exclusive industry insights help you make smarter decisions while saving precious hours every week. Never miss critical updates on milk production trends, breakthrough technologies, and profit-boosting strategies that top producers are already implementing. Subscribe now to transform your dairy operation’s efficiency and profitability—your future success is just one click away.

NewsSubscribe
First
Last
Consent

Feed Quality and the Hidden Economics of Beef-on-Dairy Programs

The Beef-on-Dairy Paradox: Why Spending More Per Calf Can Earn You More.

You know what’s been keeping me up lately? The price spreads we’re seeing between Holstein bulls and beef-dairy crosses at sale barns across the Midwest. Market reports indicate these spreads have widened considerably, and it’s got everyone talking.

However, what’s interesting—and this is something industry observers are starting to notice—is that not everyone running beef-on-dairy programs is actually making money. Some operations are doing worse than their neighbors who’ve stuck with straight Holsteins. How’s that possible with these market premiums? That’s a question worth exploring.

Different Philosophies, Different Outcomes

The Profit Paradox: Operations investing $150+ per calf in quality nutrition and genetics generate 40-50% higher net returns than cost-cutting approaches

Examining the data that’s emerging, we’re seeing significantly different approaches out there. And honestly, the outcomes are all over the map.

Some folks are understandably focused on keeping costs as low as possible. Makes sense, right? They’re trying to capture beef premiums without spending much extra—using their regular feeding programs, choosing lower-cost genetic options, basically treating beef crosses like slightly different Holstein calves. However, available data indicate that many of these operations capture only a fraction of the available quality premiums. Their net benefit might be positive, but it is often barely so.

It reminds me of that old saying—you can’t starve a profit out of cattle. Yet when feed costs climb, we all feel that temptation, don’t we?

Then you’ve got operations taking more measured steps. They’re investing in better calf nutrition, selecting proven beef genetics, and developing basic tracking systems. Nothing fancy, just steady improvements. Industry patterns suggest that these individuals generally capture most of the available premiums and exhibit reliable positive returns. Good old-fashioned blocking and tackling.

This development suggests something counterintuitive—operations spending the most per calf often generate the highest net returns. Seems backward at first. But when you think about it… they’re the ones with comprehensive data systems, precision feeding, and systematic breeding strategies. All the information we hear about at the winter meetings, but we wonder if it’s really worth it. Turns out, sometimes it really is.

Strategic Implementation Timeline: Building Your Program

Now, I know what you’re thinking—not everyone can transform their operation overnight. Most of us can’t, frankly. So what farmers are finding is a more practical path forward, especially when timing is critical.

Industry patterns suggest successful approaches tend to be gradual. You might start with foundation work—genomic testing on your best cows. Most operations implementing this staged approach report positive cash flow within 18 to 24 months. The $50 per head testing cost typically pays for itself within the first calf crop through better breeding decisions. Select proven beef sires with documented performance records. Nothing experimental, just reliable genetics that work.

The Long Game Wins: Quality-focused beef-on-dairy programs achieve 30% grade improvements by Year 3, while cost-cutting approaches stall at 12%—creating an 18-point performance gap that compounds annually in market premiums.

Industry data shows operations following systematic approaches typically see grade improvements of 20-30% over three-year periods. Start small, keep good records, and adjust as you learn.

And here’s something crucial that dairy nutrition research consistently demonstrates: consistency in calf nutrition matters more than many of us realize. When operations upgrade nutrition for all calves—not just the crosses—it appears to create that stable environment where genetics can really express themselves. The Beef Quality Assurance program, offered through state extension services, provides free resources on this topic. Makes sense when you stop and think about it.

The timing piece is critical here. If you’re considering a more serious commitment to beef and dairy, the biological clock doesn’t wait for our decision-making process, does it? Good breeding decisions made in the coming months should produce calves that hit the market while premiums remain attractive. Every breeding opportunity missed now is one less quality calf when you need it. That’s the unforgiving math of cattle production—nine months of gestation plus feeding time means today’s decisions create opportunities almost two years in the future.

As comfort levels increase, folks scale what’s working. More beef breeding, better feeding systems, stronger market relationships. But it’s gradual. Nobody’s revolutionizing their whole operation in one season.

That three-phase approach typically spans 24-36 months, from the first genomic test to an optimized program: foundation building (6 months), scaling what works (12 months), and then optimization based on actual results (12 months). The timeline matters because breeding decisions made today affect calves that won’t hit the market for nearly two years.

Some opportunities have already passed, honestly. The earliest adoption advantages, those first-mover processor relationships—those ships have sailed. That’s just reality. But industry indicators suggest there’s still a meaningful opportunity here. Regional processors are still developing programs, seeking consistent suppliers who can meet their quality specifications.

The Feed Quality Factor Nobody Talks About

I’ve noticed that when we discuss beef-on-dairy economics, feed quality rarely comes up for discussion. We’re always focused on feed costs, right? But when corn’s relatively affordable, having consistent feed quality might matter even more than the price per ton.

Take molasses, for instance. Most of us never give it a second thought. However, research from university trials on feed quality reveals that the sugar content in generic molasses can vary significantly—documented research shows it ranging from 39.2% to 67.3% in cane molasses samples. That kind of swing can reduce starter intake by up to 18% according to controlled feeding studies. Think about that for a minute… you’re trying to get these valuable crossbred calves off to a strong start, and inconsistent molasses is working against you.

Quality feed companies, such as Kalmbach Feeds, have responded by implementing strict quality standards. Their documentation indicates that they maintain a minimum specification of  Total Sugars in their molasses, along with controlled mineral levels and consistent Brix readings. That’s not just marketing talk—it’s measurable consistency that translates to calf performance.

The research backing this is compelling. When molasses quality varies, it affects not only palatability but also other factors as well. It alters rumen fermentation patterns, volatile fatty acid production, and ultimately, how well those expensive beef genetics can be expressed. Recent rumen development research indicates that consistent, quality-controlled molasses can increase butyrate production—and butyrate is crucial for rumen papillae development in young calves.

I understand the appeal of mixing your own rations when ingredients are reasonable. Some operations do it really well. But consider everything involved—mixer maintenance, storage losses, labor time, quality testing, and yeah, that occasional batch that doesn’t turn out quite right. Operations implementing these consistency improvements often report significant performance gains—some seeing a 10-15% improvement in feed efficiency—that more than offset the investment.

Sponsored Post

Regional Differences Matter More Than You’d Think

What farmers are finding is that this beef-on-dairy opportunity plays out really differently depending on where you farm.

In Wisconsin and Minnesota, processor density helps, but those winters… crossbred calves require different management when it’s twenty degrees below zero. Extra bedding, draft protection, maybe some building modifications. Many producers report budgeting extra for winter housing adjustments—it adds up. Consider that heifers may require different housing than steers as well.

Out East—Pennsylvania, New York—it’s a different game. Fewer processors mean every relationship matters more. Programs like National Beef’s AngusLink, Tyson’s Progressive Beef initiatives, or regional programs through American Foods Group offer structured premium opportunities; however, you must consistently meet their specific requirements. The humidity, though… some practitioners report respiratory challenges seem more common with crosses during those muggy summers.

And out West? California and Idaho operations face different challenges altogether. Scale requirements can be daunting—some processors want to see serious volume before they’ll even talk to you. But year-round feeding conditions? That’s a real advantage compared to the Midwest’s weather swings. Additionally, proximity to major feedlots offers various marketing options.

Extension services and breed associations often offer free consultation on genetic selection and program development—resources that many producers don’t realize are available. Some states even offer cost-share programs for genetic improvement. Check with your local extension office about what’s available in your area.

Reading the Market Tea Leaves

Looking at adoption patterns, beef-on-dairy breeding appears to be expanding rapidly across the industry. These premiums we’re seeing will probably hold for a while. But markets being markets, they’ll likely moderate as more producers adopt the practice. Once beef crosses become common enough in the supply chain, that scarcity premium starts to soften—we’ve seen it before with other trends.

The beef cow herd will rebuild eventually—it always does when calf prices stay attractive long enough. There is apparently a new packing capacity in development that should alleviate some current bottlenecks. These things take time, though. Years, not months.

This development suggests that operations building quality-focused programs now might maintain good margins even after scarcity premiums fade. Quality differentiation, operational efficiency, and perhaps some technological advantages—these create value that doesn’t depend entirely on tight supplies.

Let’s Be Honest About Risk

We should discuss potential pitfalls, because things do go wrong in this business.

Crossbred calves may present different management needs. Some practitioners report that they may respond differently to standard protocols, although research in this area is still in its early stages of development. What works for Holsteins doesn’t always translate directly to other breeds. Your vet can provide insights on what they’re seeing locally—it seems to vary quite a bit by region. Labor requirements may also increase, particularly during the critical first 60 days.

Markets shift—we’ve all lived through cycles. If you’re borrowing to expand beef-on-dairy programs, keeping debt conservative makes sense. Financial advisors often recommend maintaining a reasonable debt-to-asset ratio when making long-term commitments.

And processor relationships can change. Plant modifications, ownership transitions, program changes—they happen. Having alternatives, even if they’re not your first choice, provides important flexibility.

Finding Your Own Path

For smaller operations with fewer than 200 cows, success often stems from excellence in basics rather than technology. Good genetics, consistent nutrition, and simple but effective tracking. Consider partnering with service providers for expertise rather than trying to develop everything internally. Operations implementing basic improvements often see meaningful returns when they focus on consistency over complexity.

Mid-sized operations (200-500 cows) often do well with staged approaches. Spreading investments over time, testing at a smaller scale before expanding, leveraging cooperative resources where available. It’s about balancing risk and opportunity, right? These operations typically see the best return on investment when they focus on gradual system improvements rather than dramatic overhauls.

Larger operations face clearer but harder choices. Partial implementation rarely seems to work well at scale. Either build comprehensive systems for long-term positioning or maintain flexibility to adjust as markets evolve.

The Bigger Picture

I’ve noticed that beef-on-dairy reflects broader patterns we’ve seen in agriculture before. When commodity markets experience structural changes, operations that build capabilities and systems often maintain advantages even after initial premiums moderate. We saw it with the adoption of rbST, again with genomic testing, and now with beef-on-dairy.

The operations struggling aren’t necessarily doing anything wrong—they’re optimizing for different constraints. If capital or management bandwidth is limited, focusing on cost control makes perfect sense. But recognizing that this approach may limit access to emerging premiums helps with realistic planning.

Industry consolidation patterns suggest market transitions create both opportunities and challenges. Operations that adapt thoughtfully, building on their strengths while addressing market needs, generally emerge in good shape. Those that either resist change entirely or chase every trend without focus… well, that tends to be harder.

Feed quality consistency—like the molasses example we discussed—genetic selection, and systematic management create value beyond market cycles. Operations investing here position themselves not just for today’s premiums but for whatever comes next.

As we make breeding decisions for calves that won’t reach market for almost two years, thinking about where the industry might be heading matters as much as reacting to today’s prices. The biological lag in cattle production means today’s decisions create tomorrow’s reality—for better or worse.

The beef-on-dairy opportunity seems real, but it’s not uniform or guaranteed. Success likely requires matching strategy to your specific resources, capabilities, and regional context. And, perhaps most importantly, it requires recognizing that in evolving markets, what works today might not work tomorrow.

That’s the challenge—and opportunity—we’re all navigating together. What’s your take on it?

FINAL KEY TAKEAWAYS

  • The Profit Paradox: The most profitable beef-on-dairy programs often have higher per-calf costs. Their success comes from strategic investment in nutrition and genetics, which generates net returns that significantly outperform low-cost, minimum-effort approaches.
  • Feed Consistency Trumps Cost: Inconsistent ingredients are a hidden profit killer. Generic molasses, for example, can vary from 39% to 67% sugar, a swing shown to cut calf starter intake by up to 18% and undermine genetic potential. Paying for quality-controlled feed delivers more predictable performance.
  • Your Strategic Roadmap: Lasting success is built over 24-36 months, not one season. Start with a strong foundation (like genomic testing your best cows), gradually scale what works for your operation, and then optimize using your own carcass data—not industry averages.
  • Biology Doesn’t Wait: Breeding decisions made today create the calves that will hit the market in late 2027. To build a program that remains profitable even after current premiums soften, the time to invest in quality and consistency is now.

EXECUTIVE SUMMARY 

While market premiums for beef-on-dairy calves are strong, profitability varies wildly from farm to farm. The crucial difference isn’t luck; it’s strategy. Industry patterns reveal that producers who strategically invest in superior nutrition, genetics, and management consistently achieve higher net returns than neighbors focused solely on cutting costs. The hidden killer for many programs is feed inconsistency—for instance, when variable sugar content in molasses cuts starter intake by 18%, it sabotages the very genetic potential you’ve invested in. Real success requires a deliberate 24-36 month journey: building a foundation with tools like genomic testing, scaling up proven practices, and optimizing based on your own results. With today’s breeding decisions creating your 2027 market calves, the window is closing to build a quality-driven program that can thrive long-term. In this evolving market, the cost of inaction is proving far greater than the cost of strategic investment.

Complete references and supporting documentation are available upon request by contacting the editorial team at editor@thebullvine.com.

Learn More:

Join the Revolution!

Join over 30,000 successful dairy professionals who rely on Bullvine Weekly for their competitive edge. Delivered directly to your inbox each week, our exclusive industry insights help you make smarter decisions while saving precious hours every week. Never miss critical updates on milk production trends, breakthrough technologies, and profit-boosting strategies that top producers are already implementing. Subscribe now to transform your dairy operation’s efficiency and profitability—your future success is just one click away.

NewsSubscribe
First
Last
Consent

The Feed Price Paradox Crushing Dairy Margins

Feed dropped 23% but 68% of farms report worse margins—labor up 30%, equipment up 25%, co-op fees eating $1-3/cwt

EXECUTIVE SUMMARY: Here’s what’s keeping dairy producers up at night: despite feed costs dropping roughly 23% from recent peaks, land-grant university analyses show the majority of operations are experiencing their tightest margins in years. The disconnect stems from the feed’s shrinking role in total costs—now just 35-40% of expenses, compared to the historic 50%, according to extension economists at Cornell, Wisconsin, and Penn State. Labor costs have increased by approximately 30% since 2021, with wages commonly exceeding $20 per hour. Meanwhile, equipment financing has essentially doubled, and cooperative assessments are now taking $1-3 per hundredweight, a figure that didn’t exist five years ago. What farmers are discovering is that the traditional safety nets, including the Dairy Margin Coverage program, often miss these non-feed pressures entirely—the formula still assumes an economic structure from decades past. Looking ahead, operations that adapt through strategic diversification—whether that’s beef-on-dairy genetics capturing premiums of $800-$ 1,000, targeted technology investments, or collaborative marketing approaches—are finding paths forward despite the pressure. The key is understanding that waiting for old economic relationships to reassert themselves is no longer a viable strategy; successful operations are already rewriting their playbooks for this new reality.

dairy cost reduction strategy

What’s been puzzling everyone at the co-op meetings lately? Feed prices have come off their highs—grain markets have softened quite a bit, and protein sources are more reasonable than they’ve been in a while. But here’s the thing that doesn’t add up… many producers I talk with are actually seeing tighter margins now than when feed was more expensive.

I’ve been chewing on this for a while, talking with folks from different regions, and what’s becoming clear is that something fundamental has shifted in how dairy economics work. Land-grant university analyses from Wisconsin, Cornell, and Penn State in recent months all point to the same thing—the traditional relationships between feed costs and margins have broken down. Check your state extension’s dairy enterprise analysis tools for tracking these costs, because understanding what’s happening might help us all figure out how to navigate what’s ahead.

The Broken Feed-Margin Relationship

For generations, we all operated on this principle: when feed costs drop, margins improve. Simple as that, right? However, that relationship appears to have deteriorated, and it’s affecting everyone, from small grazing operations in the Southeast to mega-dairies in Idaho and the Pacific Northwest.

A producer from central Wisconsin put it to me this way recently: “Twenty years ago, if someone told me I’d have cheaper feed but worse margins, I’d have thought they were crazy.” And yet… here we are.

Feed costs dropped from 52% to 36% of total expenses while labor climbed to 28% – revealing why cheaper feed isn’t translating to better margins

What’s striking is the disconnect between the USDA Dairy Margin Coverage program’s calculations and the actual cash flow pain producers are experiencing. The DMC formula—based on corn, soybean meal, and alfalfa prices compared to the all-milk price—often shows acceptable margins. Meanwhile, extension economists note the DMC margin can diverge significantly from on-farm cash flow when non-feed costs rise, which is exactly what we’re seeing now.

Multiple land-grant analyses indicate that the feed’s share of total costs has declined from the historic 50% range to the mid-30s to low-40s in many systems. When your biggest historic cost shrinks that much, relief from lower feed prices just doesn’t move the needle like it used to.

Quick Cost Reality Check:

  • Labor: Up approximately 30% since 2021
  • Equipment: Up 20-25% since 2021
  • Interest rates: Doubled from 2021 lows
  • Co-op assessments: $1-3/cwt (new for many)

The Hidden Costs Eating Away at Margins

Labor: A New Competitive Landscape

We’re no longer just competing with other farms for labor. Amazon warehouses, manufacturing plants, and retail operations are all in the game, offering comparable pay and easier schedules.

USDA farm labor surveys in 2025 show wage rates across all dairy regions commonly approaching or exceeding $20 per hour—and that’s if you can find people. Extension field reports describe elevated turnover rates that significantly impact training and productivity. Every time someone new comes on board, there’s that learning curve… equipment doesn’t get maintained quite right, routines change, cows get stressed. It all adds up.

The stress isn’t just financial either. I know many operators who are working 80-hour weeks because they can’t find reliable help, and that takes a toll on their families, health, and ability to think strategically about the future. A producer in Washington state mentioned to me that he has started exploring different shift schedules, trying to make the job more appealing to individuals who prefer non-traditional dairy hours.

Equipment: Sticker Shock and Hard Decisions

Industry indices indicate notable increases in dairy equipment costs since 2021, with significant jumps in certain areas. At the same time, the Federal Reserve’s data shows prime rates have more than doubled from their 2021 lows. Current dealer quotes and recent lender reports suggest financing rates that would’ve been unthinkable just a few years ago.

Now, rebuilding or limping equipment along often beats financing new gear for many smaller farms. It’s not ideal, but when you’re looking at those payment schedules… well, you make do. I’ve seen some creative solutions out there—neighbors sharing equipment more often than they used to, people becoming really skilled at creating YouTube repair videos, and even some groups buying used equipment together to spread the risk.

Cooperative Fees: The Bite Gets Bigger

Several large cooperatives implemented capital retains or assessments between roughly $1 and $3 per hundredweight in 2024-2025, according to producer notices and regional reports. These weren’t a monthly concern five years ago. Now, they can turn a breakeven month into a loss, and there’s not much individual producers can do about it.

What’s interesting here is the timing—these assessments are coming when producers are least able to absorb them. But from the co-op perspective, they need to modernize facilities to stay competitive with private processors. It’s a tough situation all around.

Component Pricing: The Traditional Math is Failing

Butterfat jumped from 47% to 58% of milk value while volume plummeted to just 7% – rewarding quality over quantity producers

Component pricing under Federal Orders pays for pounds of butterfat, protein, and other solids, not just milk volume. Butterfat value especially has jumped. According to the USDA’s October 2025 component price announcement, butterfat reached $3.21 per pound, representing nearly 60% of the total Class III value, up from around 47% just five years ago.

But here’s the tricky part that extension specialists keep explaining at meetings: because of the pricing formulas, higher butterfat prices often correspond with lower protein values. It’s not a simple win. As dairy economists note, high-component milk takes years of genetic and nutritional investment—and the price swings for one component can erode gains in another.

Jersey herds typically test higher for butterfat and protein than Holsteins, which helps in this pricing environment. But transitioning your genetics? That’s expensive and takes time. The folks doing well with components started that journey years ago. A producer in Georgia recently told me he wishes he’d started crossbreeding five years earlier—now he’s playing catch-up while margins are tight.

Processors’ Confidence vs. Producers’ Reality

It seems almost every month brings news of new or expanded processing plants. The International Dairy Foods Association has documented over $11 billion in announced capacity investments since January 2023.

Why so much expansion when farms are hurting? Industry experts at Cornell and other universities explain that modern cheese plants need 2.5 to 3.5 million pounds of milk per day to run efficiently. Mega-dairies can supply that volume directly, and processors prefer dealing with fewer, larger suppliers for consistency and logistics.

So capital keeps flowing into processing, but on the farm side, it’s a different world—shrinking margins, steeper costs, and big questions about who gets to supply milk to these facilities in five years. The discussions surrounding the upcoming Farm Bill negotiations suggest that these structural issues are finally getting attention, but meaningful change takes time.

When Safety Nets Don’t Catch You

DMC margins stay safely above $9.50 trigger while actual farm margins hover near breakeven – exposing the formula’s blind spots

Dairy Margin Coverage insurance was designed as a lifeline. However, with feed now accounting for a smaller share of costs, labor, energy, and fees are climbing, making it frequently miss the mark.

DMC margins remained above the $9.50 trigger throughout much of late 2025, according to Farm Service Agency data, while many farms reported cash flow strain. Key expenses, such as labor, energy, and new co-op assessments, are not included in the formula. It’s like having insurance that covers your roof but not your foundation—helpful, but not when the real problem’s underground.

What Producers Are Trying

California dairies capture $340 premiums per crossbred calf while adoption rates surge past 40% in progressive regions

Beef Genetics—A New Revenue Stream

Beef-on-dairy crosses remain a bright spot for many. USDA market reports from various auction centers show beef-cross calves bringing $800 to $1,000 premiums over straight Holstein bulls. Extension specialists at Wisconsin and other universities commonly recommend keeping it to 25-30% of breedings to avoid running short on replacements—especially with quality replacement heifers now approaching $3,000 each according to market reports.

I’ve noticed operations in the Mountain West have been particularly successful with this strategy, partnering with local beef producers who value the consistency of dairy-beef crosses for their feeding programs. One Colorado operation told me they’ve built relationships with three different feedlots, ensuring steady demand for their crosses.

Direct Marketing—Potential and Pitfalls

Direct-to-consumer sales are gaining traction in areas such as Vermont and other regions near population centers. But feasibility studies suggest startup costs can easily run into the hundreds of thousands. Margins can be impressive for those who make it work, but it’s no small risk, and many who try it find that selling isn’t their passion.

One thing that’s working for some smaller operations is collaboration—several farms working together on processing and marketing, sharing the investment and the workload. It doesn’t eliminate the challenges, but it spreads them around. I know of a group in Oregon—five farms, none with more than 200 cows—who invested in a bottling line together and now supply three school districts, as well as a handful of stores.

Technology—Promise and Payback

Peer-reviewed studies and land-grant extension trials report labor savings and modest production gains with robotic milking, depending on management and herd size. However, with robots costing well into six figures per unit, according to current dealer quotes, payback periods stretch out considerably. Michigan State’s dairy financial tools and similar extension models often show payback periods of 8-12 years under current margins.

The operations that make these technologies work tend to be larger, with better access to capital and sometimes special arrangements with processors that provide pricing stability, which most of us can’t access. However, I’ve also seen smaller operations make strategic tech investments work—focusing on one area, such as feed management or reproduction, rather than trying to automate everything at once.

The Realities of Scale

Mega-dairies (2000+ cows) generate $11.75/cwt margins while farms under 100 cows barely break even at $1.25/cwt

Here’s something we need to acknowledge, even if we don’t like it. The USDA’s Agricultural Resource Management Survey consistently shows multi-dollar-per-hundredweight cost advantages for herds with over 2,000 cows relative to those with fewer than 500. It’s not about who’s working harder—it’s economies of scale, volume discounts, and spreading overhead.

That doesn’t mean small and mid-sized farms can’t survive; some do through niche marketing, ultra-efficient operations, or creative partnerships. However, the economics become increasingly challenging each year, and agility and specialization are more crucial than ever.

Looking Forward

For many, 2025 feels like a tipping point. Agricultural economists at land-grant universities and the USDA anticipate further consolidation alongside rising total milk output in their long-term outlooks. Perhaps your best fit is ramping up efficiency, diving into specialty markets, partnering up, or, for some, exiting while retaining equity.

Mid-sized farms—say 300 to 1,000 cows—you’re in a particularly tough spot. Often too big for niche markets but not big enough for maximum efficiency. The path forward isn’t always clear. Some are exploring renewable energy opportunities, others are diversifying with agritourism, and yes, some are planning their exit.

Larger operations have their own unique challenges, including workforce management, environmental compliance, and community relations. Success increasingly requires professional management approaches that extend far beyond simply knowing how to produce milk.

Key Takeaways for Your Operation

  • Don’t trust old formulas: Lower feed costs alone won’t deliver profit—track all expenses, especially labor, equipment, and fees, using tools from your extension service or lender.
  • Diversify strategically: Explore genetics, marketing, and tech that fit your herd size and mindset—but go slow and seek input from others who’ve tried it before making major investments.
  • Stay proactive: Communicate regularly with your co-op, lender, and local extension agent to ensure a smooth process. Prepare business scenarios for best, worst, and base case situations, and plan changes deliberately, not reactively.

The Bottom Line

What we’re experiencing goes beyond feed and milk prices. The whole structure of dairy farming is shifting. That paradox—cheaper feed and tighter margins—is only one symptom of an industry in transition.

There’s no silver bullet. What works for a mega-dairy out West won’t always work on 300 acres in Wisconsin. What makes sense for 3,000 cows in Texas might be completely wrong for 150 cows in Vermont or a grazing operation in Missouri.

The key is understanding these dynamics, knowing the numbers for your own barn, and making changes that fit your future—not chasing the past. Because from everything the data shows and everything we’re experiencing… the old rules aren’t coming back.

But here’s what I’ve learned after all these conversations: dairy farming’s never been easy, but resilience runs deep in this community. We adapt, we help each other, and—whatever the industry throws at us—there’s always another way to move forward. It might look different than what we expected. It might mean some tough decisions. But we’re still here, still producing food, still figuring it out together.

And that’s worth something, even when the margins don’t show it.

KEY TAKEAWAYS

  • Track the real cost drivers: With feed now just 35-40% of total expenses (down from 50%), monitor labor costs (up ~30%), equipment financing (rates doubled since 2021), and co-op assessments ($1-3/cwt) using your extension service’s dairy enterprise analysis tools—these hidden costs are what’s actually driving your margins.
  • Diversify revenue strategically: Beef-on-dairy crosses are bringing $800-1,000 premiums per calf at auction, but keep it to 25-30% of breedings to maintain replacements—especially with quality heifers now approaching $3,000 each according to market reports.
  • Right-size technology investments: Michigan State’s financial models show 8-12 year payback periods for robots under current margins, so focus on targeted improvements (feed management or reproduction systems) that match your herd size and capital access rather than wholesale automation.
  • Collaborate for market access: Small operations in Oregon, Vermont, and other regions are successfully sharing processing facilities and marketing costs—five 200-cow farms together can achieve economies that none could manage alone, particularly for direct-to-consumer sales, capturing those premium margins.
  • Prepare for structural change: USDA data shows that operations with over 2,000 cows achieve multi-dollar per hundredweight cost advantages. Therefore, mid-sized farms (300-1,000 cows) need clear strategies—whether that involves efficiency improvements, niche market development, strategic partnerships, or planned transitions while maintaining strong equity.

Complete references and supporting documentation are available upon request by contacting the editorial team at editor@thebullvine.com.

Learn More:

Join the Revolution!

Join over 30,000 successful dairy professionals who rely on Bullvine Weekly for their competitive edge. Delivered directly to your inbox each week, our exclusive industry insights help you make smarter decisions while saving precious hours every week. Never miss critical updates on milk production trends, breakthrough technologies, and profit-boosting strategies that top producers are already implementing. Subscribe now to transform your dairy operation’s efficiency and profitability—your future success is just one click away.

NewsSubscribe
First
Last
Consent
Send this to a friend