For years there has been great debate between dairy breeders and producers about what type of cow is the most profitable. There are sound arguments on both sides of this issue. However, developments arising from new indexes and analysis highlight that it’s not always the prettiest cow that milks the most over her lifetime. To paraphrase the popular song, these cows prove that “She ain’t pretty, she just milks that way!”
Are show cows great lifetime milk producers?
We are all guilty of it. We see the cows that win at World Dairy Expo, The Royal, Swiss Expo, and IDW and are amazed at their extreme size, capacity, and dairy strength. We look at them as the epitome of what the ideal cow looks like. And it’s fair to say that the production level of these animals has greatly improved over the past 30 years. However ask any commercial producer in a large free stall environment and they would tell you that these winners would not be the ideal cow for their operation or to maximize their revenues. The very characteristics that make them great in the showring (their massive size especially) would limit their efficiency for these producers. (Side note: With dropping sale prices show cows and especially high index cows are not bringing the same resale value as they once did – Read more: An Insider’s Guide to What Sells at the Big Dairy Cattle Auctions 2013).
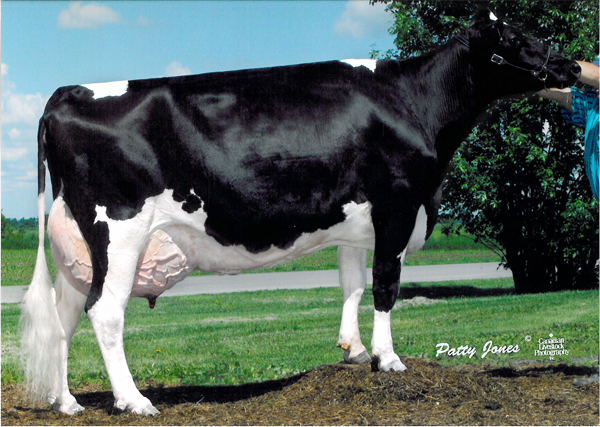
Now here at the Bullvine we like to deal in facts not hearsay. So we took the top 10 animals from the Mature Cow Class at the 2013 Royal and here is what we found. They average an amazing 95 points with a couple even going Excellent multiple times. The scarier part is that they only average 2.5 complete lactations each, out of a possible 4, and just over 50,000 kgs of lifetime production. With the winner of the class, having out of three lactations started only completed 2 by 7 years of age and produced under 48,000 lifetime. Now some would say, “Yes that is because all the big producers are in the Lifetime Production Class.” So we decided to take a look at that class as well. Surprisingly this class averaged a slightly lower 94 points, and just over 3.5 completed lactations each, out of a possible 5, and 61,647 kgs. of lifetime production. Not exactly extreme for a class that is supposed to be the epitome of the breed. However there was one strong exception in the class, STARBRITE LYSTER LYNDSAY, who at EX-96-3E, with 5 completed lactations and 84,282 kgs (185,808 lbs.) of lifetime production, certainly is a testament to longevity. That is probably why she is a perennial contender and a huge fan favorite.
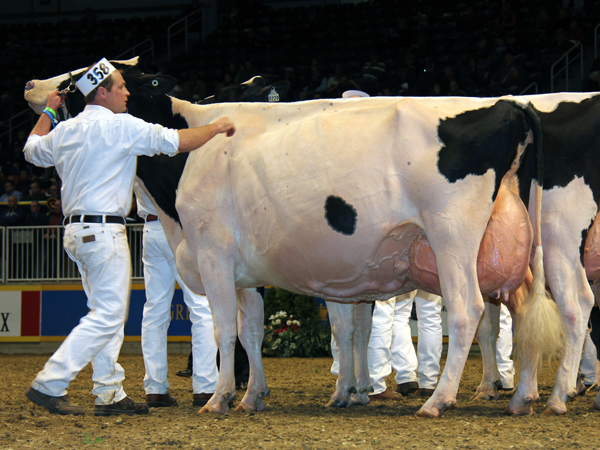
STARBRITE LYSTER LYNDSAY EX-96-3E-CAN
84,282 kgs (185,808 lbs.) of lifetime production,
Are high scoring 2 year olds good lifetime producers?
Then of course there is type classification and the true type model. Believing in full disclosure, we here at the Bullvine are big fans of the type classification system (Probably because my father ran the Canadian Type Classification and Breed Improvement Program, for 18 years in the 70’s and 80’s) and have written many articles about it (Read more: TOM BYERS: “THAT’S CLASSIFIED!” and Is Type Classification Still Important?). But more and more we are beginning to question some of the long standing beliefs that we have had relating to type classification and longevity.
There is no doubt that the goal of the type classification system is to produce a long lasting profitable cow. What is becoming more apparent is that what we believed it took to achieve that may not have been functionally correct.
Now it would not be fair to make a blanket statement like that, nor would it be Bullvine style, if we did not back that up with cold hard numbers and examples. I cannot think of a better example than, GILLETTE E SMURF, the world record holder for lifetime production at 242,303 kgs (534,181 lbs) in 11 lactations. (Read more: World Records Are Not Only Set at the Olympics). As a two-year-old Smurf scored GP-83, with Dairy Strength (82) and Feet & Legs (80). These two the traits kept her from going VG. What makes this surprising is those are the two exact traits that many believe are the greatest indicators of longevity. Yet the greatest producing cow in the world was deemed to be lacking in those areas. In fact it was not until 10th lactation and over 216,893 kgs of lifetime production that the classifier deemed that Smurf had enough strength (97) and sound enough legs (86) to make her an excellent cow.
GILLETTE E SMURF EX-91-2E-CAN 242303kgs (534181 lbs) of lifetime production
Now as we always say it is easy to find case by case examples. But do the numbers hold up across multiple animals and larger groups? We decided to look at all the VG-89-2yr olds from January 1st 2007 to December 31st 2010. In that time there were 20 VG-89 1st lactation cows that have remained in Canada. 60% of them have gone on to classify Excellent, with the group now averaging 91 points. The alarming part is that, as a group, they have completed on average 2 lactations each out of a possible 4, with lifetime production averaging 42,262 kgs. In fact only 30% of them have even completed a 3rd lactation. That percentage is even less than that of the mature cow class at this year’s Royal. Achieving VG89 first lactation certainly is not a good predictor of lifetime production. In analyzing the US numbers we found similar results.
So what is a good predictor of lifetime production?
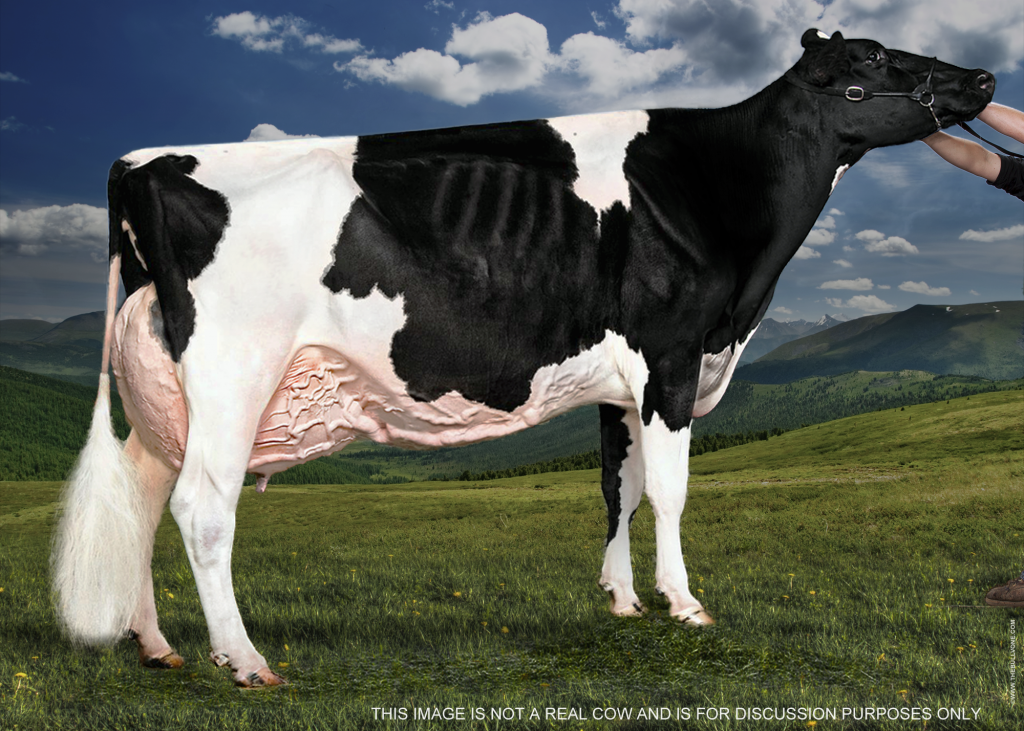
We all have in our mind what the ideal mature cow looks like. For many pedigree breeders it’s a cow that looks like this. (Read more: The Perfect Holstein Cow)
In taking that one step further, we also did a composite of what the perfect classification 2 year old would look like.
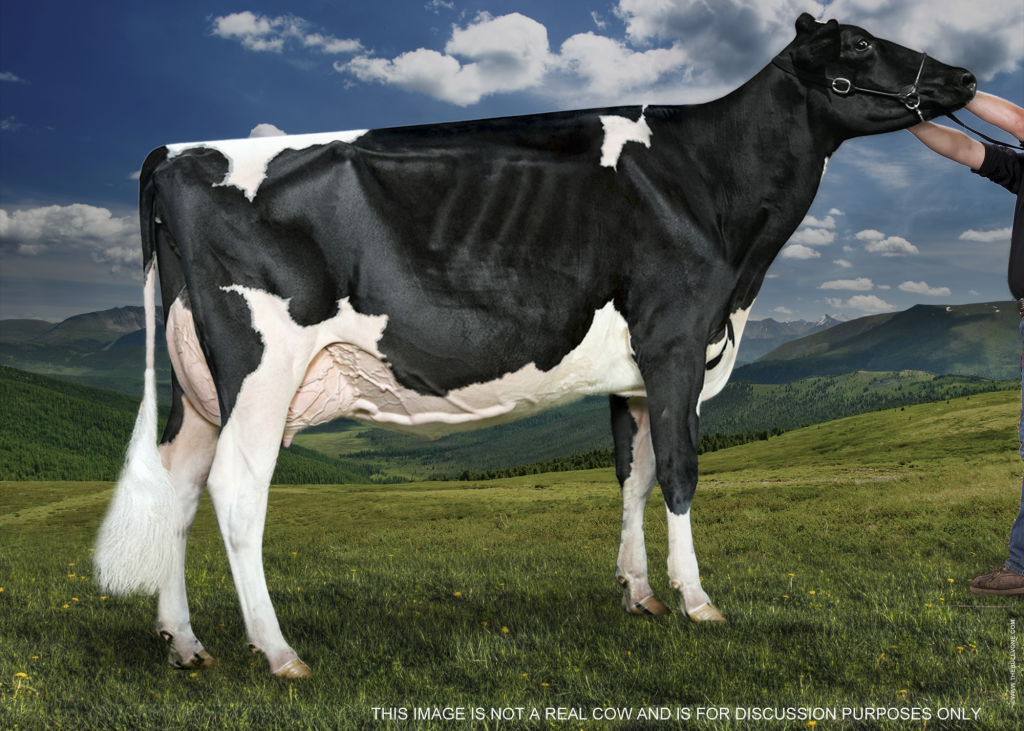
But in reality, as we have mentioned earlier in this article, these cows are not the epitome of lifetime production animals. In fact they are not even bull mothers. Currently the typical ideal high genomic 2 year old/bull mother looks like this.
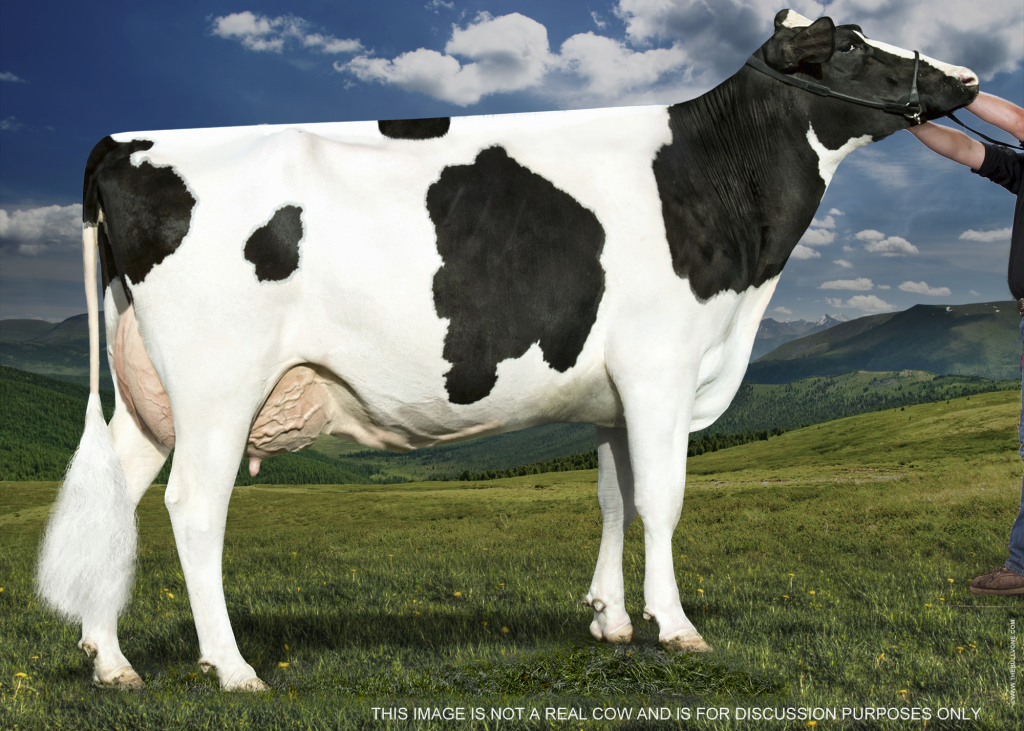
But in analyzing the numbers, especially productive life and herd life, the true ideal 2 year old should look something like this.
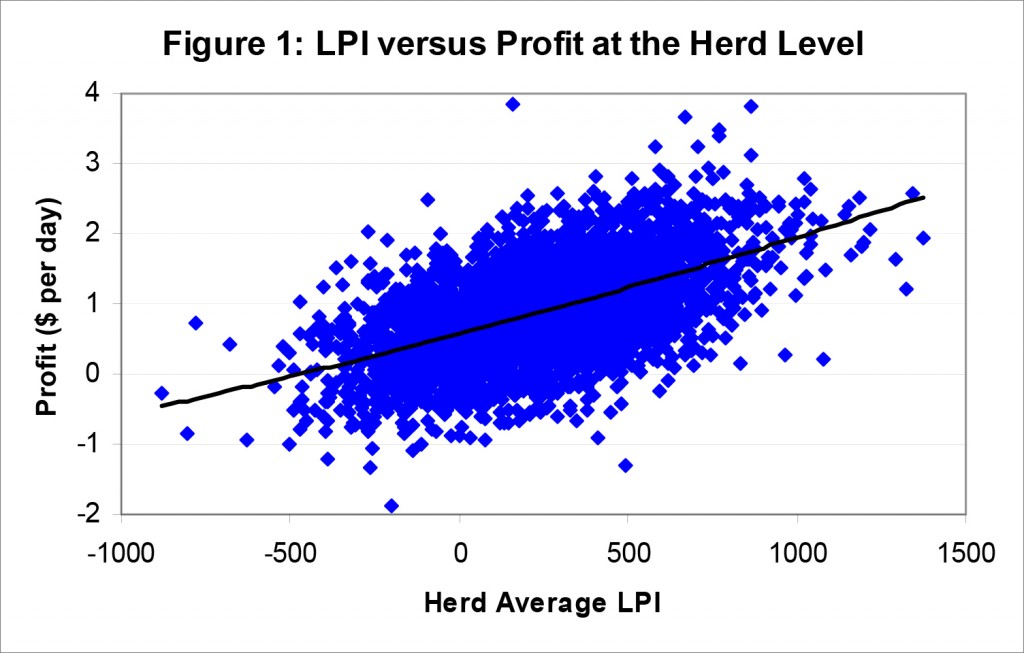
First, let’s make one thing clear. Unlike indexes like TPITM and LPI that try to predict lifetime production based on hypothesis and our understanding of what we think it takes to make a long lived productive cow, productive life (USA), and herd life (CAN) measure actual longevity. They measure how many months the cow actually is a productive member of the herd compared to herd mates.
This means that our long-accepted theories that a cow needed to have a wide muzzle, deep chest, and deep sweeping open rib in order to be a high lifetime producer are actually incorrect. As we pointed out in Breeding for Longevity: Don’t believe the hype – It’s more than just high type, the top 25 productive life proven sires in the Dec’13 genetic evaluations actually average only 0.52 for Dairy Character and 0.47 for Body Composite.
This actually makes sense. When you look at the top two reasons given for non-dairy purposes sales, infertility and mastitis, they account for almost double (26.9%) the number of animals culled for production or conformation reasons (18.5%). Basically we learn that, when it comes to predicting longevity, there are many contributing beyond conformation.
That is why it’s not surprising when we interviewed Don Bennink of North Florida Holsteins, a very commercial production oriented breeding program, type and conformation where not even on his list of selection requirements. (Read more: NORTH FLORIDA HOLSTEINS. Aggressive, Progressive and Profitable!!). In fact if you really want to break down the numbers into the nuts and bolts simplicity, you would only look at two things. In the US that would be pounds of milk production (with some allowance for %F) and productive life. In Canada that would be kilograms of milk production and herd life.
So here at the Bullvine we like to complete the steps for you. We looked at all the proven sires who are over 1250 lbs of milk and 5 for productive life. The results were very telling. There were 40 sires that made this list, with the top 6 reading like a who’s who of top selling sires, Bookem, Freddie, Robust, AltaMeteor, Shamrock, and Observer. Also it is interesting to note that these sires average 2.77 SCS, 6 CE, 1.33 PTAT, 1.23 UDC, 1.23 FL&C and 2026 TPI.
| Name | Final Score | Owner |
| COOKIECUTTER MOM HALO-ET | 88 | Cookiecutter Holsteins |
| MSWELCOME OBSERVER LAURI-ET | 88 | Welcome Stock Farm, LLC & Charles Van Wie |
| ROSE-LYN MARCONI CONFETTI | 88 | Wallace A. Behnke |
| HY-NIC-HOL TRYOUT STAR | 88 | Ryan L. Lindenmeyer |
| FISCHERDALE CASABLANCA | 88 | Elizabeth Sarbacker |
| WILLOWS-EDGE GOLD IMAGE-ET | 88 | Hendrik W. Van Dyk |
| WILLOWS-EDGE CARISMA LYRIC | 88 | Jordan & Claire Van Dyk |
| ERBACRES AD LACROSSE-RED | 88 | Carla Kay Erbsen |
| GLORYLAND DELLA RAE-ET | 88 | David A Tait & Hood Holsteins |
| WILLOWS-EDGE DURHAM ISLE-ET | 88 | Hendrik W. Van Dyk |
| WILLOWS-EDGE MAC FROSTING | 88 | Hendrik W. Van Dyk |
| WILLOWS-EDGE SANCHEZ MAGGIE | 88 | Jordan A. Van Dyk |
| RICECREST AFTERSHOCK AMELIA | 88 | Dale E. & Fred E. Rice |
| POTTSDALE SANCHEZ RHEYA | 88 | Hayley Lynn Potts |
| OPSAL DENTON BEAUTIFUL | 88 | Joshua T & Joseph T Opsal |
| MARKWELL ATWOOD FANTASIA | 88 | Kody J. & Kyle R. Tiemersma |
| MOR-YET GOLDWYN FAITHFUL-ET | 88 | Todd Galton |
| QUIETCOVE-W FUTURITY-ET | 88 | Quietcove-Wapa Farms LLC |
| CLEAR-ECHO SUPER 2140-ET | 88 | Clear Echo Farm LLC |
| CLAQUATO SANCHEZ ROSALIE-ET | 88 | Claquato Farms, Inc. |
| HARVUE ATWOOD FOX-ET | 88 | David Meade Hardesty, Jr. |
| GOLDEN-OAKS CHARDONNAY-ET | 88 | Brianna Sheehan |
| GOLDEN-OAKS GWYN CLASSY-ET | 88 | Kings-Ransom Farm LLC |
| HOLBRIC DESTRY ANALIESE | 88 | Morgan Olbrich |
| WINDY-KNOLL-VIEW POCONOS-ET | 88 | James R. & Nina P. Burdette |
| WINDY-KNOLL-VIEW PERFECT-ET | 88 | James R. & Nina P. Burdette |
| VANDYK-S BALTIMOR ROCKLYN | 88 | VanDyk-S Holsteins |
| COOKIECUTTER BOWS HOMONY-ET | 87 | Clear Echo Farm LLC |
| MS JENNYLOU SHTL LIDEBBI-ET | 87 | Mystic Valley Dairy LLC |
| OAKFIELD-BRO AT FANATSY-ET | 87 | Denise V. Saxton |
| OAKFIELD-BRO AT FINANCE-ET | 87 | Adam J King |
| OAKFIELD SANCHEZ DAZZLE-ET | 87 | Jonathan Lamb |
| COOKIECUTTER MM HALLMARK-ET | 87 | John J. Dickinson |
| WELCOME DOMAIN FANTASIA-ET | 87 | Welcome Stock Farm, LLC |
| WELCOME ELITE PEONY-ET | 87 | Welcome Stock Farm, LLC |
| MS WELCOME MANOMAN CASE | 87 | Welcome Stock Farm, LLC |
| WELCOME BRONCO PERNELLE-ET | 87 | Welcome Stock Farm, LLC |
| SAVAGE-LEIGH MAZEY-RED-ET | 87 | James R. & Nina P. Burdette |
| BELLTONE GOLD STAR LEE IV-ET | 87 | Kevin Doeberiener,PierreBoulet & Michael Heath |
| ERBACRES ADVENT MUFFIN | 87 | Nathan C P Erbsen |
| SUPER-K FORTUNE BONITA | 87 | Valerie L. Greco & Ronald J. Mikulice |
| VANDYK-K PRINCESS-RED-ET | 87 | Van Dyk-K Holsteins |
| WILLOWS-EDGE DUR VALEEN-ET | 87 | Hendrik W. Van Dyk |
| GEORGETOWN SAN LIMELIGHT | 87 | Chris & Stephanie George |
| MIL-R-MOR FANCY FABULOUS-ET | 87 | Sarah Elizabeth Sheehan |
| JANNEY CIMARON HAZYL | 87 | James & LaVaun Janney |
| SILDAHL AWESOME-RED | 87 | Fred Schoenbachler |
| SWAINDALE RDLINR CHARRO-RED | 87 | Gary R. Swain |
| SWAINDALE RDLINR GODIVA-RED | 87 | Gary R. Swain |
| LAKE-EFFECT DUR WREN-ET | 87 | Jeffrey & Gayle Benedict |
| ROSE-EDGE B PASTA-ET | 87 | Ernest H Jr & Carol W Ambler |
| SCHA-TJ CNTNDR SHAWNA-RED | 87 | Todd & Jean Pollema |
| KENWAN AMBROSIA JADA | 87 | Ken-Wan Farm |
| MS JOLEANNA ABSOL APPLE-RED | 87 | Cooper Galton |
| WILLOWS-EDGE GOLD INFORM-ET | 87 | Hendrik W. Van Dyk |
| WILLOWS-EDGE R LOU MYRA-RED | 87 | Claire M. Van Dyk |
| ROCK-N-HILL-II CRANBERRY | 87 | Michael & Chris McCullough |
| GLORYLAND-LR LADA RAE-RED | 87 | David A. Tait |
| GUNDYS AFTERSHOCK ACE-ET | 87 | Robert Gunderson |
| MS L-MAPLES-BO SG DURHAM 46 | 87 | Jenna M Langer |
| VANDYK-K GRAYBIL PASTEL | 87 | Van Dyk-K Holsteins |
| KIKO GABOR RAPTURE 685 | 87 | R & P Kiko Family Farms, Ltd |
| QUIET-MAN ALEX LOVELY-ET | 87 | Buttke Dairy Enterprises |
| QUIET-MAN ALEX LUSCIOUS-ET | 87 | Jeff Spence |
| DEMMERS SANCHEZ GAYLA | 87 | Demmer Farms |
| KLINGENDALE HVEZDA POKER | 87 | John Klingensmith |
| KIKO DAMION VINA 663 | 87 | R & P Kiko Family Farms, Ltd |
| LIDA-ACRES MARC ATLEE | 87 | Maria D. Johnson |
| SILENT-STAR ALXDER A-JUDY | 87 | Lance Slotten |
| PARADISE-R AFS GRACE 4594 | 87 | Paradise Valley Farms, Inc. |
| OPSAL DESTRY MARCELLA-RED | 87 | Joshua, Joseph & Felicia Opsal |
| SRP ABSOLUTE FURY-RED-ET | 87 | Melarry Farms |
| SRP DESTRY FROLIC-RED-ET | 87 | John P. & Rachael Holmgren |
| MS BLONDIN JASPER BELLE-ET | 87 | Brad Stockman & Adam G Johnson |
| MARKWELL AFTERSHOCK STAR | 87 | Kody J. & Kyle R. Tiemersma |
| KELLERCREST SANCHEZ SHELLY | 87 | Kimberly Keller |
| NOBLAND ALFREDO ATLAS | 87 | Troy Noble |
| LORAWAE SANCHEZ HEATHER | 87 | John S. Lora |
| KINYON GOLDWYN PASTA | 87 | Martin Kinyon |
| WEST-LAKE SS WENDY-RED | 87 | West-Lake Holsteins |
| WEST-LAKE ADVENT RILEY-RED | 87 | West-Lake Holsteins |
| HARVUE HERSHEY MINT | 87 | John O. Hardesty & Sons |
| HARVUE BLITZ GLITZ | 87 | John O. Hardesty & Sons |
| HARVUE GOLDWYN FOXY LADY-ET | 87 | Matthew C. Hardesty |
| HARVUE ATWOOD VIDA | 87 | David M. & Debra L. Hardesty |
| MILKSOURCE ADVENT ESTHER-ET | 87 | Eva Doornink |
| JHAHNWAY DUSK PEGGYS TRINA | 87 | Justin E. Hahn |
| MELARRY SANCHEZ FONDA-ET | 87 | Melarry Farms |
| HOLBRIC MINISTER FRANNY | 87 | Brian & Mark Olbrich |
| HOSTO SS HILLROBIN | 87 | Kelley L. & Ruth Ann Hosto |
| WHITELEATHER ALEXAND 1693 | 87 | Lauren G. Whiteleather |
| VANDYK-S BRAXTON ELISHA | 87 | VanDyk-S Holsteins |
| VANDYK-S CHELIOS MALEAH | 87 | VanDyk-S Holsteins |
| ROCKING-P SANCHEZ ELLEN-ET | 87 | Kelsey Patten |
| HOLMGREN TRIUMPHANT DI-ET | 87 | John P. & Rachael Holmgren |
| MS MILKSOURCE GOLDWYN FANCY | 87 | Jordan & Claire Van Dyk |
| MS ANGELINA ANGASHOCK-ET | 87 | Claquato Farms Inc. & Robin-Hood Holsteins |
| SIEMERS SANCHEZ HAPPYGAL-ET | 87 | Spencer Michael Weimer |
| SIEMERS ATW HILDALICIOUS-ET | 87 | Joshua T & Joseph T Opsal |
| SCH-GER ATWOOD ELYSE | 87 | Brett Morlock & Ken Gerber |
Now for those of you who are wanting to push the genomic envelope, we did the same analysis, though factoring in the typical genomic over prediction of about 20% (Read more: How Much Can You Trust Genomic Young Sires?). Our requirements were 1,500 lbs of milk and 7.2 for productive life.
| Name | Class | Score | Sire Name | Owner(s) | PROV |
| BERGEROY GOLDWYN LANIK | VG | 87 | BRAEDALE GOLDWYN | BERGEROY HOLSTEIN INC | PQ |
| BUNCLODY ALFREDO DANNI | VG | 87 | LESPERRON ALFREDO | FRED FORNWALD & SONS FARMS LTD | SK |
| BUTZ-BUTLER SAN BETTY-ET | VG | 87 | GEN-MARK STMATIC SANCHEZ | FERME LAITIERE RAYON D'OR INC | PQ |
| CLOVIS JASPER RAZIA | VG | 87 | WILCOXVIEW JASPER-ET | CLOVIS HOLSTEIN INC | PQ |
| COMESTAR JASPER ALANYS | VG | 87 | WILCOXVIEW JASPER-ET | COMESTAR HOLSTEIN | PQ |
| COMESTAR LAUTELLIAM SANCHEZ | VG | 87 | GEN-MARK STMATIC SANCHEZ | COMESTAR HOLSTEIN | PQ |
| COMESTAR MILANA JASPER | VG | 87 | WILCOXVIEW JASPER-ET | COMESTAR HOLSTEIN | PQ |
| COMESTAR PIMPANTE GOLDWYN | VG | 87 | BRAEDALE GOLDWYN | COMESTAR HOLSTEIN | PQ |
| CRAIGCREST LAURIN ECSTATIC | VG | 87 | DEN-K MARSHALL LL LAURIN | CRAIGCREST HOLSTEINS | ON |
| CYJOHN LOYAL C9369 | VG | 87 | BRYHILL LOYAL | FERME KAMLAKE | PQ |
| DELABERGE OMAN DOLLMISS | VG | 87 | LONG-LANGS OMAN OMAN-ET | FERME BERGELAIT INC | PQ |
| DULET ARMSTEAD KIM 3 | VG | 87 | DIAMOND-OAK ARMSTEAD-ET | FERME DULET INC | PQ |
| FAMIPAGE SHAQUILLE IDELUSTRE | VG | 87 | DESLACS SHAQUILLE | FERME FAMIPAGE INC | PQ |
| FLEURY GEN SANCHEZ LIZIE | VG | 87 | GEN-MARK STMATIC SANCHEZ | LOOKOUT HOLSTEINS | PQ |
| GREGORI MAN O MAN SORISIA | VG | 87 | LONG-LANGS OMAN OMAN-ET | FERME U. GREGOIRE & FILS INC | PQ |
| HARDY GOLD DIAMOND | VG | 87 | BRAEDALE GOLDWYN | DONALD DUBOIS | PQ |
| HOLYWELL ATWOOD POCKET | VG | 87 | MAPLE-DOWNS-I G W ATWOOD | HOLYWELL HOLSTEINS | ON |
| HOLZER MIRANDA AFTSHOCK | VG | 87 | MS ATLEES SHT AFTERSHOCK-ET | BUSHY VIEW | ON |
| HOLZER MYSTRI SHOCK | VG | 87 | MS ATLEES SHT AFTERSHOCK-ET | BUSHY VIEW | ON |
| JEANLU ALEXANDER SMOOTHIES | VG | 87 | GOLDEN-OAKS ST ALEXANDER-ET | FERME TELEFILS ENR | PQ |
| LAFONTAINE ATWOOD METALLICA | VG | 87 | MAPLE-DOWNS-I G W ATWOOD | FERME LAFONTAINE | PQ |
| LAFONTAINE MISCHIEF CHOICE | VG | 87 | LUNCREST MISCHIEF SHOT 2-ET | FERME LAFONTAINE | PQ |
| LAMPADA SHOCKWAVE EVETTE | VG | 87 | LAMPADA LHEROS SHOCKWAVE | FRED FORNWALD & SONS FARMS LTD | SK |
| LEGACY JASPER GABE | VG | 87 | WILCOXVIEW JASPER-ET | STEPHEN DOLSON & DR. KAREN GALBRAITH | ON |
| MAYBLOSSOM SHOTTLE DEVARY 812 | VG | 87 | PICSTON SHOTTLE-ET | MAYBLOSSOM FARMS | ON |
| MILIBRO ATLAS PRISSY | VG | 87 | MD-DELIGHT DURHAM ATLAS-ET | FERME MILIBRO INC | PQ |
| MILIBRO ATWOOD MIGNONNE | VG | 87 | MAPLE-DOWNS-I G W ATWOOD | FERME MILIBRO INC | PQ |
| NEUDAY SANCHEZ PRISCILLA | VG | 87 | GEN-MARK STMATIC SANCHEZ | BENBIE HOLSTEINS LTD | SK |
| PDF SANCHEZ SUMMER | VG | 87 | GEN-MARK STMATIC SANCHEZ | PRAIRIE DIAMOND FARM | SK |
| RAYON D'OR SHOTTLE OPRUNELLE | VG | 87 | PICSTON SHOTTLE-ET | FERME LAITIERE RAYON D'OR INC | PQ |
| ROTALY GOLDWYN OMBRELLA | VG | 87 | BRAEDALE GOLDWYN | ROCK HEBERT & NATHALIE DUMAIS | PQ |
| ROTALY MILLION MACADAM | VG | 87 | ENGLAND-AMMON MILLION-ET | ROCK HEBERT & NATHALIE DUMAIS | PQ |
| SELEXIE MATRICIE DUPLEX | VG | 87 | MESLAND DUPLEX-ET | MICHEL LARRIVEE | PQ |
| SMITHDEN GOLDWYN BREEZY | VG | 87 | BRAEDALE GOLDWYN | CORMDALE GENETICS INC | ON |
| SMITHDEN GOLDWYN BUBBLES | VG | 87 | BRAEDALE GOLDWYN | SMITHDEN HOLSTEINS INC | ON |
| SMYGWATYS SANCHEZ EMMA | VG | 87 | GEN-MARK STMATIC SANCHEZ | CLARKVALLEY HOLSTEINS | ON |
| STONYWAY AFTERSHOCK NAHANA | VG | 87 | MS ATLEES SHT AFTERSHOCK-ET | PIERRE BOULET | PQ |
| SWISSKESS SHOTTLE RUBYN | VG | 87 | PICSTON SHOTTLE-ET | SWISSKESS INC | PQ |
| VERTDOR SHOTTLE MAYA | VG | 87 | PICSTON SHOTTLE-ET | FERME VERT D'OR INC | PQ |
The Bullvine Bottom Line
Any way you look at it, it’s hard to argue with the cold hard facts. For years the show ring and type classification have tried to do the best job possible in predicting what it take to produce a long lived productive cow. But just like the evolution of the computer, healthcare and science, as more information becomes available, we find that some of our previous beliefs are no longer accurate. In no way am I saying that there is not value in programs like type classification, it is just time for those programs to evolve and do a more accurate job of predicting longevity. (Read more: What is the role of dairy cattle breed associations?) As the numbers show, today’s longed lived productive cow, may not look that pretty, but she sure milks that way.
Want to learn more about his? Andrew Hunt will be presenting at Canadian Dairy Expo on February 5th.

Other posts you might like:


![figure1[1]](https://www.thebullvine.com/wp-content/uploads/2014/12/figure11-600x279.jpg)
![table1[1]](https://www.thebullvine.com/wp-content/uploads/2014/12/table11-600x303.jpg)


![table1[1]](https://www.thebullvine.com/wp-content/uploads/2014/10/table11-600x302.jpg)
![Table2[1]](https://www.thebullvine.com/wp-content/uploads/2014/10/Table21-600x461.jpg)
![Figure1GenomicsInbreeding[1]](https://www.thebullvine.com/wp-content/uploads/2014/10/Figure1GenomicsInbreeding1-600x348.jpg)
![inbreedingincdnhols[1]](https://www.thebullvine.com/wp-content/uploads/2014/08/inbreedingincdnhols1.jpg)
![inbreeding-in-cdn-dairy[1]](https://www.thebullvine.com/wp-content/uploads/2014/08/inbreeding-in-cdn-dairy1.jpg)
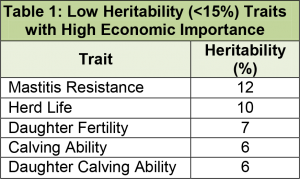 Simply put, heritability is the amount of total variation for a trait in a population that can be attributed to genetics. For example, the heritability of protein yield is high at 40%. Imagine two cows in two different herds that each have a different protein yield. Around 40% of the difference in their protein yields can be explained by genetics and the other 60% of the difference is due to herd management and environment. Protein yield is a win-win trait – it is of high economic importance and also has a moderately high heritability.
 The 2014 Interbull Meeting took place in the Estrel Hotel and Conference Center in Berlin, Germany, from May 19-21, as part of the 2014 ICAR/Interbull Conference. The Interbull Technical Committee (ITC) met earlier on Sunday, May 18, in an effort to properly cover the variety of issues on the agenda. On Monday, May 19, it was time for the Steering Committee to have its first encounter. On the following day the Interbull community gathered for the first Business Meeting, for the Interbull Open sessions on “Genetic evaluation methods” and “National and international genetic evaluations” and finally for the ICAR/Interbull joint technical session on “Parentage verification and parentage discovery. On the last day, two additional Open sessions, “National and international genomic evaluations” and “Breeding objectives and novel traits”, were followed by the second Business meeting and the second Steering Committee meeting, respectively. The Interbull meeting had 196 attendants from 39 countries and 32 scientific reports were presented in the Open sessions in addition to the four invited papers in the ICAR/Interbull joint session on parentage verification/discovery.
 The Council on Dairy Cattle Breeding (CDCB) has hired João Walter Dürr of Uppsala, Sweden, as its chief executive officer. Dürr, who will be relocating to the Beltsville, Md. area, brings a wealth of managerial experience in milk recording, database development and genetic evaluation to CDCB. Since 2008, he has served as the Interbull Centre executive director.
 2014 marks five years of genomic evaluations in Canada, and has the world of genetic improvement ever changed!

![cdnartical1[1]](https://www.thebullvine.com/wp-content/uploads/2014/04/cdnartical11.jpg)
![cdnarticle2[1]](https://www.thebullvine.com/wp-content/uploads/2014/04/cdnarticle21.jpg)

 The Interbull Centre provides genetic information services and applied research for improvement of livestock to a worldwide network and fulfills a mandate as a European Union Reference Laboratory (EURL).
 The Interbull Steering Committee (SC) held a web-phone conference on February 4, 2014, and this is the summary of the decisions.