Archive for strategic dairy planning

Your Dairy’s 24-Month Countdown: Act Now or Lose $450,000 in Family Wealth

Every Monday you delay, you pay $17,500. Every month: $75,000. Your dairy’s 24-month survival plan starts with three decisions.

Executive Summary: Your dairy has 24 months of equity left, and the decision you make this month will determine whether you preserve $700,000 or exit with $250,000. This crisis differs from all others—China’s self-sufficiency, $11 billion in U.S. processing overcapacity, and the worst heifer shortage since 1978 have created a structural transformation that milk price recovery won’t solve. The math is clear: farms that act now can cut monthly losses from $25,000 to $8,000 through targeted culling, feed optimization, and strategic repositioning, while those waiting 6 months lose $450,000 in family wealth. Success requires three time-bound decisions: immediate liquidity management (30 days), strategic recovery positioning (90 days), and viability determination (180 days). The projected loss of 5,000 U.S. dairy farms by 2028 won’t be random—it will precisely separate those who recognized time as their scarcest resource from those who waited for markets to save them.

dairy survival strategy

I recently spoke with a producer in central Wisconsin who summed up the current situation perfectly: “Everyone’s watching milk prices, but what’s actually keeping me up at night is whether I have the equity to make it to when prices recover.” You know, with CME Class III futures hovering around /cwt for Q1 2026 and feed costs finally moderating with corn near .24/bu according to USDA’s latest reports, you might think we’d all be breathing easier. But conversations across the dairy belt—from Pennsylvania tie-stalls to Texas freestalls—they’re revealing something different.

Here’s what I’ve found after running through financial scenarios with extension folks and reviewing real farm numbers: a representative 500-cow dairy with 0,000 in equity has about 24 months of runway at current burn rates. And the thing that really caught my attention? The difference between taking action now versus waiting six months could preserve roughly $450,000 in family wealth. That’s not speculation—it’s what the math consistently shows when you model different timing scenarios.

The $450,000 Decision Window: Every month you delay action costs roughly $75,000 in family wealth. This isn’t speculation—it’s what the math shows when you model a representative 500-cow dairy burning $25,000 monthly versus taking immediate action to cut losses to $8,000

Understanding the Convergence of Market Forces

Having tracked these cycles since the late ’90s, this downturn feels different. It’s not just one thing we can monitor and respond to—we’re seeing multiple structural shifts happening all at once.

The Perfect Storm Hitting U.S. Dairy Right Now: China’s near-total self-sufficiency killed the global growth story, $11 billion in new U.S. processing capacity needs milk nobody’s producing, and we’re facing the worst heifer shortage in 47 years. This isn’t a cycle you can wait out—it’s three permanent structural shifts happening simultaneously

Take China. Rabobank’s recent dairy quarterly indicates they’ve reached about 85% milk self-sufficiency, up from 70% five years ago. We’re talking about a fundamental policy shift toward food security, not a temporary market adjustment. When StoneX analysts discuss how that Chinese import growth story—the one that fueled global expansion for over a decade—is essentially done, they’re describing a permanent change in how global dairy works.

Meanwhile, and the timing couldn’t be worse, the U.S. processing sector has committed somewhere between $8 and $ 11 billion in new capacity, according to what IDFA’s been tracking. Projects across nearly 20 states, from new cheese plants in Texas to expanded drying capacity up in the Upper Midwest. These facilities will need roughly 7-8 billion pounds of additional milk annually when fully operational by mid-2026.

But here’s what really concerns me: the availability of replacement heifers. USDA’s latest cattle inventory shows we’re at 4.38 million head—the lowest since 1978. The National Association of Animal Breeders reports beef semen sales to dairy farms hit 7.9 million units in 2024, up 58% from 2020. Conventional dairy semen? Down to 6.7 million units. These aren’t just statistics… they represent breeding decisions that’ll constrain expansion capacity for the next 24-36 months.

You know what’s interesting about this cycle? The moderate feed costs—corn at $4.24/bu and alfalfa at $222/ton—are actually extending the adjustment period. Back in 2009, when corn hit $6-7/bu, we saw rapid culling and supply correction. Today’s manageable feed costs let farms sustain negative margins longer. Sounds beneficial, right? Until you consider that it delays the market from rebalancing.

The Economics of Scale: A Widening Divide

MetricLarge Farms (2,500+ cows)Family Farms (500 cows)The Gap
Production Cost per cwt$15.50 – $17.50$19.00 – $21.00$3.50/cwt
Labor Productivity300 cows/worker60 cows/worker240 cows/worker
Labor Cost ImpactBaseline+$1.50 – $2.00/cwt$1.75/cwt
Feed Procurement Advantage15-25% volume discountTruckload pricing$0.50/cwt
Capital Cost per Cow$4,800 – $6,000$7,000 – $9,000$2,500/cow
Transportation Cost$0.35/cwt (concentrated regions)Up to $0.53/cwt$0.18/cwt
Total Structural DisadvantageBaseline+$3.50/cwt$3.50/cwt

The structural cost advantages larger dairies have reached levels that fundamentally change competitive dynamics. Research from Cornell’s ag economics folks and similar extension programs consistently shows that farms with 2,500+ cows achieve production costs of $15.50-17.50/cwt. Meanwhile, 500-cow dairies face costs of $19-21/cwt based on Penn State Extension benchmarking.

And this isn’t about management quality or work ethic—we all work hard. It’s a mathematical reality. Labor productivity data from Michigan State Extension reveal that large farms are achieving ratios exceeding 300 cows per full-time employee through strategic automation and role specialization. Family operations? We’re typically managing 60 cows per worker despite those 70-hour workweeks we all know too well. At prevailing wage rates, that creates a $1.50-2.00/cwt structural disadvantage.

Feed procurement tells a similar story. Farms purchasing railcar volumes access pricing 15-25% below truckload rates—that’s coming from Wisconsin’s dairy profitability analysis. Given that feed accounts for 50-55% of operating costs across multiple university studies, this differential significantly affects competitiveness.

The capital efficiency gap might be the toughest pill to swallow. A 2,500-cow facility requires an investment of about $12-15 million (works out to $4,800-6,000 per cow). A 500-cow operation? That’s $3.5-4.5 million, but $7,000-9,000 per cow. That permanent efficiency differential compounds over time, especially during extended margin pressure like we’re seeing now.

Regional Dynamics: Where Geography Shapes Destiny

Location has become increasingly determinative of dairy viability. Federal Order data reveals growing disparities that we really need to consider carefully.

Pacific Northwest producers—I really feel for these folks—face particularly challenging economics. Milk hauling costs average $0.53/cwt compared to under $0.35/cwt in concentrated production regions. Combined with cooperative assessments and processing distances, a 500-cow dairy in Washington or Oregon starts each month with a $45,000-50,000 disadvantage relative to competitors in more favorable locations.

California presents different but equally significant challenges. Environmental compliance costs producers are reporting range from $35,000 to $40,000 annually—that translates to $0.35-0.40/cwt. During drought years when water allocations drop 50% and you’re buying on the spot market, UC Davis studies indicate additional costs of $0.30-0.50/cwt.

Now contrast that with the Texas Panhandle, which has emerged as this processing hub. Industry estimates suggest the Amarillo region handles over 1,000 milk tanker loads daily within a 300-mile radius. With five major facilities operational by 2026, competitive procurement dynamics actually support local prices while other regions experience discounts.

Southeast producers navigate their own unique challenges—humidity-driven mastitis pressure and heat-stress management costs Northern operations avoid. Yet proximity to metros such as Atlanta and Charlotte creates premium market opportunities that can offset some of the structural disadvantages for entrepreneurial farms.

The Beef-on-Dairy Calculation: Opportunity and Risk

The Beef-on-Dairy Trap: That $280K in extra revenue today? It’ll cost you $406K when you need replacements in 2027. Farms that maximized beef breeding for survival are trading their ability to expand during recovery. The math shows you’re borrowing from your future self—at a terrible interest rate

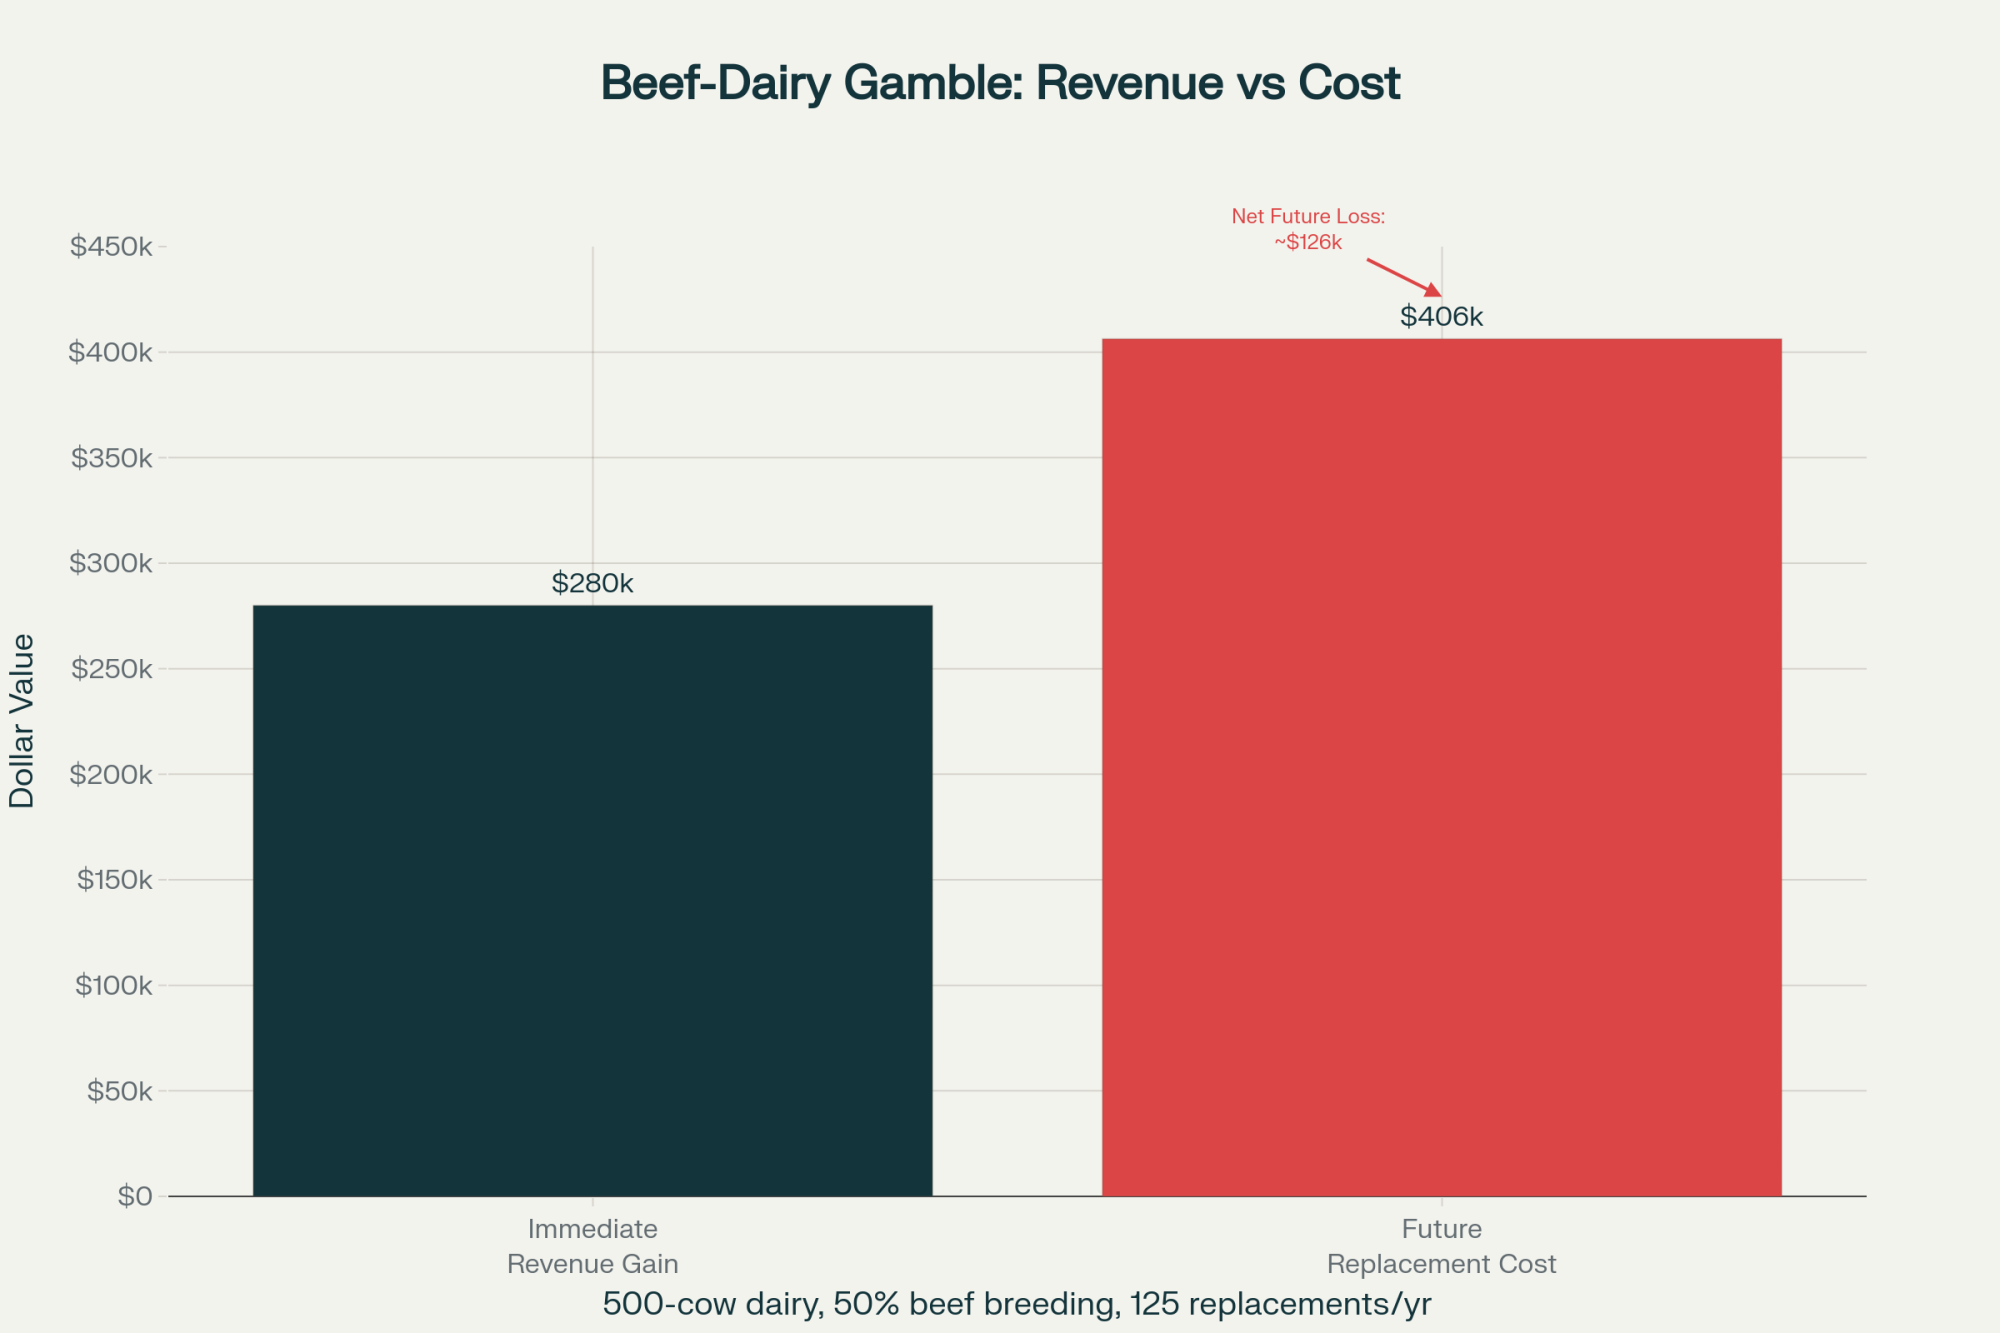
A fascinating development I’ve observed across multiple regions is how beef-on-dairy transformed from supplemental income to a survival strategy. Some farms report beef-cross calf sales now representing 40-50% of total revenue. With crossbred calves bringing $1,400-1,600 versus $100-200 for dairy bulls according to USDA market reports, a 500-cow dairy breeding half its herd to beef generates an additional $270,000-290,000 annually.

CoBank’s analysis, led by economists including Tanner Ehmke, projects that we’ll face an 800,000-head shortage of replacement heifers during 2025-2026. It reflects breeding decisions made when beef prices peaked and producers—understandably—prioritized immediate cash flow over future replacement needs.

University of Wisconsin dairy economists analyzing optimal breeding strategies suggest maintaining about 50% as the maximum sustainable beef breeding percentage. Farms exceeding this threshold—some reached 60-70% when beef prices peaked—essentially traded current survival for future growth capacity. When margins recover, these farms face either purchasing replacements at projected prices of $3,000-3,500 or foregoing expansion opportunities entirely.

The timing mismatch creates particular challenges. Breeding decisions made today determine replacement availability in 24-28 months, yet milk price recovery and heifer availability peaks likely won’t align. Farms that maximized beef revenue may survive the immediate crisis but will be unable to capitalize on the recovery.

The Compound Effect of Delayed Decisions

Your 24-Month Equity Countdown: Three Paths, One Choice. Farms taking immediate action preserve $658K in equity versus $250K for those doing nothing—a $408K difference determined solely by when you act, not market conditions

Through financial modeling using Farm Credit benchmarks and extension tools, a clear pattern emerges about timing’s impact on outcomes. Consider a representative 500-cow Wisconsin dairy with $850,000 in equity, losing $25,000 per month.

Immediate action—culling the bottom 20% based on income over feed cost metrics—generates approximately $200,000 at current cull cow values of $145-157/cwt while reducing monthly feed costs. Ration optimization to achieve $5.00 versus $6.20 per cow daily, following established nutritional guidelines, saves roughly $16,500 monthly. Combined, these actions reduce monthly losses from $25,000 to maybe $8,000-10,000.

After 24 months, early action preserves $650,000-700,000 in equity. That maintains strategic flexibility for expansion, transition to premium markets, or orderly exit if necessary.

But contrast this with delaying these decisions for six months. The farm burns an additional $150,000 in equity while waiting. Lender confidence erodes as equity ratios decline from 55% to 45%. Credit lines face restrictions. By month 24, the remaining equity of $250,000-$350,000 limits options to a distressed sale or continued deterioration.

That $400,000-450,000 difference? It represents the preservation or destruction of generational wealth, determined solely by the timing of actions.

Monitoring Recovery Signals

While I anticipate a 24-36-month adjustment period based on current fundamentals, several indicators could accelerate the recovery. Systematic monitoring helps separate noise from meaningful trends.

Global Dairy Trade auctions provide a 60-90-day forward indication of U.S. price direction, according to university dairy market research. Recent auctions have shown consecutive declines, but three consecutive stable or rising auctions would suggest the market is bottoming. Single auction movements shouldn’t drive decisions, though—trend confirmation matters.

Rationalizing processing capacity would meaningfully affect timing. Should 2-3 facilities announce closures or extended maintenance by Q2 2026, oversupply dynamics could improve faster than baseline projections. Though given the debt loads these facilities carry, continued operation at reduced utilization seems more probable than closure.

Monthly USDA production reports revealing 2%+ year-over-year declines for consecutive months would signal accelerating supply discipline. Combined with heifer shortages, this could create temporary market tightness.

Feed cost dynamics remain a wildcard. Should corn exceed $5.50/bu for 90+ days, forced culling similar to 2009 could compress the adjustment period to 12-18 months. Climate volatility suggests perhaps a 30-40% probability of significant Corn Belt production challenges within 18 months.

Given these signals, here’s how to position your operation for what’s ahead.

Three Strategic Imperatives for Every Operation

Based on extensive analysis and what I’m seeing in the field, every dairy faces three critical decision points over the coming months. Let me walk you through each one, starting with what needs attention immediately.

Decision One: Immediate Liquidity Management (Next 30 Days)

Successful navigation requires generating measurable cash flow improvement within 30 days. And that means confronting difficult culling decisions based on economic metrics rather than sentiment. Cornell Pro-Dairy benchmarks indicate that cows generating under $5 in daily income over feed cost incur ongoing losses regardless of other attributes.

Here’s what I’d tackle this week: Start by pulling DHIA records and ranking every cow by IOFC. Bottom 20% should be evaluated for immediate culling. Yes, it’s hard to cull that fresh heifer who’s just not performing, but keeping her costs you $150-200 monthly.

Comprehensive cost analysis typically identifies $30,000-50,000 in achievable annual savings through systematic review of all inputs and practices. Whether it’s adjusting mineral programs, renegotiating service contracts, or optimizing breeding protocols—the specific opportunities matter less than systematic identification and capture.

Proactive lender engagement before scheduled reviews demonstrates management capability and preserves relationship quality. The distinction between being viewed as proactive versus reactive often determines credit availability during challenging periods.

Decision Two: Strategic Recovery Positioning (Next 90 Days)

Forward-thinking farms must balance current survival with future opportunity. Breeding strategies warrant immediate adjustment—modeling suggests approximately 45% beef, 50% sexed dairy, and 5% conventional optimally balances current revenue with future replacement needs.

Geographic competitive position requires an honest assessment. Farms facing structural location-based disadvantages of $1.50+/cwt must consider whether operational excellence can overcome permanent cost disparities or if strategic alternatives warrant exploration.

Establishing specific, measurable decision criteria removes emotion from critical choices. Clear thresholds—”If Class III futures for Q3 2026 remain below $17.50 by March, we initiate transition planning”—enable rational rather than reactive decision-making.

Decision Three: Long-term Viability Determination (Next 180 Days)

Within six months, a fundamental strategic direction must be established. Well-positioned farms with adequate equity and replacement capacity should prepare for aggressive expansion during recovery. The 2027-2028 period may offer exceptional growth opportunities for prepared operations.

Dairies near metropolitan markets should seriously evaluate premium market transitions. USDA data confirms organic, A2, grass-fed, and direct marketing can deliver $7-12/cwt premiums that fundamentally alter economic equations. While requiring different skill sets, these models may offer superior risk-adjusted returns.

For farms where mathematics indicate strategic exit preserves maximum family wealth, timing remains critical. The difference between planned transition preserving $700,000 and forced liquidation at $200,000 determines whether next-generation education, career transitions, and retirement security remain achievable.

Practical Monitoring Framework

Successful farms systematically track key metrics. Here’s the dashboard I’m recommending producers review weekly:

Weekly Indicators:

  • Equity burn rate relative to total equity (are you on track with projections?)
  • CME Class III futures curves (watching for sustained moves above $17)
  • Feed cost per cow per day (work with your nutritionist to optimize)

Bi-Weekly Reviews:

  • Global Dairy Trade trends at GlobalDairyTrade.info
  • Local replacement heifer pricing trends
  • Regional basis (your mailbox price versus CME benchmark)

Monthly Analysis:

  • Months remaining until 40% equity threshold
  • USDA milk production reports for supply signals
  • Lender relationship temperature check

Additionally, reviewing Dairy Margin Coverage options (even with elevated premiums), forward contracting above breakeven, maintaining sub-70% working capital utilization per Farm Credit guidelines, and preserving capital through lease-versus-purchase decisions warrant immediate attention.

The Path Forward

After extensive analysis and countless producer conversations, one conclusion emerges consistently. Farms that thrive in 2028 won’t be those that perfectly predicted market timing or price bottoms. They’ll be those that recognized in November 2025 that strategic flexibility remained available, understood that monthly delay costs approximately $75,000 in option value, and made difficult decisions while maintaining equity and credit access.

The U.S. dairy industry will emerge smaller and more concentrated—projections suggest declining from about 33,000 to under 28,000 farms by 2028. Whether your operation participates in that future depends not on milk prices but on acting while meaningful choices remain. Agricultural economists consistently observe that survival often depends less on scale or luck than on the gap between when action was needed and when it was taken. That gap remains bridgeable today, but the window is continuing to narrow.

Look, these conversations—with family, lenders, advisors—they’re never easy. Yet the math remains indifferent to our discomfort, and time continues regardless of readiness. For many of us, the greatest challenge isn’t financial analysis or strategic planning but accepting that wealth preservation may require departing from generational patterns. Observing hundreds of transitions has taught me that strategic repositioning carries no shame—only waiting until strategy becomes desperation. The next 24 months will reshape American dairying more significantly than any period since the 1980s. Success isn’t about fighting this transformation—it’s about positioning yourself appropriately within it. And that positioning needs to begin immediately, not when market signals provide comfort.

Time really has become our scarcest resource in this industry. Those who recognize and act on this reality will determine not just their own futures, but the structure of American dairying for the next generation.

Key Takeaways:

  • Your burn rate reality: You’re losing $25,000/month with 24 months of equity left—but immediate action cuts this to $8,000/month
  • The six-month wealth gap: Act now = preserve $700,000 in family equity. Wait until spring = forced exit at $250,000
  • This week’s three moves: 1) Rank every cow by income over feed cost, 2) Cull the bottom 20%, 3) Call your banker before they call you
  • Decision deadlines that matter: 30 days (stop the bleeding), 90 days (position for recovery), 180 days (commit to expand or exit)
  • Why waiting won’t work: China’s self-sufficient + we overbuilt processing by $11 billion + worst heifer shortage since 1978 = permanent change, not temporary cycle

Complete references and supporting documentation are available upon request by contacting the editorial team at editor@thebullvine.com.

Learn More:

Join the Revolution!

Join over 30,000 successful dairy professionals who rely on Bullvine Weekly for their competitive edge. Delivered directly to your inbox each week, our exclusive industry insights help you make smarter decisions while saving precious hours every week. Never miss critical updates on milk production trends, breakthrough technologies, and profit-boosting strategies that top producers are already implementing. Subscribe now to transform your dairy operation’s efficiency and profitability—your future success is just one click away.

NewsSubscribe
First
Last
Consent

Europe’s Dairy Meltdown: How Germany and France’s Production Crisis Rewrites Your 2025 Profit Playbook

Stop waiting for Europe’s dairy recovery. Germany’s 2.3% collapse signals permanent market shift – smart operators capture €28B opportunity now.

EXECUTIVE SUMMARY: The dairy industry’s biggest myth? That European production challenges are temporary setbacks requiring patience rather than strategic repositioning. Germany’s 2.3% output decline and France’s 1.8% drop in Q1 2025 aren’t cyclical adjustments – they’re structural transformations creating unprecedented opportunities for competitors who can read the signals correctly. With EU milk deliveries falling to 367.6 million litres daily and Bluetongue virus hitting 9,044 French farms with 20-30% yield losses, European dairy is permanently shifting from volume-based competition to premium positioning. This transformation is opening €28.3 billion in annual market disruption while creating .42 per pound butter price premiums that smart operations can exploit. US butter exports already jumped 41% year-over-year by capitalizing on European weakness, while EU processors abandon commodity markets to focus on cheese production. The window for market capture is wide open, but conventional thinking about “waiting for recovery” will cost you the opportunity of a generation. Stop planning for European recovery and start positioning for permanent market realignment – your competitive advantage depends on recognizing this isn’t a downturn, it’s a redistribution.

KEY TAKEAWAYS

  • Disease Management ROI: €24,500-28,000 Revenue Protection – European farms lose 1,000 liters daily during 70-day Bluetongue outbreaks, while operations with superior biosecurity protocols gain permanent competitive advantages as climate change extends disease pressure across global regions
  • Technology Leapfrog Opportunity: $470 Annual Savings Per Cow – Precision agriculture systems delivering 12-15% feed efficiency improvements and 8-12% veterinary cost reductions position forward-thinking operations to capture market share from European competitors struggling with €150,000-250,000 regulatory compliance investments
  • Export Market Capture: $1.42/lb Immediate Price Advantage – EU commodity product shortages (butter down 1%, milk powder down 4-5%) create multi-year windows for aggressive market expansion, with US operations already achieving 41% export growth by targeting price-sensitive markets abandoned by European suppliers
  • Strategic Positioning Timeline: 3-4 Year Competitive Window – European herd rebuilding requires minimum 3-4 years considering breeding cycles and heifer development, creating sustained opportunities for capacity expansion and market penetration before structural recovery becomes possible
  • Margin Optimization Through Cost Structure: 29% European Disadvantage – While European operations face €5/100kg cost increases from energy (+12%), labor (+8%), and regulatory compliance, regions with stable input costs and lower regulatory burdens can leverage permanent competitive advantages through aggressive commodity market positioning
European dairy production, dairy market opportunities, strategic dairy planning, global dairy trade, dairy export opportunities

The European dairy giants just delivered a reality check, reshaping global milk markets faster than a broken bulk tank emptying a day’s worth of production. Germany’s 2.3% output decline and France’s 1.8% drop aren’t just statistics – they’re forcing every strategic dairy operation worldwide to recalculate their competitive positioning for the remainder of 2025.

Think of European dairy as the industry’s heavyweight champion suddenly showing signs of weakness. When your top contenders start stumbling, smart competitors don’t just watch – they position themselves to capture the market share that’s about to become available.

But here’s the million-dollar question: Are you prepared to challenge the conventional wisdom that European dairy will always bounce back?

The Numbers That Should Keep Dairy Strategists Awake at Night

Let’s start with the cold, hard data that’s reshaping global dairy dynamics. EU milk deliveries dropped to 367.6 million litres daily in Q1 2025, representing a 0.3% year-over-year decline. But here’s where it gets interesting for operations thinking beyond their local markets: raw cows’ milk delivered to dairies across the EU-27 took a sharper 1.8% hit during the same period.

Why This Matters for Your Operation: When regions representing 40% of global dairy trade volume contract simultaneously, supply chains shift. If you’re positioned correctly, this creates unprecedented opportunities for market expansion.

Germany’s situation reads like a case study in structural decline. With approximately 3.67 million dairy cows as of May 2024 and nearly 28,000 farms closing over the past decade, the country’s annual milk output of 33 million tonnes is under serious pressure. The projected 2.3% decline for 2025 continues a structural trend that began in 2015 – think of it like watching a once-dominant Holstein bloodline gradually lose genetic merit through poor breeding decisions.

France’s reversal is equally telling. After a modest 1.3% recovery in 2024 that broke a three-year losing streak, the country’s dairy sector has reversed course, with an estimated 1.8% annual decline projected for 2025. That’s like watching a high-producing cow’s lactation curve peak early and then drop faster than expected – the underlying fundamentals weren’t as strong as the surface numbers suggested.

Bluetongue: The Disease That’s Rewriting Milk Quality Protocols

The Bluetongue virus (BTV) isn’t just another animal health challenge – it’s systematically dismantling European milk production with the precision of a poorly calibrated milking system destroying somatic cell counts across an entire herd.

The Production Impact Reality: BTV outbreaks have hit 9,044 farms across 52 French regions, with affected operations experiencing 20% reductions in milk yield and some individual farms seeing drops of up to 30%. To put that in perspective, imagine your 100-cow herd suddenly producing like a 70-cow operation while maintaining the same feed, labor, and facility costs.

Recent data shows infected cows experience lower milk production by roughly 2 pounds per cow daily for nine to 10 weeks. In severe cases, milk production can be impacted at much higher levels, with some German farms reporting milk yield drops of 3%-8% on affected operations.

Real-World Impact: The Northeast France Case Study

Consider the situation in Northeast France, bordering Belgium, which has emerged as a significant BTV hotspot. Here’s what one affected region looks like in practice: farms that were averaging 25 liters per cow daily before the outbreak now see production drop to 20 liters per cow – that’s a 5-liter daily loss per animal. A 200-cow operation translates to 1,000 liters of lost production daily, or approximately €350-400 in lost revenue per day based on current European milk prices. Over a 70-day outbreak period (the typical duration), that’s €24,500-28,000 in lost income before accounting for increased veterinary costs.

Economic Devastation Beyond Milk Loss: Veterinary care and treatment costs alone run €5,000 to €10,000 per farm during outbreaks. A typical 200-cow operation averaging 30 liters per cow daily is equivalent to losing 8-16 days of total milk production value just in veterinary expenses. Factor in movement restrictions, mandatory testing protocols, and potential quarantine periods, and you’re looking at economic impacts that extend far beyond immediate production losses.

Challenging Conventional Wisdom: Here’s where the industry needs to wake up. The traditional approach of reactive disease management – waiting for outbreaks and then scrambling to contain them – proves catastrophically inadequate. Climate change is extending active periods for disease vectors across Europe, making BTV a recurring rather than episodic challenge.

Implementation Barriers and Solutions

The biggest barrier to effective BTV management isn’t technical – it’s economic and psychological. Most dairy operations view disease outbreaks as “acts of God” rather than manageable business risks. This mindset creates three critical implementation barriers:

  1. Underinvestment in Prevention: Farmers hesitate to invest in comprehensive vector control and monitoring systems because the costs are visible and immediate, while the benefits (avoided losses) are invisible until an outbreak occurs.
  2. Fragmented Regional Response: BTV doesn’t respect farm boundaries, but coordinated regional control programs require unprecedented cooperation between traditionally independent operators. The resistance to collective action often undermines the most effective control strategies.
  3. Technology Adoption Resistance: Advanced monitoring systems can detect early infection signs, but many operations resist adoption due to concerns about data privacy, technology complexity, and integration with existing management systems.

Why This Matters for Your Operation: Climate change is making traditional disease management strategies obsolete. Operations in other regions with superior disease management infrastructure and biosecurity protocols suddenly gain significant competitive advantages. Are you still relying on yesterday’s biosecurity protocols to protect tomorrow’s productivity?

The Great European Herd Contraction: Numbers That Tell a Story

The underlying structural decline in European dairy cow numbers tells a story that every strategic planner needs to understand. EU dairy cow populations are projected to fall to 19.219 million head in 2025 from 19.912 million in 2023. That’s a loss of nearly 700,000 dairy cows – equivalent to removing approximately 2,333 average-sized 300-cow operations from production.

Productivity vs. Population Mathematics: While European operations continue improving per-cow productivity through advanced genetics, precision nutrition, and technology adoption, these gains aren’t offsetting the declining herd size. Think of it as trying to maintain total milk production by pushing your cows from 25 liters to 27 liters per day while simultaneously culling 10% of your herd – the math simply doesn’t work long-term.

The Consolidation Reality: Germany exemplifies this trend with brutal clarity. The shift toward larger, more industrialized farms with over 200 cows reflects a fundamental transformation where economies of scale and technology adoption become survival requirements rather than competitive advantages.

Case Study: The German Farm Exodus

Consider the trajectory of a typical 50-cow German dairy operation from 2015 to 2025. In 2015, this farm could generate sufficient income with basic management practices, family labor, and traditional facilities. By 2020, rising regulatory compliance costs for environmental standards required a €75,000 investment in waste management upgrades. The 2023 BTV outbreak cost them €8,000 in veterinary expenses and a 15% production loss for six weeks. In 2025, new emissions reduction requirements demand another €120,000 investment in methane capture technology. The math no longer works: the farm needs to either expand to 200+ cows to spread these costs or exit the industry entirely. This scenario has played out across nearly 28,000 German farms in the past decade.

Precision Technology’s Role: Modern dairy operations increasingly turn to breakthrough technologies to maximize efficiency from smaller herds. Recent innovations in individual cow feed efficiency monitoring can identify feed conversion rates on each animal, potentially saving $470 per cow per year on a 2,500-cow dairy. But are you investing in the right technologies or just buying the shiniest equipment?

Implementation Barriers to Technology Adoption

Despite proven ROI, three major barriers prevent widespread technology adoption among European dairy operations:

  1. Capital Access Constraints: Smaller operations struggle to access capital for technology investments when banks view dairy farming as a declining industry. Traditional lending criteria don’t account for technology’s ability to transform operational efficiency.
  2. Skills Gap: Advanced precision agriculture requires technical expertise that many traditional farmers lack. Training programs exist, but time constraints during critical farming periods limit participation.
  3. Integration Complexity: New technologies must integrate with existing systems, facilities, and workflows. Poor integration can actually reduce efficiency initially, creating resistance to adoption.

Why This Matters for Your Operation: This creates a structural supply deficit that’s not easily reversible. Rebuilding dairy herds takes 3-4 years minimum, considering breeding decisions, gestation periods, and heifer development timelines. Operations positioned to expand in the face of European contraction have a multi-year window of opportunity.

Margin Squeeze Mathematics: The Cost Structure Crisis

European dairy farmers are experiencing what industry analysts call a “perfect storm” of input cost inflation that’s fundamentally altering the competitive landscape. Let’s break down the numbers that matter:

Feed Cost Reality: With feed typically consuming 60% of operational expenses for dairy operations, any volatility creates immediate margin pressure. Spring 2025 has brought severe rainfall deficits across northwestern Europe, including northern France and Germany, creating critically low soil moisture levels that threaten feed grain production and could drive higher feed prices.

Energy and Labor Inflation: Energy prices surged 12% year-over-year, while labor costs increased 8% in 2024 to retain workers. A typical European dairy operation translates to approximately €3,000-€5,000 in additional annual costs per 100 cows just from energy and labor inflation.

Drought Impact Calculations: The European agricultural sector absorbs an average of €28.3 billion in annual losses due to extreme weather, with drought accounting for over half of these damages. That’s approximately €1,420 in weather-related losses per dairy cow annually across the EU – a hidden cost that doesn’t appear on traditional enterprise budgets but significantly impacts long-term profitability.

Real-World Margin Analysis: The French Case Study

Let’s examine a representative 150-cow French dairy operation to understand the margin squeeze reality:

  • 2023 Baseline: €45 per 100 kg milk (farmgate price), costs of €38 per 100 kg = €7 profit margin
  • 2025 Reality: €48 per 100 kg milk (3% price increase), costs of €43 per 100 kg = €5 profit margin
  • Cost Breakdown of €5 increase: Feed costs +€2.50, energy costs +€1.20, labor +€0.80, veterinary/BTV +€0.50

This 29% margin erosion (from €7 to €5) forces the operation to either increase production efficiency by 29% or face financial unsustainability.

Technology as a Solution: Progressive operations leverage precision livestock farming (PLF) technologies to optimize animal production, health, and welfare while reducing costs. These systems encompass sensors for biological information capture, algorithms for data processing, and interfaces for practical implementation.

Implementation Barriers to Cost Management

European dairy operations face several systematic barriers to effective cost management:

  1. Regulatory Compliance Costs: Environmental regulations require significant non-productive investments that increase cost structures without improving efficiency. Unlike other regions, European farmers can’t simply choose the lowest-cost production methods.
  2. Scale Economics Limitations: Small average farm sizes prevent European operations from achieving the scale economies available to competitors in other regions. Consolidation faces significant cultural and regulatory barriers.
  3. Input Price Volatility: European operations have limited ability to hedge against input price volatility due to fragmented markets and limited financial instruments designed for smaller operations.

Why This Matters for Your Operation: European producers now operate with structurally higher cost bases that create permanent competitive disadvantages in commodity dairy markets. Operations in regions with more stable input costs, better water security, and lower regulatory compliance expenses can leverage these advantages for aggressive market expansion.

Environmental Regulations: The Green Deal Cost Reality

The EU Green Deal isn’t just policy – it’s a fundamental cost structure that’s reshaping competitive dynamics globally. These regulations require agricultural emissions cuts of 30% by 2030, often necessitating substantial non-productive investments that directly impact profitability.

Compliance Cost Breakdown: German dairy operations face expensive upgrades to eco-friendly technologies, modern waste management systems, and emission reduction methods. A typical 200-cow operation translates to approximately €150,000-€250,000 in non-productive capital investments over the implementation period.

Challenging the Status Quo: Here’s where conventional thinking gets dangerous. The industry’s traditional response to environmental regulations – grudging compliance while hoping for policy reversals – is proving economically suicidal. Instead of fighting change, what if smart operators treated environmental regulations as competitive advantages?

Operations implementing feed efficiency improvements reduce costs and significantly decrease methane emissions. Studies show that a gain of 20 points in feed efficiency equates to a reduction of approximately 22 tons of methane per year on a 2,500-cow dairy – equivalent to planting 9,240 trees.

Regulatory Acceleration Effect: The Common Agricultural Policy Strategic Plans, outlining intervention strategies from 2023 to 2027, include eco-schemes that critics argue favor industrial farms, with significant fund flows to larger producers. This creates a vicious cycle where environmental compliance accelerates farm consolidation while increasing overall cost structures.

Implementation Barriers for Environmental Compliance

European dairy operations face unique challenges in meeting environmental requirements:

  1. Technology Investment Requirements: Advanced emissions reduction technologies require substantial upfront capital investments with long payback periods, creating cash flow challenges for smaller operations.
  2. Regulatory Complexity: Environmental compliance involves multiple overlapping regulations at EU, national, and local levels, requiring specialized expertise that smaller operations can’t afford.
  3. Competitive Disadvantage: European environmental standards are stricter than most global competitors, creating permanent cost disadvantages that can’t be recovered through efficiency gains alone.

Why This Matters for Your Operation: European producers will continue facing structurally higher baseline costs compared to less regulated regions. For every dollar of regulatory compliance cost that European producers absorb, operations in other regions gain a permanent competitive advantage.

Processing Strategy: The Great Product Mix Pivot

European processors are playing a sophisticated game of “dairy Tetris,” strategically reallocating limited milk supplies to maximize returns. This strategic pivot creates opportunities and threats that every dairy operation needs to understand.

The Numbers Behind the Strategy: Despite the decline in overall EU milk production, cheese output is projected to increase by 0.6% to 10.8 million metric tons (MMT) in 2025). This comes at the direct expense of commodity products: butter production forecast down 1% to 2.1 MMT, non-fat dry milk production declining 4% to 1.4 MMT, and whole milk powder production falling 5% to 580,000 metric tons.

Pricing Premium Reality: This strategic reallocation is creating significant price premiums. US butter prices in May 2025 sat around $2.33 per pound, compared to EU prices of $3.75 per pound. EU cheese prices jumped 19% year-over-year in early 2025. That’s a $1.42 per pound premium for European butter – enough to fundamentally alter global trade flows.

Why This Matters for Your Operation: European processors are essentially conceding commodity dairy markets to focus on value-added products. This creates unprecedented opportunities for operations positioned to supply butter, milk powders, and other commodity products to markets where European suppliers are becoming price-prohibitive.

Product CategoryEU 2025 ForecastStrategic Opportunity
Cheese+0.6% (10.8 MMT)Limited export opportunity due to EU focus
Butter-1% (2.1 MMT)Major export opportunity, $1.42/lb price advantage
Non-Fat Dry Milk-4% (1.4 MMT)Significant market share captures potential
Whole Milk Powder-5% (580K MT)Export expansion opportunity vs. EU suppliers

Technology Integration: Precision Agriculture’s Role in Recovery

While European dairy faces structural challenges, technology adoption represents a critical pathway for competitive recovery and efficiency gains. But are operations investing strategically or just chasing the latest tech trends?

Precision Agriculture Applications: Advanced monitoring systems, automated milking systems (AMS), and data analytics platforms are helping European operations maximize productivity from smaller herds. The adoption of robotic milking systems has grown about 25 percent annually, particularly accelerating over the past decade.

Real-World Technology Case Study: At progressive European operations implementing comprehensive precision farming systems, robotic systems handle 60 cows per unit, enabling three-times-daily milking versus traditional twice-daily schedules. This frequency optimization prevents cows from reaching full holding capacity, maintaining continuous milk production, and increasing overall yield by 12-15% compared to conventional systems.

Genomic Testing Integration: European breeding programs increasingly rely on genomic testing and Estimated Breeding Values (EBVs) to accelerate genetic progress. Operations utilizing Total Performance Index (TPI) scores and genetic merit evaluations are achieving 2-3% annual improvements in milk yield per cow. Research shows genomic analysis can be twice as reliable at predicting future production compared to traditional pedigree methods, with accuracy rates reaching 70%.

Activity Monitoring Revolution: Real-time health monitoring and activity tracking systems help European operations detect diseases like BTV earlier, potentially reducing production losses by 15-20% compared to traditional observation methods. New collar technologies provide monitoring capabilities for dairy calves from birth through 12 months, identifying behavioral changes that indicate health issues often before symptoms are apparent.

Technology Implementation Barriers

Despite proven benefits, European dairy operations face several barriers to technology adoption:

  1. Integration Complexity: Legacy farm systems often can’t easily integrate with modern precision agriculture technologies, requiring comprehensive system overhauls that many operations can’t afford.
  2. Data Management Challenges: Advanced monitoring systems generate massive amounts of data that require analytical expertise, which many farms lack. Poor data utilization can actually reduce decision-making effectiveness.
  3. Regulatory Compliance: Data privacy regulations and animal welfare standards create additional complexity for technology implementation that doesn’t exist in other regions.

Why This Matters for Your Operation: Technology adoption creates opportunities to leapfrog traditional farming methods. Today, operations investing in precision agriculture position themselves to capture market share from regions still relying on conventional management approaches. But here’s the critical question: Are you choosing technologies based on genuine ROI analysis or vendor marketing promises?

Global Trade Repositioning: Reading the Competitive Signals

The European dairy crisis fundamentally reshapes global trade dynamics, creating strategic opportunities for well-positioned operations.

US Market Positioning: US dairy exports are already capitalizing on European weakness. US butter exports jumped 41% year-over-year in January 2025, and cheese exports hit record levels. The US dairy sector projects modest production growth in 2025, driven by favorable feed prices, slightly larger dairy herds, and improved productivity.

Export Market Rebalancing: EU non-fat dry milk exports are forecast to decrease by 6.8% in 2025, largely due to weaker Chinese demand and strong competition from other global players. Whole milk powder exports are expected to decline further, with less demand from China and strong competition from New Zealand.

Structural Market Changes: Industry analysts observe three major structural shifts shaping 2025: federal milk marketing order adjustments, new cheese processing capacity, and evolving trade dynamics. As one senior dairy analyst notes, “What separates a really good year from a really bad year, from a milk price perspective, has been exports.”

Regional Competitive Advantages: While the EU focuses on high-value products and domestic consumption, its reduced commodity output and higher cost structure create market share opportunities for more competitively priced producers.

Trade Implementation Barriers

Operations seeking to capitalize on European trade gaps face several challenges:

  1. Market Access Requirements: Many export markets have specific certification, quality, and traceability requirements that require time and investment.
  2. Logistics Infrastructure: Establishing reliable cold-chain logistics for dairy products requires significant infrastructure investments and partnerships.
  3. Currency and Price Volatility: Export markets expose operations to currency fluctuations and international price volatility that domestic-focused operations don’t face.

Why This Matters for Your Operation: European dairy’s transformation into a high-cost, premium-positioned sector creates permanent shifts in global trade patterns. Operations that can deliver reliable supply at competitive prices have a multi-year window to establish themselves in markets previously dominated by European suppliers.

Implementation Timeline: Strategic Positioning for Market Capture

Timing and sequencing matter significantly for operations looking to capitalize on European dairy’s structural challenges. But are you thinking tactically about the next quarter or strategically about the next decade?

Immediate Actions (Next 6 Months):

  • Evaluate export market opportunities where EU price premiums create competitive advantages
  • Assess current disease management protocols and biosecurity infrastructure against climate change scenarios
  • Review feed sourcing strategies to ensure stable input costs during European supply disruptions

Medium-Term Positioning (6-18 Months):

  • Investigate technology investments that provide productivity advantages over traditional European operations
  • Explore partnerships with processors focused on commodity dairy products abandoned by EU suppliers
  • Develop relationships in export markets where European suppliers are becoming price-prohibitive

Long-Term Strategic Development (18+ Months):

  • Consider capacity expansion to capture market share from constrained European producers
  • Invest in advanced genetics programs to achieve productivity levels that offset European efficiency advantages
  • Build supply chain infrastructure to support expanded market presence

Case Study Integration: Recent studies of top-performing dairy herds show that successful operations typically generate £120,000 more annually than bottom performers, primarily through superior cost management while maintaining strategic investments in cow health and productivity.

The Bottom Line: Your Competitive Advantage Window

Europe’s dairy production crisis represents more than a regional challenge – it’s a fundamental shift that’s creating permanent changes in global competitive dynamics. Germany’s 2.3% production decline and France’s 1.8% drop signal the beginning of a multi-year period where European dairy transforms from a volume-based competitor to a premium-positioned sector focused on value-added products.

The strategic opportunity is clear: European dairy’s structural challenges – disease pressure amplified by climate change, declining herd numbers, regulatory compliance costs escalating under the Green Deal, and margin squeeze from volatile input costs – aren’t temporary setbacks. They’re permanent features of a new competitive landscape that favors operations with lower cost structures, superior disease management, and strategic positioning in commodity dairy markets.

For progressive dairy operations, the implications demand immediate action:

  1. Expand export focus on markets where EU price premiums create competitive opportunities
  2. Invest in disease management infrastructure to avoid the production volatility plaguing European operations
  3. Leverage cost advantages through aggressive pricing strategies in commodity dairy products abandoned by EU processors
  4. Build strategic partnerships with processors seeking reliable commodity suppliers as European focus shifts to value-added products

Challenge Yourself: Look at your current operation through the lens of European challenges. Are your biosecurity protocols adequate for climate-enhanced disease pressure? Are your cost structures competitive enough to capture market share from high-cost European suppliers? Are you positioned to supply the commodity markets that Europe is abandoning?

The question isn’t whether European dairy will recover – the regulatory environment, climate challenges, and structural cost issues suggest permanent transformation rather than temporary disruption. The question is whether your operation will position itself to capture the market opportunities these changes create or whether you’ll continue operating with yesterday’s assumptions about tomorrow’s markets.

Why This Matters for Your Operation: The European dairy crisis isn’t Europe’s problem – it’s your competitive advantage. Operations that recognize this transformation and position accordingly will capture the market share that Europe’s structural challenges are making available. Those who wait for European recovery will miss the opportunity entirely.

The global dairy landscape is fundamentally shifting. Strategic operations will write the next chapter of this story by positioning themselves as reliable, cost-competitive alternatives to European volatility. The window is open. The question is: Will you step through it?

Learn More:

Join the Revolution!

Join over 30,000 successful dairy professionals who rely on Bullvine Weekly for their competitive edge. Delivered directly to your inbox each week, our exclusive industry insights help you make smarter decisions while saving precious hours every week. Never miss critical updates on milk production trends, breakthrough technologies, and profit-boosting strategies that top producers are already implementing. Subscribe now to transform your dairy operation’s efficiency and profitability—your future success is just one click away.

NewsSubscribe
First
Last
Consent
Send this to a friend