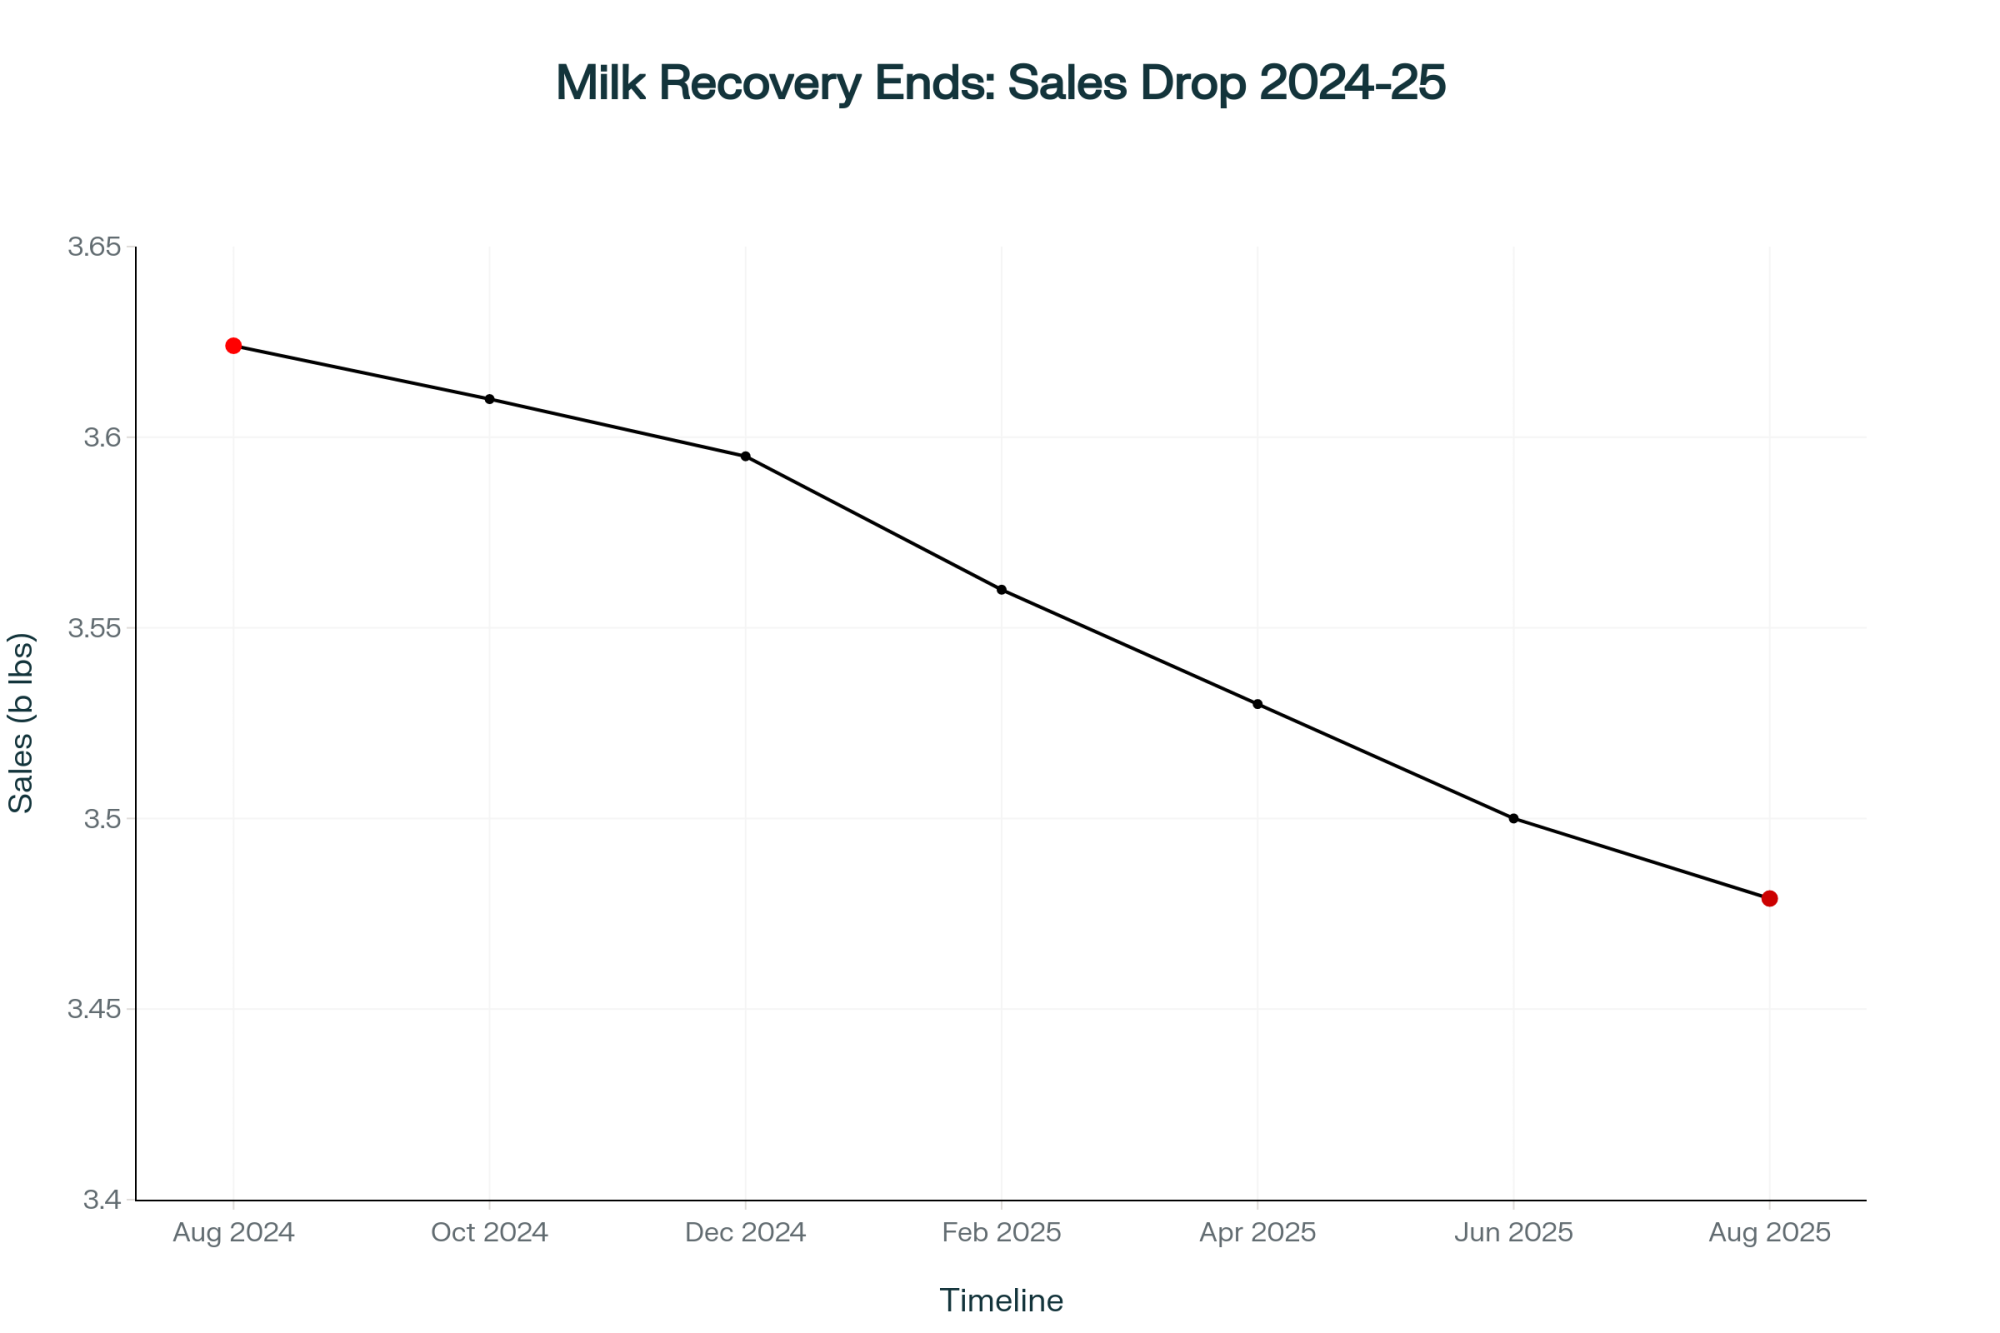
August 2024: First fluid milk gain since 2009. August 2025: Down 4%. The recovery? It’s already over.
EXECUTIVE SUMMARY: The brief fluid milk recovery of 2024 is over—August sales dropped 4%, confirming dairy’s structural shift from volume to components. Processors are voting with their wallets: $11 billion into cheese, yogurt, and specialty products, essentially nothing into traditional bottling. The economics are clear: farms hitting 4.3% butterfat earn $38,000+ more annually per 500 cows than those at 4.2%, while operations like Jake Vandenberg’s captured an extra $1.40/cwt simply by switching processors. Meanwhile, 259 farms filed bankruptcy chasing yesterday’s volume game, caught between $17 milk and $32+ production costs. The good news? Multiple paths to profitability exist—component optimization, specialty markets, strategic partnerships—but only for those who act now. With Federal Order reforms on December 1st and massive shifts in processing capacity by Q2 2026, your decisions in the next 18 months determine whether you’re part of dairy’s future or its consolidation statistics.

You know that brief moment of hope we all felt when 2024 posted fluid milk’s first sales increase since 2009? Well, August’s 4% decline—bringing us down to 3.479 billion pounds according to USDA’s latest numbers—is telling us something important. And with processors committing $11 billion to new manufacturing facilities while fluid milk drops toward just 15% of total utilization, I think we’re seeing more than just another market cycle.
Many of us have noticed something feels different about our milk checks lately. It’s not just the price swings we’re used to. The cumulative sales data through August shows a 1.1% decline after adjusting for leap day, and that’s part of a bigger picture worth talking about.
Component Production: What’s Really Happening Out There
Here’s what’s been happening that you might not have noticed yet. The Federal Milk Marketing Order data from March shows something fascinating—while total milk production dipped slightly at 0.35% year-to-date, calculated milk solids production actually went up by 1.65%. We’re making less milk but with way more components.
What really caught my attention is what’s happening with butterfat. USDA data shows the average test rate hit 4.36% in March 2025. That’s not just good—it breaks the old record set in 1945, when they hit 4.15%. Protein’s up too, sitting at 3.38%. These aren’t random fluctuations, folks. This is a systematic change.
I was talking with Tom Martinez last week—he runs 1,400 cows near Modesto—and he put it perfectly: “When the Federal Order pricing shows components making up 88-92% of what we’re getting paid, you’d be crazy not to adjust.” And he’s right. The economics are clear as day.
What I’m seeing across the country is producers really pushing components. Some markets are reporting component premiums hitting $1.25 per hundredweight for consistent quality, with certain producers getting even more. For someone like Martinez, producing 85 pounds per cow daily, that’s about $110,000 extra per year. That’s real money.
Sarah Johnson, a nutritionist with Cargill who works mostly in Wisconsin, tells me her clients are completely changing their approach. “They’re selecting for genetics with +50 pounds protein EBV now,” she says, “and pushing dry matter intake over 55 pounds daily during peak lactation. It’s all about component density these days.”
And you know what? With the Federal Order reforms coming on December 1st, this makes total sense. Wisconsin’s dairy center ran the numbers—farms producing milk with 3.3% protein and 6.0% other solids are going to see meaningful premiums. If you’re still focused on volume… well, you might end up subsidizing the folks who’ve made the switch.
Follow the Money: Where $11 Billion in Dairy Processing Investment Is Going

The International Dairy Foods Association’s manufacturing report really opened my eyes. They’re tracking $11 billion in new processing investments through 2028. But here’s what’s interesting—look at where that money’s actually going:
Manufacturing Investment Breakdown
- Cheese facilities: $3.2 billion
- Milk/cream (mostly ESL and specialty): $2.97 billion
- Yogurt and cultured products: $2.81 billion
- Butter and powder operations: $1.60 billion
Notice anything missing? Yeah, traditional fluid milk bottling barely registers.
The individual projects tell the story even better. Fairlife—that’s Coca-Cola’s operation—is putting $650 million into ultra-filtered milk production in Webster, New York. Chobani’s dropping $1.2 billion on their Idaho facility, but it’s for yogurt and cultured products. Darigold’s new $600 million plant in Pasco? That’s for butter and milk powder, not fluid milk.
Mike McCully made a point at World Dairy Expo that stuck with me: “Pretty soon, it won’t be about who’s getting milk—it’ll be about who’s NOT getting milk.”
Based on what these companies are announcing, they’ll need 50-60 million pounds of milk daily once everything’s running. That milk’s got to come from somewhere.
Consumers: They’re Telling Us Something Important
The August sales data from IRI shows some really interesting patterns. Overall, fluid milk dropped 4%, but when you dig deeper, it gets complicated.
Organic milk took a real beating—down 9.4% according to retail tracking. And this is despite all the environmental and health messaging that, in theory, should appeal to today’s consumers. But when USDA shows organic averaging $4.41 per half-gallon versus $1.57 for conventional, well… that’s a tough premium for folks to swallow right now.
But here’s what’s curious—lactose-free milk grew 11.6% year-over-year. Circana’s research shows it’s getting $9.40 per gallon compared to $4.86 for regular milk.
Dr. Mary Schmitt at UC Davis explained it to me this way: “Lactose-free fixes a problem people feel immediately. They drink it, they feel better. Organic’s benefits? Those are long-term and abstract.”
The generational stuff is what really concerns me, though. The International Food Information Council’s 2024 study found that only 8% of Gen Z consumers buy conventional cow’s milk. Boomers? That’s 37%.

Even more telling—recent consumer research shows younger consumers increasingly view dairy through a social lens, with many reporting discomfort ordering dairy products in public settings. This represents a fundamental shift in how dairy is perceived culturally, not just nutritionally.
Jennifer Williams from Dairy Management Inc. doesn’t mince words about this: “This isn’t something a better Got Milk campaign can fix. We’re looking at fundamental cultural shifts across three generations.”
The Financial Reality Check: A Tale of Two Dairy Economies
Let’s talk money, because that’s what keeps us all up at night. CME futures show Class III milk dropped about 20 cents after April’s production reports, settling around $16.86-17.86 per hundredweight for most of 2025.
Cornell’s Dairy Farm Business Summary lays out the cost structure pretty starkly:
Production Cost Comparison (per hundredweight)
- Mid-size operations (200-700 cows): $32.83
- Large operations (2,000+ cows): $23.06
- Cost disadvantage: $9.77
That’s almost a $10 difference, and you can’t make that up with incremental improvements.

The bankruptcy numbers from American Farm Bureau tell a tough story. Chapter 12 filings jumped 55% to 259 cases between April 2024 and March 2025—the highest since 2019. In Q1 2025, we saw 88 bankruptcy filings, up from 45 the year before.
Dr. Christopher Wolf at Cornell reminds us these aren’t just numbers: “Every one of these represents generations of knowledge, family legacies, and rural communities losing their foundation.”
Interest rates aren’t helping either. Federal Reserve ag lending surveys show rates jumping from 2.9% to nearly 9%. CoBank’s analysis suggests that if you’re refinancing debt, you’re looking at $50,000 to $150,000 more in annual service costs, depending on your operation size.
And here’s something that worries me—USDA’s Cattle report shows replacement heifer inventories at just 41.9 per 100 milk cows. That’s a 47-year low. You don’t sell your future herd unless you absolutely need the cash today.
What Works: Learning from Successful Adaptations
Not everybody’s struggling, though, and that’s worth talking about. I’ve been visiting with farmers who are actually doing pretty well, and they’ve got some things in common.
Take the Vandenberg family in South Dakota. Over the past three years, they’ve completely restructured their 800-cow operation to focus on components.
“We’re hitting 4.3% butterfat and 3.4% protein consistently,” Jake Vandenberg tells me. “Agropur gives us about $1.40 per hundredweight extra for that consistency. For us, that’s literally the difference between making money and losing it.”
The Vandenbergs made three big changes:
- Switched their breeding program—sexed semen on the best 40%, beef on the rest
- Brought in a nutritionist to reformulate for component density instead of volume
- Left their co-op after 30 years to join a cheese-focused processor

Different strategies work for different situations, of course. Maria Rodriguez, down in Texas, took an entirely different approach. Her 180-cow operation couldn’t compete with the mega-dairies around her on efficiency. So she went niche—transitioned to A2 milk for a regional specialty processor.
“I’m getting $24 per hundredweight when my neighbors are getting $17,” she says. “But it took two years to fully transition, between the testing, breeding changes, and building new buyer relationships.”
Regional Realities: Why Geography Matters More Than Ever
Of course, what works depends partly on where you’re farming. The transformation looks different depending on your region.
California: Dealing with water restrictions, environmental regulations, and bird flu that knocked out 0.7% of national production according to the USDA’s animal health reports. But California’s also where I’m seeing the most aggressive component optimization. Dr. Jennifer Heguy from UC Extension puts it bluntly: “With our cost structure, it’s high components or bankruptcy. There’s no middle ground.”
Wisconsin: Actually, it’s in a pretty good spot for this transformation. The Wisconsin Milk Marketing Board reports that 90% of the state’s milk goes into cheese. If you’re optimizing for protein in Wisconsin, you’re positioned perfectly. The challenge? Most Wisconsin farms still have fewer than 500 cows, and scale matters more than ever.
Northeast: That’s where things get tough. Analysis shows they depend more on fluid milk than any other region. Industry estimates suggest DFA controls about 60% of fluid processing in some Northeast markets. Dr. Andrew Novakovic at Cornell describes it well: “The big farms will be fine, the specialty niche operations can make it work, but that traditional 200-cow dairy that’s been the backbone of rural New York? They’re in a really tough spot.”
The Other View: Maybe This Is Just Another Cycle
Now, not everyone agrees that this is a permanent change. I had a long conversation with Robert Wellington at Agri-Mark Cooperative, and he makes some good points.
“We’ve seen this before,” Wellington says. “In 2009, when Class III hit $9, everyone said dairy was permanently broken. By 2011, we were back over $20. Markets do this—they overcorrect.”
He points to several recovery factors:
- China could bounce back and start importing again
- Cheese consumption has grown for 40 years straight
- Government might step in if farm failures accelerate
- IRI data shows plant-based milk has plateaued, with oat milk actually declining
“Look, I’m not saying it’s easy,” Wellington tells me. “But fluid milk still represents 200 billion pounds of annual sales. Writing it off completely might be premature.”
What You Can Do Right Now: Practical Action Steps
So, given all this, what should you actually be doing? Here’s my practical advice based on what’s been working.
1. Evaluate Your Processor Relationship
Ask these critical questions:
- What’s their five-year infrastructure plan?
- How much milk goes to fluid versus manufacturing?
- What are the component premiums and calculation methods?
- Are they gaining or losing members?
- What happens if this plant closes?
If you don’t like the answers—or can’t get straight answers—start looking around now while you still have options.
2. Run Your Component Numbers
Pull your last year’s milk test results and use the USDA’s AMS pricing calculator. Even a 0.1% bump in protein could mean $20,000-30,000 for a 500-cow herd. That usually justifies changing your breeding program.
Quick Component Math
- 500 cows × 70 lbs/day × 365 days = 12,775,000 lbs annually
- 0.1% protein increase at $3.00/lb protein value = $38,325 extra revenue
- Genetic investment payback: Often under 18 months
3. Be Honest About Your Scale Situation
If you’re running 200-700 cows, you need a clear path:
- Can you get to 1,000+ economically?
- Is there a niche market you can tap into?
- Would a neighbor lease your facilities?
These conversations are hard, but having them now beats having them in bankruptcy court.
4. Lock in What You Can
With rates where they are, converting variable debt to fixed should be priority one. Same with feed—locking in for 6-12 months gives you certainty when everything else is volatile.
What to Watch: The Next 18 Months Will Be Critical
Based on everything I’m hearing from analysts, processors, and other farmers, here’s what I’m watching:
Q2 2026: New processing capacity really kicks in. That’s when we’ll see if there’s enough milk to go around. CME futures suggest Class III stays in that $17-18 range through mid-2026.
December 1, 2025: Federal Order reforms hit. National Milk’s analysis shows this will shift millions in revenue between regions and different sized farms. If you haven’t run the numbers on how this affects you specifically, you’re flying blind.
SNAP Uncertainty: We’re talking about 42 million Americans potentially affected if Congress doesn’t act, and USDA data shows that fluid milk is the second-most-purchased SNAP item. Any disruption accelerates demand problems.
Weather Patterns: NOAA’s projecting continued La Niña conditions—drier Southwest, wetter North. That affects feed costs and cow comfort differently depending on where you are. In the Southwest, you may see higher alfalfa costs. Up north, wet conditions could impact corn silage quality.
The Bottom Line: This Transformation Creates Both Risk and Opportunity
After watching this industry for three decades, I can tell you this feels different. It’s not just about milk prices or feed costs. It’s about fundamental changes in what consumers want, where processors invest, and which farm structures can survive.
The dairy industry will absolutely continue—global demand for dairy proteins keeps growing, especially in Asia and Africa, according to FAO projections. The question isn’t whether dairy survives. It’s which dairy farmers will be part of that future.
The folks who are going to thrive are making decisions based on where the industry’s heading, not where it’s been. They’re optimizing for components because that’s what processors pay for. They’re being honest about scale economics. They’re building relationships with processors who are actually investing in growth.
What’s encouraging is that there are multiple paths to success:
- Component premiums for those who optimize
- Specialty markets for smaller operations
- Strategic partnerships for mid-size farms
- Operational efficiency for larger scales
But—and this is crucial—you have to accept that the old playbook based on volume and fluid milk demand doesn’t work anymore.
The next 18 months will probably determine which operations make it to 2030. The survivors won’t necessarily be the biggest or most efficient. They’ll be the ones who recognized early that this isn’t a cycle to wait out—it’s a transformation to navigate.
Make your decisions based on where you see your operation in five years, not where you wish the industry was going. Whether we call it transformation or just reality, the dairy industry of 2030 will look very different from 2020.
And you know what? For those who position themselves right, it might actually be more profitable.
Quick Reference: Key Metrics for Decision-Making
Component Targets for Premium Capture
- Butterfat: 4.3%+
- Protein: 3.4%+
- Daily variation: <2%
Critical Dates
- December 1, 2025: FMMO reforms are effective
- Q2 2026: New processing capacity online
Operation Size Considerations
- <200 cows: Consider specialty/niche markets
- 200-700 cows: Scale or specialize decision critical
- 1,000+ cows: Focus on efficiency and components
Financial Thresholds
- Component premium potential: $1.25-1.40/cwt
- Protein value increase (0.1%): $20,000-30,000 per 500 cows
- Debt refinancing impact: $50,000-150,000 annually
Key Takeaways:
- Component Premium Reality: Every 0.1% protein increase = $38,325 more annually (500 cows). Genetics + nutrition can achieve this in 18 months.
- Follow the $11 Billion: Processors are building cheese, yogurt, and powder plants—not fluid milk. Position yourself with growth-oriented buyers now.
- 18-Month Window: Federal Order reforms (Dec 1) and new capacity (Q2 2026) will lock in winners and losers. Your processor decisions today determine your 2030 survival.
- Three Paths Forward: Hit 4.3%+ butterfat for premiums ($1.40/cwt extra), tap specialty markets (A2 milk at $24 vs $17), or scale past 1,000 cows for efficiency.
- Mid-Size Reality: At $32 production costs vs $17 milk, 200-700 cow operations must choose: scale, specialize, or strategically exit while equity remains.
Complete references and supporting documentation are available upon request by contacting the editorial team at editor@thebullvine.com.
Learn More:
- Breeding for Components: The New Gold Standard for Dairy Profitability – This guide moves beyond theory to tactical execution, revealing the specific genetic markers (like A2A2 and Kappa-Casein) and sire selection strategies that directly translate into higher-value components and a more resilient milk check in today’s manufacturing-driven market.
- Beyond the Barn: Decoding the 2025 Global Dairy Market Signals – Understand the global “why” behind the domestic shift. This strategic analysis explores the international demand for cheese and powders driving the $11 billion in processor investment, providing crucial context on the export trends that will shape your farm’s long-term profitability.
- The Digital Feedbunk: How Precision Nutrition Tech is Unlocking Component Potential – To achieve the component targets discussed, you need the right tools. This article showcases the innovative technologies—from automated feed systems to data analytics—that allow you to optimize rations, boost milk solids, and maximize feed efficiency for a clear return on investment.
 The Sunday Read Dairy Professionals Don’t Skip.
 The Sunday Read Dairy Professionals Don’t Skip.
Every week, thousands of producers, breeders, and industry insiders open Bullvine Weekly for genetics insights, market shifts, and profit strategies they won’t find anywhere else. One email. Five minutes. Smarter decisions all week.