


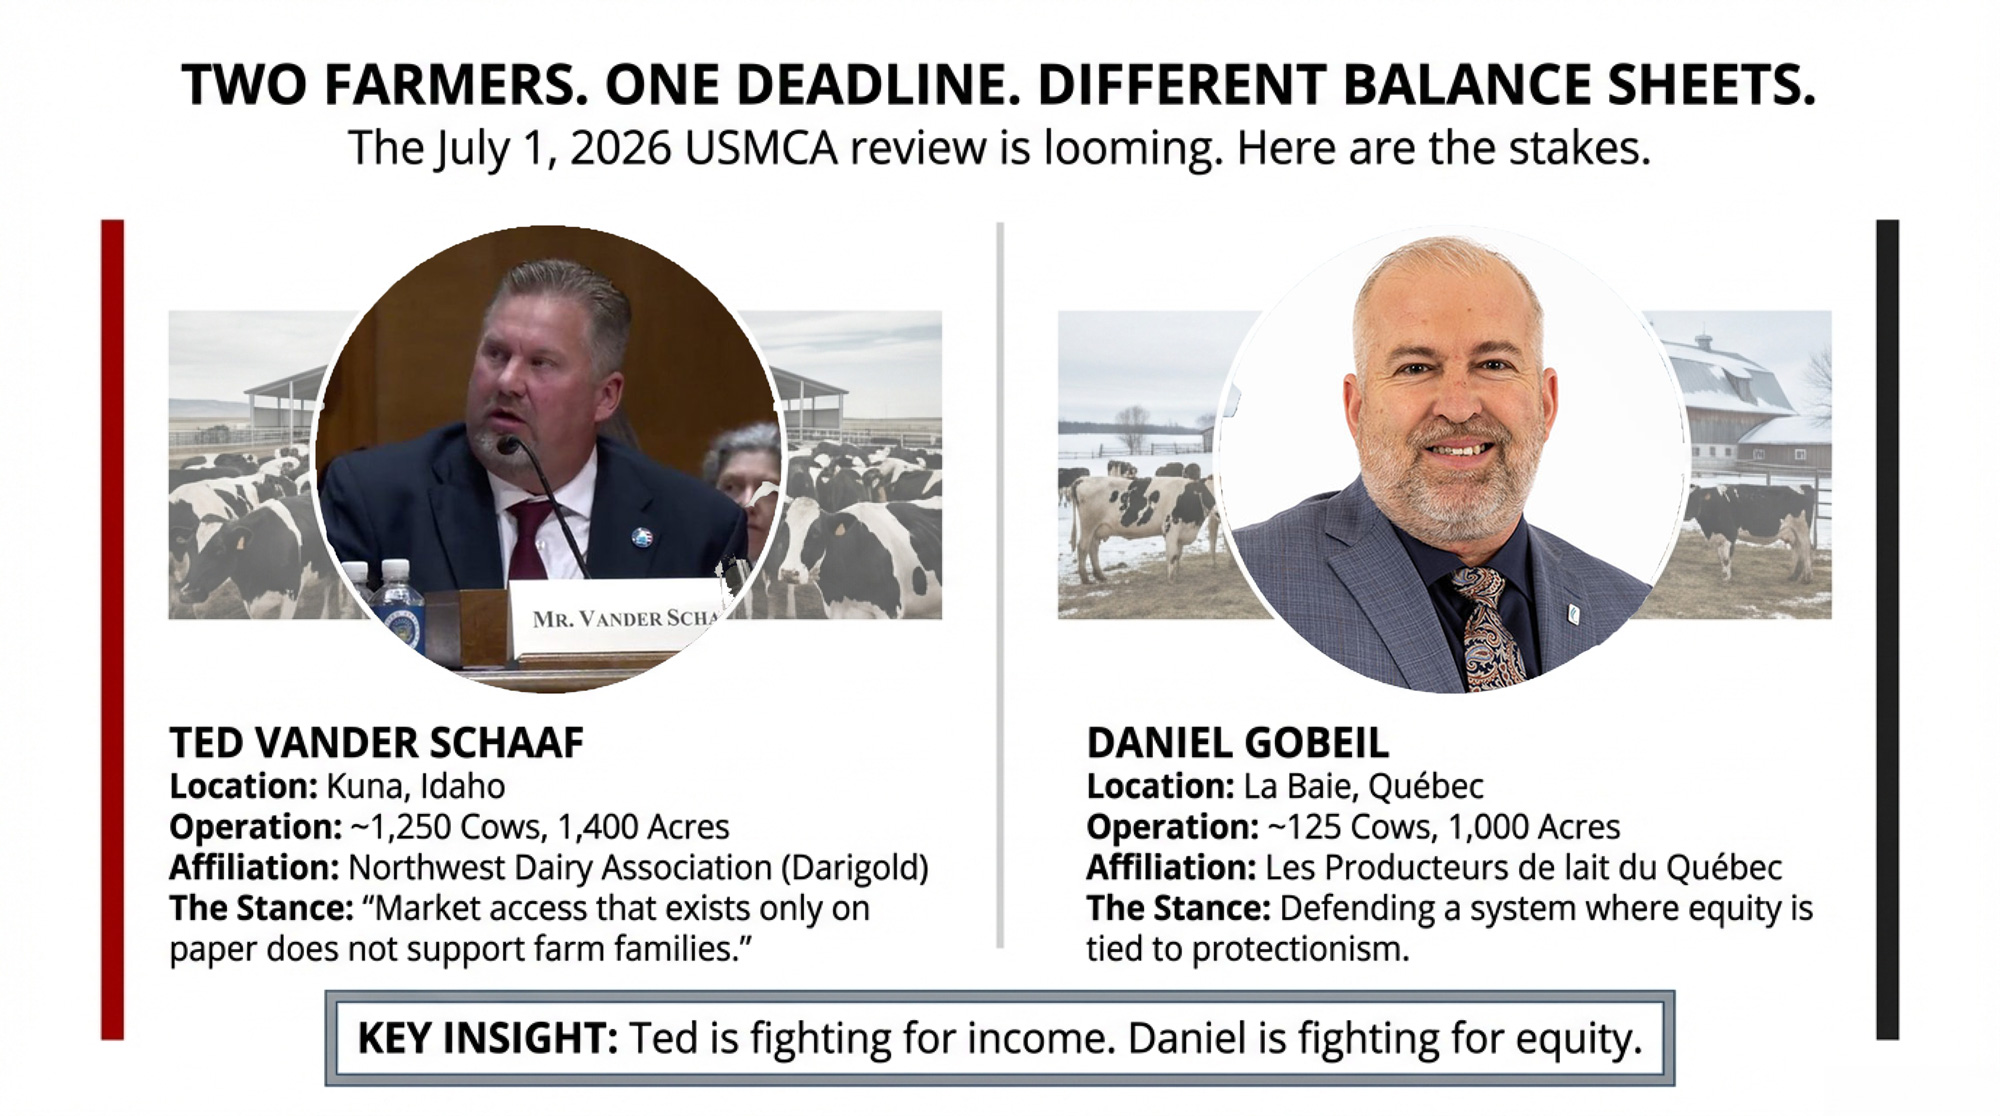
The USMCA review hits July 1. Two dairy farmers — one in Idaho, one in Québec — are watching the same deadline with completely different balance sheets at stake. Here’s the barn math for both sides of the border.
The U.S. dairy industry told the Senate this week that Canada is blocking roughly $200 million per year in dairy market access it promised under the USMCA — called CUSMA in Canada. Spread that number across American production, and the farm-level impact lands around five cents per hundredweight. Before Congress approved this deal, the U.S. International Trade Commission projected it would boost dairy exports to Canada by 43.8% — about $227 million once fully implemented (USITC Publication 4889, April 2019). Both countries are spending enormous political capital on a fight where the per-farm stakes are far smaller than either side’s press releases suggest.

On February 12, Ted Vander Schaaf delivered that case to the Senate Finance Committee. Vander Schaaf milks approximately 1,250 Holsteins near Kuna, Idaho, on 1,400 acres of forage, is a third-generation member-owner of the Northwest Dairy Association (the co-op behind Darigold), and board member of the Idaho Dairymen’s Association. “Market access that exists only on paper does not support farm families, pay employees, or justify new investment,” he told the Committee. And then the line that landed: “A firm base depends on Canada upholding their end of the bargain”.
About 1,500 kilometres northeast, Daniel Gobeil runs Ferme du Fjord in La Baie, Québec — deep in Saguenay-Lac-Saint-Jean — with about 125 lactating cows across more than 1,000 acres of barley, oats, and soybeans (DFC). Gobeil is Vice-President of Dairy Farmers of Canada and President of Les Producteurs de lait du Québec. When Vander Schaaf told the Senate that Canada isn’t upholding its end of the bargain, the implications land directly on operations like his.”
What’s Actually on the Table This July
The USMCA hits its first mandatory joint review by July 1, 2026, as required by Article 34.7. All three countries decide: extend the agreement for 16 years (to 2042), continue with annual reviews until the 2036 expiration, or walk away. U.S. Trade Representative Jamieson Greer left no ambiguity in December 2025: “Could it be exited? Yes, it could be exited. Could it be revised? Yes. Could it be renegotiated? Yes. That is the purpose of that clause, and all of those things are on the table”.
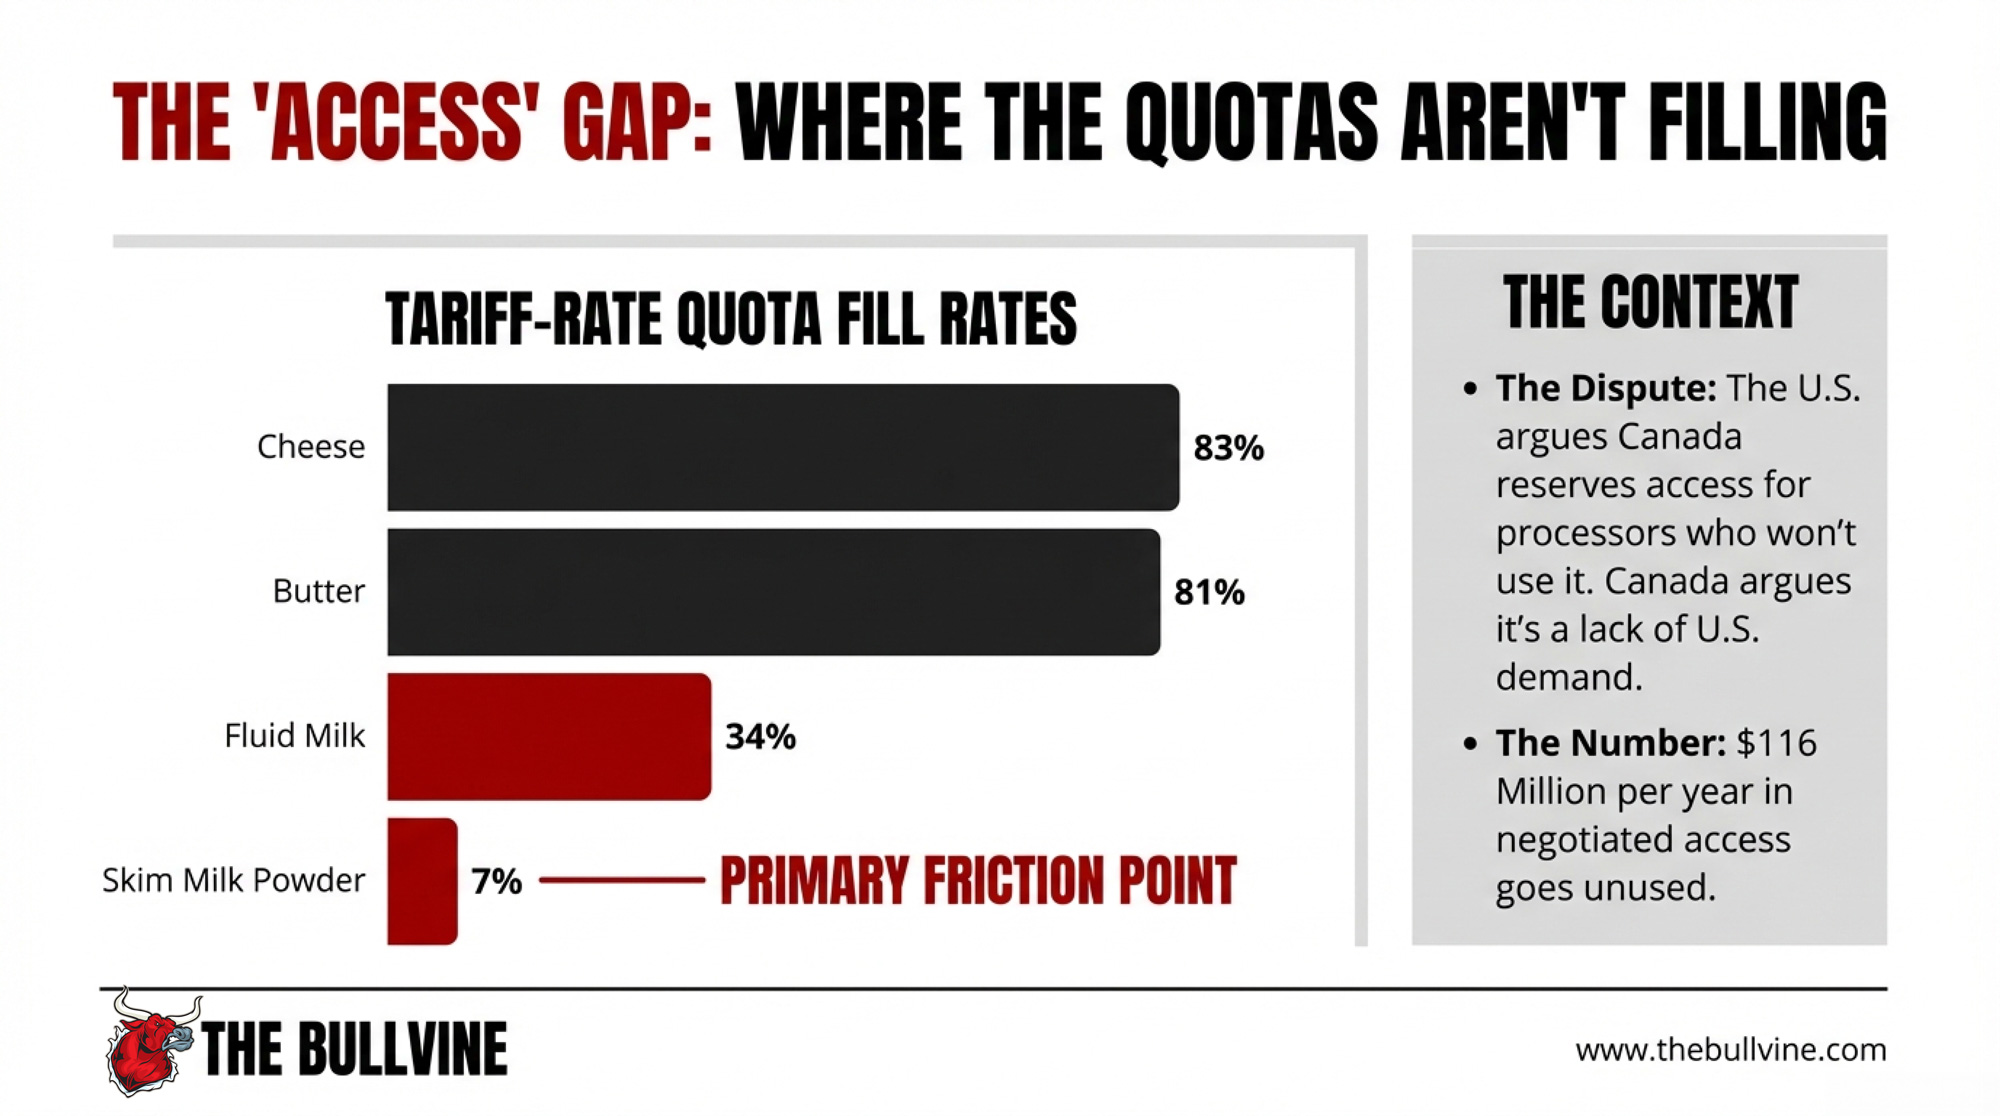
Dairy is the loudest file in the room—and the most organized. On February 4, NMPF and USDEC co-launched the Agricultural Coalition for USMCA, an industry-wide push to strengthen and renew the agreement. When the deal was signed, it opened about 3.6% of Canada’s dairy market as tariff-rate quota access — roughly US$200 million per year across 14 product categories. But those quotas aren’t filling. The overall average fill rate was just 42% in 2022/23, with 9 of 14 TRQs below half the negotiated value. More current data tells a split story:
| Product | Fill Rate | Period |
| Cheese (all types) | 83% | 2024 calendar year |
| Butter & cream powder | 81% | 2023/24 dairy year |
| Industrial cheese | 59% | 2024 |
| Milk powders | 57% | 2024 |
| Fluid milk | 34% | Cumulative |
| Skim milk powder | 7% | Cumulative |
Note: Globe & Mail figures reflect CUSMA-specific TRQs. USDA FAS data may include quotas across all trade agreements (WTO, CETA, CPTPP), which explains the variance in cheese fill rates between sources. Both are accurate within their reported scope.
Cheese and butter fill reasonably well. It’s the fluid milk and powder categories dragging the average, and those are the categories where the allocation system faces the strongest U.S. criticism. Canada argues some TRQs go unfilled because American exporters haven’t generated sufficient demand — a demand problem, not an allocation barrier. The U.S. counters that the allocation system suppresses demand by restricting who can import. A Texas Tech University causal impact study found the actual USMCA boost came in at 34% ($519 million cumulatively) — real growth, but below the USITC’s 43.8% projection, partly because “Canada’s allocation of these quotas mostly favors its own processors over U.S. exporters”.
By our math, $200 million in annual TRQ access times the 42% fill rate — roughly $116 million per year in negotiated access goes unused. That’s a lot of money from the lobby’s podium. It’s a different number from the barn.
| Metric | Lobby Number | Barn Number |
| Total annual unused TRQ access | $200M (promised) / $116M (unused at 42% fill) | — |
| Spread across 227B lbs U.S. production | — | $0.05/cwt |
| Impact on 150-cow farm (36,000 cwt/yr) | — | $1,800/year |
| Impact on 500-cow farm (120,000 cwt/yr) | — | $6,000/year |
| Impact if export lift adds $0.10–0.15/cwt | “Game-changer” (NMPF) | $3,600–$5,400/year (150-cow) |
| Average U.S. dairy cost of production | — | $19–23/cwt (USDA) |
| February 2026 all-milk forecast | — | $18.95/cwt (WASDE) |
Who’s Pushing — and Who’s Pushing Back
The U.S. says Canada designed its allocation system to block imports by reserving 80–85% of many TRQs for domestic processors who had little incentive to use them. A USMCA dispute panel ruled in the U.S.’s favour in January 2022 and ordered changes. Canada rewrote the rules. A second panel, reporting on November 24, 2023, found, by a two-to-one decision, that Canada’s revised system didn’t technically breach USMCA. The dissenting panelist argued Canada’s narrow eligibility rules “significantly limit a large number of other Canadian importers who would be eager to bring U.S. dairy products to Canada”.
On December 2, 2025, 74 bipartisan House members from dairy states, including New York, Washington, Wisconsin, and California, wrote to Greer urging him to use the 2026 review for enforcement. “NMPF and USDEC — led by President and CEO Gregg Doud, the former Chief Agricultural Negotiator at USTR — have described Canada’s TRQ policies as ‘manipulative’ and accused Ottawa of ‘circumvention’ of USMCA’s dairy export disciplines.” Vander Schaaf told senators the U.S. exported approximately $9 billion in dairy products in 2025, including a record 559,000 metric tons of cheese through November. The trajectory is up. The frustration is that Canada isn’t absorbing its share.
On the Canadian side, Prime Minister Mark Carney responded directly in December 2025. Supply management is “not on the table,” — and he answered the English-language question in French. That’s a message aimed squarely at Québec.
DFC President David Wiens — who milks about 240 cows with his brother Charles near Grunthal, Manitoba — told MPs the combined impact of CUSMA, CETA, and CPTPP means roughly 18% of Canada’s domestic dairy demand is now met by imports. When CUSMA was signed, DFC projected that cumulative concessions would displace one in five Canadian dairy products — amounting to $1.3 billion in annual farm-gate losses once fully phased in. Both sides believe they’re defending survival — $1.14 billion in U.S. dairy exports to Canada in 2024, a record, and part of a $3.6 billion flow to Mexico and Canada that accounts for 44 percent of total U.S. dairy export value. On the other side: CA$4.8 billion in federal compensation flowing to supply-managed sectors.
Why the Same Commodity Pays Two Different Mortgages
The single biggest difference between Vander Schaaf’s milk check and Gobeil’s: how the price gets set.
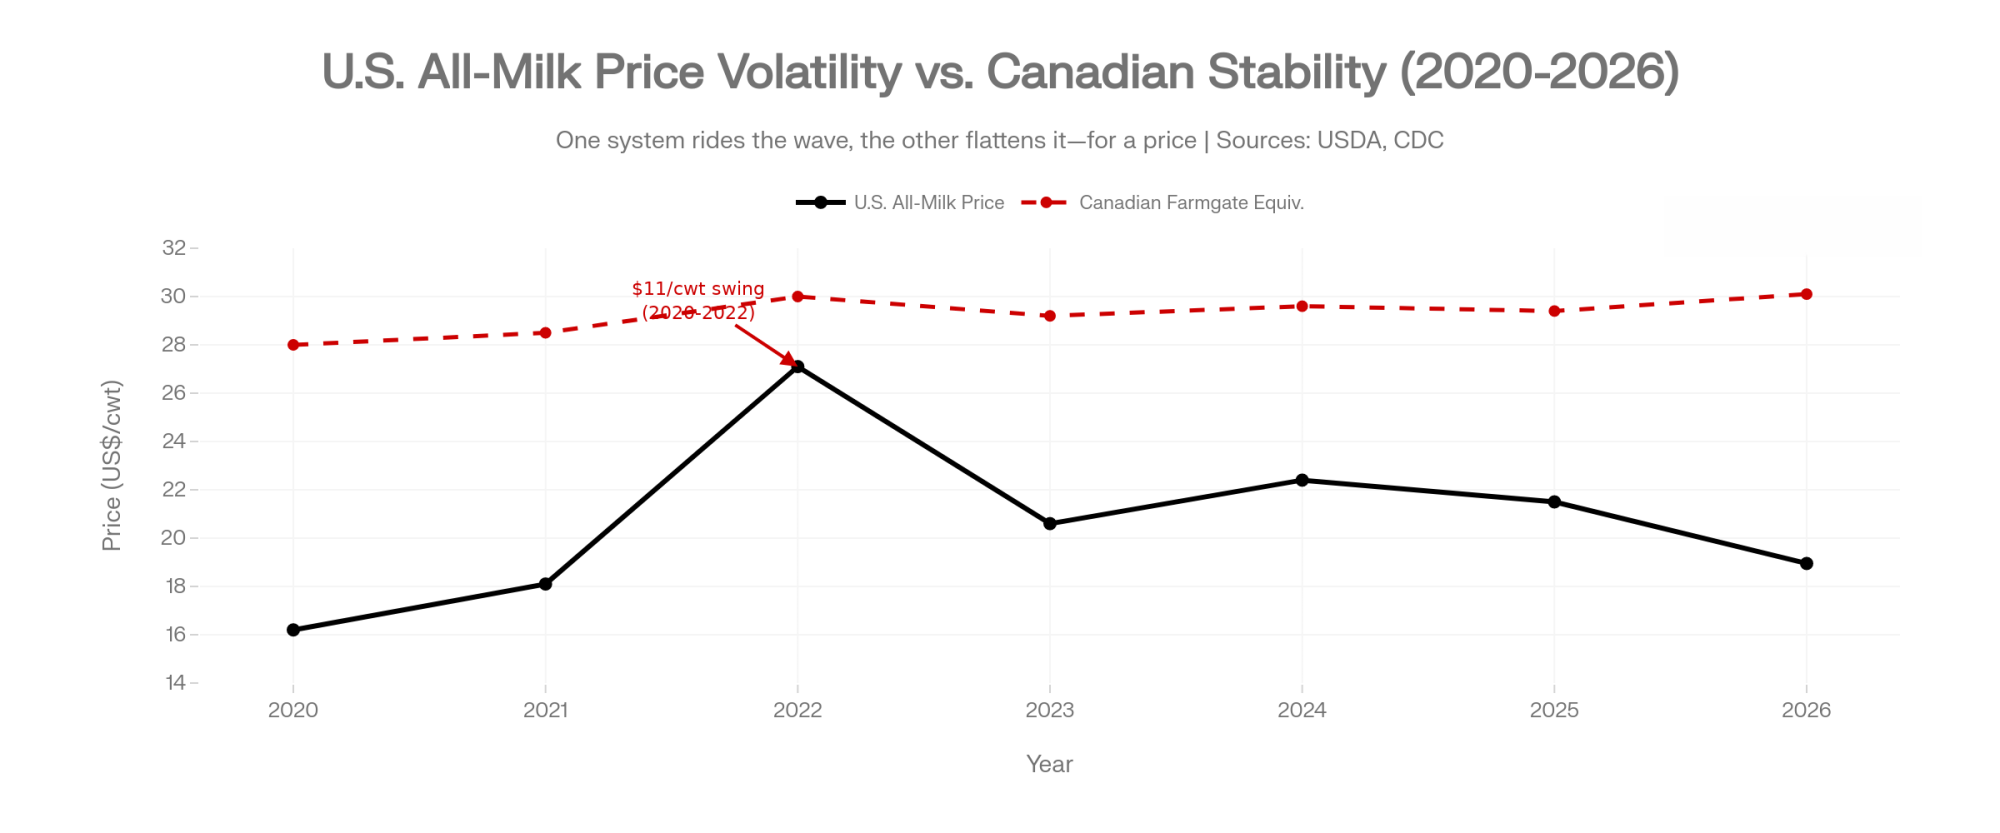
In the U.S., the base price flows from Class III/IV futures and commodity markets. USDA’s February 2026 WASDE projects the all-milk annual average at US$18.95/cwt — but January’s Class III came in at just $14.59/cwt. The back half of the year has to do heavy lifting to hit that average. The safety net is Dairy Margin Coverage: insurance, not a guaranteed price. Over the last five years, U.S. all-milk prices swung from roughly $16.20 in 2020 to $27.10 in 2022 — an $11/cwt range.
| Year | U.S. All-Milk Price (US$/cwt) | Canadian Equivalent (US$/cwt) |
|---|---|---|
| 2020 | $16.20 | $28.00 |
| 2021 | $18.10 | $28.50 |
| 2022 | $27.10 | $30.00 |
| 2023 | $20.60 | $29.20 |
| 2024 | $22.40 | $29.60 |
| 2025 | $21.50 (est.) | $29.40 |
| 2026 | $18.95 (forecast) | $30.10 (forecast w/ 2.3% increase) |
In Québec, the Canadian Dairy Commission surveys actual production costs each year and adjusts the farmgate price to cover them. The formula: 50% of the change in the indexed cost of production, 50% of the change in the consumer price index. That produced the 2.3255% farmgate increase effective February 1, 2026 — tied to input costs and inflation, not commodity markets in Chicago. Canadian farmgate prices move in a narrow band, roughly US$28–30/cwt equivalent at the 2025 average exchange rate, against that $11 U.S. swing.
But that stability comes stapled to a different kind of risk. In the P5 provinces — Ontario, Québec, New Brunswick, Nova Scotia, and PEI — quota trades at a cap of CA$24,000 per kilogram of butterfat per day. A cow producing 1.2–1.3 kg BF/day means a per-cow quota value around CA$28,800–$31,200. In western Canada, it’s higher — Alberta’s quota traded at CA$56,495/kg BF/day in January 2025, and Manitoba’s at CA$44,000. On Gobeil’s 125-cow Québec farm, that’s roughly CA$3.6–3.9 million in quota value — an asset that exists only as long as Ottawa keeps defending it.
One system charges you in income volatility. The other charges you in political risk locked inside your balance sheet.
What Does the USMCA Review Mean for a 150-Cow Wisconsin Dairy?
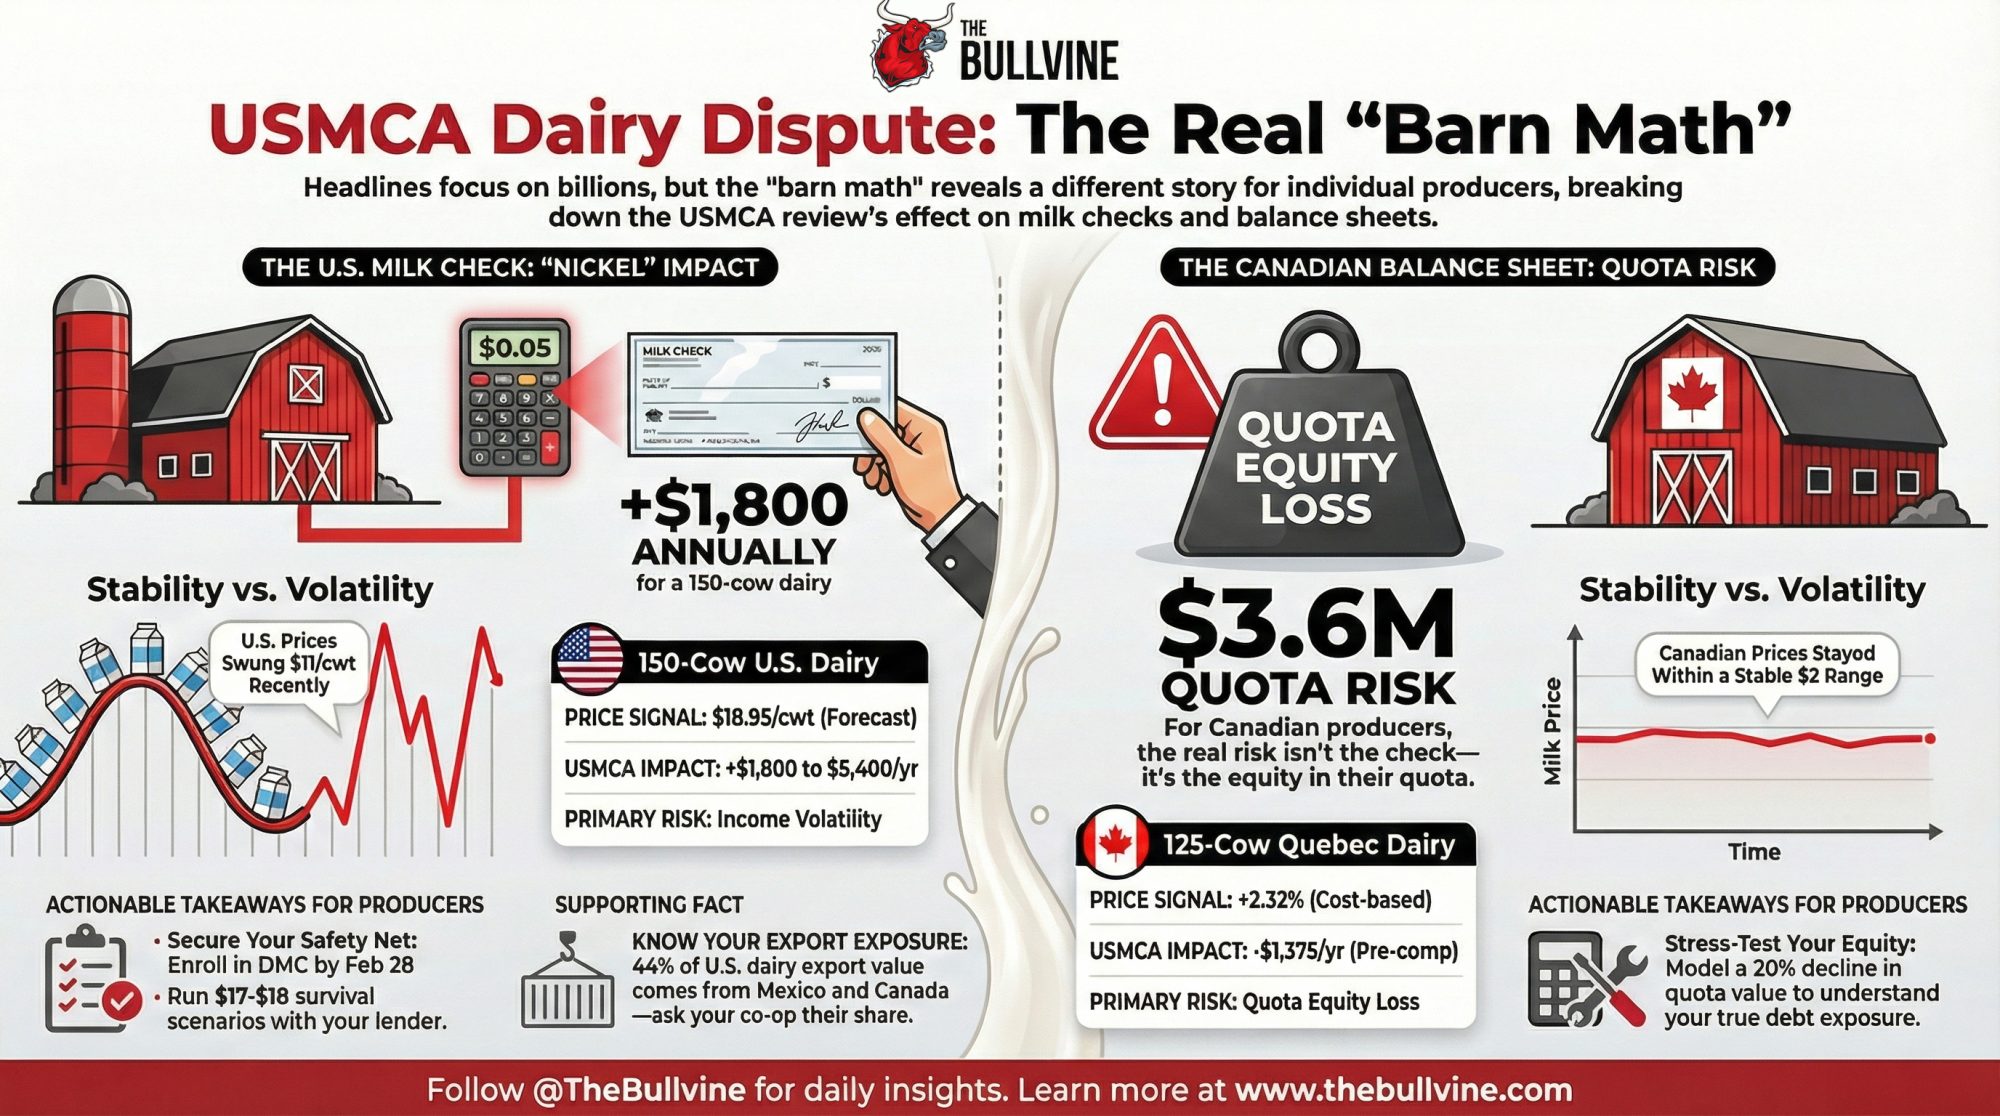
Here’s where the barn math gets humbling. Spread across 227 billion pounds of annual U.S. production, the raw math on $116 million in unused TRQ access works out to about $0.05/cwt nationally. Five cents.
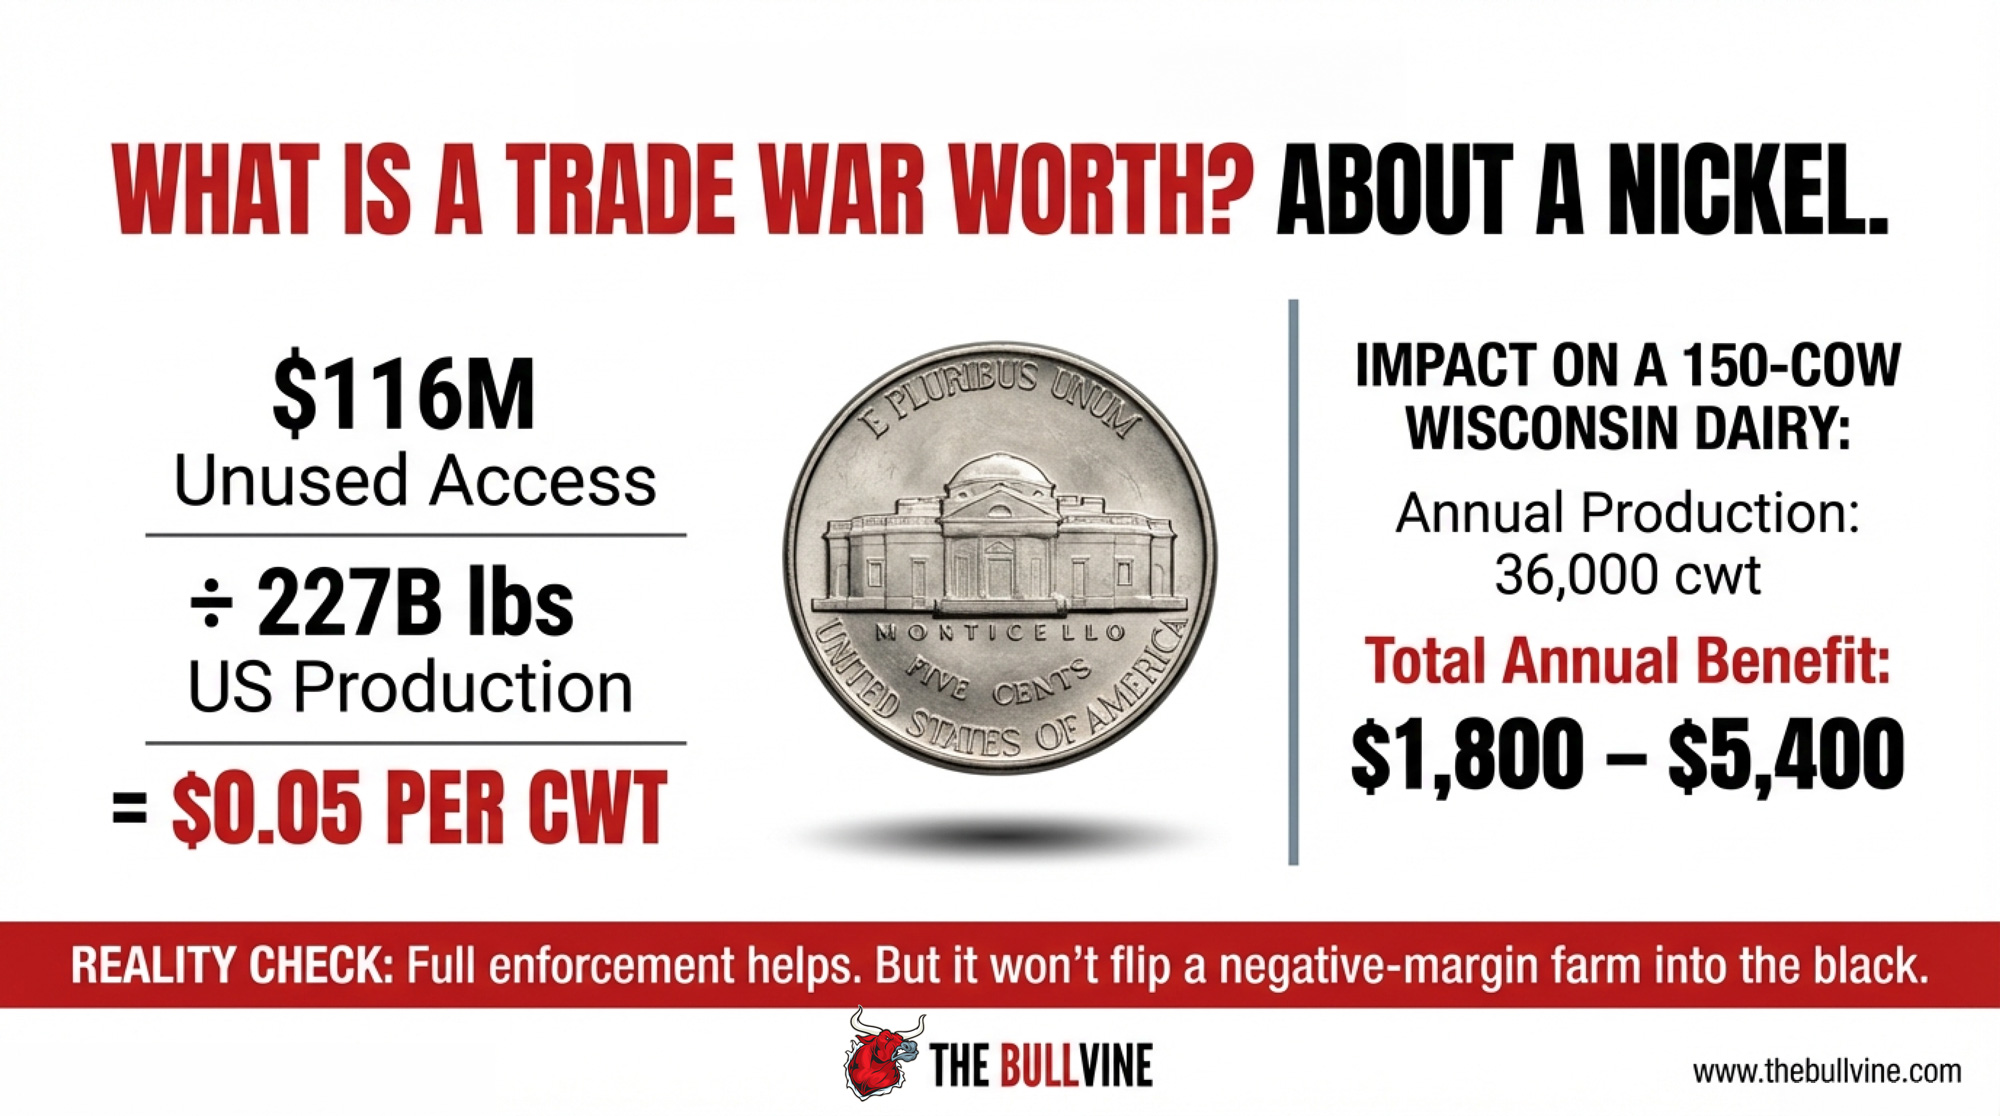
Take a 150-cow Wisconsin dairy producing 24,000 lbs per cow. That’s 36,000 cwt per year. At $0.05/cwt, full TRQ enforcement is worth roughly $1,800 annually. Scale to a 500-cow operation producing 120,000 cwt, and it’s $6,000 — still not survival money.
But trade access lifts demand signals across the domestic market. Cornell dairy economist Charles Nicholson, working with Wisconsin’s Mark Stephenson, estimated that each additional 1% of U.S. dairy components exported lifts the all-milk price by about $0.12/cwt (95% CI: half a cent to $0.24/cwt). Their own conclusion: “it would be appropriate to be cautious in estimating the magnitude of price impacts from US dairy exports.” As exports grow, supply grows roughly in step.
| Herd Size | Annual Production (cwt) | Direct TRQ Impact ($0.05/cwt) | Optimistic Export Lift ($0.10–0.15/cwt) | Total Potential Gain | Cost of Production ($/cwt) | 2026 Forecast ($/cwt) | Margin Gap |
|---|---|---|---|---|---|---|---|
| 150 cows | 36,000 cwt | $1,800/yr | $3,600–$5,400/yr | $5,400–$7,200/yr | $19–23 | $18.95 | −$0.05 to −$4.05 |
| 500 cows | 120,000 cwt | $6,000/yr | $12,000–$18,000/yr | $18,000–$24,000/yr | $19–21 (scale advantage) | $18.95 | −$0.05 to −$2.05 |
| 1,250 cows(Vander Schaaf) | 150,000 cwt | $7,500/yr | $15,000–$22,500/yr | $22,500–$30,000/yr | ~$19 (scale advantage) | $18.95 | −$0.05 |
Apply that framework. Filling the remaining $116 million wouldn’t move the export needle by a full percentage point. Even at the generous end of Nicholson’s range, you’re looking at $0.10–$0.15/cwt in total price lift. On 36,000 cwt, that’s $3,600 to $5,400 per year for our 150-cow Wisconsin dairy.
Set that against cost reality. USDA ERS data (2021 ARMS survey, published July 2024) shows farms with 2,000+ cows averaging $19.14/cwt in full economic cost, while herds under 50 cows hit $42.70/cwt. Analysts pegged mid-size net cost of production at $22.64/cwt. A 150-cow operation in that $19–23/cwt range — receiving a forecast of $18.95 — is treading water or running red before trade even enters the picture. An extra $1,800 to $5,400 helps. It won’t flip a negative-margin farm into a positive one.
What a Nickel Means for a 125-Cow Québec Quota Farm
Now flip the border. If those TRQs fill completely, cheese is already at 81–83%, so the real incremental pressure comes from powder and fluid categories. On 125 cows producing roughly 27,500 cwt per year, a nickel-per-hundredweight hit works out to about $1,375 annually. Ottawa cushions that — CA$1.2 billion over six years through the Dairy Direct Payment Program alone for CUSMA. Minister Bibeau confirmed in November 2022 that the combined package across three trade deals reaches CA$4.8 billion.
But every round of “access goes up, Ottawa writes a bigger cheque” adds weight to a political question. That CA$4.8 billion comes from general federal revenue — Canadian taxpayers. FCC’s 2026 dairy outlook advises producers to “continue focusing on what they can control on the farm” until the details of the CUSMA review are known. Sensible. It’s also what you say when you don’t know how the politics will break.
The bigger exposure isn’t the milk cheque. It’s the balance sheet. A 20% decline in quota value on Gobeil’s 125-cow operation at the P5 cap means roughly CA$720,000–$780,000 in equity gone. If you’re running 500+ cows in Alberta at CA$56,495/kg BF/day, your exposure is roughly double the P5 math. Your stress test looks different.
Are These Farmers Actually on Opposite Sides?
The easy version — American dairy vs. Canadian dairy, free market vs. supply management — misses what’s happening to both of them.
Vander Schaaf’s 1,250-cow Idaho operation and Gobeil’s 125-cow Québec farm are both getting squeezed by the same forces — processors, retailers, global commodity traders — and dealing with it through completely different systems. The American system absorbs that pressure through farmer income. The Canadian system absorbs it through government spending and quota valuation. Neither pushes the pressure back up the chain to the players who actually control pricing power.
If both sides “win” their version of the 2026 review — full TRQ enforcement for the U.S., intact supply management plus compensation for Canada — it doesn’t fix either farmer’s structural problem. It determines who bleeds a little slower.
The Border Math, Side by Side
| Metric | 150-Cow Wisconsin Dairy | 125-Cow Québec Dairy |
| Price mechanism | Class III/IV futures + commodity markets | CDC formula (50% COP + 50% CPI) |
| Farmgate price (5-year range) | ~US$16.20–$27.10/cwt (2020–2022) | ~US$28–30/cwt equivalent |
| 2026 price signal | $18.95/cwt forecast (WASDE Feb 2026) | 2.3255% increase eff. Feb 1, 2026 |
| Annual production | ~36,000 cwt | ~27,500 cwt |
| USMCA impact (full TRQ enforcement) | +$1,800–$5,400/yr | −$1,375/yr (before compensation) |
| 5-year price volatility | ~$11/cwt swing | ~$2–4/cwt swing |
| Safety net | DMC + crop insurance | Supply management + CA$4.8B federal compensation |
| Balance-sheet risk | Land + cows + equipment | Land + cows + equipment + ~CA$3.6–3.9M quota |
The math doesn’t pick a winner. It shows two different bills for the same thing: stability.
What You Can Do Before July
If you’re milking in the U.S.:
- Enroll in DMC before February 28. Tier 1 coverage expanded from 5 million to 6 million pounds under the One Big Beautiful Bill Act (signed July 4, 2025). At $9.50 coverage, you’re paying $0.15/cwt in premium. Lock in for six years (2026–2031) at a 25% premium discount — but that means you can’t adjust if your herd grows or margins recover. If you’re above 6 million lbs (roughly 275+ cows at the national average production), Tier 1 covers only a fraction. Talk to your risk management advisor about Dairy Revenue Protection or Livestock Gross Margin for the rest.
- By spring: Run a survival scenario at US$17–18/cwt with your lender. If your breakeven sits above $18, work the restructuring math before margins compress — not after.
- Before July: Ask your co-op: “What percentage of our milk ends up in Canada or Mexico, and what’s our contingency if USMCA stalls?” Mexico and Canada purchased $3.6 billion in U.S. dairy products in 2024, accounting for 44 percent of total U.S. dairy exports.
If you’re milking in Canada:
- Pull your own cost-of-production numbers and compare them against the CDC’s national average. If you’re not participating in COP surveys, you’re relying on your neighbours’ data while your livelihood depends on the results.
- Watch the protein shift. FCC’s 2026 dairy outlook flags that both P5 and WMP are restructuring producer pay to incentivize more protein and less butterfat. If your herd tests 4.5% BF and 3.4% protein, you’re roughly neutral. Push butterfat higher without matching protein, and your gross revenue could drop by 1.2% under the new WMP structure. Factor that into breeding and ration planning alongside trade uncertainty.
- By spring, model a 20% decline in the quota value with your lender. Not because that’s likely — but because you should know the answer before you need it. If you’re carrying debt against quota collateral, ask what their haircut assumptions are. FCC’s 2026 dairy outlook is worth reading alongside your balance sheet.
- Before July: Watch two signals. First, CDC pricing bulletins — are they still citing cost of production and CPI as drivers, or are words like “affordability” or “competitiveness” creeping in? That language shift is your early-warning system. Second, provincial quota exchange reports. In January 2025, Ontario moved 405.98 kg BF/day at the CA$24,000 cap. Firm volume at the cap means the market believes the system holds. Watch for softening.
Both sides: Don’t let the trade conversation be somebody else’s problem. Your milk check is already a trade document.
Key Takeaways:
- The USMCA dairy fight is huge in headlines ($200M–$1.14B), but the farm‑level effect is small: roughly 5¢/cwt or $1,800–$5,400/year for a 150‑cow U.S. herd.
- Canadian supply management trades income stability for political and balance‑sheet risk: US$28–30/cwtstability on the milk cheque, but CA$3.6–3.9M in quota equity exposed to Ottawa’s trade decisions.
- Full TRQ enforcement and a “win” for U.S. dairy won’t rescue a negative‑margin farm; survival still comes down to cost control, risk management (DMC/DRP/LGM), and co‑op strategy.
- For Canadian producers, the real USMCA/CUSMA risk isn’t this year’s milk price; it’s possible quota repricing, so you need to stress‑test a 20% equity hit with your lender.
- If you don’t know your co‑op’s export exposure, your breakeven, or your quota‑value stress line, you’re flying blind into the 2026 review — your milk cheque is already a trade document.
The Bottom Line
Vander Schaaf delivered his testimony and returned to his Idaho operation. Gobeil, 1,500 kilometres north, leads the organization representing every Québec dairy farmer who’ll feel whatever the July review decides. Both face the same July deadline. Both will judge the outcome by the deposit on their next milk cheque. The question for you isn’t which system is better — it’s whether you know your own numbers well enough to plan around whatever comes out of that review.
When the USMCA review panel reports this summer, we’ll re-run the barn math for both sides of the border in our Border Math series. What does your co-op’s export breakdown look like? What’s your breakeven?
Complete references and supporting documentation are available upon request by contacting the editorial team at editor@thebullvine.com.
Learn More
- More Milk, Fewer Farms, $250K at Risk: The 2026 Numbers Every Dairy Needs to Run – Breaks down the brutal 2026 margin gap that trade deals alone can’t fix. It arms you with a survival checklist to bridge the $2.00/cwt deficit between current futures and your real cost of production.
- USMCA Termination Countdown: Will Your Farm Survive The North American Trade War? – Exposes the high-stakes political triggers that could turn the July 2026 review into a total market reset. Gain a 36-month positioning strategy to protect your equity from a projected 25% border tariff “nuke.”
- Your Cheese Plant’s New Bacteria Can Run 56% Faster – Why This Technology Decides Which Processors (and Farms) Survive 2030 – Delivers a radical look at CRISPR-optimized fermentation that determines which processors will actually fill USMCA quotas. It reveals how a 30% throughput gain at the plant level dictates your future milk check security.
 Join the Revolution!
 Join the Revolution!
Join over 30,000 successful dairy professionals who rely on Bullvine Weekly for their competitive edge. Delivered directly to your inbox each week, our exclusive industry insights help you make smarter decisions while saving precious hours every week. Never miss critical updates on milk production trends, breakthrough technologies, and profit-boosting strategies that top producers are already implementing. Subscribe now to transform your dairy operation’s efficiency and profitability—your future success is just one click away.


