You can’t outbreed 70/25/5 by April. The only question is whether you fix your ration and cash flow before it costs $900/cow.
EXECUTIVE SUMMARY: Western Canada’s April 1, 2026, shift to a 70/25/5 payment ratio is the clearest signal yet that protein and solids‑non‑fat now drive far more of your milk cheque than they used to. Retail and utilization data show yogurt and cheese still growing, butter stocks at five‑year highs, and CDC Class 3(d) and 4(a) prices that put real money on protein, not just butterfat. For high‑fat, lower‑protein herds—think 4.5–4.7% butterfat and 3.0–3.1% protein—modeled scenarios with 2025 prices point to a possible $80,000–$100,000 annual hit on a 100‑cow herd under the new ratio, or roughly $900 per cow and 8.5–9.0 cents per litre. The problem is you can’t breed your way out of that by April, because even with genomics, shifting herd‑level components usually takes four to six years of consistent sire selection and culling. So the real play over the next 12–24 months is tightening up nutrition to add 0.10–0.20 points of protein, re‑aiming sire choices and genomic sorting toward balanced fat and protein kilos, and reworking cash‑flow with your lender before the lower cheques arrive. The article also walks straight into the succession conversation, since a 15‑point change in component weighting—and talk of more to come in 2027—forces families to rethink risk, investment, and what it really means to pass a quota‑based dairy to the next generation. And when you zoom out to U.S. Federal Order reforms, and EU forecasts that favour cheese over butter and powders, it’s clear this isn’t a one‑off Western policy quirk but part of a global shift toward paying harder for solids and yield.
If you sit down at a winter producer meeting in Western Canada right now, you don’t get too far into the coffee before the same topic comes up: that new component ratio change landing on April 1, 2026.
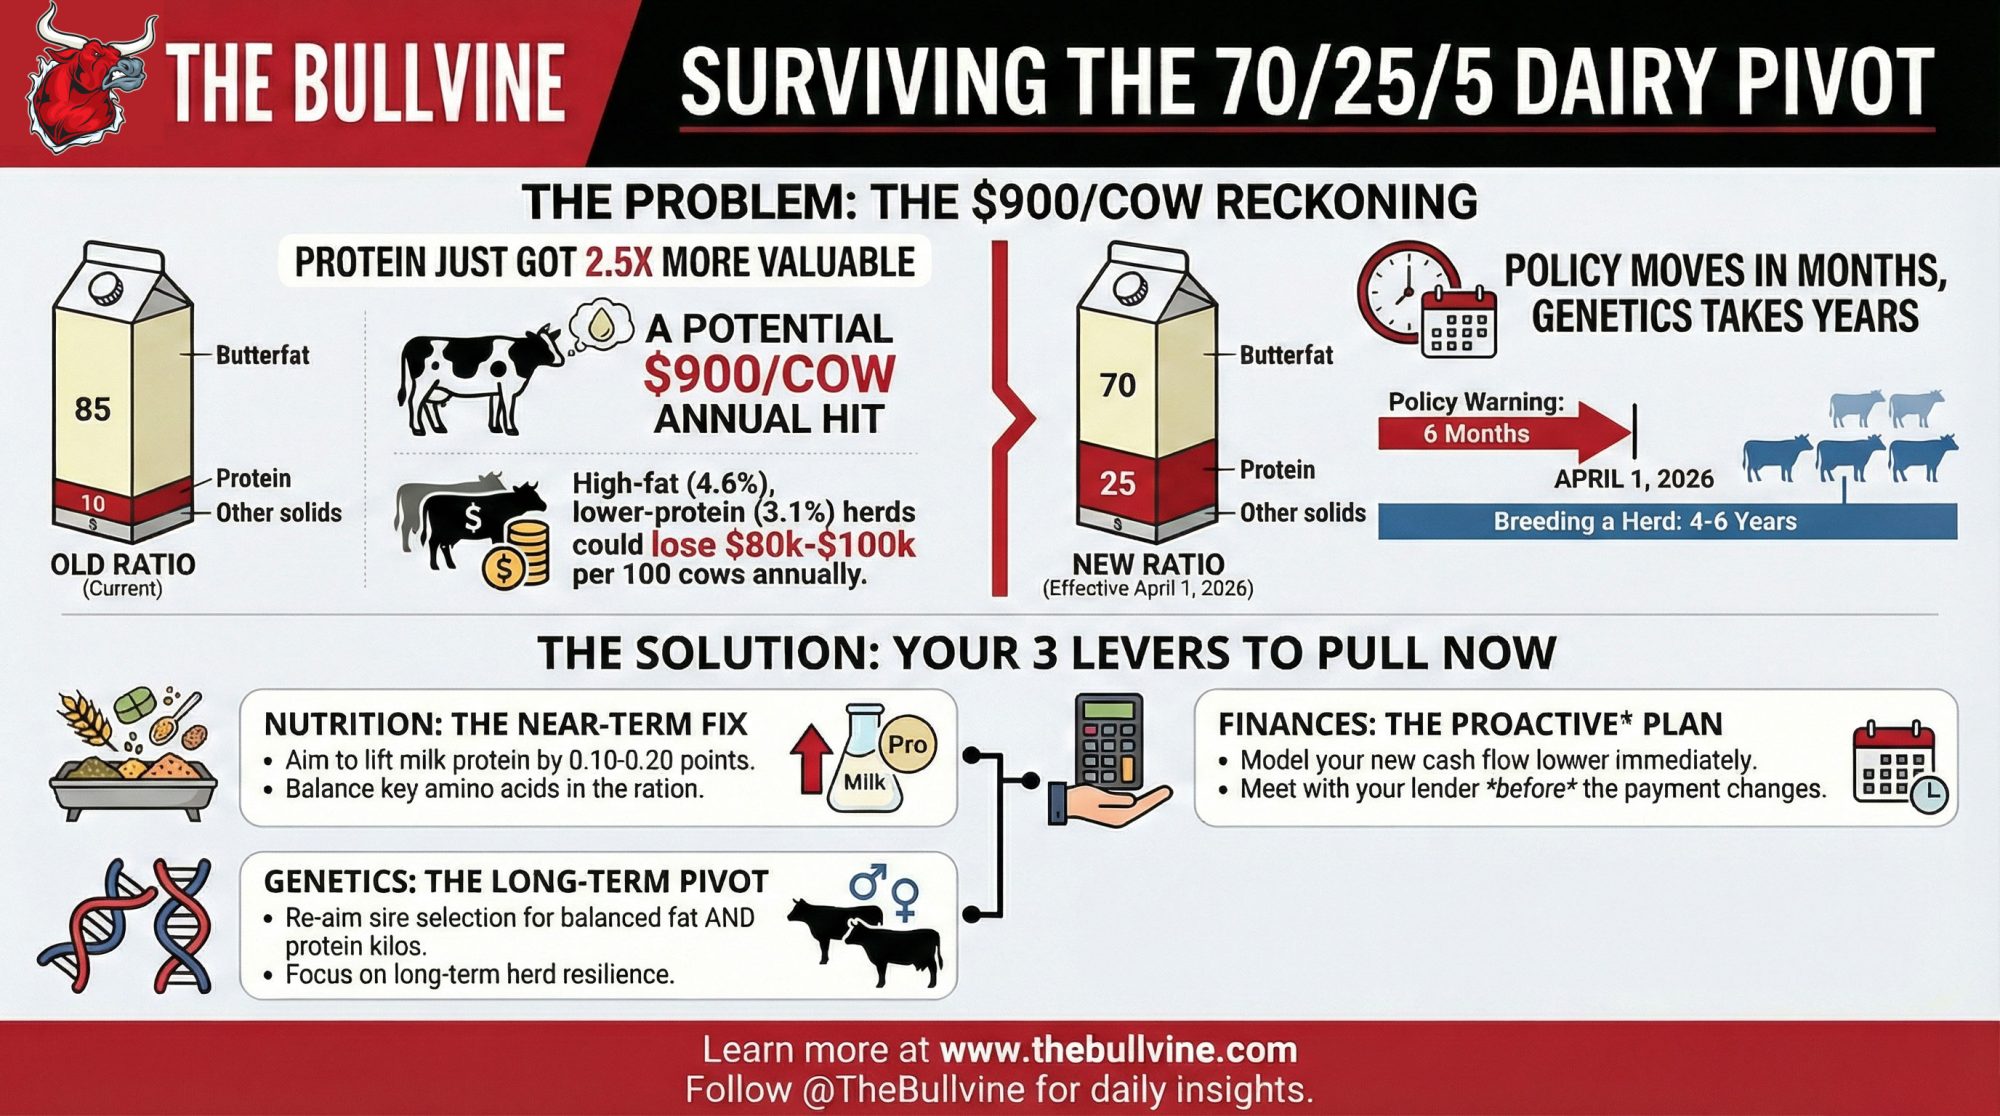
You probably know the basics already. The Western Milk Pool boards—BC Milk, Alberta Milk, SaskMilk, and Dairy Farmers of Manitoba—are moving from the long‑standing 85% butterfat / 10% protein / 5% other solids weighting to a new structure of 70% butterfat, 25% protein, and 5% other solids for allocating pool dollars to producers. That’s laid out clearly in BC Milk’s October 9, 2025, Notice to Producers, so it’s not rumour; it’s policy.
| Component | Old Ratio (Until March 31, 2026) | New Ratio (From April 1, 2026) | Change |
| Butterfat | 85% | 70% | -15 points |
| Protein | 10% | 25% | +15 points |
| Other Solids | 5% | 5% | No change |
What’s interesting here—and what I’ve noticed is really bothering people—is the timing. For years, most Western herds have been bred and fed for strong butterfat performance because that’s what the cheque rewarded. Now the rules shift with only a few months’ lead time, while herd genetics need several years to change direction.
So you’ve got policy moving on a six‑month clock and cows moving on a four‑to‑six‑year clock. That gap is where the uneasiness lives.
Looking at this trend, the aim here is pretty simple: make sense of why the ratio changed, what the data suggests about markets and pricing, and what practical levers you still have—nutrition, genetics, and finances—during this transition period.
Why the Ratio Changed: Following the Value Chain
If you read BC Milk’s explanation, they’re quite clear about the intent. The new 70/25/5 ratio is being introduced to support increased milk volume in the Western Milk Pool to meet industrial processing commitments—whole milk powder and other manufacturing uses—and to encourage butterfat tests to stabilize rather than keep climbing.
And when you look at the numbers across Canada, that story holds up.
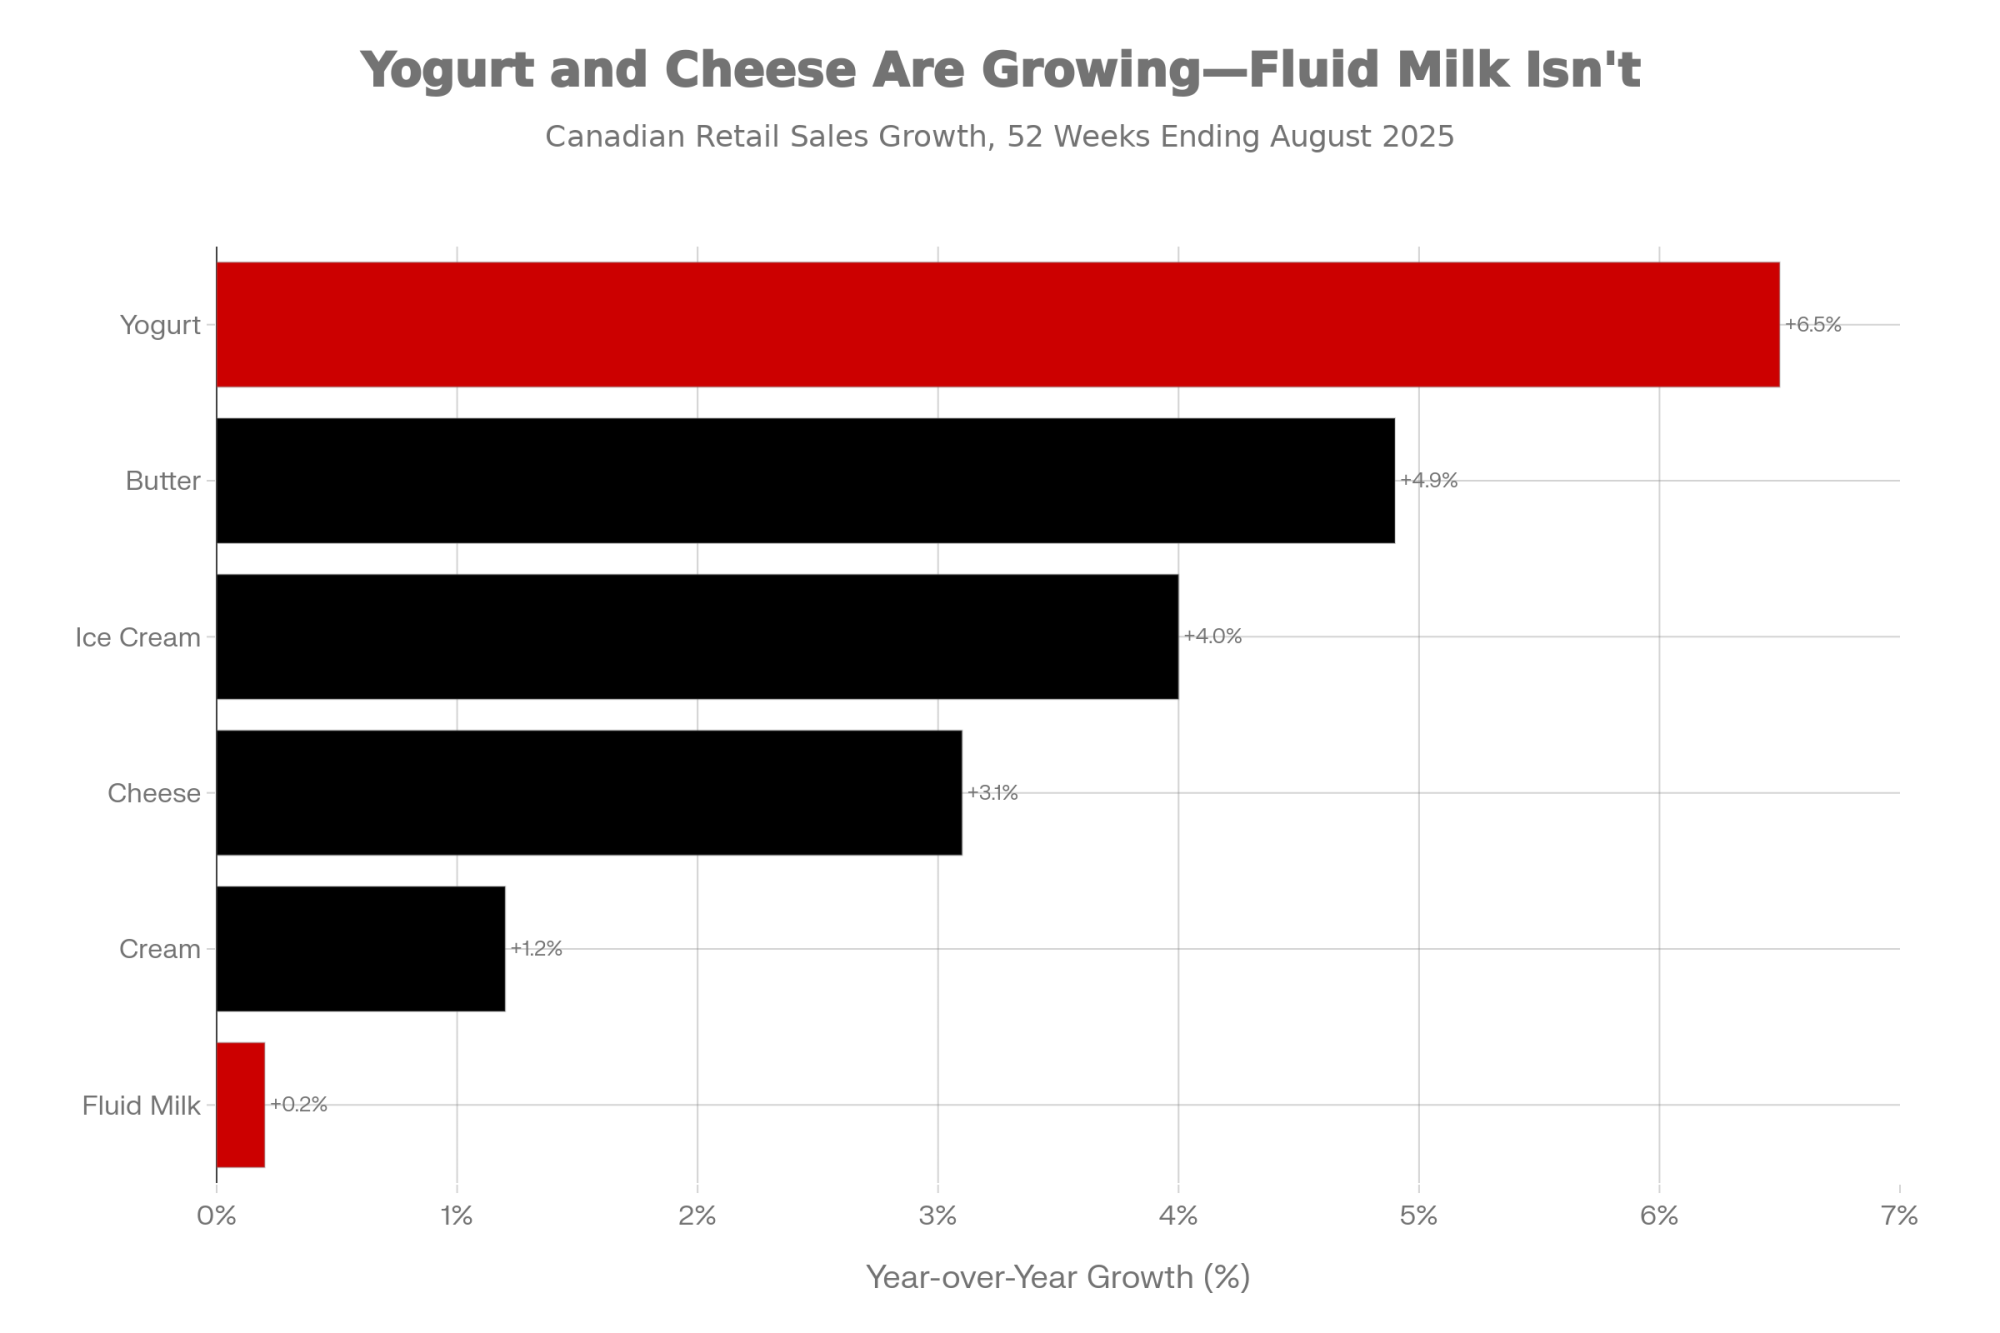
In its September 2025 Markets Report, Dairy Farmers of Ontario summarized national retail sales for the 52 weeks ending August 2, 2025. Yogurt was the standout, up 6.5 percent year‑over‑year; butter was up 4.9 percent, cheese 3.1 percent, ice cream 4.0 percent, cream 1.2 percent, and fluid milk barely budged at 0.2 percent.
| Product Category | YoY Growth (%) |
|---|---|
| Yogurt | +6.5% |
| Butter | +4.9% |
| Ice Cream | +4.0% |
| Cheese | +3.1% |
| Cream | +1.2% |
| Fluid Milk | +0.2% |
The data suggests demand is still solid, but the real growth is coming from products that lean heavily on protein—like yogurt and many cheese types—rather than from plain fluid milk.
At the same time, stock levels tell another part of the story. That same DFO report showed butter stocks at 41,063 tonnes in July 2025—the highest level in five years—and cheese stocks at 108,038 tonnes, also historically high for that month.
Farmtario’s November 2025 analysis added that butterfat‑equivalent production in September 2025 was up 4.48 percent compared to a year earlier, while butterfat imports over the prior 12 months were up 10.18 percent. Put simply, the system isn’t short of fat.
Now layer in component pricing. The Canadian Dairy Commission’s 2025–26 component schedules show that in Class 3(d)—cheese and related products—butterfat is priced at $11.3565 per kilogram, protein at $9.7035, and other solids at $0.8921.
| Component | CDC Class 3(d) Price ($/kg) | CDC Class 4(a) SNF Price ($/kg) | Payment Weighting (Old vs New) |
| Butterfat | $11.36 | N/A (Class 4a is SNF) | 85% → 70% |
| Protein | $9.70 | ~$2.82 (protein + OS) | 10% → 25% |
| Other Solids | $0.89 | Included in $2.82 SNF | 5% → 5% |
In Class 4(a) solids‑non‑fat, the protein and other solids price for fall 2025 sits around $2.82 per kilogram. And in the special Class 5 ingredient/export categories, both protein and butterfat carry strong values, enabling processors to compete internationally with powders and other products.
If we glance south, the pattern lines up. As part of Federal Milk Marketing Order modernization, USDA has been working with updated standard composition factors—roughly 3.3 percent true protein, 6.0 percent other solids, and 9.3 percent nonfat solids—to better match actual milk composition.
Recent USDA class and component price bulletins, summarized in outlets like Cowsmo and Hoard’s Dairyman, have shown months when Class III protein has been close to $3 per pound while butterfat has sat noticeably lower, often in the mid‑one‑dollar range per pound. Values move month to month, but the relationship has frequently favoured protein in cheese milk.
So this development suggests that the boards are trying to align the producer pay structure with where value is truly being created in the chain. Butterfat still matters—no one’s taking that off the table—but under 85/10/5, protein’s contribution was under‑recognized relative to what markets were paying for it.
It’s worth noting one more line in the BC Milk notice. They mention that, if required, a further change may be applied in 2027 to decrease component “densities” to accommodate growth in volume. That tells you this is not viewed as a one‑time tweak, but part of a longer journey in how milk is valued in the Western Milk Pool.
How 70/25/5 Shows Up on Your Milk Cheque
You know as well as anyone that ratios don’t feel real until you run them through a herd. So let’s walk through a simple, realistic example. This is a modeled scenario using typical Western Canadian component levels and current CDC values—not someone’s actual settlement, but it shows the direction.
Herd A: High Butterfat, Lower Protein
- 100 cows
- About 10,500 litres per cow per year (10,500 hL shipped)
- Components: 4.6% butterfat, 3.1% protein, ~5.8% other solids
Herd B: Balanced Components, Slightly Higher Volume
- 100 cows
- About 11,000 litres per cow per year (11,000 hL shipped)
- Components: 4.1% butterfat, 3.5% protein, ~6.0% other solids
Under 85/10/5, Herd A has been the star. As many of us have seen in Western DHI summaries, herds with butterfat levels of 4.5–4.7% have consistently ranked near the top of payout lists for years.
Under 70/25/5, when you apply those weights with current Class 3(d) values, Herd A still benefits from strong butterfat performance, but Herd B’s extra protein and slightly higher volume dramatically close the gap. In quite a few realistic price combinations, a balanced herd like B can edge ahead on net dollars per cow.
To put some rough numbers on it, advisors modeling real farms with similar profiles using recent CDC prices have seen cases where a high‑fat, lower‑protein 100‑cow herd’s annual milk revenue under the new ratio pencils out $80,000–$100,000 lower than under 85/10/5, while a more balanced herd might see only minor changes.
| Herd Profile | Under 85/10/5 (Baseline) | Under 70/25/5 | Revenue Change |
|---|---|---|---|
| Herd A (High fat: 4.6% BF / 3.1% Protein, 10,500 L/cow) | $0 (baseline) | -$90,000 | -$90,000 |
| Herd B (Balanced: 4.1% BF / 3.5% Protein, 11,000 L/cow) | $0 (baseline) | -$5,000 | -$5,000 |
If you spread a $90,000 hit over 100 cows, that’s about $900 per cow per year. On a per‑hectolitre basis for Herd A (10,500 hL), that’s roughly 8.5–9.0 cents per litre in modeled scenarios. Your exact numbers will differ, but the direction is clear: the further out on the “fat‑heavy/protein‑light” end your herd sits, the more exposed your cheque is.
What’s interesting here is that many of the herds most at risk are also some of the best‑run operations on butterfat. They did exactly what the previous payment structure encouraged. That’s the sting.
The Real Tension: Policy Moves in Months, Genetics in Years
Here’s where the frustration really surfaces when you talk with producers and geneticists.
Genomic selection has absolutely changed the game. Industry reports and peer‑reviewed work show that AI programs have shortened sire generation intervals from roughly 5–7 years to around 2–3 years, enabling much faster genetic gain in traits like fat and protein. Hoard’s Dairyman, for instance, has highlighted how these “unprecedented genetic gains” are driving record component levels even in periods when total milk volume flattens.
But on a commercial dairy, you live with herd structure and replacement rates. In practical terms, it looks more like this:
- You breed a heifer to a more protein‑balanced bull this year.
- She calves in roughly two years.
- She reaches peak performance in the second lactation, another year out.
- Her daughters start meaningfully influencing the bulk tank a couple of years after that.
University extension specialists and genetic advisors generally agree that it takes around four to six years of consistent sire selection and culling for a new breeding emphasis to show up clearly in bulk tank butterfat and protein levels. That lines up with what producers in Western Canada, the Upper Midwest, and the Northeast have seen when they’ve tried to shift components on their own herds.
Now set that against the policy timeline:
- October 9, 2025: BC Milk and the other Western boards issue the notice announcing the shift to 70/25/5.
- April 1, 2026: the new ratio takes effect.
So policy moved on a roughly six‑month timeline, while biology—through genetics—needs four to six years to respond fully. That’s the core tension farmers are feeling.
| Timeline Type | Start | End | Duration |
|---|---|---|---|
| Policy Change (85/10/5 to 70/25/5) | October 2025 | April 2026 | 6 months |
| Herd Genetic Shift (meaningful bulk tank change) | Breeding decision today | Bulk tank impact | 48–72 months (4–6 years) |
What farmers are finding is that the herds that look “fortunate” right now are often the ones that started nudging toward higher protein and more balanced components around 2021–2023. Some were watching Ontario’s solids‑non‑fat and SNF:BF policy adjustments in the P5 pool and realizing excessive butterfat relative to SNF could be penalized.
Others were paying attention to how often U.S. Class III prices were placing a premium on protein in cheese milk compared to butterfat. Their early decisions are walking into the parlour now, while many other herds are just beginning that pivot.
So the question becomes: if genetics is a four‑to‑six‑year lever, where can you still move the needle in the next 12–24 months?
Where You Still Have Levers to Pull in 2026
The good news is that genetics aren’t the only lever you have. Producers across Western Canada—and, honestly, across regions like Wisconsin and New York as well—are leaning hard on three major fronts: nutrition, breeding strategy, and financial planning.
Looking at Nutrition: Adding Protein Without Losing Butterfat or Fresh Cows
On the nutrition side, the question that keeps coming up is, “Can we pick up some protein without hurting butterfat performance or making fresh cow management riskier?”
Recent peer‑reviewed milk quality and nutrition reviews, along with university feeding trials, show that balancing key amino acids—especially methionine and lysine—can lift milk protein yield and often nudge protein percentage up by about 0.10–0.20 points when the base ration (forage quality, effective fibre, starch) is solid. That effect is strongest in early and mid‑lactation cows when energy balance is good.
In many Western rations this season, that’s translating into:
- Adding rumen‑protected methionine and lysine and aiming for a metabolizable protein profile with a lysine: methionine ratio around 2.8–3.0:1, which is consistent with extension recommendations and controlled studies.
- Budgeting typical costs in the range of 15–25 cents per cow per day for these protected amino acid products, which pencils out to roughly $5,500–9,000 per year for a 100‑cow herd based on common product pricing in North American ration budgets.
- Seeing protein percentage gains in the 0.10–0.15 point range in many well‑managed herds, with some trials and field reports showing improvements up toward 0.20 points when all other ration basics are well aligned.
On top of that, nutritionists are re‑examining the balance between energy and fibre in high‑fat herds.
Where cows are sorting TMR or where there are signs of subacute rumen acidosis, it’s common to see underperformance in milk protein and, sometimes, unstable butterfat. Adjustments like moderating starch levels, improving forage chop consistency, and increasing the share of high‑quality legume or grass‑legume forage can improve rumen function and help cows convert dietary protein into milk protein more efficiently.
Western diets have long relied on canola meal as a rumen-degradable protein source, and research from Canadian and U.S. universities supports its positive effect on milk protein yield when used correctly in TMRs. Some producers are now fine‑tuning canola or expeller soybean meal levels in high‑producing groups to shore up protein without driving starch or unsaturated fat too high.
What’s encouraging is that none of these changes require blowing up the ration. The goal isn’t to tank fat just to chase protein. It’s to:
- Keep butterfat performance stable and respectable.
- Protect cow health and fresh cow management through this transition period.
- Capture that 0.10–0.20% protein improvement that’s now worth more under 70/25/5.
To make it even more concrete: if a 100‑cow herd can sustainably move protein from 3.1% to 3.25% without sacrificing butterfat or health, that extra protein can easily be worth several thousand dollars a year under the new weighting, depending on exact prices and volumes. It’s not a silver bullet, but it’s real money.
| Intervention | Cost per Cow per Day | Realistic Protein Gain (percentage points) | Annual Cost (100-Cow Herd) | Est. Annual Revenue Gain Under 70/25/5 (100-Cow Herd) |
| Rumen-Protected Methionine & Lysine | $0.15–$0.25 | +0.10 to +0.20 | $5,500–$9,000 | $8,000–$15,000 |
| Improved Forage Quality & TMR Balance | Variable (forage cost) | +0.05 to +0.10 | Varies by operation | $3,000–$8,000 |
| Canola/Soy Meal Optimization | $0.05–$0.10 | +0.05 to +0.10 | $1,800–$3,600 | $3,000–$8,000 |
| Combined Nutrition Strategy | $0.20–$0.35 | +0.15 to +0.30 | $7,300–$12,800 | $12,000–$25,000 |
Looking at Genetics: Re‑aiming Without Erasing Past Gains
On the genetics side, most producers are rightly treating this as a course correction, not a full reset.
What farmers are finding is that a few clear rules of thumb help re‑aim the program:
- Put more emphasis on protein kilos alongside fat kilos. Many Western and Upper Midwest herds are now setting minimums of +35–40 kg protein and +35–45 kg fat for bulls, then checking that daughters are projected to land around 3.4–3.5% protein and 4.0–4.2% butterfat at realistic production levels—profiles that align with both Canadian and U.S. component pricing trends.
- Use indexes that reflect your market. In Canada, that often means putting more weight on LPI or custom indexes that emphasize protein and functional traits, rather than relying solely on Net Merit, which is calibrated to U.S. conditions. In Wisconsin and the Northeast, similar shifts toward protein‑friendly indexes have been observed as processors reward higher protein.
- Use genomic testing as a sorting tool, not a luxury. At roughly $30–40 per head, genomic tests give a much clearer picture of which heifers and young cows carry the best combination of components, fertility, and health traits. Field data from AI organizations and extension programs show that herds using genomics this way can accelerate progress by:
- Breeding the top 20–30 percent to sexed dairy semen to build the next generation.
- Using conventional dairy or beef‑on‑dairy in the middle tier according to replacement needs.
- Using beef semen on the lowest tier and planning to cull those lines more quickly.
I recently sat down with a producer in central Alberta—190 Holsteins, a mix of free‑stall and dry lot systems, managing about 2.3 kg of quota per day—who’s been working through this with his herd advisor, a licensed independent genetics and nutrition consultant.
He said, “We didn’t do anything wrong, breeding for fat when that’s what was being paid for. Now we just need to pivot, and we know that’s going to take a few years. The goal for us is not to panic, but to make sure every heifer we keep from here on out is pointed in the right direction.”
That mindset mirrors what geneticists with major AI organizations and extension specialists have been urging in recent conferences and webinars.
What’s interesting here is that similar thinking is already well established in high‑protein U.S. cheese regions. In Wisconsin operations, for example, herds supplying specialty cheese plants have deliberately moved toward sires with stronger protein and balanced fat, and those choices now show up in their bulk tank tests and pay statements. Western Canada is essentially being nudged toward that same “balanced components” zone by the 70/25/5 shift.
Looking at Finances: Turning a Shock into a Managed Transition
The third major lever—and it’s easy to overlook when we’re focused on cows—is how you manage the money through this transition period.
What lenders and farm financial advisors are recommending, in both Canadian and U.S. dairy regions, is remarkably consistent:
- Build a realistic 12–24 month cash‑flow projection that reflects your current components under the new ratio. That means taking your actual DHI butterfat and protein tests, applying the 70/25/5 allocation, and using realistic price assumptions based on CDC component tables and board guidance to sketch how your milk cheque might look from April onward.
- Sit down with your lender before the first reduced cheque shows up. Past experience with policy and price shocks—including recent farm‑gate price adjustments in Canada and supply‑driven squeezes in the U.S.—shows that producers who come in early, with numbers and a plan, have more options: interest‑only periods on term loans, temporary increases to operating lines, or adjusted covenant targets.
- Be selective with big capital projects. In many operations, this may not be the year to stretch for a new loader or major barn expansion unless the balance sheet is very strong. At the same time, investments that clearly support cow performance—improved ventilation, transition cow facilities, repro tools—can still make sense if you can quantify the payback in milk and components, as multiple cost‑of‑production studies have shown.
- Protect the investments that actually drive revenue. Economic work on dairy cost structures consistently shows that cutting corners on nutrition consulting, hoof care, repro programs, or fresh cow management often costs more in lost production and health problems than it saves in fees.
If you put some numbers to it, that modeled $80,000–$100,000 revenue impact on a 100‑cow high‑fat herd is roughly $6,500–$8,500 per month. Knowing that ahead of time lets you and your lender decide whether to make ration changes, temporary credit adjustments, capital deferrals, or some combination of all three to cover that gap.
In Ontario, Midwest, and Northeast operations, we’ve seen this pattern over and over: farms that do the cash‑flow homework and engage their lenders early tend to navigate policy and price changes with less long‑term damage. Western herds can draw on that same playbook here.
The Succession Question That’s Hard to Ignore
There’s another layer to this story that doesn’t appear in any price table: how the change intersects with succession.
In recent years, many Western farms had fairly clear succession timelines. A son or daughter was coming back from an ag diploma program, or a long‑time employee was gradually buying in. The underlying assumption was that while class prices might swing, the basic structure of producer payments wouldn’t change dramatically over a six‑month period.
Now, after a 15‑point swing in component weighting announced in October 2025 and effective in April 2026—and with the possibility of further adjustments mentioned for 2027—some families are re‑examining what they’re asking the next generation to commit to.
Farm transition specialists and lender‑side advisors have been increasingly explicit that policy risk needs to sit alongside debt and asset values in these conversations.
What farmers are finding in succession meetings this winter is that the most constructive approach is full transparency:
- Share projected revenue scenarios under 70/25/5 using real component data and realistic price bands.
- Explain the steps being taken in nutrition, genetics, and finance to adapt.
- Be clear about debt levels, risk tolerance, and time horizon for the current generation.
Then let the next generation respond. Some will say, “I see the challenge, but I still want in.” Others may decide to build their careers in allied sectors—such as nutrition companies, genetics firms, lenders, or equipment dealers—while maintaining a more gradual or partial involvement in the farm.
Similar patterns have been observed in California (around water and environmental regulation) and in Wisconsin (during periods of extreme Class III price volatility), where policy and market risks shaped when and how the next generation entered ownership.
What’s encouraging, based on both research and experience, is that families who have these discussions early and honestly tend to land on more durable long‑term arrangements, whether that means full succession, shared ownership, or a different path altogether.
How This Fits Into the Bigger Dairy Picture
If you zoom out beyond Western Canada, the 15‑point shift is part of a broader pattern in how milk is being valued.
In the U.S., modernization of Federal Orders and ongoing debates over pricing formulas are aimed at aligning producer pay more closely with what plants actually make and what customers buy—cheese, powders, butter, and fluid products.
Recent analyses in Hoard’s Dairyman and Dairy Herd Management have highlighted that even when national milk volume softens, component levels—especially butterfat and protein—have continued to climb thanks to genetics and focused nutrition.
Globally, market reports from sources such as Dairy Global and DairyReporter show strong, steady demand for whole milk powder, skim milk powder, whey products, and cheese, with butter prices moving alongside a broader, solids‑driven landscape. The longer‑term trend has favoured higher solids and more flexible ingredient production, and Canada’s special class pricing is structured to help processors compete in that environment.
Here at home, the Western boards’ move to 70/25/5 is one regional expression of this bigger shift. It’s an effort to ensure that the signals producers see in their milk cheques are more closely aligned with retail demand, processing economics, and international market conditions.
Pulling It Together: What Producers Can Do Next
If we were standing in a barn alley or catching up at a conference, and you asked, “So what do I actually do with all of this?” here’s how it boils down:
- The 70/25/5 shift is anchored in real market signals. Retail data points to strong growth in protein‑dense products like yogurt, stock levels show no shortage of fat, and component prices—both here and in the U.S.—have been rewarding protein in several key classes.
- Breeding for butterfat under 85/10/5 wasn’t a mistake. Western herds that pushed butterfat performance were responding exactly to what the pay structure incentivized. The issue isn’t what those herds did; it’s that policy has now moved faster than herd genetics can keep up.
- Genetics are a slower but powerful lever. Even with genomics, you’re looking at roughly 4 to 6 years of consistent sire selection and culling to shift herd‑level butterfat and protein levels materially. The bull decisions you make over the next couple of years are really about where you want your components to be around 2030.
- Nutrition can help in the near term. Thoughtful use of rumen‑protected amino acids, good forages, balanced starch and fibre, and solid fresh cow management can often add 0.10–0.20 percentage points of protein in many herds. Under 70/25/5, that’s worth more than it used to be.
- Balanced cows are your safest long‑term bet. Herds targeting both solid butterfat and solid protein, rather than extremes on either side, tend to be the most resilient when pricing formulas or markets change.
- Financial planning matters as much as ration planning. Honest cash‑flow projections, early lender conversations, and disciplined choices about where to invest (and where to wait) can turn a sudden policy shock into a managed transition rather than a crisis.
- Succession plans deserve a fresh, honest look. This isn’t about pushing the next generation away from dairy. It’s about making sure they understand both the opportunities and this newer layer of policy risk, where pricing structures can change faster than biology.
Your 90‑Day Playbook
If you’re wondering what to do between now and April, here’s a simple action list:
- Pull your last 12 months of DHI component records and model your milk cheque under 70/25/5 using current prices.
- Sit down with your nutritionist to set a realistic protein target and a stepwise plan to get there without hurting butterfat or fresh cows.
- Re‑screen your sire list and adjust your selection criteria to favour balanced fat and protein kilos, plus health traits.
- Book a meeting with your lender to walk through your modeled cash‑flow and discuss options for the transition period.
The Bottom Line
What’s encouraging, after looking at the data and talking with producers, advisors, and researchers, is that the tools needed to navigate this change are the same ones that have always mattered: good cows, good forages, thoughtful fresh cow management, disciplined breeding, realistic numbers, and open conversations at home and with your advisory team.
As many of us have seen—whether on Western Canadian freestall herds, Wisconsin tie‑stall dairies, or Northeast dry lot systems—dairy farmers are remarkably good at adapting when they understand the rules of the game.
This component shift is a big adjustment, no doubt. But with clear information, measured changes in how you feed and breed, and proactive financial planning, there’s every reason to believe Western herds can come through this transition and still be milking strongly when the next generation is the one hosting the coffee in the kitchen.
KEY TAKEAWAYS:
- Protein just got 2.5× louder on your cheque: Western Canada’s 70/25/5 ratio takes effect April 1, 2026—what you ship in protein now matters almost as much as butterfat.
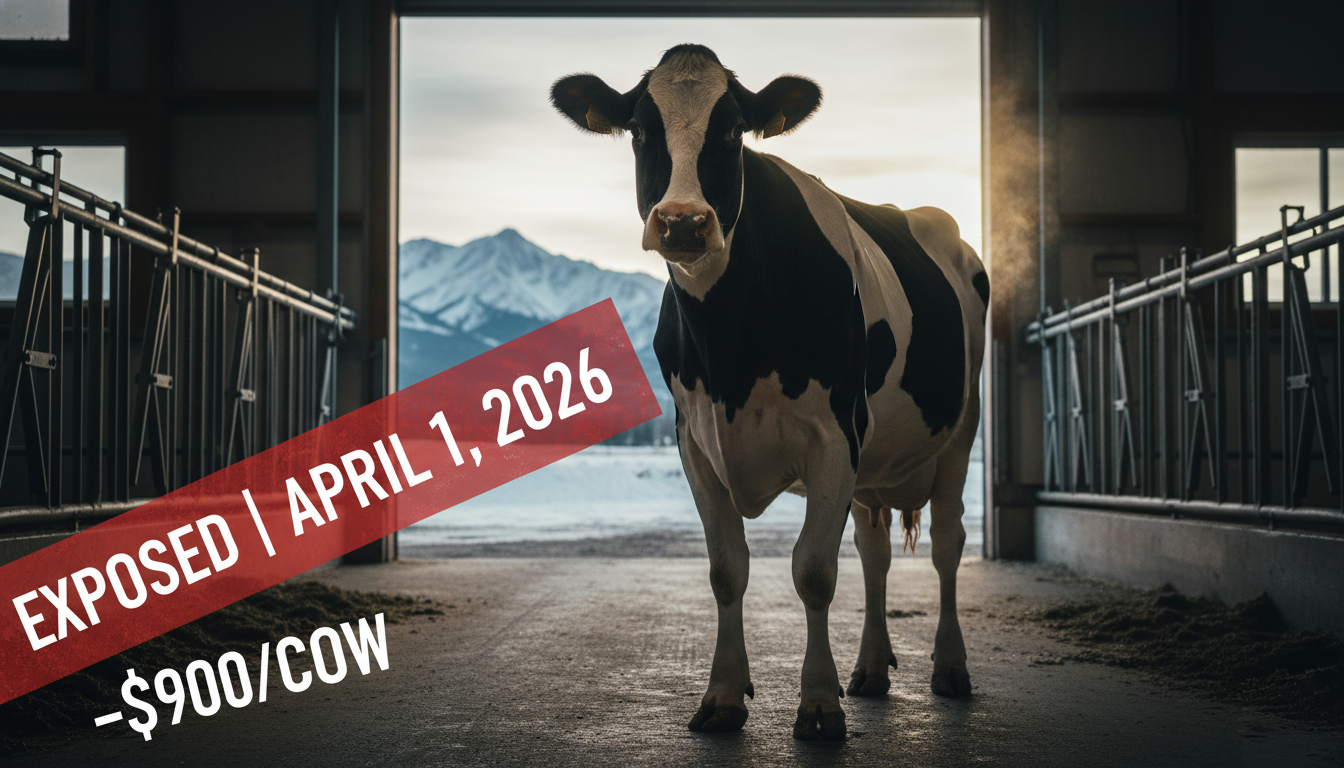
- Top butterfat herds face the biggest hit: Modeled scenarios show a 100-cow herd at 4.6% fat / 3.1% protein could lose $80,000–$100,000/year under the new ratio—roughly $900/cow.
- You can’t outbreed this by April: Genetics need 4–6 years to shift bulk-tank components materially; policy gave you six months.
- Three levers to pull now: Dial in amino-acid nutrition for 0.10–0.20 pt protein gain, re-screen sires for balanced fat + protein kilos, and sit down with your lender before the smaller cheques arrive.
- Succession plans need a policy-risk conversation: A 15-point swing—with 2027 changes floated—means the next generation deserves full transparency on what they’re really buying into.
Complete references and supporting documentation are available upon request by contacting the editorial team at editor@thebullvine.com.
Learn More
- Seizing the Moment: Maximizing Milk Solids Output Through Strategic Nutrition and Genetics – Stop guessing on your TMR and start capturing every cent of component premiums. This guide arms you with specific nutrition targets and supplement ROI math to lift protein yields and secure your cheque before the April deadline.
- Bred for $3 Butterfat, Selling at $2.50: Inside the 5-Year Gap That’s Reshaping Genetic Strategy – Exposes the dangerous timing gap between your breeding pen and the bulk tank. You’ll gain the strategy needed to hedge against market volatility, ensuring your future cows fit the 2030 payout structure, not just yesterday’s prices.
- Genetic Revolution: How Record-Breaking Milk Components Are Reshaping Dairy’s Future – Reveals how massive processing expansions and genomic “decoupling” are permanently moving the goalposts on milk value. It delivers the foresight to position your operation as a high-component leader while others are still chasing empty volume.
 Join the Revolution!
 Join the Revolution!
Join over 30,000 successful dairy professionals who rely on Bullvine Weekly for their competitive edge. Delivered directly to your inbox each week, our exclusive industry insights help you make smarter decisions while saving precious hours every week. Never miss critical updates on milk production trends, breakthrough technologies, and profit-boosting strategies that top producers are already implementing. Subscribe now to transform your dairy operation’s efficiency and profitability—your future success is just one click away.