Farmer loses £17k/month. Processor makes £20.5M/year. December’s 6ppl cut forces UK dairy to its moment of truth. Math doesn’t lie.
Editorial Note (Updated November 10, 2025): Following feedback from AHDB, we have updated this article to clarify data sources and correct a attribution error. Where data was previously attributed to AHDB without verification, we have now cited the correct sources or clarified these as industry estimates. Production cost figures vary significantly by source, region, and methodology—we’ve added context to reflect this complexity. We value accuracy and transparency in our reporting and welcome continued dialogue about UK dairy economics.
Executive Summary: Jack Emery asked the BBC if it’s worth getting up at 4 AM anymore—a question now haunting 7,040 UK dairy farms facing £17,000 monthly losses from December’s 6ppl cut. Meanwhile, processors post record profits: First Milk’s £20.5M is called “exceptional.” With farmgate prices at 35.85ppl against estimated 49p/liter production costs (based on industry benchmarking), the math has become impossible. Five strategic paths exist—organic conversion, scaling up, diversification, cooperation, or exit—but most demand capital and time that hemorrhaging farms simply don’t have. Irish farmers reversed similar cuts in 47 days through cooperative ownership; the UK’s different structure blocks that option. The next 90 days determine whether UK dairy finds an unprecedented collective response or accelerates toward just 4,200 farms by 2030, down from today’s 7,040. Behind every statistic, farm families face math that doesn’t work anymore—in an industry where suicide rates already run 3.5 times the national average.

You know that feeling when you open a letter you’ve been dreading? That’s what Jack Emery was describing to the BBC last month. He runs Thistle Ridge Farm down in Hampshire—about 5,000 liters daily, same as a lot of operations I talk with. When he calculated that First Milk’s 6 pence cut means over £100,000 gone from his annual revenue, then asked whether it’s even worth getting up at 4 AM anymore… well, that resonated with pretty much everyone I’ve spoken to since.
The revealing part is how December’s announcement is forcing us to confront something we’ve been dancing around for years. After digging through processor reports, talking with farmers from Scotland to Devon, and watching what happened with those Irish producers in September—I’m convinced we’re seeing the whole structure of UK dairy that’s evolved since the Marketing Board ended in ’94 finally showing which farms have a path forward and which ones honestly don’t.
The Numbers We’re All Running
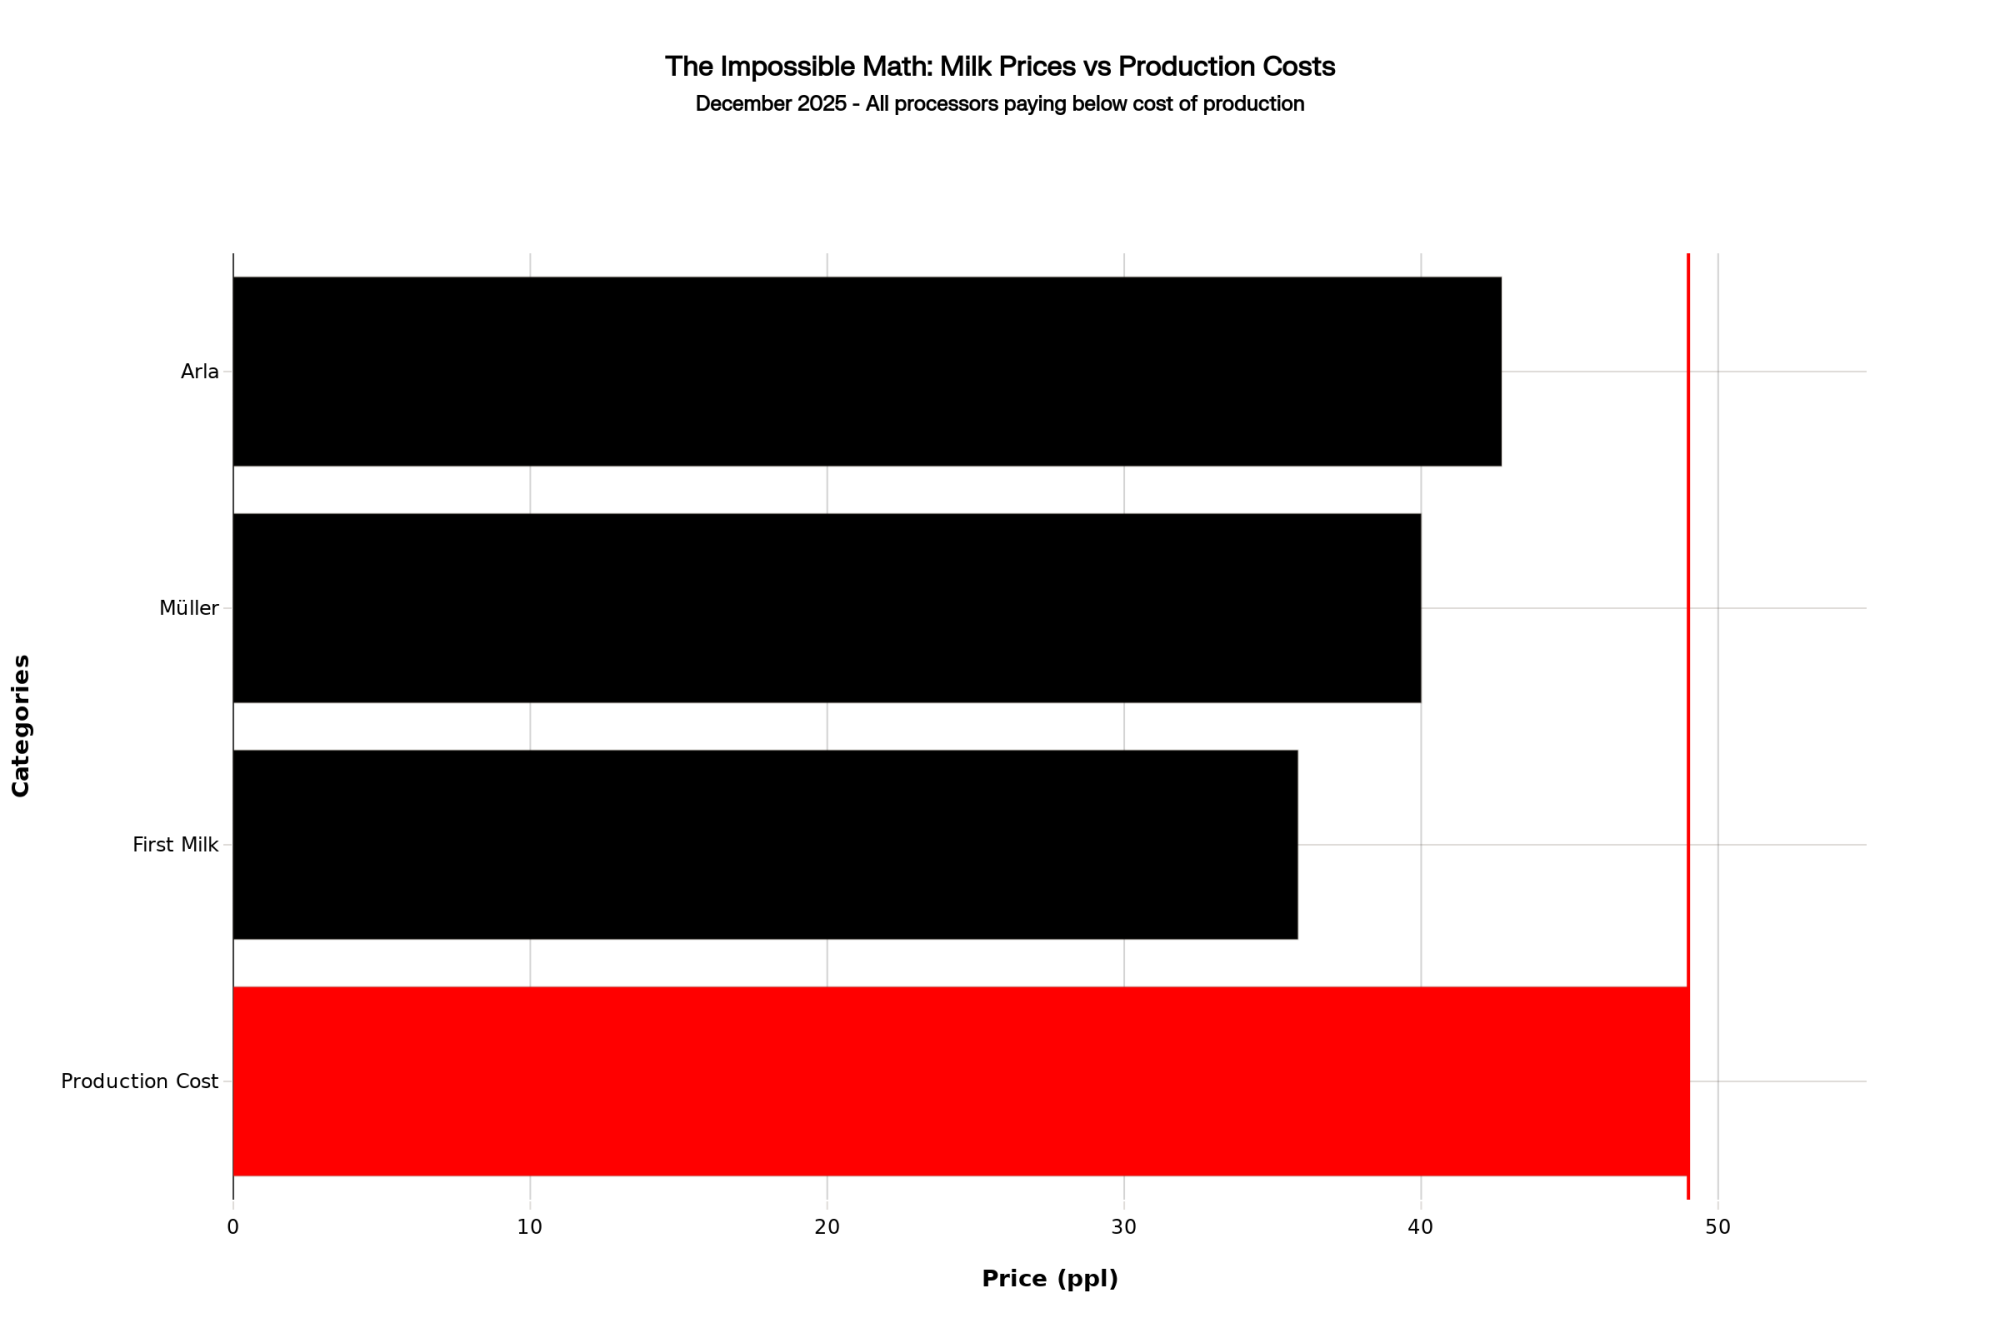
So let’s talk about the math that’s keeping everyone up at night—because I know you’re doing the same calculations I am. First Milk announced a price of 35.85 pence per liter, effective December 1st, including the member premium. Müller’s Advantage program drops to 40ppl. Arla sits at 42.71ppl from November.
Now, industry benchmarking from various sources suggests average production costs running 48-50 pence per liter, though these figures vary significantly by region and farm type. While AHDB provides valuable market data, comprehensive production cost averages come from multiple sources including Kingshay’s annual Dairy Costings Focus report and regional farm business surveys. That matches what I’m seeing in actual farm accounts, though, as a couple of Scottish producers reminded me recently, if you’re dealing with Highland transport or you’re way off the main tanker routes, add another 2-3ppl just for getting milk to market. Down in Wales, First Milk’s members in Pembrokeshire face similar transport premiums. And operations in Cornwall? They’re looking at some of the highest logistics costs in the country.
Here’s where it gets rough. At First Milk’s 35.85ppl against estimated production costs around 49p (based on industry benchmarking and producer interviews, not a single national average), you’re potentially losing about £13 per liter. For a modeled 250-cow operation doing 1.6 million liters annually—that could mean monthly losses approaching £17,000. This is an illustrative calculation based on reported cost ranges—individual farm economics vary significantly. Not sustainable. Not even close.
The timing couldn’t be worse. We all lived through this spring’s drought—the Met Office confirmed it was the driest of the century. I was talking with Cumbria farmers who’d already fed a third of their winter silage by August. Down in Somerset, a 180-cow producer I know went through 40% of his reserves. Now they’re buying concentrate feed at £310-340 per tonne for dairy compounds, according to recent market reports, though forage costs vary widely—AHDB reports large bale hay averaging around £120 per tonne. The combined impact of both concentrate and forage costs, while milk checks are about to drop by thousands monthly, creates severe pressure.
Jack Emery mentioned there’s a two-million-liter surplus in the UK. What he didn’t say—but we all know—is that surplus happened because UK production jumped over 6% this year just as global commodity markets started sliding. Classic timing, right?
What Processors Aren’t Telling Us
You know what makes these cuts particularly hard to swallow? First Milk just reported their best year ever. Turnover up 20% to £570 million. Operating profit is hitting £20.5 million. CEO Shelagh Hancock called it “exceptional” in their August report.

So I spent time really understanding processor economics, and what I found is enlightening. Sure, First Milk reports a 3.6% operating margin—doesn’t sound like much. But that number masks what’s actually happening between the farmgate and the final sale.
When processors buy our milk at 35.85ppl, they’re getting basic commodity input. But look what they’re producing—First Milk’s got commodity cheddar going to Ornua, yes, but they’re also making whey protein concentrates that command serious premiums. They’ve got specialty products through BV Dairy, which they bought in February. And their Golden Hooves regenerative cheddar? That’s capturing 50-75% premiums according to their sustainability reporting.
The company line is that commodity markets weakened—AHDB wholesale data shows butter fell £860 per tonne and cheese dropped £310 per tonne between specific trading periods in late summer/autumn—so they need competitive pricing to maintain market access. Note these are short-term price movements, not necessarily indicative of longer trends. We attempted to reach First Milk for additional comment, but received no response by publication.
What really tells the story is where they’re putting their money. Arla announced £179 million for Taw Valley mozzarella capacity in July. Müller’s investing £45 million at Skelmersdale for powder and ingredients. These aren’t maintenance projects—they’re building capacity for global markets that bypass UK retail’s stranglehold on liquid milk.
Kite Consulting’s September 2025 report “Decoding Dairy Disruption” lays it out pretty clearly—processors can achieve much higher margins on specific product lines while reporting modest overall margins. That BV Dairy acquisition is particularly clever… it lets First Milk redirect commodity milk into specialty channels while still pricing our milk based on bulk markets.
Here’s the thing that stands out: this situation isn’t unique to the UK. In New Zealand, Fonterra’s dealing with similar processor-farmer tensions, while U.S. dairy continues its decades-long consolidation, with operations above 5,000 cows becoming the norm rather than the exception. The difference? Those markets have different support structures and scale economics.
Why Ireland’s Success Won’t Work Here
In September, 600 Irish dairy farmers organized through WhatsApp and reversed Dairygold’s price cuts within 47 days. The Irish Farmers Journal covered it extensively, and I’ve had plenty of UK farmers asking, ‘Why can’t we do that?’
It’s not about courage or determination. It’s about structure, and this is crucial to understand.
Factor | Ireland: Dairygold | UK: First Milk |
|---|---|---|
| Ownership Structure | True cooperative — farmers own equity | Corporate co-op with professional management |
| Farmer Power | Direct voting rights, board control | Limited influence, no true ownership |
| Member Base | ~3,000+ farmer-shareholders | ~700 members (supplier relationship) |
| Reversal Timeline | 47 days via WhatsApp coordination | NO ACTION after 30+ days |
| Legal Framework | Established Cooperative Society Act | New Fair Dealing Obligations (July 2025—untested) |
| Organizational Cost | £0 (infrastructure existed) | £10k+ legal fees + 6 months coordination |
| Key Difference | SHAREHOLDERS with legal power | SUPPLIERS with petition power |
When those Irish farmers confronted Dairygold management at Mitchelstown, they weren’t suppliers asking for mercy—they were shareholders demanding accountability from a company they legally own. Dairygold, like most Irish processors, operates as a true farmer cooperative, with members holding actual equity and voting rights. The Irish Co-operative Organization Society shows it has 130 enterprises structured this way.
Compare that to us. First Milk claims cooperative status with about 700 members, but check their Companies House filings—it operates more like a traditional company with professional management. Arla UK? We’ve got 2,300 British farmer-owners, but we’re a minority within a 9,500+ member European cooperative historically dominated by Danish and Swedish interests.
Several First Milk members in Scotland and northern England have pointed this out to me: we’ve had the same Fair Dealing Obligations regulations for forming Producer Organizations since July. Same legal framework as Ireland. But forming a PO requires lawyers, coordination, months of work—all while you’re hemorrhaging money and working 90-hour weeks. The Irish? They just activated what already existed.
Five Options—And Why Most Won’t Work
Industry advisors keep presenting these strategic options. After examining each through actual farm finances and talking with producers trying different approaches, let me share what’s actually realistic.
Premium differentiation sounds great at conferences. Organic and regenerative systems can capture the 50-75% premiums reported by the Soil Association. First Milk’s got their Golden Hooves programme. But here’s what nobody mentions: organic conversion takes 3 years at zero premium, while you’re paying 20-30% higher costs, according to the Organic Milk Suppliers Cooperative. Capital requirement? Based on SAC Consulting and Promar International estimates, organic conversion for a 250-cow operation typically requires £500,000-750,000, though it varies by system. Timeline to positive returns? Five to seven years minimum.
Let’s be realistic… show me a farmer losing £17,000 monthly who has half a million pounds and seven years to wait.

Scaling for efficiency absolutely works—if you’ve got millions. Industry consultancy benchmarking and international case studies suggest operations over 3,500 cows achieve much lower per-unit costs. But expanding from 250 to 3,500 cows? You’re looking at £26-39 million at current development costs of £8,000-12,000 per cow. Banks want 18 months of positive cashflow before discussing expansion. Current trajectory? Negative £17,000 monthly.
Strategic diversification offers possibilities, but timeline matters. UK Agricultural Finance research shows that glamping units cost £15,000-30,000 each and take 12-18 months to develop, including planning. On-farm processing? That’s £50,000-100,000 minimum plus all the Food Standards Agency requirements. Solar installations take 18-24 months from agreement to the first payment. These might help in the long term, but December’s cash flow crisis needs immediate solutions.
Cooperative formation could theoretically work. The Fair Dealing Obligations regulations, effective in July, provide the framework for Producer Organizations. But NFU Legal Services estimates £5,000-15,000 just for setup, plus coordination and months of organizing. I know of attempts in northern England that stalled because farmers simply didn’t have bandwidth while managing daily crises.
Strategic exit—nobody wants to discuss this, but it’s increasingly the only rational choice for some. A 250-cow operation might extract £300,000-400,000 in equity through planned liquidation now, based on current values. Wait until forced insolvency? That equity evaporates. Solar leases generate £800-1,200 per acre annually according to Solar Energy UK. Environmental schemes offer £200-400 per hectare under Countryside Stewardship. The math is harsh but clear.
What the Next 90 Days Will Tell Us
Key Dates to Watch:
- December 1: First Milk price cut takes effect
- January 15: Deadline for meaningful PO formation activity
- Late January: Processor pricing announcements for February
- March: AHDB quarterly producer numbers released

December through February’s going to be critical. Looking at historical patterns and current dynamics, here are the indicators I’m watching:
Producer Organization registrations with DEFRA—if farmers are organizing, we should see applications by mid-January. The public registry’s accessible, and as of early November, there’s been nothing significant since October’s announcements.
Cull cow markets are telling. AHDB data shows volumes typically rise 10-15% in winter normally. While some regional auctioneers report elevated activity, AHDB’s national data through early November does not show significant increases above seasonal averages. December data will tell the full story of whether localized reports translate to national trends.
January processor pricing will signal direction. If First Milk, Müller, and Arla maintain or cut further, they’ve calculated that we lack the capacity to respond. Movement toward 40-42ppl might suggest they see organizational stirrings worth heading off.
The Agricultural Supply Chain Adjudicator can impose penalties of up to £30 million under the 2024 regulations. Their annual report shows that UK dairy receives maybe 1 or 2 complaints per year from 7,000+ producers. If that doesn’t change by February despite this crisis… well, it confirms we’re too stretched to fight.
Come March, AHDB publishes Q1 producer numbers. If exits accelerate beyond 190 farms annually toward 240-320, December becomes an inflection point—just not the kind we’d hope for.

The Human Side Nobody Talks About
What statistics miss is what’s happening in farm kitchens right now. The Farm Safety Foundation’s research shows farmers are 3.5 times more likely to die by suicide than the general population. But that’s not just a number—it’s about identity.
When you’re third-generation dairy, when your kids show calves at county shows, when your whole sense of self is wrapped in being a good farmer—losing the farm isn’t just business failure. A study in the Journal of Rural Mental Health found that farmers couldn’t separate their personal identity from their farm identity. When the farm failed, they felt they’d failed as humans.
The University of Guelph’s agricultural mental health research documents the progression. First comes problem-solving—cutting costs, deferring maintenance, and longer hours. Then isolation. Farmers stop attending meetings, skip social events, and withdraw. When cognitive distortions take hold—every option looks impossible, exit feels like complete failure—intervention becomes critical.
I’ve noticed that December’s cuts aren’t hitting farmers in isolation. They’re hitting operations already stressed by drought, inflation, and the watching of neighbors exit. For someone already questioning whether it’s worth continuing, that £600 monthly loss can accelerate a psychological crisis dramatically.
What Success Actually Looks Like
Not every story ends in exit, and that’s important to remember. I’ve been talking with operations, finding ways through this that deserve attention.
One farm in Cheshire I visited started transitioning to artisan cheese three years ago—began at local farmers’ markets and now supplies regional delis. Over those three years, they invested about £85,000 total, but they’re now achieving £1.20-1.40 per liter equivalent on cheese versus 36p farmgate. The key was starting small, reinvesting profits, and growing gradually.
Five farms near Dumfries formed an informal buying group last year—nothing fancy, just neighbors coordinating feed orders through WhatsApp for 8-12% better pricing. As the organizer told me, “We can’t control milk prices, but we can optimize what we spend.”
Several farms moved into contract heifer rearing, maintaining dairy expertise while reducing capital requirements and price exposure. Margins are lower—typically £350-400 per heifer based on current arrangements—but it’s predictable income with less stress. One farmer who made the switch two years ago told me simply: “I sleep at night now. Can’t put a price on that.”
What’s encouraging is that these aren’t following standard strategic paths exactly—they’re hybrid approaches that match specific circumstances, available capital, and family goals.
Where This Is Probably Heading
Looking at current industry exit patterns and talking with dairy economists at Harper Adams and Reading… if trends continue, UK dairy by 2030 would likely have 4,200-4,800 operations, down from today’s 7,040. Average herds approaching 300-350 cows. The middle tier—150-400 cow operations—is largely disappearing, replaced by either large-scale operations or small niche producers.
This doesn’t necessarily mean milk shortage. The UK will maintain production, keep shelves stocked, and meet demand. But through a fundamentally different structure than even five years ago.
What December represents isn’t the breaking point—it’s more like the revelation point. When we can’t pretend anymore that working harder, cutting costs, or waiting for recovery will save operations that are structurally challenged in this system.
Practical Guidance for Right Now
If you’re looking at impossible math, here’s what I’d suggest based on conversations with advisors and farmers who’ve navigated this:
First, calculate the true break-even point, including family living. Not just production costs—everything, including realistic family drawings. If that’s above 45 ppl, act immediately rather than hope for recovery.
Second, assess a realistic timeline. How many months can you sustain current losses? Not theoretical credit or hoped-for recovery—actual reserves against actual losses. Most operations I’ve analyzed have lasted no more than 3 to 6 months.
Third, if considering exit, move quickly. Asset values are highest in planned liquidation, not in forced sales—any auctioneer will confirm this. Farms exiting in 2026 will find stronger January markets than June.
Fourth, if staying, commit fully. Half-measures don’t work now. Whether diversification, scale, or differentiation, successful transitions require complete commitment and adequate capital. Without both… it might be time to reconsider.
Finally—and this really matters—remember this isn’t personal failure. The UK dairy’s structure creates these outcomes. You didn’t fail. You’re operating in a system where structural forces favor consolidation, and margin capture happens downstream. Understanding that won’t change outcomes, but it matters for how you frame what comes next.
Support When You Need It
For those struggling with these decisions, support exists. RABI’s 24-hour helpline (0800 188 4444) offers confidential assistance from counselors who understand farming. The Farming Community Network (03000 111 999) provides practical and emotional support from staff with agricultural experience. Rural Support combines business planning with mental health resources.
These aren’t just numbers—they’re staffed by people who understand losing a farm isn’t just losing business. It’s losing identity, legacy, purpose. No shame in needing support through that.
The Bottom Line
December’s 6ppl cut isn’t really about December. It’s about whether the UK dairy’s structure can sustain family-scale farming or whether consolidation toward fewer, larger operations is simply inevitable. Looking at processor investments, organizational challenges, and the mathematics… the direction seems increasingly clear.
Yet within that larger story, individual farmers are writing their own chapters. Some will find innovative adaptations. Others will make dignified exits, preserving family wealth for different futures. Maybe some will catalyze collective action that could still influence the narrative.
What matters now isn’t predicting which unfolds—it’s ensuring farmers have clear, honest information for family decisions. Because behind every statistic, market report, price announcement, there’s a family at their kitchen table, doing math that doesn’t work anymore, trying to figure out what comes next.
That’s the real story for December 2025. Not the 6ppl cut itself, but what it reveals about who has options and who’s running out of time.
A Note on Data Sources UK dairy production costs vary significantly based on source, methodology, and sample. This article draws from multiple sources including:
• Industry benchmarking reports (Kingshay, Promar, SAC Consulting)
• Producer interviews and farm business accounts
• AHDB market price data (where specifically cited)
• Processor annual reports and public statements
• Academic research from UK agricultural universities
We encourage readers to examine multiple data sources when making business decisions. Cost figures presented here represent reported ranges and modeled examples, not definitive national averages. Individual farm circumstances vary considerably. The core analysis and conclusions remain unchanged—UK dairy farmers face severe economic pressure requiring urgent attention and structural solutions.
We welcome input from all industry stakeholders, including AHDB, processors, and producers, to refine our understanding of UK dairy economics. If you have additional data or perspectives to share, please contact editorial@thebullvine.com.
Key Takeaways:
- December’s Impossible Math: Based on industry cost estimates, many farms face potential losses of £17,000 monthly (35.85ppl milk vs estimated 49p/liter costs) while First Milk reports “exceptional” £20.5M profits—this gap won’t close without structural change
- Why Ireland’s Fix Won’t Work Here: Irish farmers reversed cuts in 47 days through cooperative ownership UK doesn’t have—forming Producer Organizations requires lawyers, time, and bandwidth you lack while hemorrhaging money
- Your Real Options: Of five paths forward, only planned exit guarantees equity preservation; organic needs £750k and 7 years; scaling requires £26-39M; diversification takes 18-24 months; cooperation needs resources you don’t have
- The 90-Day Test: Watch DEFRA PO registrations by January 15, processor pricing late January, AHDB Q1 numbers in March—if nothing shifts, UK dairy accelerates from 7,040 to 4,200 farms by 2030
Learn More:
- US Dairy Market in 2025: Butterfat Boom & Price Volatility – How Farmers Can Protect Profits – This piece provides a “Dairy Farmer Survival Checklist” for price volatility. It reveals tactical methods for auditing component premiums and using risk management to protect your milk check from market swings.
- Global Dairy Market in 2025: Production Shifts, Demand Fluctuations, and Trade Dynamics – Understand the global “why” behind your processor’s actions. This strategic analysis details production shifts in the EU and US, and demand from China, revealing the export markets processors are chasing.
- Stop Bleeding Money on AgTech: The 5-Dimension Framework That Separates Winners from $50K Failures – While the main article questions high-cost tech, this piece offers a framework for successful adoption. It demonstrates how to separate “winners from $50K failures” by focusing on tech with a verified 12-18 month ROI.
 The Sunday Read Dairy Professionals Don’t Skip.
 The Sunday Read Dairy Professionals Don’t Skip.
Every week, thousands of producers, breeders, and industry insiders open Bullvine Weekly for genetics insights, market shifts, and profit strategies they won’t find anywhere else. One email. Five minutes. Smarter decisions all week.