


U.S. dairy exported $801M in November. Your butterfat paid $5.85/cwt less. The missing money isn’t magic — it’s a 34% ‘hidden tax.
Executive Summary: November 2025 U.S. dairy exports hit $801.7 million, but many producers watched their butterfat pay $5.85/cwt less than late 2024. This piece unpacks that paradox and shows how exports surged because U.S. butterfat got cheap, not because buyers paid premiums. It brings the June 2025 FMMO reforms front and center, explaining how a 34% jump in the butter make allowance acts like a “hidden tax” on high‑component herds by pulling more value out before it ever reaches your milk check. Real‑world examples from Wisconsin and Minnesota walk through how wide Class III/IV spreads, depooling, and $180,000 in locked-up co‑op equity shift risk and revenue off the farm. From there, the article lays out four concrete paths — demand co‑op transparency, measure your mailbox vs. uniform gap, honestly assess switching costs, and tighten DMC/forward‑pricing coverage. It gives you specific triggers to watch, like a $0.50/cwt mailbox gap and a $2.00–$2.50 Class III/IV spread, so you can decide whether your current marketing channel is earning its share — or just taking it.
“If exports are so great, why don’t I feel it?”
That’s what one Wisconsin producer said when he opened his December milk statement after weeks of headlines celebrating record U.S. dairy exports. It’s the right question.
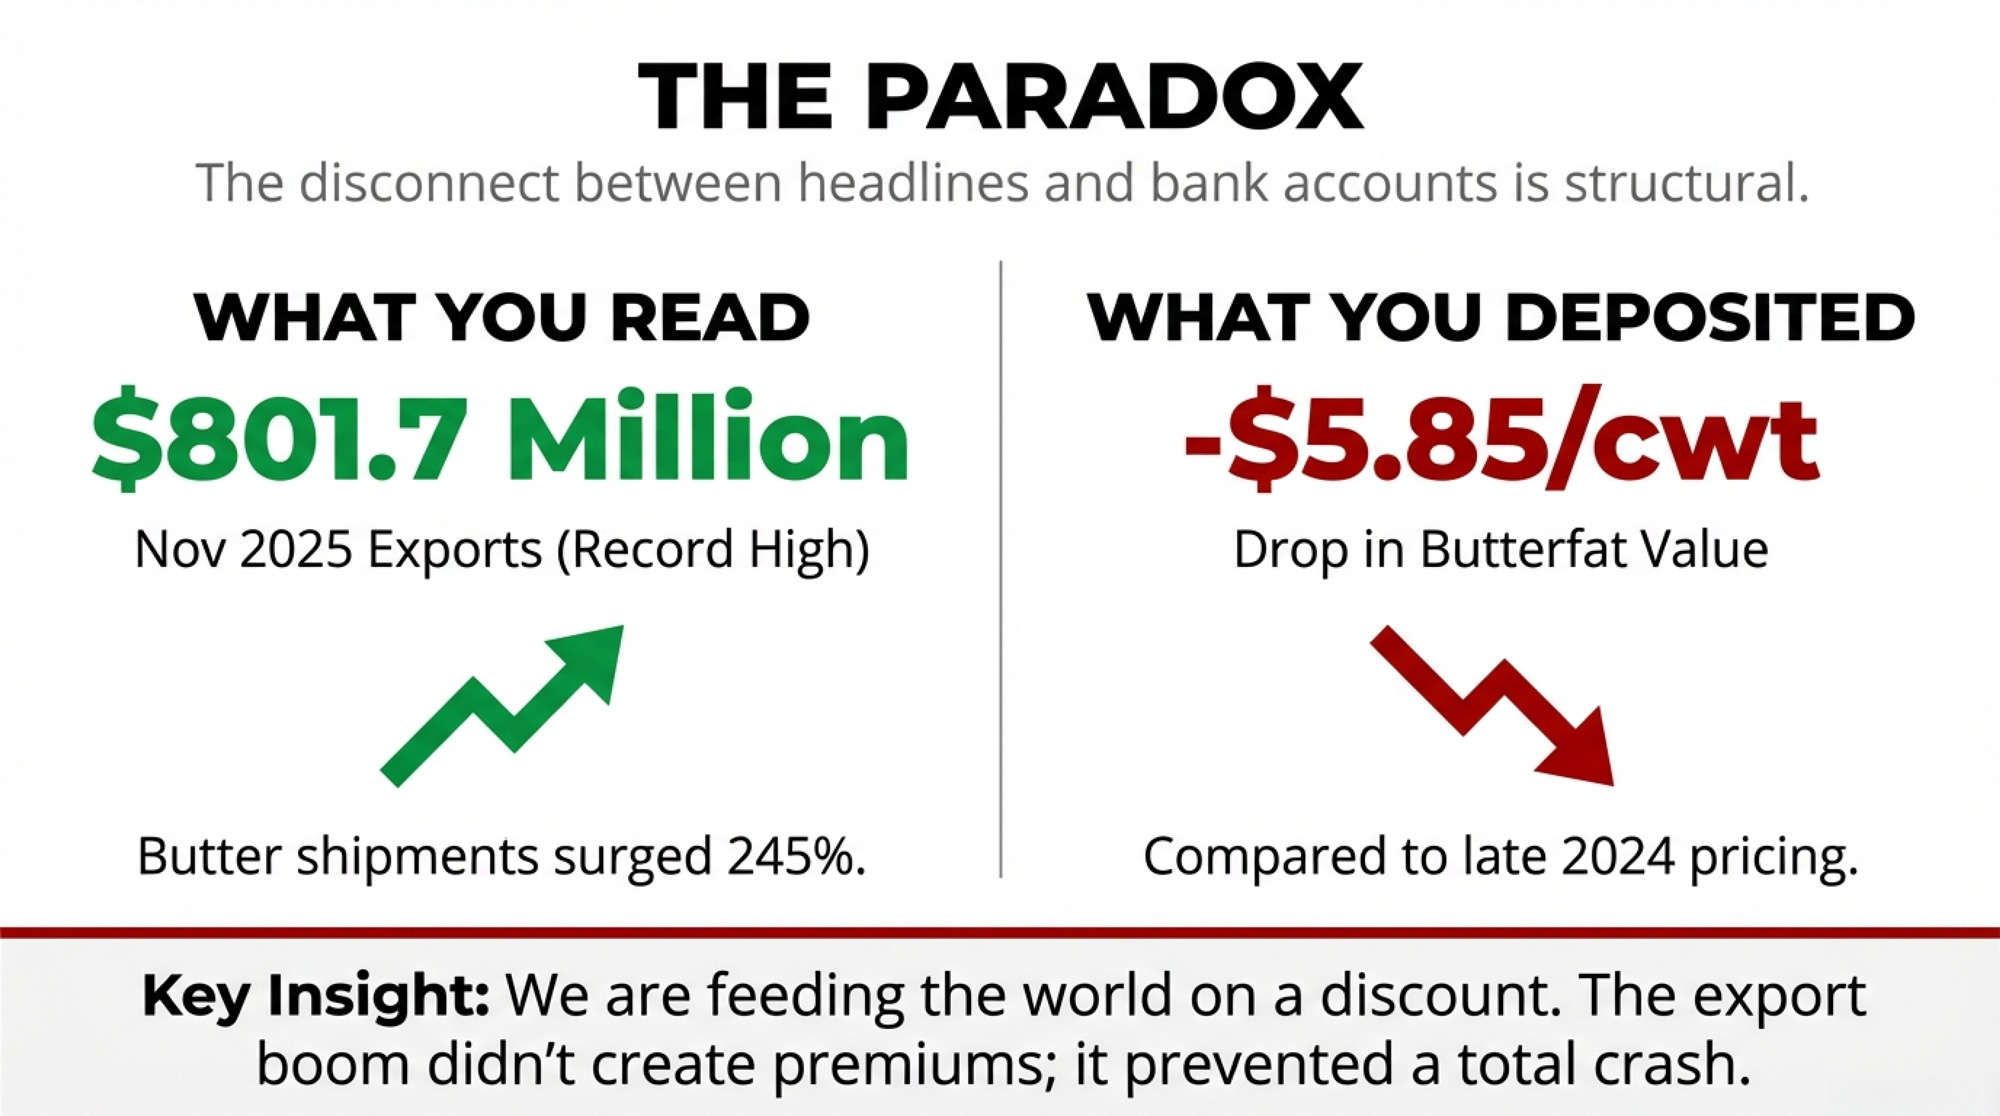
November 2025 delivered $801.7 million in U.S. dairy export value — up 14% from the prior year, according to USDEC data released in January 2026. Butter shipments surged 245%. Total butterfat exports reached 15,308 metric tons, the highest single-month total ever recorded. Yet Class IV checks arrived at $13.89 per hundredweight, and butterfat component values had dropped roughly $5.85 per cwt compared to late 2024.

We’re feeding the world on a discount, and the only ones not invited to the feast are the people milking the cows.
That gap between headline and mailbox isn’t random. It’s structural. And understanding why — plus what you can do about it — matters more now than it has in years.
The Hidden Tax on Your Efficiency
Before we get to export mechanics, here’s the piece most producers miss entirely.
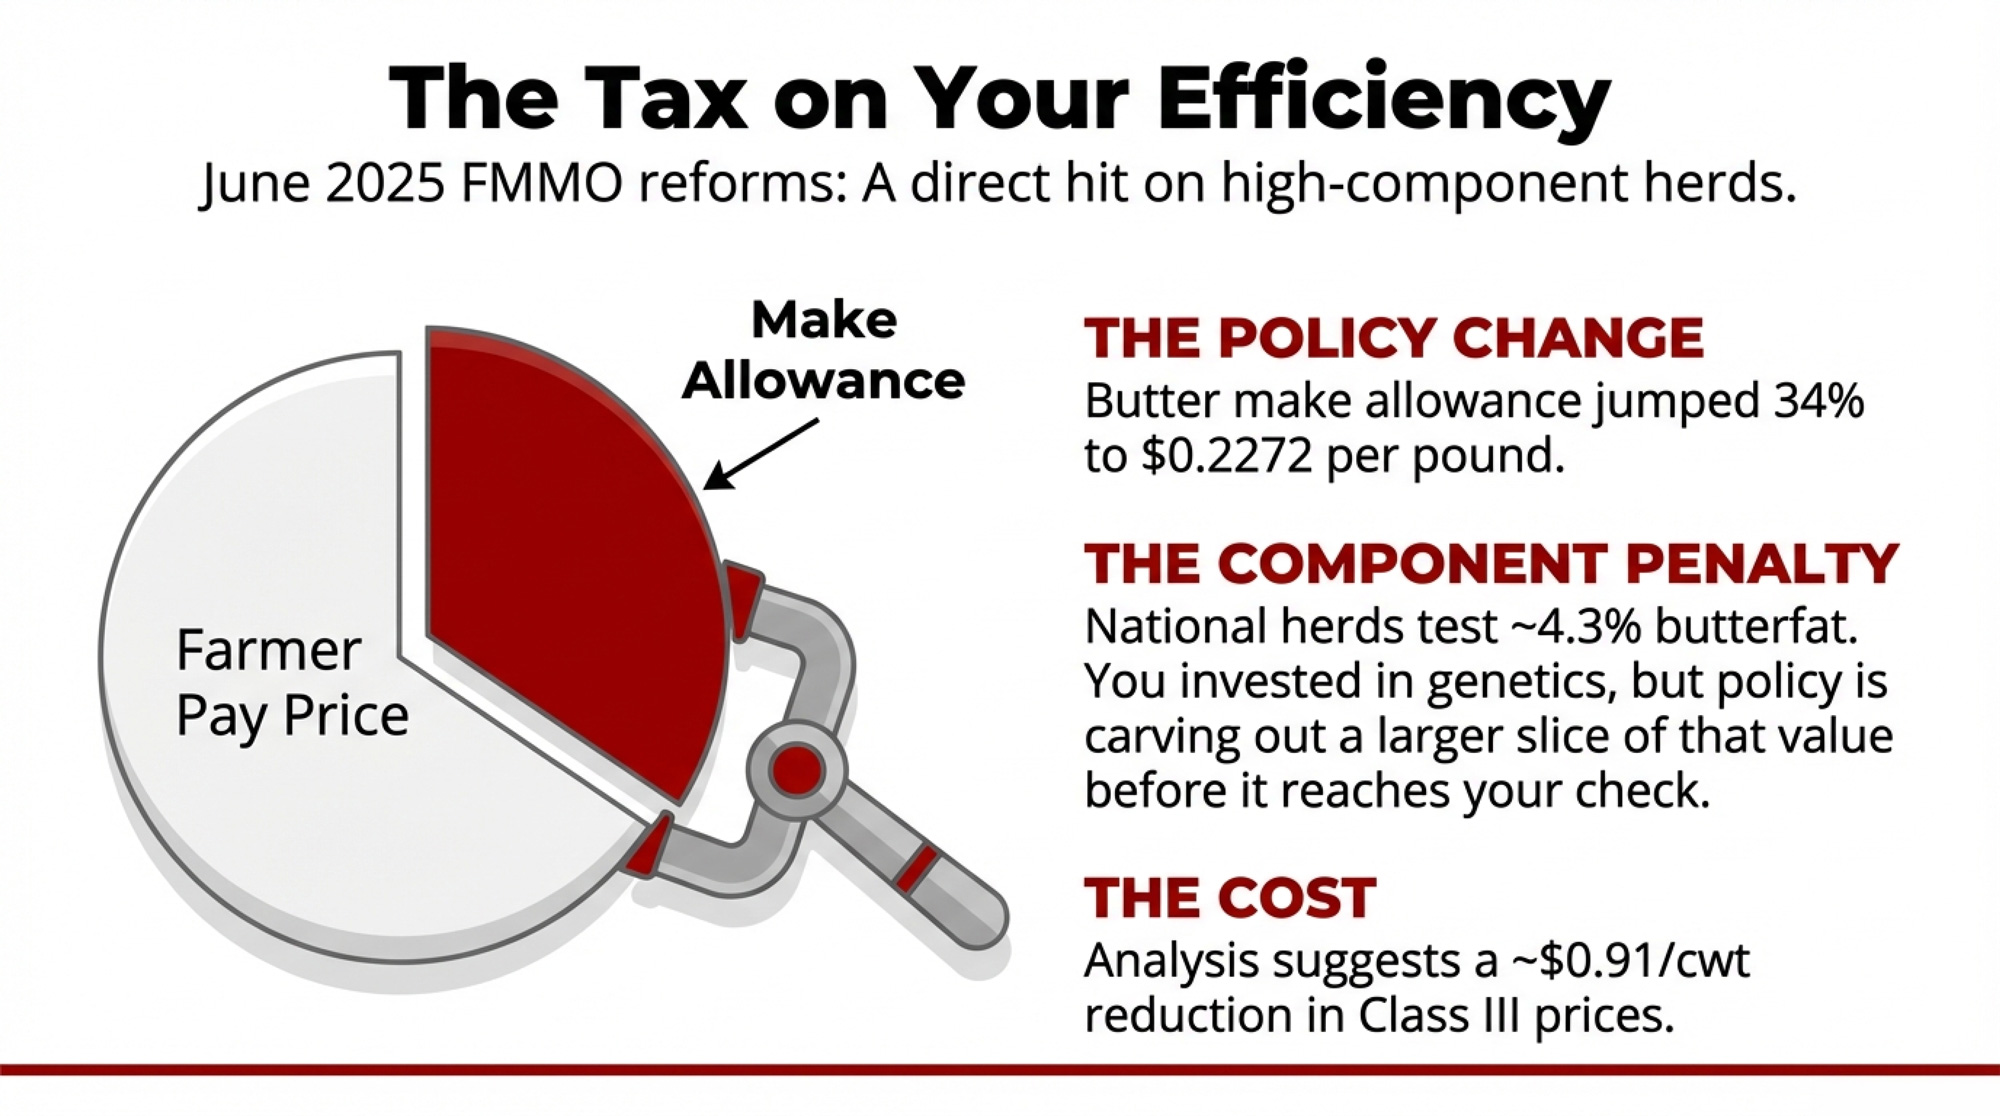
The Federal Milk Marketing Order reforms that took effect in June 2025 included increases in make allowances across product categories. According to USDA Agricultural Marketing Service data, butter’s make allowance rose 34% to $0.2272 per pound. These allowances get deducted before class prices and producer payments are calculated.
| Component | Before June ’25 | After June ’25 | % Increase |
|---|---|---|---|
| Butter | $0.1694/lb | $0.2272/lb | +34% |
| Cheese (Cheddar) | $0.2003/lb | $0.2367/lb | +18% |
| Dry Whey | $0.1991/lb | $0.2210/lb | +11% |
| Nonfat Dry Milk | $0.1678/lb | $0.1889/lb | +13% |
| Avg. Impact on Class III | — | -$0.91/cwt | — |
| Avg. Impact on Class IV | — | -$0.85/cwt | — |
Think about that: you invested in genetics, management, and components. Your herd is testing 4.3% butterfat — roughly 23% above the 3.5% baseline FMMO pricing assumes. And now a larger slice of that value gets carved out before it ever reaches your check.
American Farm Bureau Federation analysis estimated the FMMO changes reduced Class III prices by approximately $0.91 per cwt and Class IV by $0.85.
That’s not market forces. That’s policy. And it happened while everyone was watching export numbers.
Why Exports Surge When Prices Fall
Here’s the assumption most of us carry: strong export demand drives prices up, rising prices lift milk checks. November 2025 proved that the opposite can happen.
What actually drove the export boom? U.S. butterfat got cheap.
When domestic butter prices fell from nearly $2.89 per pound in late 2024 to roughly $1.53 by late 2025, American product became the discount option. Global buyers noticed. According to USDEC’s January 2026 analysis, butterfat imports from the U.S. to the Middle East and North Africa topped 4,000 metric tons in November alone. Bahrain and Saudi Arabia led the surge ahead of Ramadan buying.

South Korea emerged as a standout cheese market too, with November shipments jumping 136% year-over-year — mozzarella and cream cheese for foodservice driving those gains.
But here’s the thing: these weren’t premium buyers paying top dollar for American quality. They were price-sensitive markets taking advantage of a cheap supply.
When exports function as a release valve for surplus — moving product that would otherwise crash domestic prices further — they provide real value. That value shows up as market stabilization, though. Not enhanced producer premiums.
November’s export surge prevented worse. It didn’t create better.
Where the Dollars Disappear
That Wisconsin producer ships to a Class IV-heavy cooperative focused on butter and powder. In theory, a record butterfat export month should benefit operations in that channel.
The math didn’t work that way.
- First, those export sales happened at prices reflecting the domestic collapse, not premiums above it. When butter trades at $1.53 domestically, export sales at competitive global prices don’t generate a margin to pass back to domestic customers. They generate volume movement that keeps plants running.
- Second, cooperatives operate with their own cost structures — debt service, equity retention, and balancing costs. Large co-ops with recent processing investments may be servicing significant debt before member payments hit your account.
The Wisconsin producer put it bluntly: “So when they say exports are good for dairy farmers, they don’t actually know if that’s true?”
Not at the individual level. The system doesn’t track it.
The Pricing Mechanics Absorbing Your Margin
The 4.3% vs. 3.5% Problem
Federal order pricing assumes a 3.5% butterfat baseline. Actual farm tests have been running around 4.3% nationally—roughly 23% higher than that.
When butterfat prices are strong, high-component herds benefit. When prices collapse, those same herds have greater downside exposure.
Here’s the math: A producer shipping 4.3% butterfat saw component value drop from approximately $12.43 per cwt in late 2024 to $6.58 in late 2025. That’s $5.85 driven entirely by commodity price movement — same cows, same management, same milk.
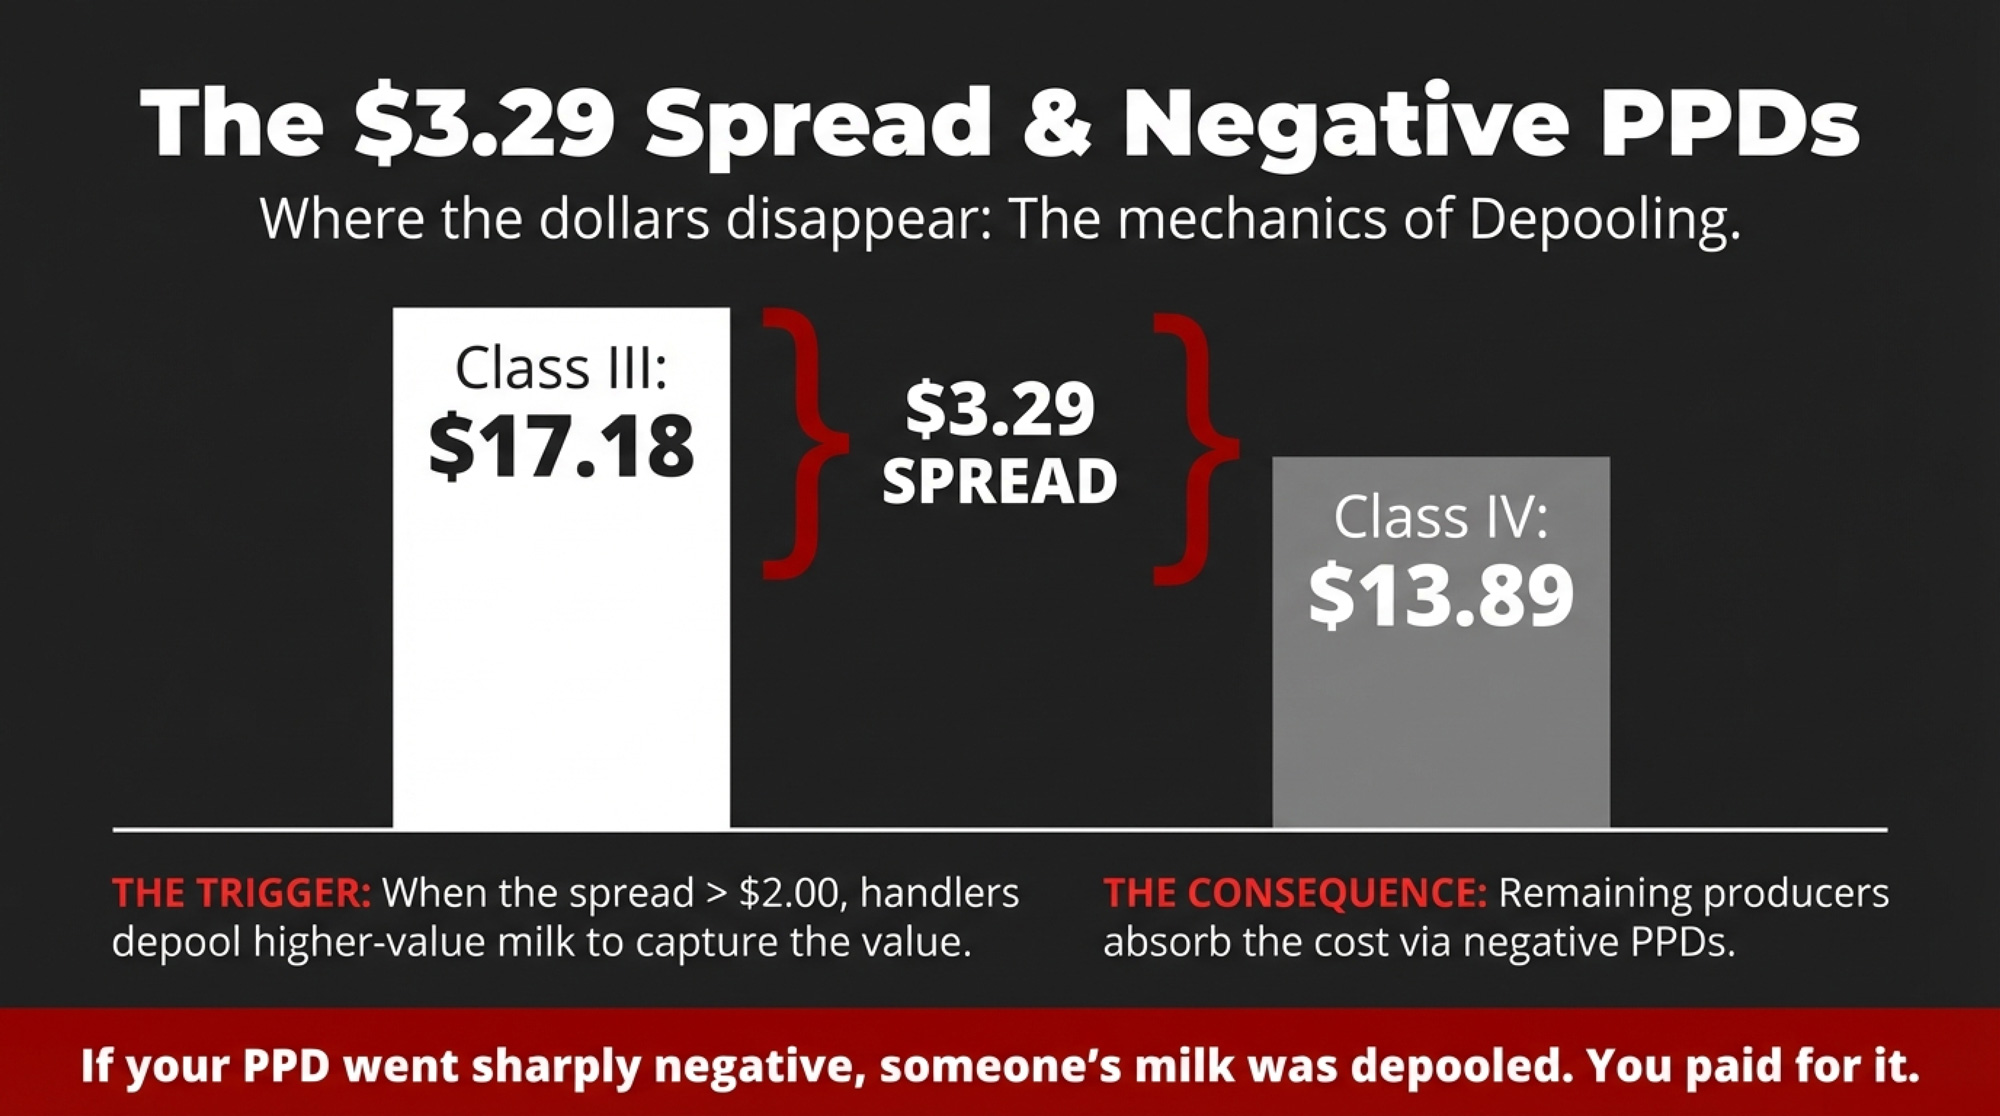
The $3.29 Spread
November 2025’s gap between Class III ($17.18) and Class IV ($13.89) was $3.29 per hundredweight — the widest since April 2024.

Wide spreads create depooling incentives. Under federal order rules, milk can be pooled or depooled at the handler’s discretion — this is a permitted structural feature, not a violation. When one class commands a significantly higher price than the blend, handlers can pull that milk out and capture the full value.
When milk is depooled, the higher-value revenue exits the system. Producers remaining in the pool absorb the cost through negative PPDs.
If your PPD went sharply negative in a month with a wide class spread, someone’s milk was depooled. It might not have been yours, but you paid for it.
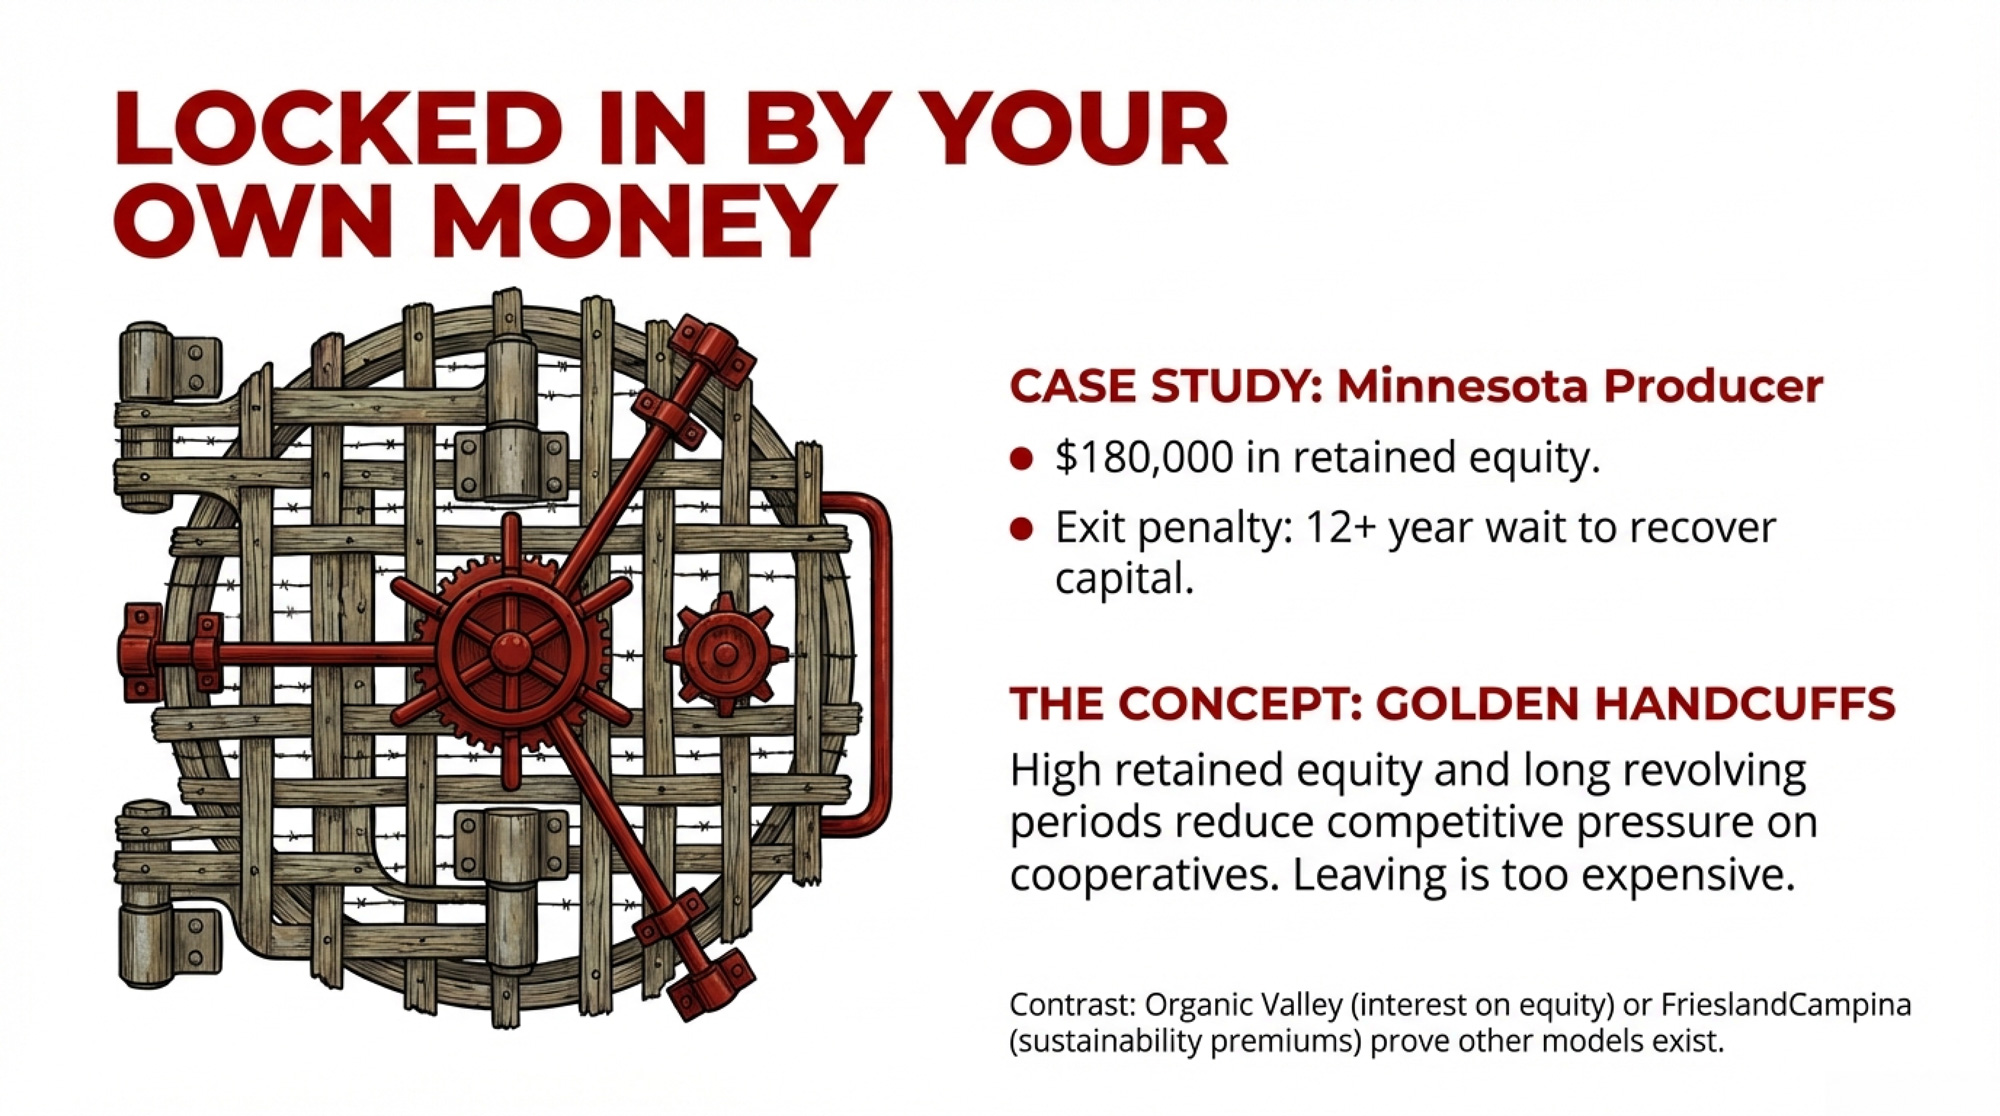
When Equity Becomes a Barrier
One Minnesota producer calculated he had roughly $180,000 in retained equity with his cooperative. When he explored switching, he discovered leaving would mean waiting 12+ years to access that money — and the bylaws allowed offsets for “losses attributable to departing members.”
He stayed. Not because he was satisfied. Because $180,000 was more than he could walk away from.
His situation illustrates a common barrier, though specific equity positions and terms vary by cooperative and tenure. Retention policies for 15-20-year revolving schedules are standard across much of the industry.
What Works Differently
Not every cooperative operates the same way.
Organic Valley (CROPP Cooperative) pays 8% interest on retained member equity — treating members as capital partners, not just milk suppliers. Their pay prices have historically run several dollars per cwt above conventional, with organic premiums in the $8-10 range during favorable periods. That gap narrows when organic supply exceeds demand, but the structure rewards member investment differently than most commodity co-ops.
FrieslandCampina in the Netherlands paid €245 million in documented sustainability premiums to member farmers in 2023, according to the cooperative’s annual report. Transparent indicator systems show exactly what farmers earn for meeting specific targets.
| Feature | Typical U.S. Commodity Co-op | Organic Valley (CROPP) | FrieslandCampina |
|---|---|---|---|
| Interest on retained equity | 0% – 2% | 8% | Variable, disclosed |
| Premium above conventional | $0 – $0.50/cwt | $8 – $10/cwt | €0.02 – €0.05/kg |
| Sustainability premiums | Rare, undisclosed | Disclosed, integrated | €245M (2023, documented) |
| Transparency on export revenue | Minimal to none | Member reports | Annual public reporting |
| Equity recovery timeline | 12 – 20 years | 7 – 10 years | 5 – 7 years |
| Member decision-making | Board-driven, limited input | Strong member voice | Indicator-based, transparent targets |
These examples prove the mechanics can work differently. But they represent a small fraction of U.S. production.
Four Paths Forward
Path 1: Demand Transparency
The most accessible option is better information from your current cooperative.
Three Questions to Send Before the Annual Meeting Season
Send these in writing — responses aren’t guaranteed, but asking creates a record:
- “What was our cooperative’s gross export revenue in 2025, and what net amount reached member pay prices after all costs?”
- “For months when the Class III/IV spread exceeded $2.00, what was our pooling policy?”
- “How did our member mailbox prices compare to the FMMO statistical uniform price?”
One producer asking gets brushed off. Five people sending the same letter gets a board agenda item.
Path 2: Know Your Numbers
This week: Pull your milk checks from the last 12 months. Calculate your actual mailbox price — total dollars received divided by total hundredweights, after every deduction.
| Scenario | Annual Production (lbs) | FMMO Uniform ($/cwt) | Mailbox ($/cwt) | Annual Gap |
|---|---|---|---|---|
| Small herd, commodity co-op | 850,000 | $18.25 | $17.45 | -$6,800 |
| Mid-size, high-component | 1,400,000 | $18.25 | $17.50 | -$10,500 |
| Large herd, Class IV heavy | 3,200,000 | $18.25 | $17.70 | -$17,600 |
| Regional co-op, transparent | 1,400,000 | $18.25 | $18.15 | -$1,400 |
Then compare to the statistical uniform price for your federal order.
If your mailbox trails the uniform by more than $0.50 per cwt consistently, that gap warrants investigation. On a 200-cow herd shipping 1.4 million pounds annually, a $0.75 gap is roughly $10,500 per year.
Path 3: Evaluate Switching — Honestly
The barriers are real: retained equity that takes 10-15 years to recover, 12-18 month notice periods, geographic constraints on handlers, and social pressure in tight-knit communities.
But understanding your options provides context for negotiation. A producer who knows their alternatives negotiates differently.
Path 4: Strengthen Risk Management
- Dairy Margin Coverage remains cheap insurance. December 2025 was the only month triggering a DMC payment all year — but with margins now compressing toward the $9.50 trigger, payments appear increasingly likely in 2026. The enrollment period runs through February 26, and the One Big Beautiful Bill Act expanded Tier 1 coverage to 6 million pounds.
- Forward contracting through the Dairy Forward Pricing Program allows locks through September 2028. You trade upside for certainty — appropriate for tight debt service, less so if you can absorb volatility.
What to Watch Through Q2 2026
Class III/IV spreads: When they exceed $2.00, depooling pressure builds. Past $2.50, it’s likely affecting your check.
Your PPD trend: Sustained negative PPDs during wide-spread months signal pooling decisions that aren’t serving you.
Co-op annual meetings: Q2 is your window to ask questions with other members present.
What This Means for Your Operation
- Calculate your mailbox-to-uniform comparison this week. More than $0.50 below consistently? You need to understand why.
- Send the three questions in writing before your annual meeting. See what answers you get — and how long they take.
- Know your equity position and departure terms now. Not because you’re leaving, but because understanding constraints lets you evaluate options clearly.
- Connect with two or three producers in your cooperative. Compare mailbox prices. Collective inquiry creates dynamics different from those of individual complaints.
- Review your DMC enrollment before February 26. With margins tightening and December’s payment fresh, coverage costs are minimal compared to downside protection.
- Watch the spread monthly. Past $2.00, pay attention. Past $2.50, act.
Key Takeaways
- Export records don’t equal premium checks. November’s $801 million was due to U.S. prices collapsing. The surge prevented worse; it didn’t create better.
- The 34% make allowance hike is a hidden tax on your efficiency. You bred for components. Policy changes are capturing more of that value before it reaches your check.
- The $5.85/cwt butterfat drop hit high-component herds hardest. The same genetics that boosted 2024 revenue also increased 2025 exposure.
- $3.29 spreads create depooling that costs you. If you don’t know your co-op’s pooling policy, you can’t evaluate whether it’s working for you.
- Your mailbox vs. the uniform price is the comparison that matters. A consistent $0.50+ gap means your channel is extracting more than it’s adding.
The Bottom Line
That Wisconsin producer figured something out after digging into the mechanics: the opacity isn’t inevitable. Some cooperatives operate transparently. Some structures actually return a value to members.
The difference is whether you know enough to ask — and whether you’ll ask alongside others who are tired of the same answer.
Where does your mailbox sit relative to the uniform?
Complete references and supporting documentation are available upon request by contacting the editorial team at editor@thebullvine.com.
Learn More
- The $0.90/Cwt FMMO Hit: Reset Your Breakeven, DMC Coverage, and Heifer Strategy for 2026 – Rebuild your financial defenses by mastering the structural shift in 2026 breakevens. This tactical deep dive arms you with the exact math needed to secure DMC protection before the February 26 deadline and stop the $0.90/cwt bleed.
- FMMO Reality Check: Why 2025’s $2.3 Billion Dairy Pricing Revolution Exposes the Fatal Flaw in American Milk Marketing – Expose the massive $91 million annual value transfer from your pocket to processor margins triggered by the June 2025 FMMO reforms. This strategic analysis delivers the leverage you need to challenge outdated pricing models and protect your long-term equity.
- Biology Repriced Dairy: $4,000 Heifers Created a 90-Day Window When You Have Leverage, Not Processors– Break down the 90-day leverage window created by the current heifer shortage to tilt the scales back in your favor. This maverick strategy reveals how to turn biological constraints into a competitive advantage when negotiating with desperate processors.
 Join the Revolution!
 Join the Revolution!
Join over 30,000 successful dairy professionals who rely on Bullvine Weekly for their competitive edge. Delivered directly to your inbox each week, our exclusive industry insights help you make smarter decisions while saving precious hours every week. Never miss critical updates on milk production trends, breakthrough technologies, and profit-boosting strategies that top producers are already implementing. Subscribe now to transform your dairy operation’s efficiency and profitability—your future success is just one click away.


