Archive for herd culling strategies

£10,000 a Month in the Red: Why UK Dairy Margins Collapsed – And What’s Actually Working

When processor profits climb while your milk check drops, it’s not a coincidence. It’s a message. And once you understand what that message is telling you about how the modern dairy supply chain works, you can stop second-guessing yourself and start making strategic decisions.

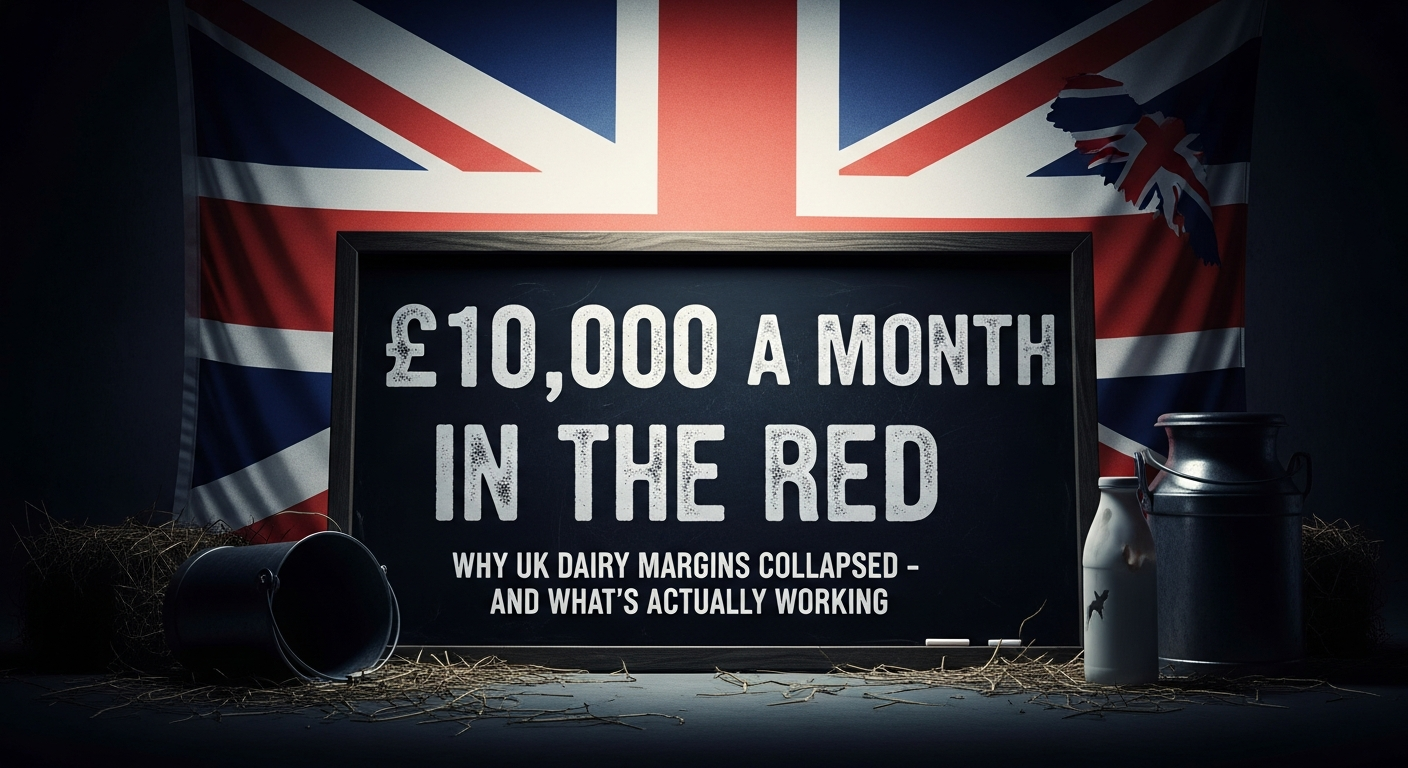
Executive Summary: A 200-cow UK dairy loses roughly £10,000 every month when milk price sits 8-10ppl below cost of production. Right now, that describes most operations. AHDB’s April 2025 data shows just 7,040 producers remaining in Great Britain—down 2.6% in a single year—while First Milk’s operating profit climbed 22% to £20.5 million. Retail discounters now command nearly 20% of UK grocery spend, and post-Brexit policy lacks the milk-specific safety nets that cushioned the 2015-2016 crisis. This isn’t farm failure. It’s market structure. Three approaches are delivering real results for producers fighting to stay viable: strategic culling of the bottom 15% of the herd, precision feed management with qualified nutritionist support, and capturing beef-cross calf premiums through targeted breeding. Combined, these strategies can reduce monthly losses by £7,000-8,000—buying time to explore processor alternatives and the collective engagement approaches already producing results in Ireland.

UK dairy margin pressure

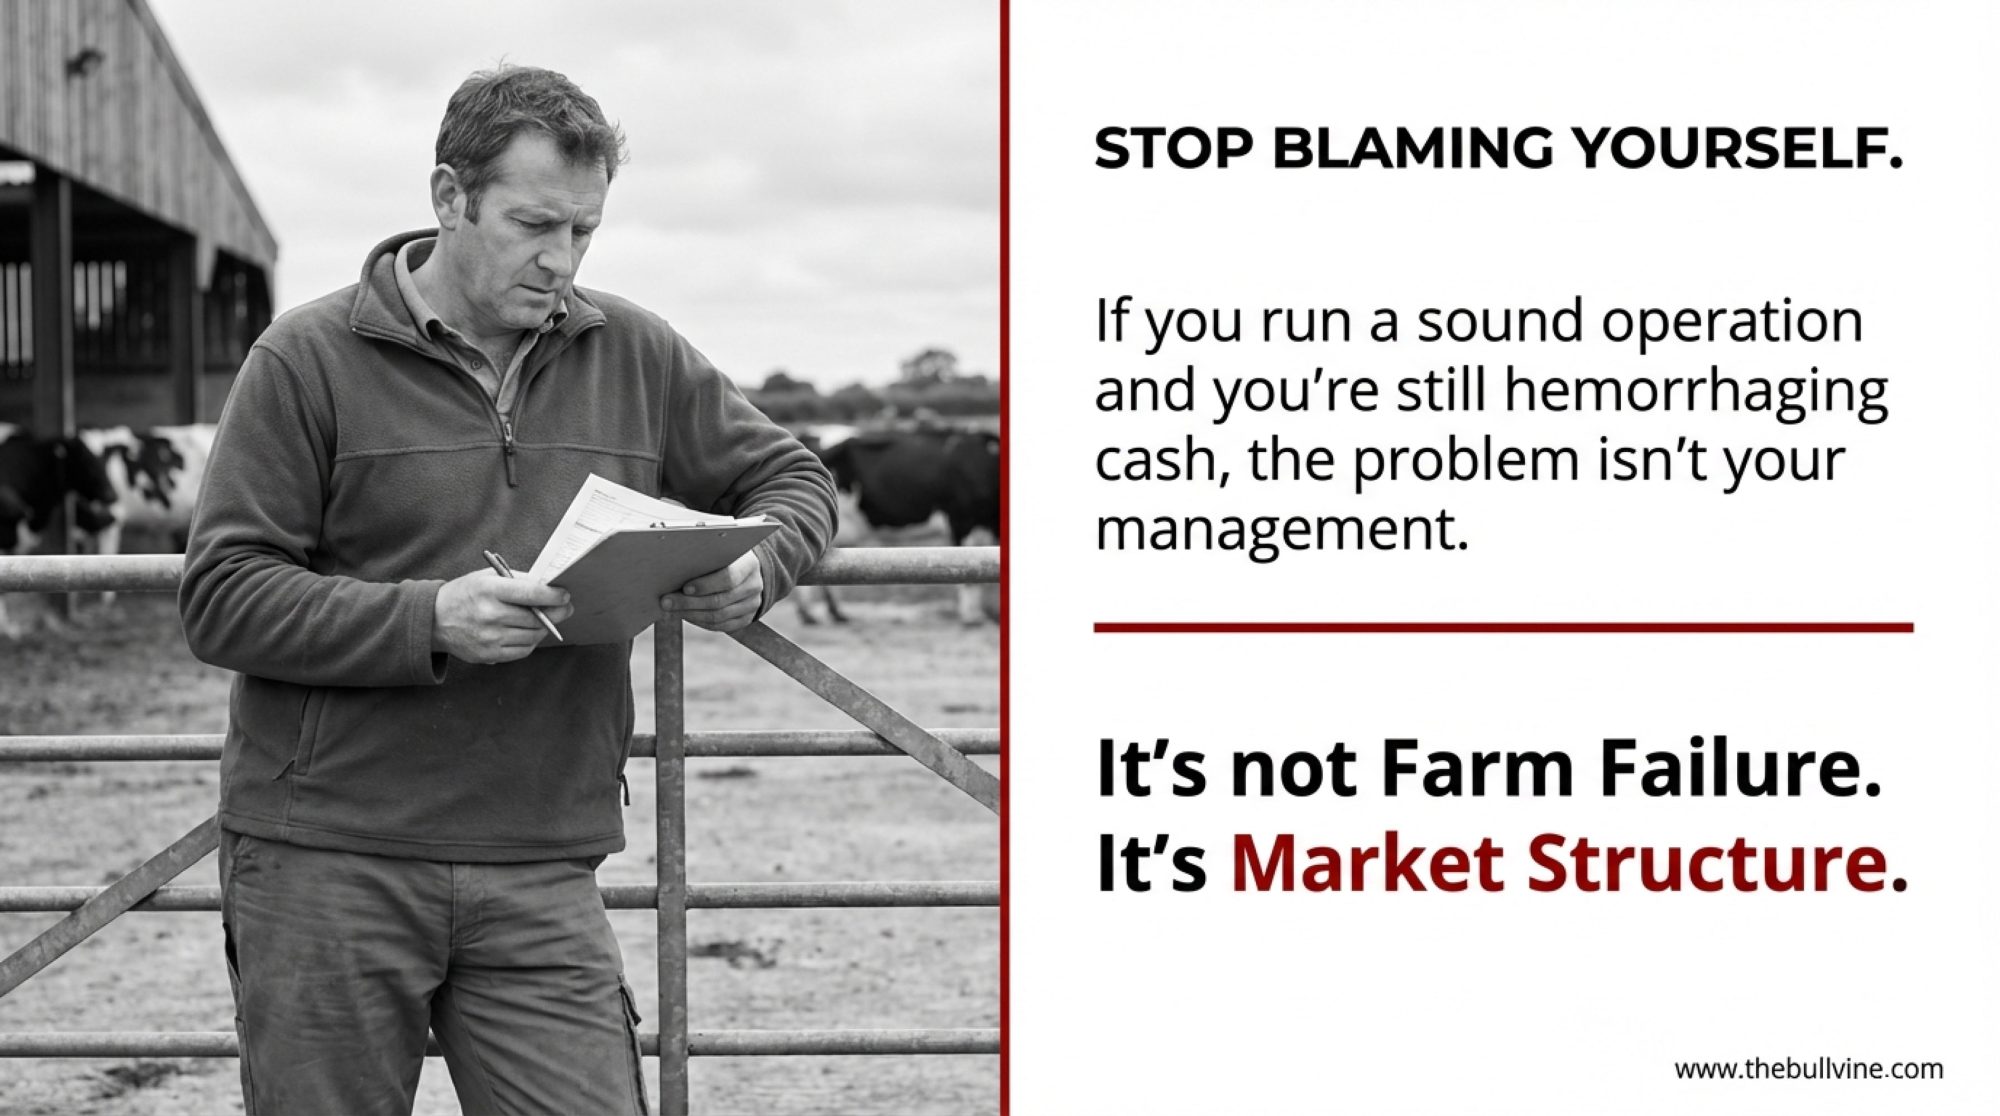
I’ve been talking with UK dairy farmers a lot lately, and you know what keeps coming up? This quiet worry that maybe they’re just not good enough at this anymore. That somehow the losses they’re seeing reflect something they’re doing wrong.

Here’s what I want to say to that: if you’re running a technically sound operation—decent yields, reasonable cell counts, professional management—and you’re still hemorrhaging money, that’s not farm failure. That’s market structure. And there’s a real difference between those two things.

Let me walk you through what I’m seeing.

The Numbers Behind the Frustration

So let’s start with the processor side, because that’s where this story begins.

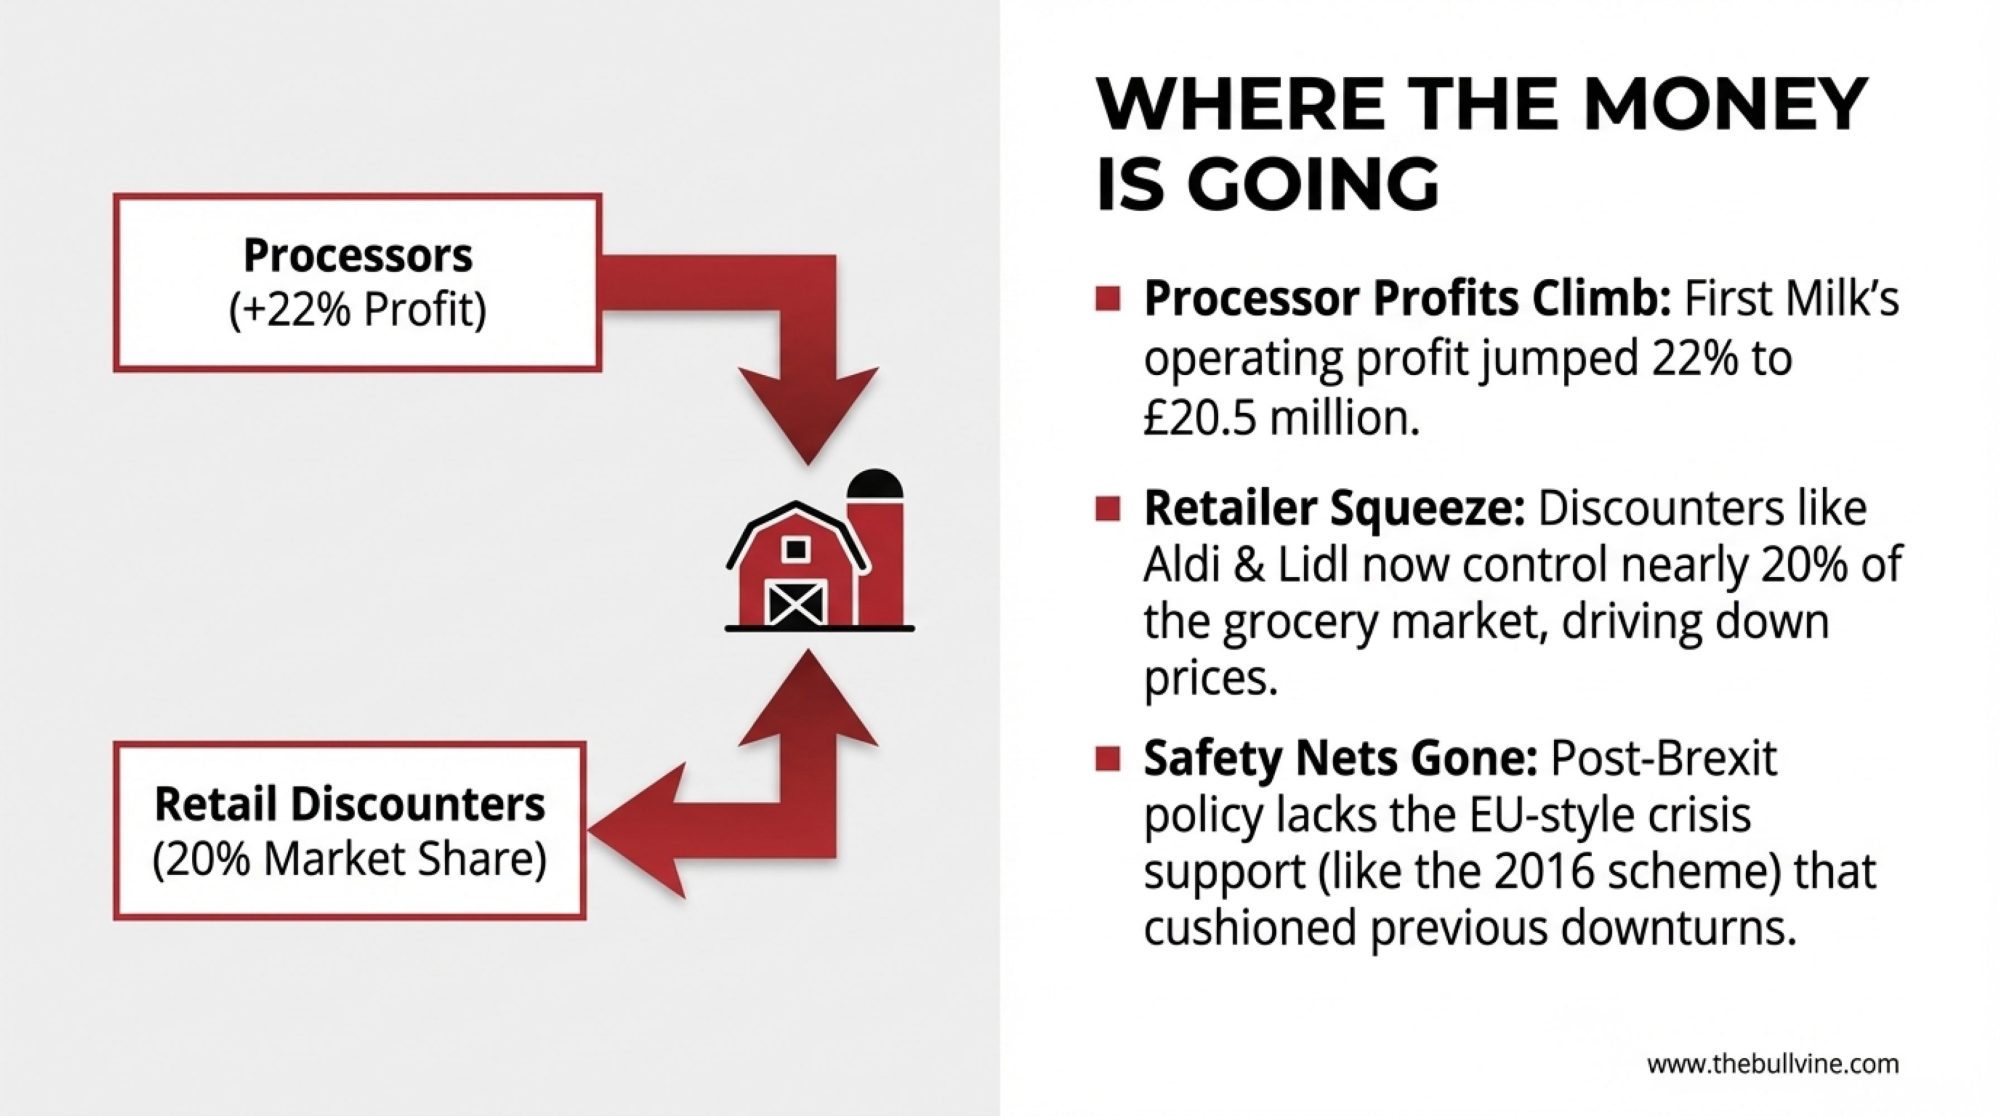
First Milk’s Annual Financial and Impact Report for the year ending March 2025 shows turnover of roughly £570 million and operating profit around £20.5 million—up from £16.8 million the previous year. That works out to an operating margin just over 3.5%. The cooperative points to higher product volumes and the full integration of BV Dairy as key drivers.


Metric
2023/242024/25Change
First Milk Operating Profit£16.8 million£20.5 million+22% ↑
First Milk Operating Margin~3.2%~3.6%+0.4pp ↑
GB Dairy Producers~7,2407,040-2.6% ↓
Farms Exitedn/a~200-200 farms ↓

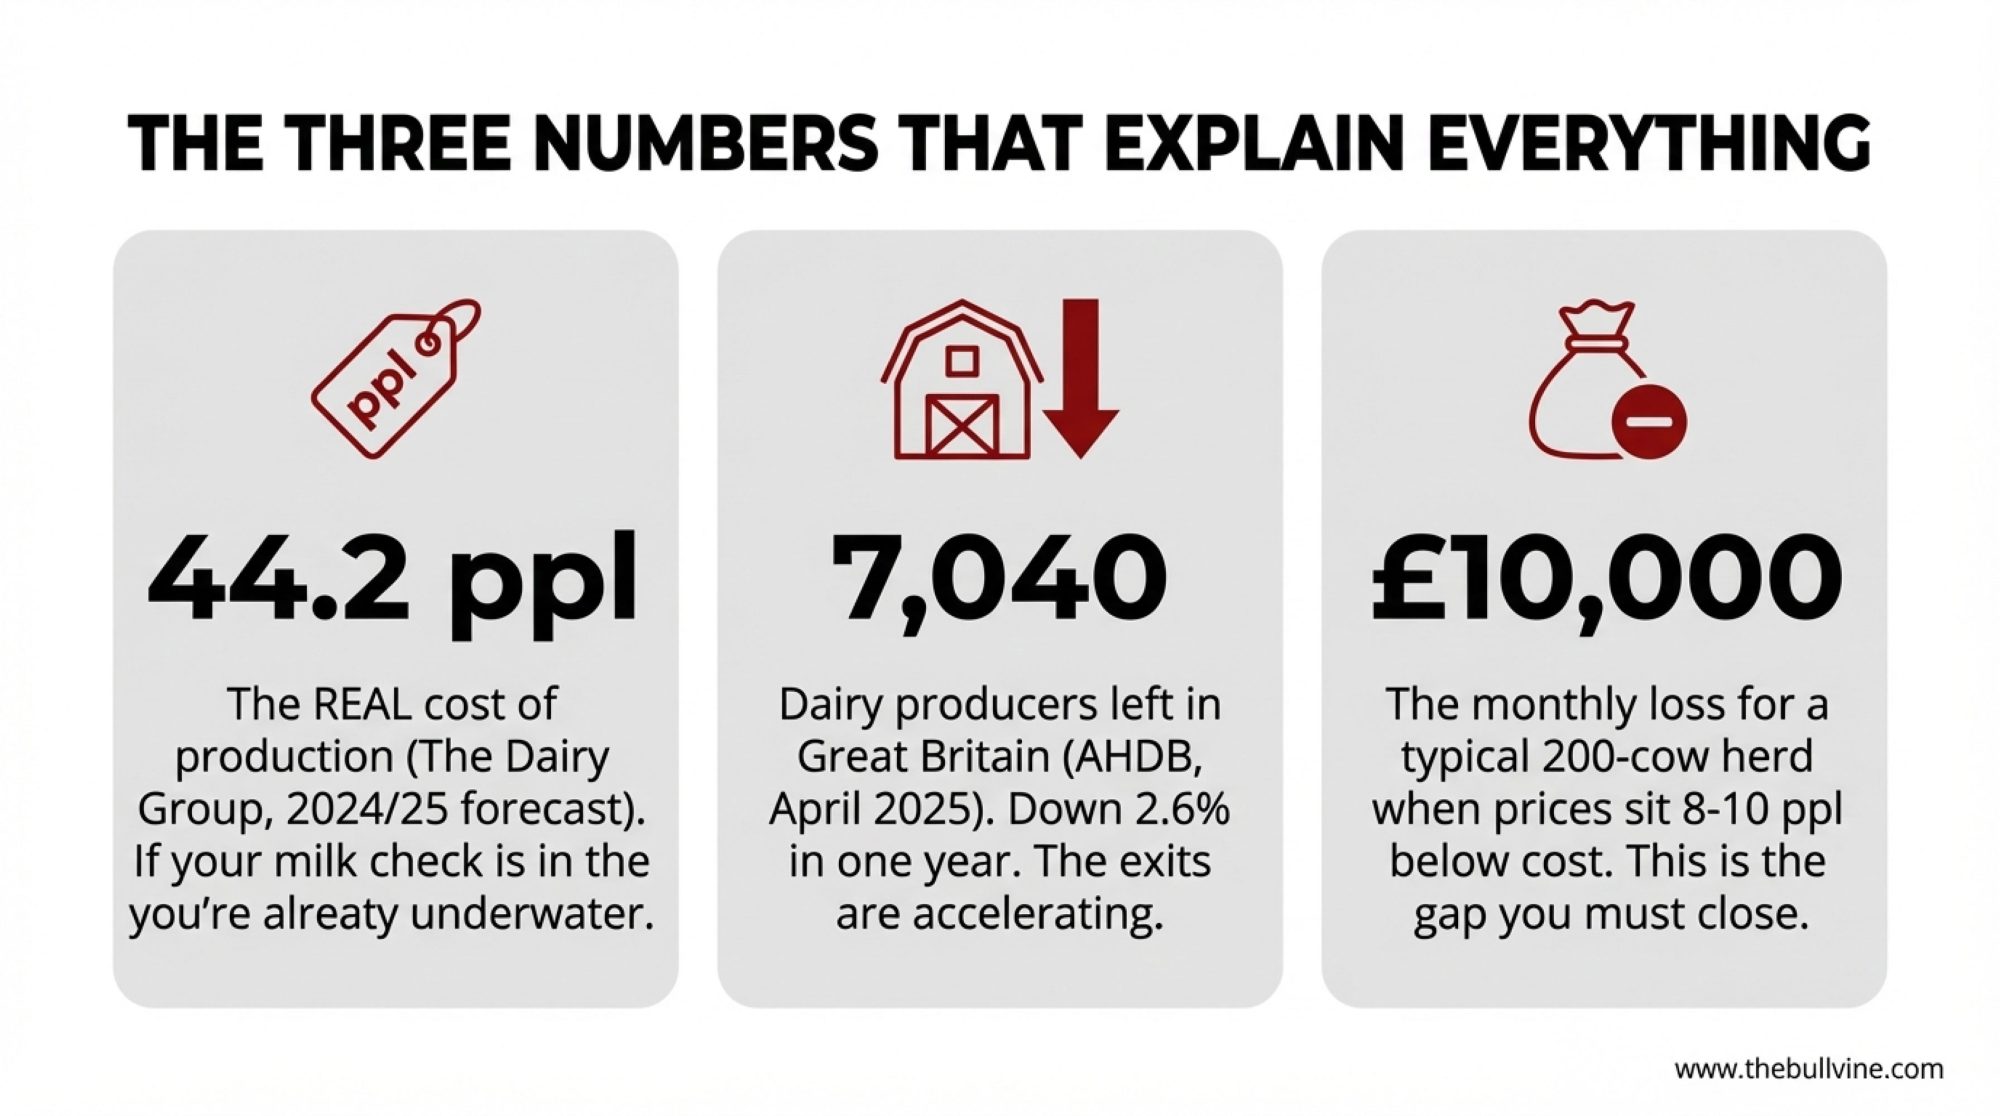
Meanwhile, AHDB’s producer numbers survey from April 2025 shows we’re down to about 7,040 dairy producers in Great Britain. That’s around 160 fewer than the previous survey in October, and nearly 200 fewer than a year ago—a 2.6% annual decline. The exits tend to cluster ahead of winter housing, which makes sense when you think about the capital and workload involved in bringing cows inside.

Here’s what’s interesting, though. Even as farm numbers drop, total milk production keeps climbing. AHDB data shows the GB milking herd continuing its gradual decline, but litres per farm keep rising. Fewer farms, bigger herds, more milk per unit. That pattern’s been consistent for decades now.

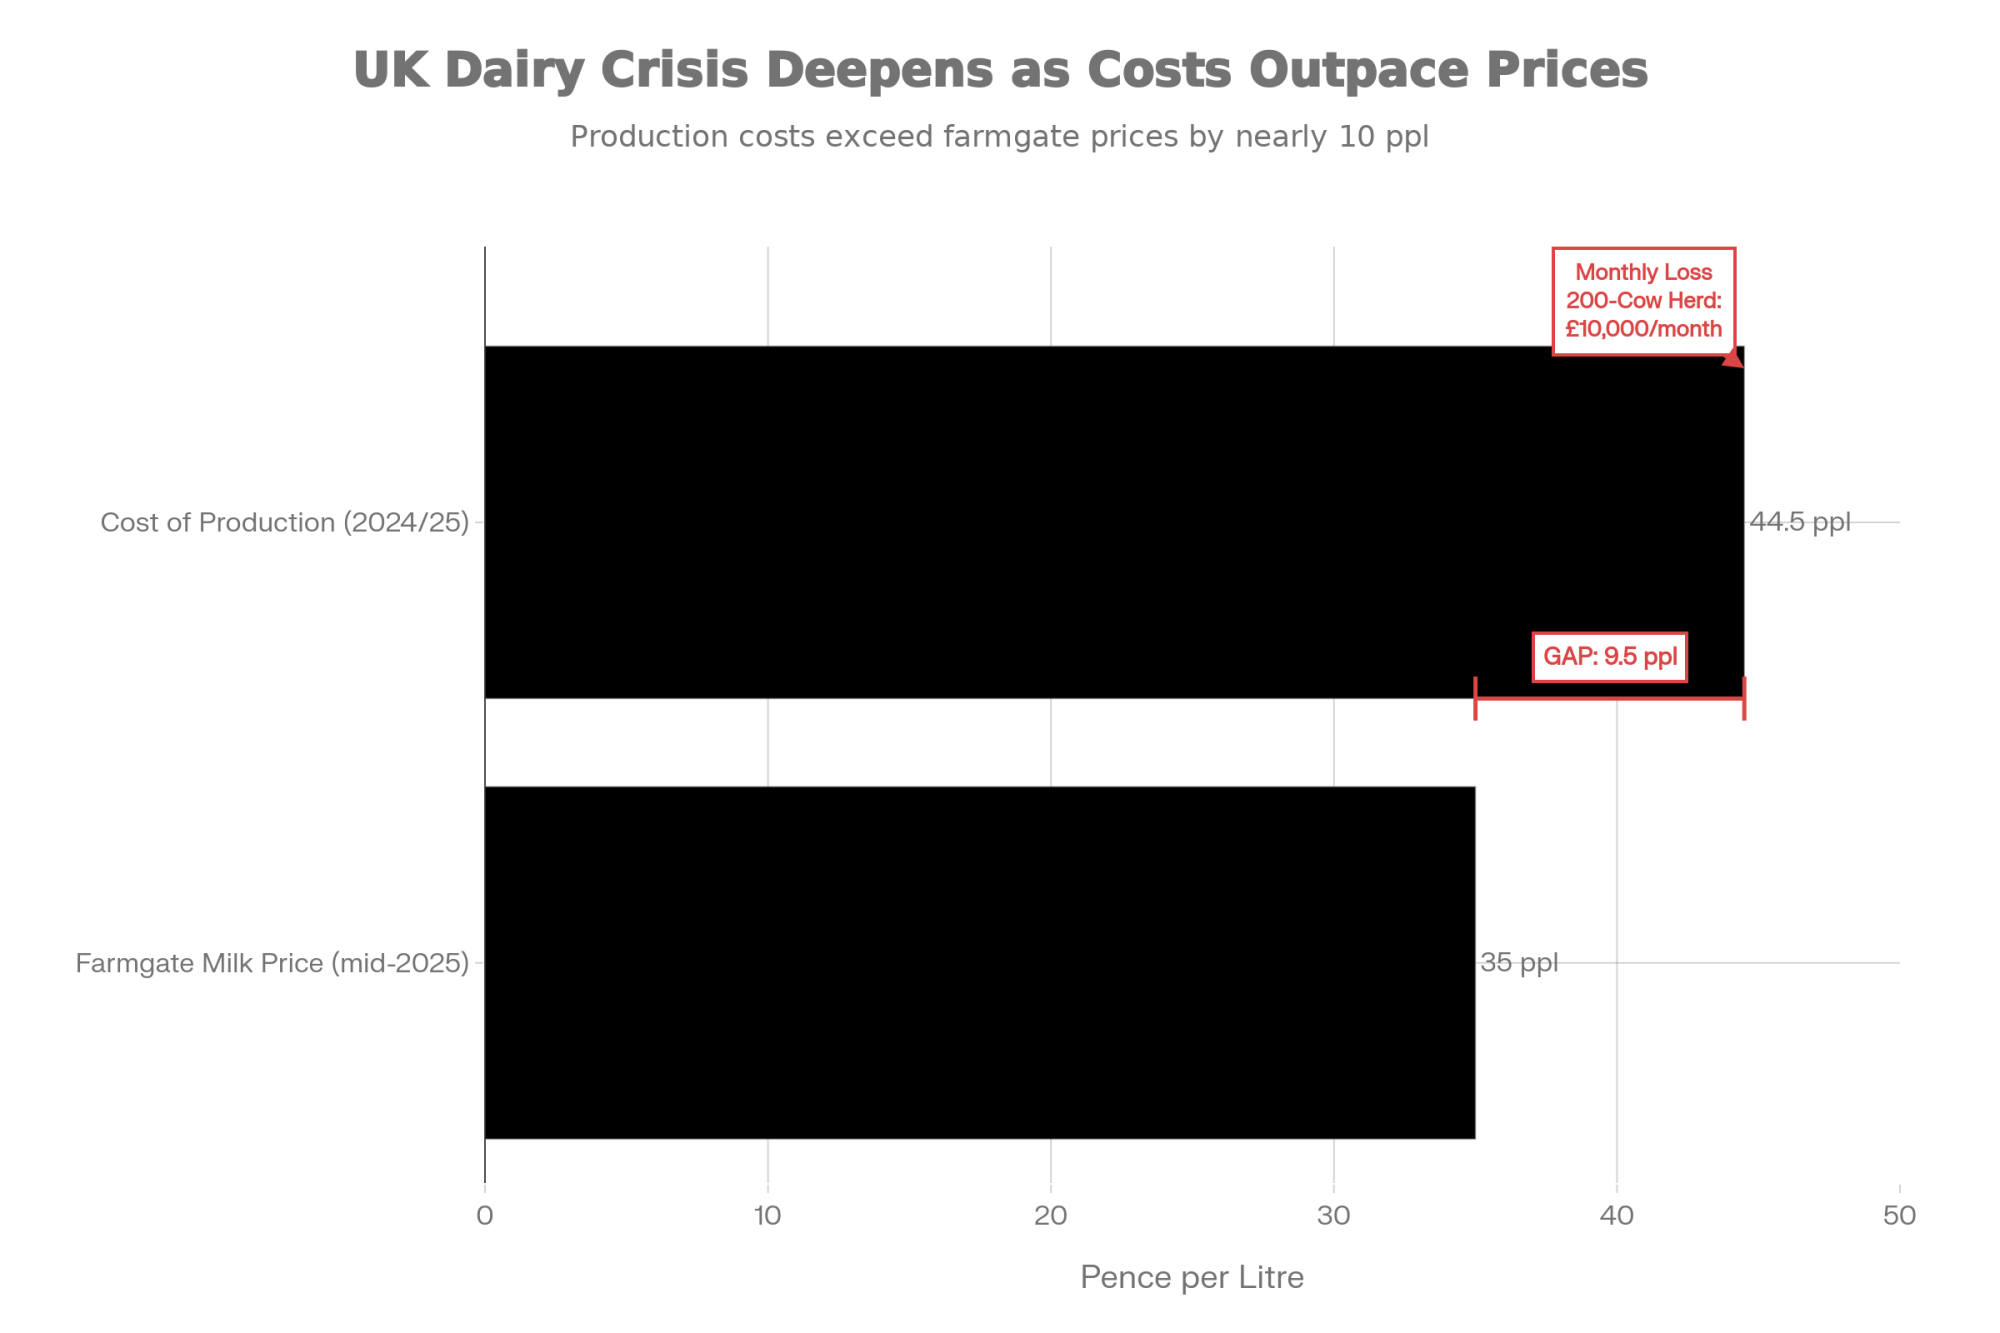
And the cost picture? The Dairy Group’s September 2024 newsletter pegs the UK cost of production for 2023/24 at around 45 ppl, with their forecast for 2024/25 at approximately 44.2 ppl. Their analysis suggests it’s “extremely unlikely” we’ll see costs drop back below 40 ppl anytime soon.

So when farmgate prices sit in the mid-30s and the cost of production hovers in the mid-40s, you’ve got a gap of roughly 8-10 ppl. For a 200-cow herd producing about 1.5 million litres annually, that works out to something like £120,000 a year—close to £10,000 a month just to stand still.

The £10,000 gap that’s killing UK dairy farms isn’t about bad management—it’s about market structure.

Now, every farm pencils out differently. But consultants I’ve spoken with say these kinds of numbers line up pretty closely with what they’re seeing in real accounts.

Why This Cycle Feels Different

If you’ve been farming through previous downturns, you’re probably thinking about 2015-2016 right now. Similar oversupply pressures, similar price corrections. But something feels different this time, and I think that instinct is worth exploring.

During the 2015-2016 crisis, Brussels stepped in with a €150 million EU-wide scheme—created through Delegated Regulation 2016/1612—that paid farmers voluntarily to reduce milk deliveries for a few months. According to the European Court of Auditors’ special report on the EU’s response to the milk market disturbances, aid was set at €14 per 100 kg of milk to reduce deliveries by around 1.1 million tonnes. It wasn’t a perfect solution, but it was something.

Since leaving the EU, the UK hasn’t had a like-for-like replacement for that specific tool. Support has tended to come through broader environmental schemes and general farm payments rather than milk-specific production incentives. When processors announce cuts today, there’s less cushion. And it’s worth noting that devolved agricultural policies mean Scottish and Welsh producers face different support landscapes than those in England—something that adds another layer of complexity when comparing notes with neighbours across borders.

The retail landscape has shifted, too. Kantar’s December 2025 grocery data shows Aldi holding about 10.5% of the UK market and Lidl at 8.1%. Together, discounters now account for close to a fifth of all grocery sales—up from around 13.6% just five years ago. That buying power inevitably influences how hard they push wholesale prices, including dairy prices. It’s not that traditional supermarkets don’t care about farmgate sustainability—many genuinely do—but it’s harder to hold that line when your competitors are focused purely on cost.

And then there’s the processor balance sheet question. First Milk and others have taken on debt for capacity investments and acquisitions. When leverage ratios are around 3x and debt service coverage needs to be protected, there’s real pressure to maintain margins. I don’t think farmers should dismiss these constraints as excuses—they’re genuine business realities that boards have to navigate.

What producers are discovering is that the support architecture from the last major crisis has changed. Understanding that helps you think more clearly about your options.

Three Approaches That Are Actually Working

Understanding the market is useful, but you need actionable steps. I’ve been tracking what’s delivering results for farms navigating this environment, and three approaches keep coming up in the operations that are extending their runway.

Taking a Hard Look at the Herd

Here’s something that sounds counterintuitive but makes good financial sense: thoughtful culling can improve your monthly position even while reducing production.

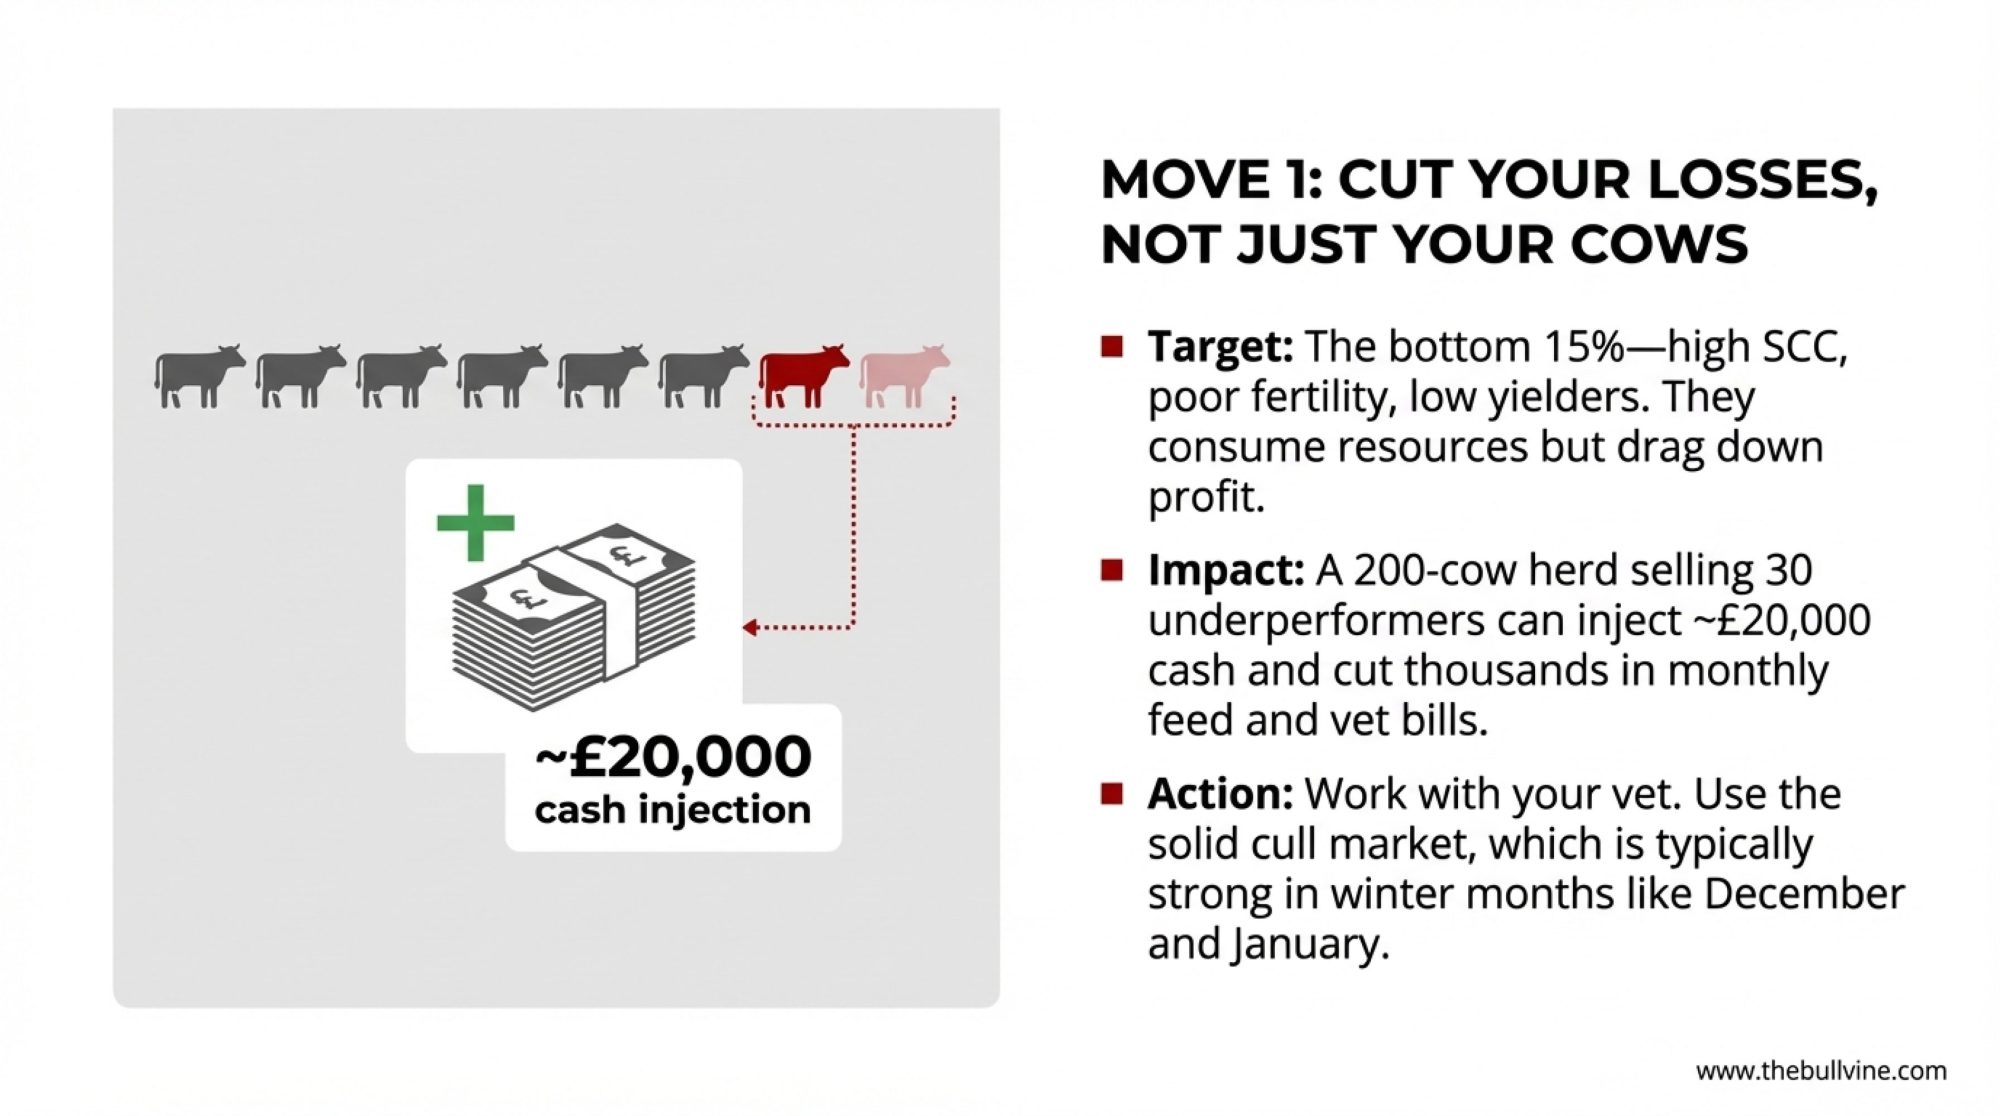
You probably know this already, but the bottom 15% of most herds—cows with persistent cell counts above 400,000, yields consistently below 20 litres daily, or chronic fertility challenges—consume similar feed, labour, and veterinary resources as top performers while generating less revenue meaningfully. We’ve understood this principle for years, but current market conditions make acting on it more urgent.

I recently spoke with a consultant who walked through the numbers with a 200-cow client in northern England. They identified about 30 chronically under-performing cows—high cell counts, repeated fertility issues, cows that had been given plenty of chances—and sold them into a solid cull market at roughly £650 a head. That brought in close to £20,000 in cash.

Financial ComponentCalculation (200-cow herd)Impact
Bottom 15% Identified30 chronically under-performing cowsHigh SCC, low yield, poor fertility
Immediate Cull Revenue30 cows × £650/head£19,500 cash
Monthly Feed SavingsReduced ration costs + supplements£2,000-3,000/month
Annual Feed Savings£2,500/month × 12 months£24,000-36,000/year
Total Year 1 Financial ImpactCash + savings£43,500-55,500

Source: Consultant case study, northern England; cull market pricing autumn 2025

More importantly, the farm cut its monthly feed bill by several thousand pounds and saw modest savings in vet and labour costs. The net effect moved them from a deeply negative monthly position to a more manageable one.

While every herd pencils out differently depending on your system, your cull market, and your costs, these are the kinds of numbers many accountants are now working through with clients. The key is being honest about which animals are genuinely contributing and which are just consuming resources. Work with your vet to ensure culling decisions account for your calving pattern and transition cow management—you don’t want to create gaps in your fresh cow pipeline that cause problems six months down the road.

With December and January typically being strong months for cull cow demand—processors need to fill orders before spring, and the beef trade tends to hold up well through winter—the timing for these decisions is actually reasonable right now.

Getting Smarter on Feed

Feed typically represents 40-60% of production costs, so even modest improvements here compound meaningfully. Two levers deserve attention, and they work well together.

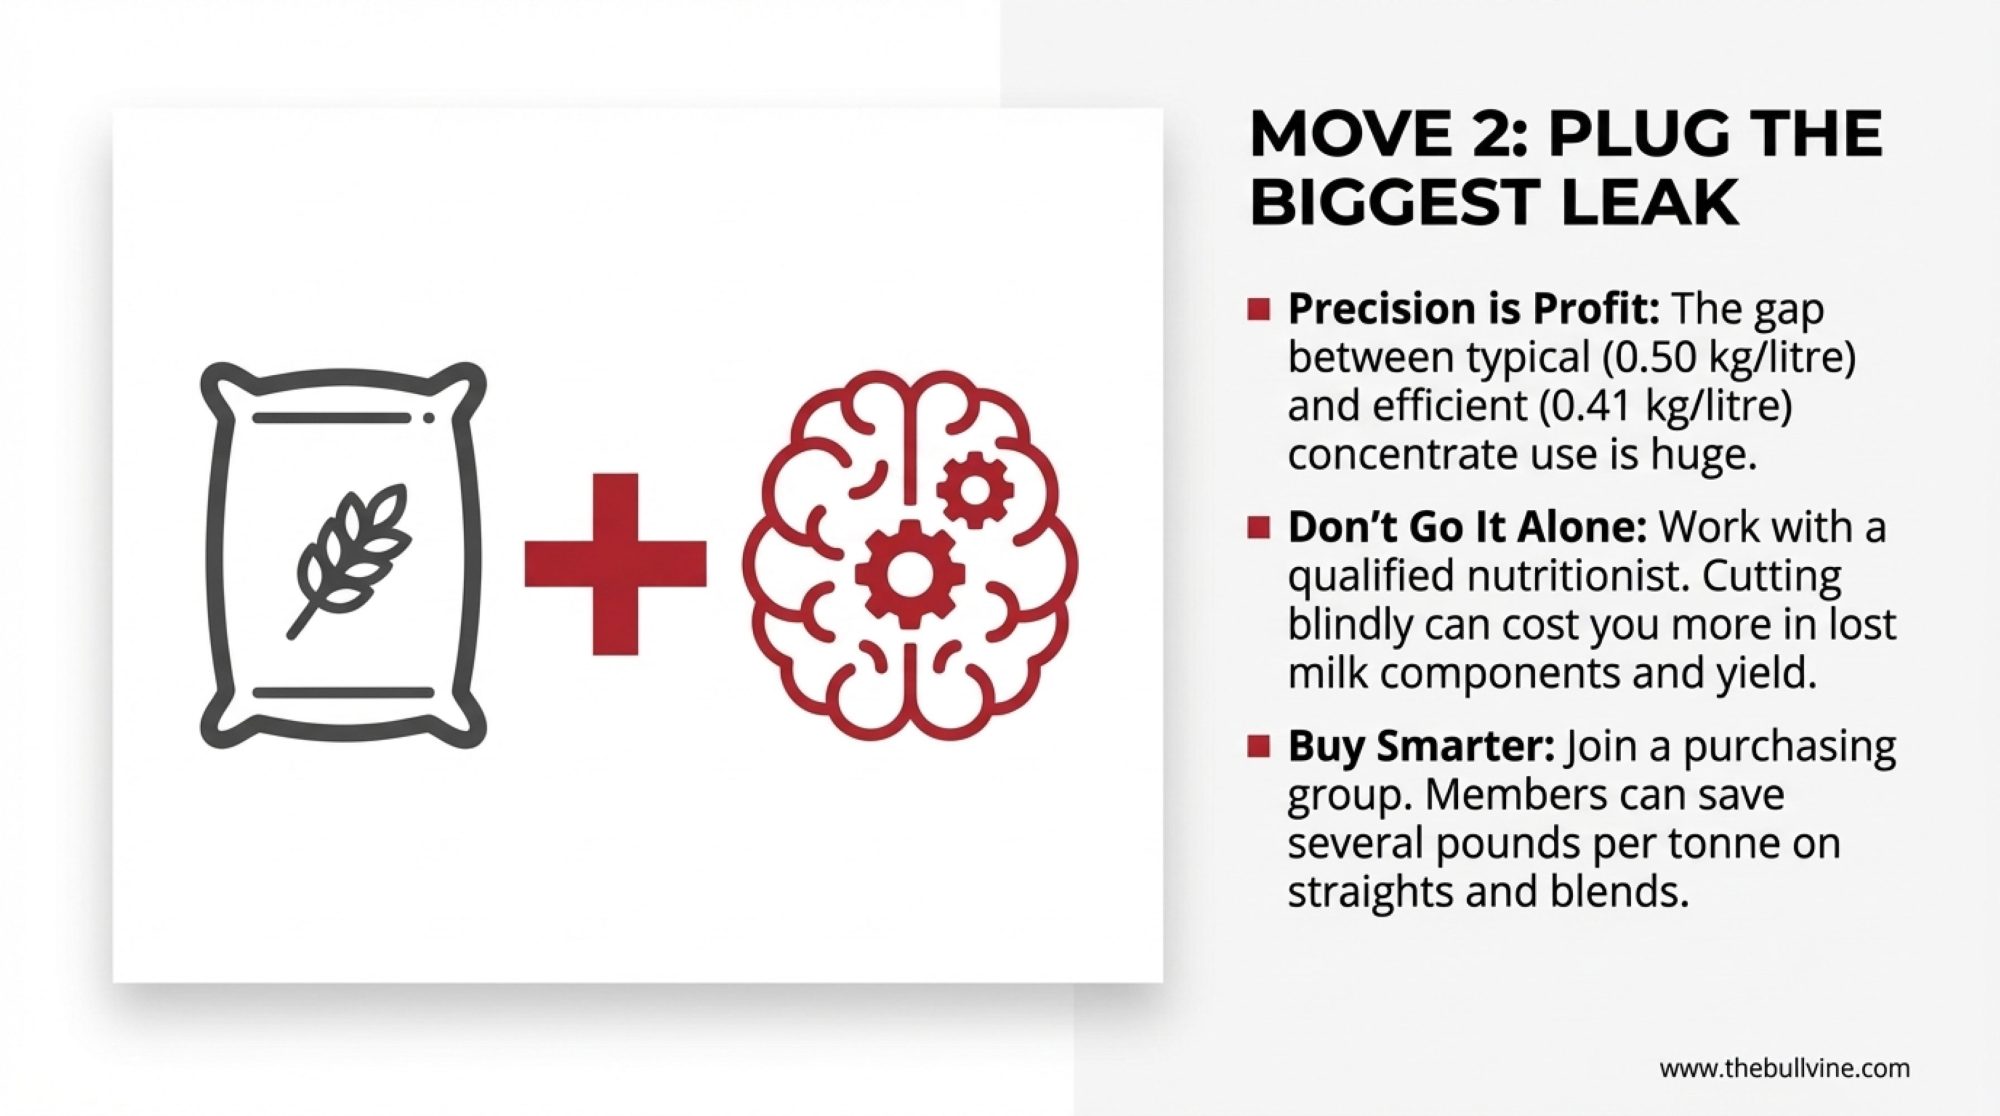
The first involves precision nutrition. Advisers from groups like The Dairy Group and Kingshay regularly highlight the gap between typical and efficient operations on concentrate use—sometimes 0.50 kg per litre versus 0.41 kg per litre. That gap represents real money over the course of a lactation.

But here’s the thing—and I can’t stress this enough—closing that gap requires proper involvement from a nutritionist. Cut too aggressively without professional guidance, and you risk losing more in butterfat and protein performance than you save on inputs. I’ve seen farms try to do this on their own and end up worse off because yields or components drop. Get someone qualified involved before you change rations.

The second lever is collective purchasing. Advisers from Kingshay and The Dairy Group report that members of their buying groups can often secure noticeably better prices on straights and blends than lone buyers—sometimes shaving several pounds per tonne off the ticket price. The exact savings vary by region and by what you’re buying, but across a winter, those differences add up.

What’s encouraging is that I’m hearing about more farms in the Southwest and Midlands joining these groups this autumn. The administrative overhead is minimal, and the buying power is real.

Finding Revenue on the Margins

This is where farms can add income without major capital requirements.

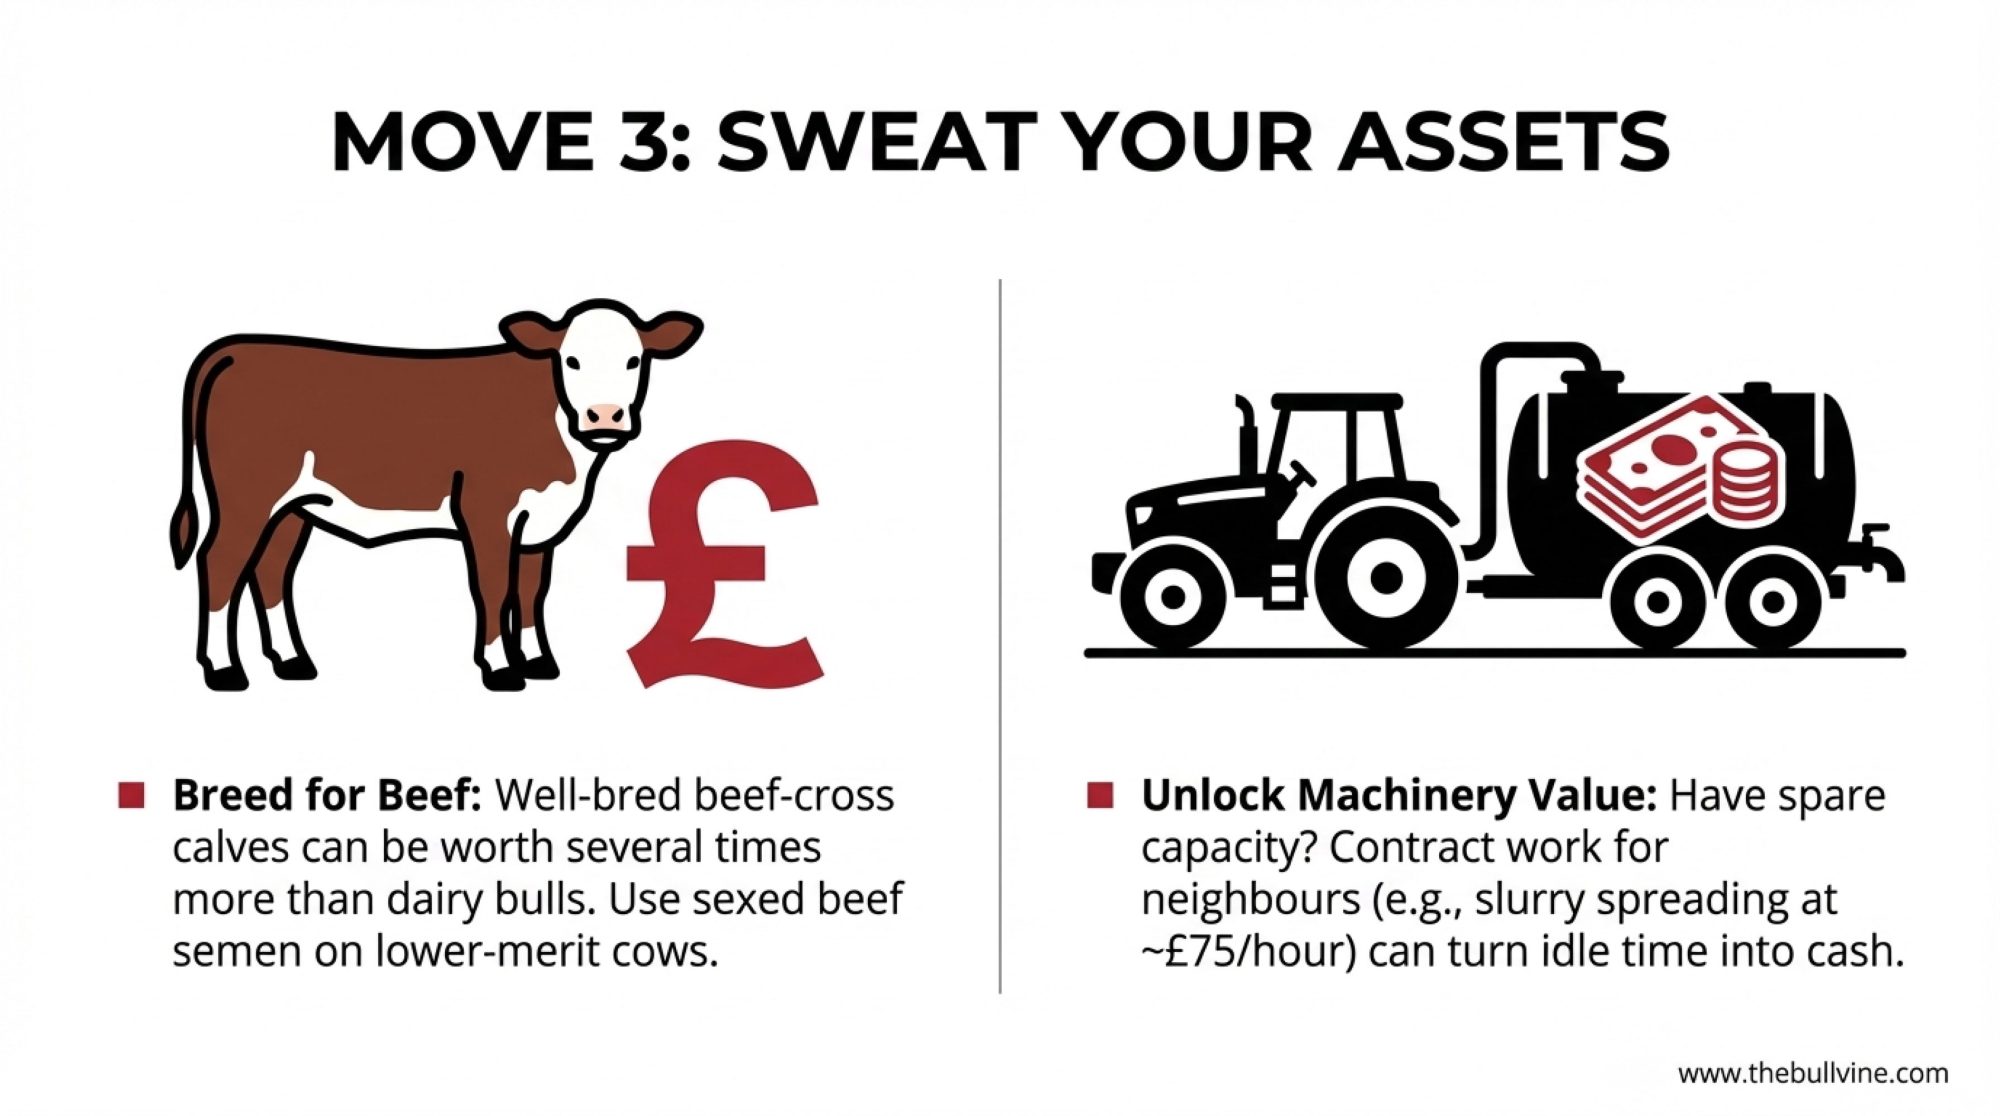
In current UK auctions, it’s not unusual to see well-bred beef-cross dairy calves selling for several times the value of plain dairy bull calves. One recent market report from the South of England showed continental-cross calves comfortably into the low hundreds of pounds, while plain dairy bulls lingered at much lower values. Using sexed beef semen on cows not needed for herd replacement is a straightforward way to capture some of that premium.

Calf TypeTypical Market ValueAnnual Calves (200-cow herd)Annual RevenuePremium vs Dairy Bull
Plain Dairy Bull£20-4050£1,000-2,000Baseline
Beef-Cross (Continental)£100-15050£5,000-7,500+£4,000-5,500
Your OpportunitySwitch 40-50 calves40-50+£3,200-6,000£80-120 per calf

For a 200-cow operation with flexibility on breeding decisions for 100-plus females, targeting 40-50 beef crosses annually can add meaningful revenue without changing much else about your system.

The contracting opportunity also deserves a look. The NAAC Contracting Prices Survey for 2024-25 puts typical charges for slurry spreading with a tanker and trailing shoe at around £75 per hour, with forage harvesting operations ranging from £83 to over £200 per acre depending on the service level. For a farm with decent machinery and some spare labour capacity, doing a modest amount of contract work for neighbours can turn idle time into a few hundred pounds a month during peak seasons.

Neither of these is transformative on its own. But combined with the herd and feed work, they add up to something that can make the difference between a sustainable position and a forced exit.

44-45 ppl
Your real cost of production
According to The Dairy Group's September 2024 analysis, this is where UK operations sit today. If your milk check is in the mid-30s, you're underwater before you start.
7,040
Dairy producers remaining in Great Britain
AHDB's April 2025 survey count. That's 2.6% fewer than a year ago. The exits are accelerating, and they're concentrated in winter—right now.
£10,000/month
What a 200-cow herd loses when prices sit 8-10 ppl below cost
That's £120,000 a year just to stand still. This is the gap farms are trying to close with the strategies in this article.

The Combined Picture

When I model all three approaches together—strategic culling, feed optimisation, and revenue diversification—the financial shift becomes meaningful.

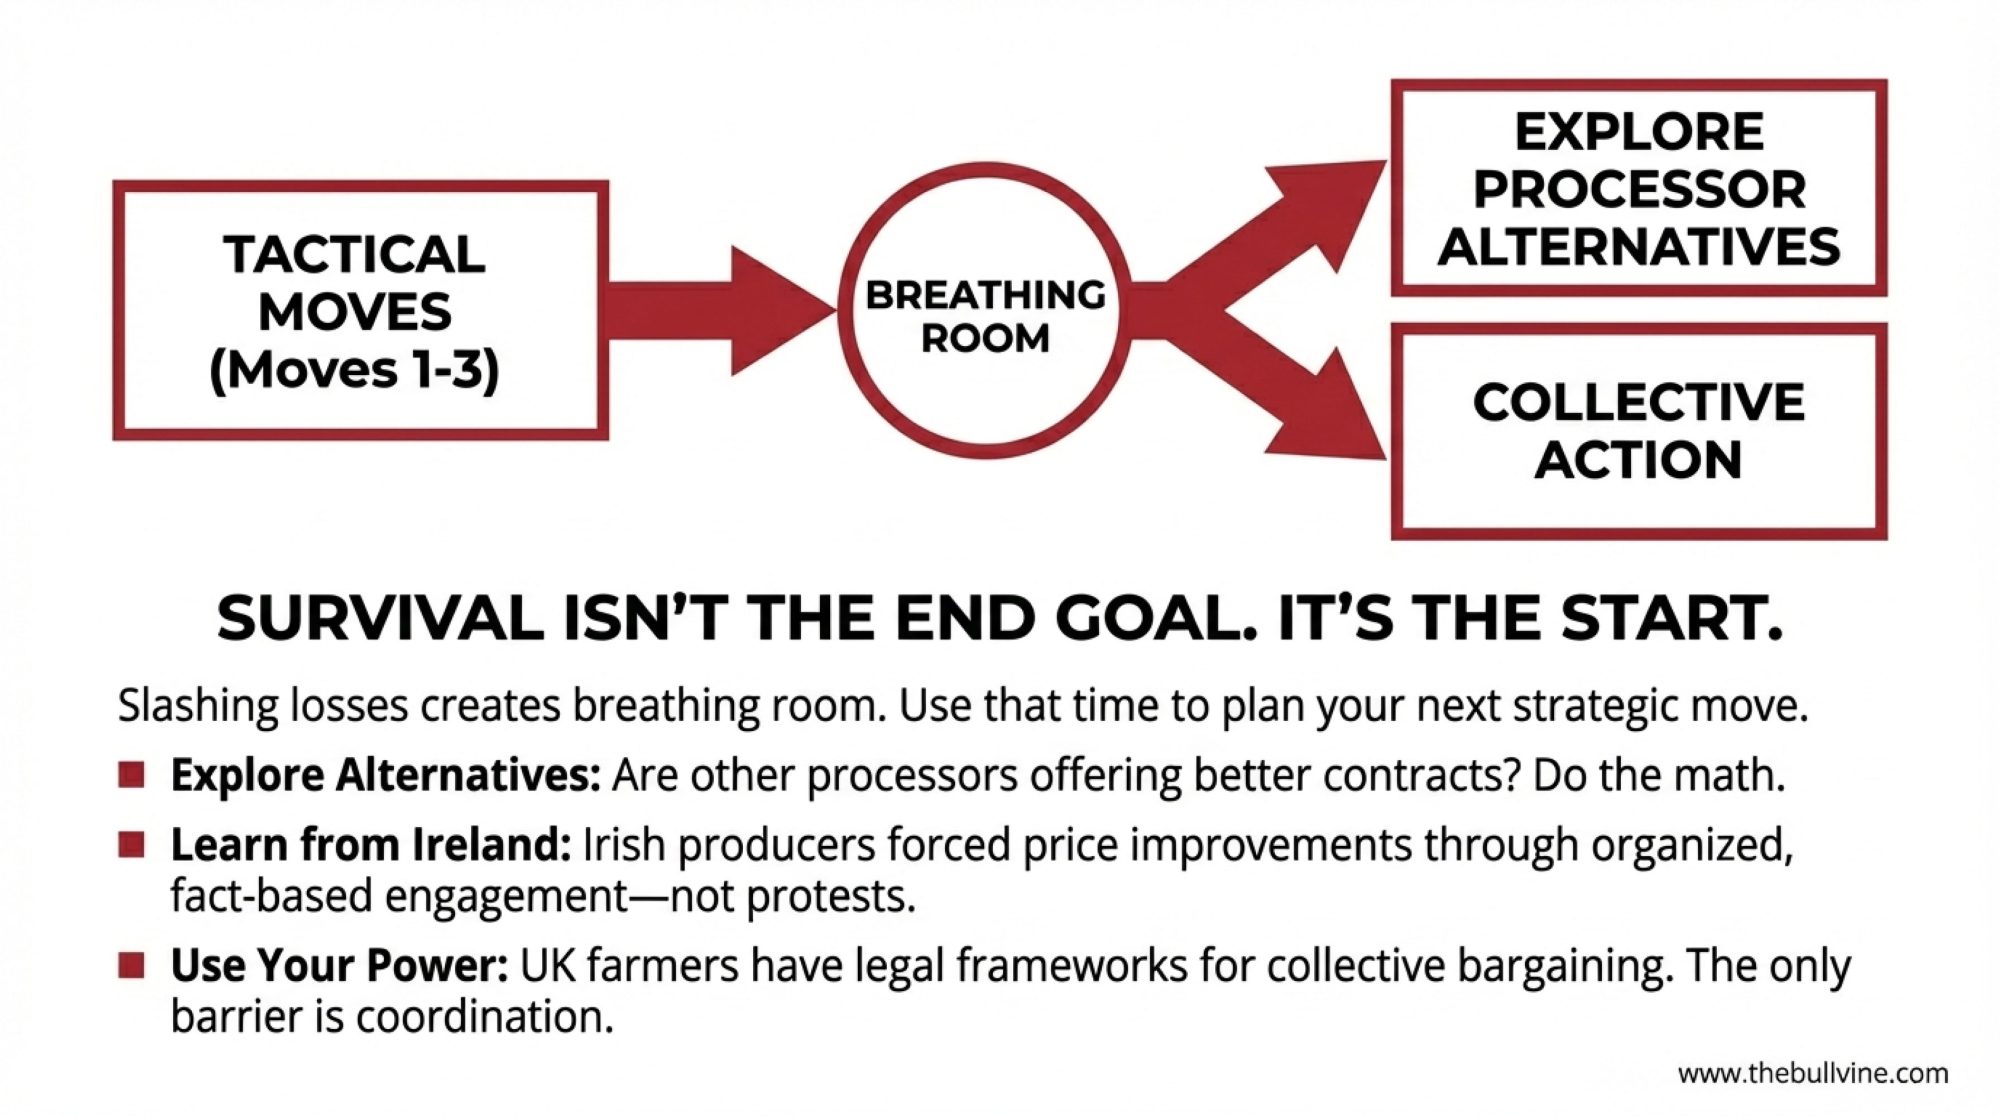
For a 200-cow operation starting at roughly £10,000 monthly losses, you might get that down to £2,000-3,000 monthly through these changes, plus a one-time cash injection from the cull animals. For larger 500-cow operations, the numbers scale accordingly.

From crisis to breathing room in three strategic moves. This waterfall chart shows the actual financial trajectory when UK dairy farms implement

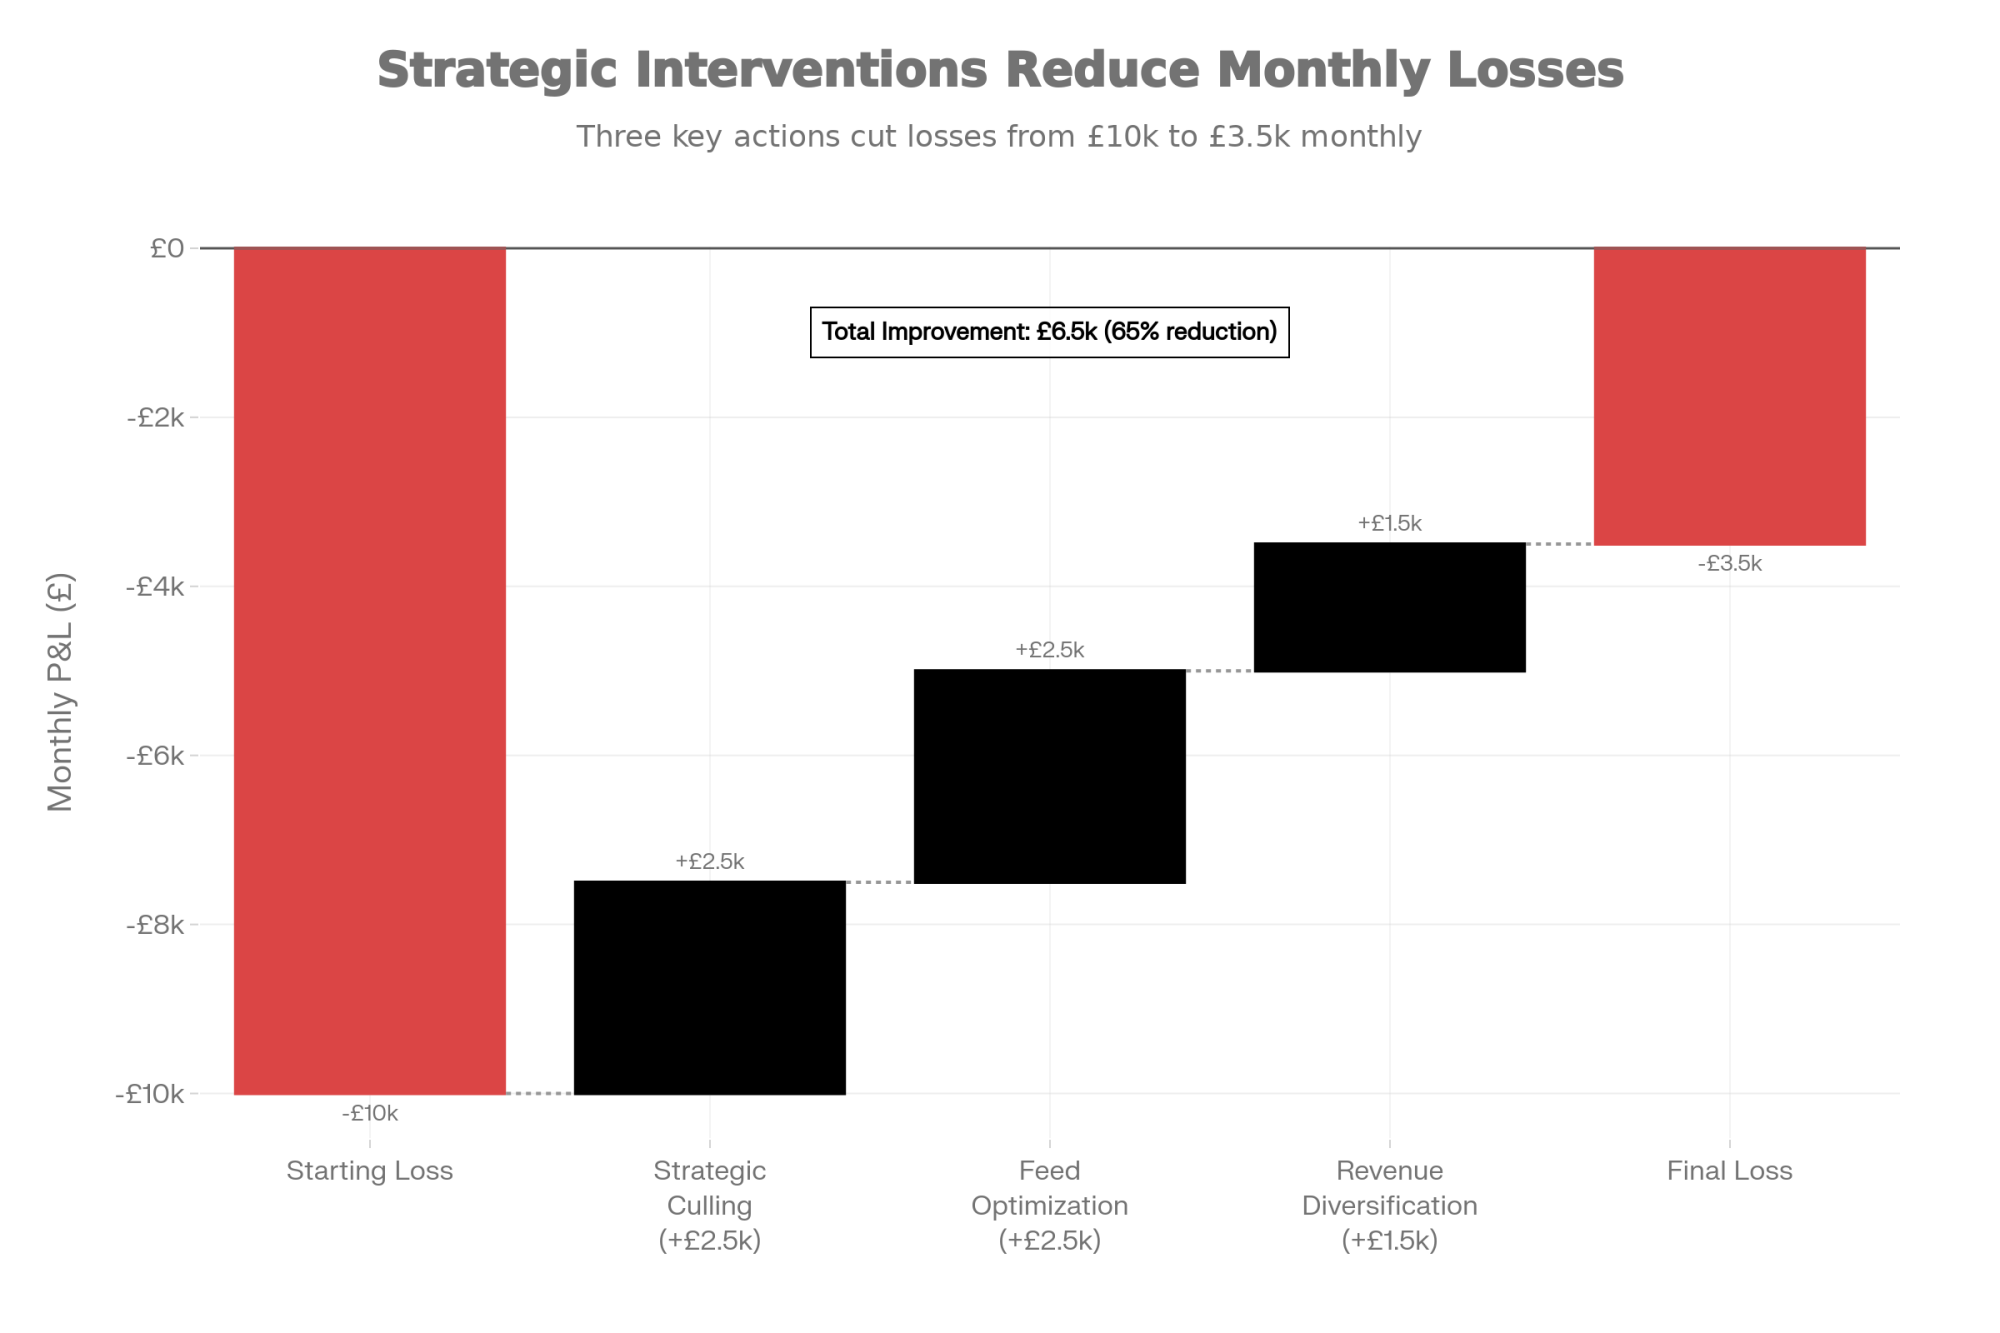
That’s not a permanent solution—farmgate prices are still below the full cost of production. But it creates time. Time to explore processor alternatives if better prices are available elsewhere. Time to think about collective approaches. Time to restructure financing if needed. Time to plan transitions thoughtfully rather than under immediate pressure.

And that time matters more than people often realise.

What the Irish Experience Suggests

I’ve been following developments at Dairygold in Ireland because they offer an interesting case study in producer coordination.

When Dairygold announced pricing adjustments this autumn, Irish farming media reported that several hundred farmers quickly organised around concerns about pricing and attended regional meetings with detailed written questions. While the exact figures vary depending on who you talk to, producers on the ground say this collective approach helped prompt partial improvements in the farmgate price rather than further cuts.

Their approach was notably constructive—no protests or supply withholding, just organised attendance at meetings with specific questions about pricing formulas, operational costs, and capital allocation. When a meaningful share of your supplier base shows up with identical written questions, it changes the tone of the conversation.

What’s worth noting is that UK farmers actually have stronger legal frameworks available to them. Recent Defra regulations mandate pricing transparency and good-faith engagement in dairy contracts, and producer organisation structures enable collective dialogue without competition law concerns.

The barrier isn’t legal authority—it’s coordination. And the Irish experience suggests coordination doesn’t require formal structures or membership dues. It requires communication channels, commitment mechanisms, and producers willing to engage constructively with specific questions.

Looking Ahead: What the Projections Suggest

If current pricing dynamics persist, what trajectory should producers anticipate?

Based on AHDB data and Andersons’ outlook analysis, the consolidation pattern we’ve seen for decades looks set to continue—possibly accelerate. According to the Andersons Outlook report covered by Dairy Global, authors Mike Houghton, Oliver Hall, and Tom Cratchley project that GB dairy producers could fall to between 5,000 and 6,000within the next two years. Average herd size would continue climbing, possibly toward 250 head or beyond. Total production would likely remain stable as surviving farms expand.

In 24 months, UK dairy could lose another 1,500 farms—and average herd size will climb past 250 head. 

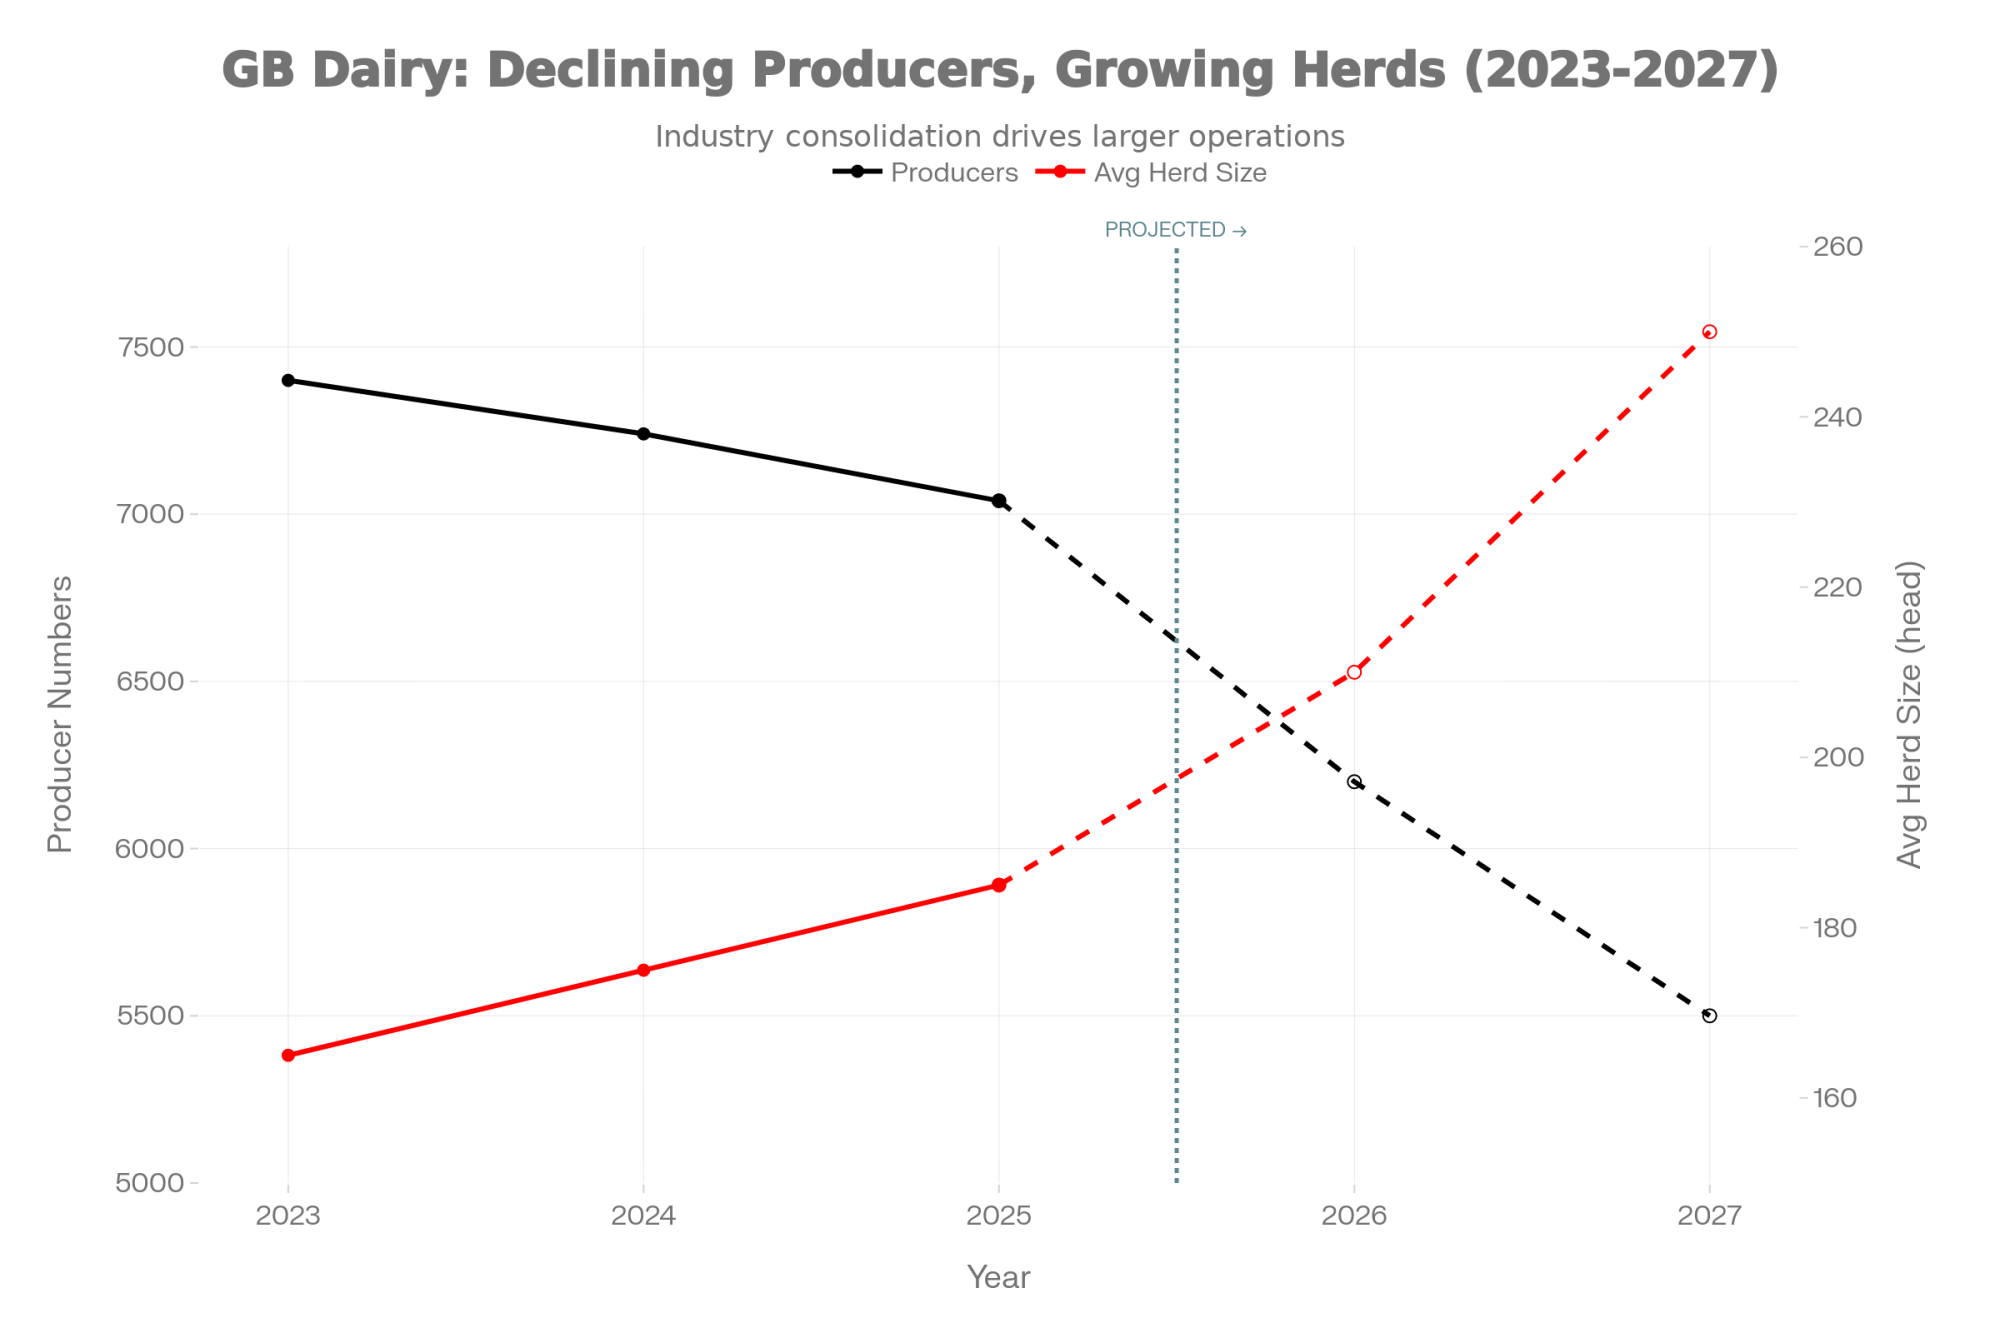
Exit rates will probably vary significantly by scale and region. Smaller operations—those under 100-150 cows—generally face steeper challenges because their cost structures tend to run higher. Larger operations often achieve better economies of scale on fixed costs. That’s not a judgment about who’s a better farmer; it’s just the economics of spreading overhead across more litres.

Understanding this trajectory helps you make informed decisions about your own operation and timeline.

A Word on Cooperatives

Under UK cooperative law, boards are expected to act in the long-term interests of the society and its members, which often means paying close attention to balance-sheet strength, covenants, and investment needs alongside the current milk price. In practice, management decisions sometimes lean toward protecting the co-op’s viability, even when members face short-term income pressure.

I want to be fair here—boards aren’t being malicious when they make difficult pricing decisions. They’re navigating genuine constraints and competing obligations. But fairness has limits.

Loyalty is a two-way street. If the governance structure consistently prioritizes the institution over the member’s survival, the member has to ask a hard question: Am I actually an owner here, or am I just a supplier with a liability attached?

Because there’s a difference between a cooperative that asks members to share sacrifice during difficult periods and one that protects its margins while members bleed equity. The first is partnership. The second is something else entirely.

Different cooperative models do exist internationally. Some Canadian and European structures have achieved farmgate prices meaningfully above UK equivalents through different charter provisions and member engagement approaches. Whether UK cooperatives could evolve similarly is an open question—but it won’t happen without sustained producer engagement in governance processes. Boards respond to pressure. If members don’t apply it, nothing changes.

The Bottom Line

If you’ve read this far, you’re probably thinking about what all this means for your own situation. Let me offer a few thoughts.

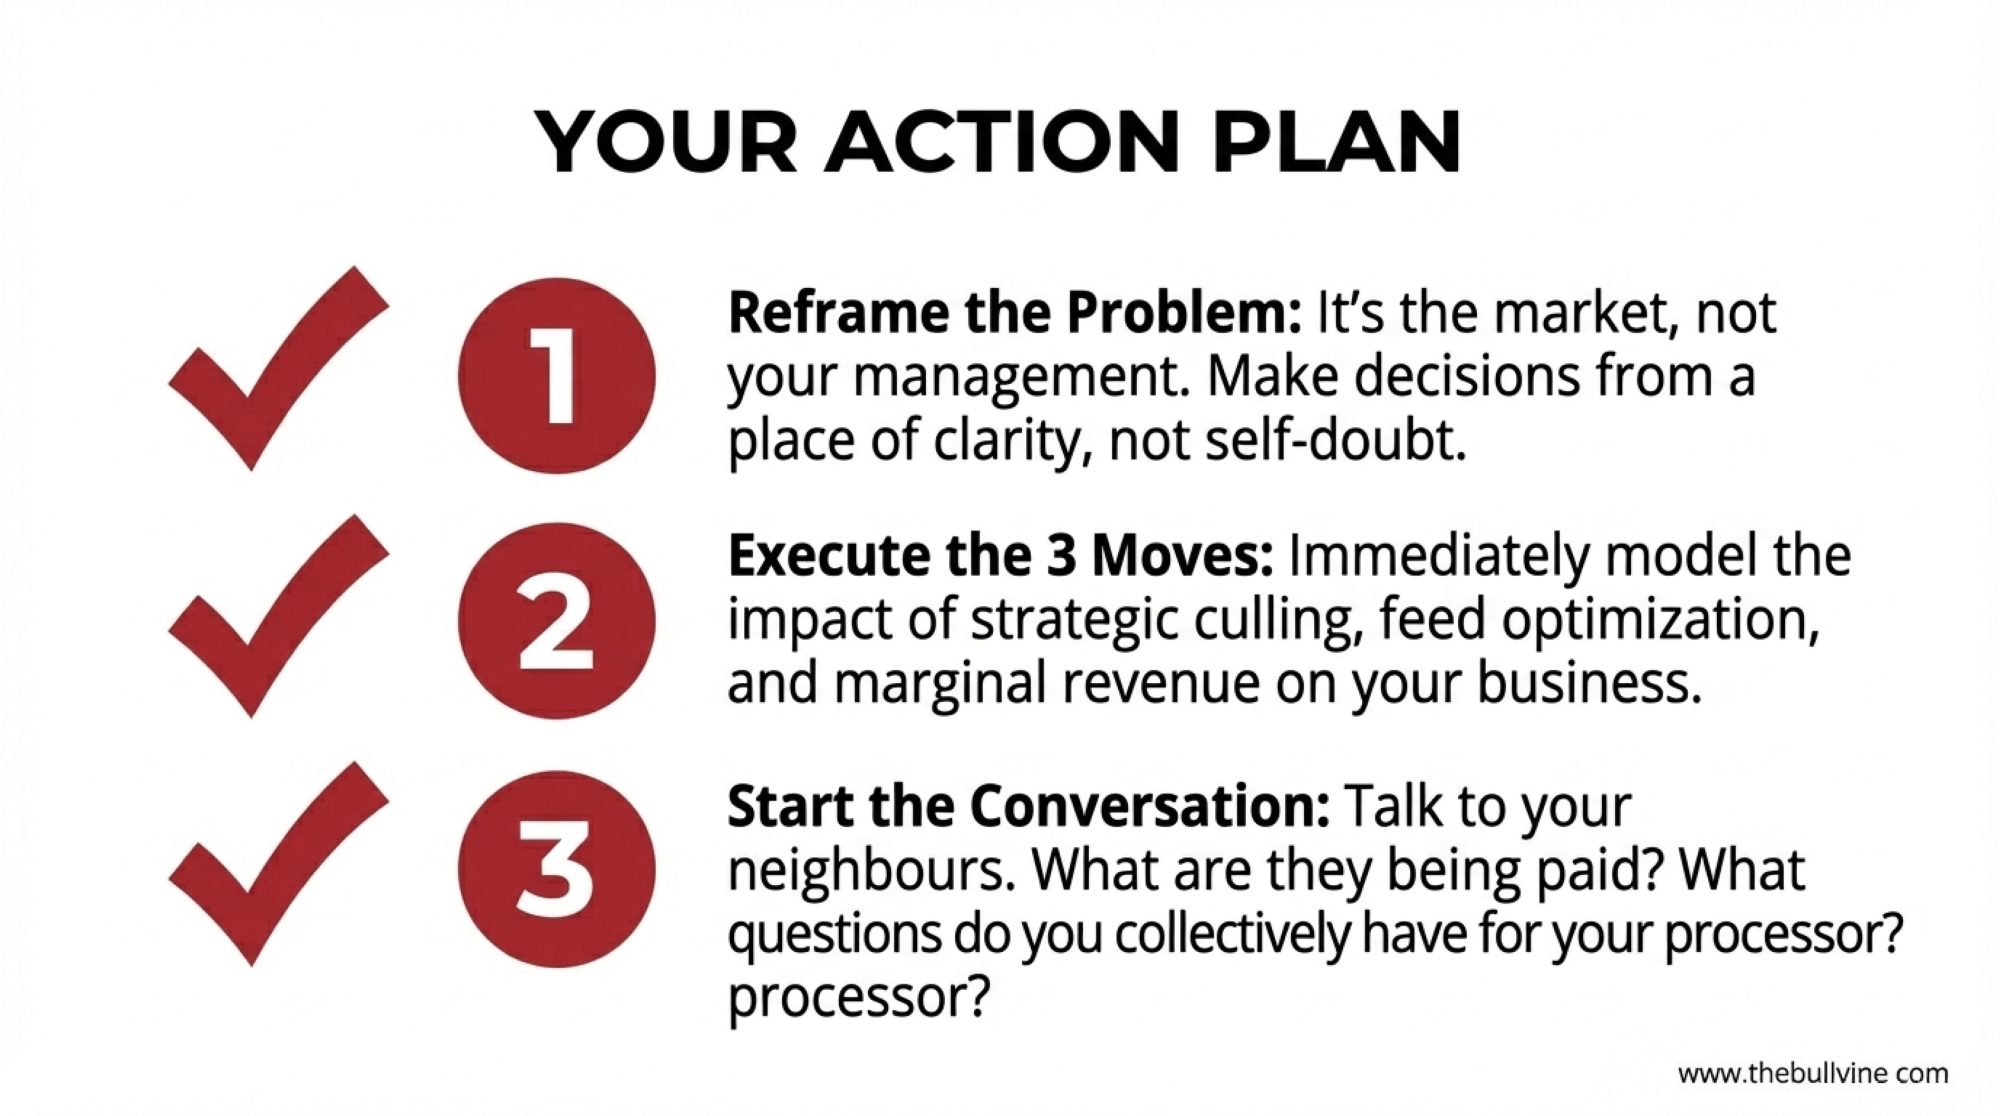
First, understand where your losses are actually coming from. If you’re losing money but your operational metrics—yield, cell count, fertility, labour efficiency—compare reasonably well to industry benchmarks, your challenge is primarily market structure rather than farm management. That distinction matters for how you respond.

Second, don’t wait to act on the things within your control. The herd optimisation, feed work, and revenue diversification I described aren’t heroic measures—they’re sound management practices worth pursuing regardless of market conditions. Many farms should already have been doing this work. Current conditions just make it more urgent.

Third, explore your options on processor relationships. If there are meaningful price differences between your current buyer and alternatives, those differences add up fast. A few pence per litre on a million-plus litres is real money. Understand your contract terms, your notice requirements, and what’s actually available in your area.

Fourth, consider whether collective engagement makes sense for you. The Irish example shows that coordinated, fact-based dialogue can influence how processors make decisions. You don’t need to start a movement—even talking with neighbours about what you’re seeing in your milk cheques and what questions you’d want answered can be valuable.

And finally—and this one matters—make your decisions from clear analysis rather than frustration or self-doubt. If your operation is technically sound and you’re still losing money, that’s important context. It means the problem isn’t fundamentally about you. It means there are structural market factors at work. And understanding that changes how you evaluate your options.

These are difficult times in the UK dairy industry. But difficult times also clarify what matters and what actions are worth taking. The farms that navigate this well won’t be the ones who hoped for markets to improve. They’ll be the ones who understood their situation clearly, acted on what they could control, and made thoughtful decisions about their future.

That’s within everyone’s reach.

Practical Resources

  • AHDB Dairy: Benchmarking tools, market data, and cost of production analysis at ahdb.org.uk/dairy
  • Kingshay: Dairy costings service and buying group information at kingshay.com
  • The Dairy Group: Technical consultancy and feed analysis at thedairygroup.co.uk
  • NAAC Contractor Rates: Current pricing guides at naac.co.uk

Key Takeaways 

  • The gap is £10,000/month. That’s what a 200-cow herd loses when milk sits 8-10ppl below cost. Most UK dairies are there now.
  • It’s not your farming. Processor profits up 22%. Producer numbers down 2.6%. This is market structure—not management failure.
  • Three moves that work. Cull the bottom 15%. Tighten feed with a nutritionist. Capture beef-cross premiums. Combined savings: £7,000-8,000/month.
  • You’re buying time, not salvation. These strategies create breathing room—to switch processors, explore collective action, or plan transitions on your terms.
  • Coordination changes everything. Irish producers shifted pricing through organised, fact-based engagement. UK farmers have stronger legal tools. They just need each other.

Complete references and supporting documentation are available upon request by contacting the editorial team at editor@thebullvine.com.

Learn More:

Join the Revolution!

Join over 30,000 successful dairy professionals who rely on Bullvine Weekly for their competitive edge. Delivered directly to your inbox each week, our exclusive industry insights help you make smarter decisions while saving precious hours every week. Never miss critical updates on milk production trends, breakthrough technologies, and profit-boosting strategies that top producers are already implementing. Subscribe now to transform your dairy operation’s efficiency and profitability—your future success is just one click away.

NewsSubscribe
First
Last
Consent

The Wall of Milk: Making Sense of 2025’s Global Dairy Crunch

This downturn feels different because it is. Four major exporters expanded at once, and $15 milk is testing every assumption. Here’s what the resilient dairies know.

EXECUTIVE SUMMARY: When producers say this downturn feels different, they’re right. For the first time, the U.S., EU, New Zealand, and Argentina all expanded production within the same window—creating a “wall of milk” that pushed July 2025 output to 19.0 billion pounds while Class III dropped from the $20s to around $15. Here’s what makes it unusual: exports are at record levels, confirming this is a supply squeeze, not a demand collapse. Dairy’s 24-month biological timeline means decisions that made complete sense at $22 milk are now delivering into a $15 market, with no quick reversal possible. Beef-on-dairy has added real value but also reduced the number of replacement heifers to 3.9 million head—the lowest since 1978—limiting culling flexibility when some operations need it most. The dairies navigating this effectively share common strategies: precision culling using income-over-feed-cost data, margin protection through DMC and Dairy Revenue Protection, and breeding for feed efficiency using traits like Feed Saved. This cycle will accelerate consolidation, but producers who know their numbers and deploy available tools will emerge stronger when markets rebalance.

As milk checks tightened through 2025, I kept hearing the same thing from producers across the country: “We’ve seen low prices before, but this one feels different.” And as many of you have probably sensed on your own operations, they’re right. This isn’t just one region working through a rough patch. The U.S., the European Union, New Zealand, and key South American exporters all pushed production higher within a fairly tight window. A lot of that milk is now competing for the same buyers at the same time.

The 24‑month lag exposed: production peaks just as prices crash, proving this downturn is about too much milk, not weak demand

What makes this cycle particularly challenging is that feed, labor, interest, and environmental compliance costs haven’t returned to the levels we saw a decade ago. That’s especially true in higher-cost regions like California and parts of Western Europe. So you’ve got more milk hitting the market, softer world prices, and cost structures that remain stubbornly elevated. That combination is creating what many are calling the “wall of milk.”

In this piece, we’ll walk through what farmers and analysts are learning about this cycle: how the 24-month expansion lag plays out in practice, how beef-on-dairy has delivered real benefits while also creating some unexpected ripple effects, why lenders and processors kept supporting growth even as signals shifted, how different regions are experiencing this downturn in very different ways, and what the operations navigating this well seem to have in common. The goal is to offer a clearer view of the bigger picture so the decisions you’re making—about cows, facilities, or risk management—are grounded in how this system actually works.

Why This Cycle Really Does Feel Different

Let’s start with the production numbers and work back toward the parlor.

USDA’s Milk Production reports paint a stark picture:

  • July 2025 Output (24 major states): 18.8 billion pounds initially, revised to 19.0 billion
  • Year-Over-Year Growth: +4.2%—the strongest since 2021
  • Total National Production: 19.6 billion pounds
  • Cow Numbers: Approaching the highest levels seen in decades

On the infrastructure side, the industry has been busy. More than 50 new or expanded dairy plants—particularly cheese and powder facilities in the Upper Midwest, Texas, and the High Plains—have come online, representing roughly $8 billion in capital investment over the past several years.

Leonard Polzin, the Dairy Economist and Farm Management Outreach Specialist at UW-Madison Division of Extension, framed it well at the 2025 Wisconsin Agricultural Outlook Forum. He noted that the industry is seeing “a substantial increase in processing capacity,” with an estimated $8 billion in gross investment creating new demand for milk. The challenge, as he pointed out, is that policy uncertainties—including potential tariffs and questions about labor availability—could affect prices before that demand fully materializes.

The picture looks similar in other major producing regions:

  • European Union: EU Milk Market Observatory data show deliveries climbing modestly in 2024, with product stocks building in early 2025 as cheese, butter, and powder production outpaced demand growth
  • New Zealand: Fonterra’s 2025/26 season forecast shows milk solids volumes running several percent ahead of the prior year, with farmgate payouts around NZ$10 per kg of milksolids
  • Argentina: Ministry data and Tridge reports show national milk output in early 2025 running 10.9% above the same period in 2024, with March posting gains of 15.9% year-over-year

Here’s where it gets interesting on the demand side. Exports have actually performed well:

  • July 2025 U.S. Exports: 1.6 billion pounds (milk-fat basis)
  • Year-Over-Year Export Growth: +53%—a record for any single month
  • Yet Class III/IV Futures: Trading in the mid-teens through much of 2025, below full-cost breakeven for many conventional operations
July 2025 was the strongest export month in U.S. history, with shipments up 53% year‑over‑year—yet total production still outran demand by another 4.2%. That’s not a demand collapse; it’s too much milk from too many exporters at once.

The takeaway? World demand hasn’t collapsed. Exports are actually quite strong. But supply from multiple major exporting regions has grown faster than demand can absorb in the near term. That’s what makes this feel different from the regional downturns many of us have worked through before.

The 24-Month Expansion Timeline: When Biology Meets Economics

One of the lessons this cycle keeps reinforcing is how much dairy expansion is a commitment you can’t easily unwind. The biology and capital requirements simply don’t move on futures-market time.

Think back to 2023 and early 2024. Milk prices were strong, butterfat levels were excellent across many herds, and balance sheets looked healthier than they had in years. In that environment, deciding to add a pen, upgrade the parlor, or build out the dry cow facilities made a lot of sense. The numbers supported it.

Land-grant extension economists who model these decisions describe a fairly predictable timeline. In those first few months, you’re signing contracts, ordering equipment, and closing on financing. As one University of Wisconsin farm management publication notes, by the time the ink is dry, most of the financial risk is already committed—even though no extra milk has shipped yet.

Through months four to twelve, the facility goes up while you’re either buying bred heifers or ramping up your own replacement program with sexed semen. Cash is flowing out, but the additional milk revenue hasn’t started. Then in months thirteen through twenty-four, those heifers freshen, pens fill, and milk per stall climbs. The challenge is that the broader market—running on that same 18-24 month biological timeline—may have shifted considerably since you started.

Peter Vitaliano, who served as Vice President of Economic Policy and Market Research at the National Milk Producers Federation before retiring at the end of 2024, was already flagging concerns back in February 2024. He noted that “due to a number of factors, we’ll probably see a larger drop than usual” in dairy farm numbers, partly because USDA counts were likely collected before additional farms closed at the end of 2023 due to margin pressure. He added that any margin improvement wouldn’t “constitute anywhere near a full recovery from the financial stress that dairy farms, pretty much of all sizes, are experiencing.”

The 24-Month Trap in Action

I’ve been hearing about situations like this from lenders and consultants: a 900-cow Wisconsin operation signed expansion contracts in early 2024 for 300 additional stalls, with heifers due to freshen by mid-2025. By the time that barn was full, Class III had dropped from the low $20s to around $15.

The extra milk revenue is real, but so is the debt service. Over six months, the gap between projected and actual margins consumed roughly $180,000 in working capital that had been earmarked for feed prepays and equipment upgrades.

The family isn’t in crisis, but there’s no cushion left. They’re working with their lender on revised cash-flow projections and tightening culling criteria to protect equity.

Decisions that made complete sense at $22 milk are now playing out in a $15 world.

Beef-on-Dairy: Real Benefits with Some Unexpected Effects

Beef-on-dairy has been one of the more significant developments in recent years, and it’s delivered genuine value to many operations. At the same time, as it’s scaled across the industry, it’s also changed some dynamics that historically helped balance supply. What I’ve noticed talking with producers is that most understand the benefits clearly—but the systemic effects are only now becoming apparent.

Where the Value Has Been Clear

The research and market data are consistent on this: well-managed beef-on-dairy programs substantially increase calf value compared to straight dairy bull calves. Day-old beef-cross calves often fetch several hundred dollars more, and in program relationships where carcass performance is documented, they can approach native beef calf values.

With milk prices softening in the first half of 2025, beef has become a driver of dairy farm profitability through both cull cows and dairy-beef calves. For many operations, this revenue stream has made a meaningful difference in a tight-margin year.

Some Effects Worth Understanding

What’s become clearer over the past year is how beef-on-dairy interacts with culling decisions and replacement availability when prices fall.

Consider the culling dynamic. A few years ago, that seven- or eight-year-old cow with middling production and some foot issues—bred to a dairy bull and carrying a $50-100 calf—was an easier decision when milk prices dropped. Today, if she’s carrying a beef pregnancy that could bring four figures at calving, the economics pull toward keeping her “one more lactation.” Across a larger herd, those decisions on the bottom 15-20 percent of cows can add meaningful volume that wouldn’t have been in the tank in previous downturns.

Culling DecisionDaily Milk RevenueDaily Direct CostsDaily Net MarginStrategic Action
Keep Low Performer$9.00$8.00$1.00Deferred culling
Replace with High Performer$13.00$9.00$4.00Aggressive culling
Daily Margin Difference+$4.00+$1.00+$3.00Per stall advantage
Impact Over 6 Months$540Single cow (180 days)
Scale: 30 Cows in 600-Cow Herd$16,20030 decisions

On the replacement side, the numbers tell a striking story:

  • January 2025 USDA Cattle Report: Dairy replacement heifers over 500 pounds dropped to just 3.914 million head—the lowest since 1978
  • Heifer-to-Cow Ratio: 41.9%, the smallest since 1991 (per CoBank lead dairy economist Corey Geiger)
  • Primary Driver: More matings going to beef semen, fewer dairy heifer calves being raised

That pruning made sense when heifer-raising costs were high, and beef calves commanded strong premiums. But it also means some operations that would like to cull more aggressively now don’t have the springers available to maintain stall utilization.

From windfall to choke point:” day‑old beef‑cross calves jumped from roughly $650 to $1,400, replacement heifers surged past $3,000, and heifer inventories fell nearly 20%. The same strategy that rescued margins is now what’s limiting culling options in a $15 milk world.

And there’s a productivity element worth noting. Because the heifers that are raised tend to come from the top of the genetic pool—identified through genomic testing—they often bring stronger milk and component performance than the animals they replace. Leonard Polzin noted at the 2025 Wisconsin Ag Forum that “despite a 0.35 percent year-to-date decline in total milk production, calculated milk solids production increased by 1.35 percent.” The industry is meeting demand “more quickly than in the past,” even with somewhat fewer total gallons.

None of this suggests beef-on-dairy is problematic. It’s been valuable for many operations. The consideration is managing it as part of an overall herd and business strategy rather than simply as a breeding decision.

Understanding Why Growth Continued

A reasonable question producers ask is why banks, co-ops, and processors kept supporting expansion even as supply signals shifted. You know, it’s easy to look back and wonder what everyone was thinking. But looking at the incentive structures helps explain the pattern—and honestly, it makes more sense than it might first appear.

The Lender Perspective

Ag lenders work within risk models and regulatory frameworks that emphasize historical cash flow, current balance sheet strength, and collateral values. In 2022-2023, many dairy clients showed multiple years of positive returns and improved equity. Land values in dairy regions were firm. Cull cow and breeding stock values had recovered.

Farm finance research consistently shows that lenders lean heavily on these historical and collateral metrics rather than attempting to time commodity cycles. Add competitive pressure—banks and farm credit systems competing for the same well-run operations—and you can see how turning down an expansion with strong historical numbers often meant losing that relationship to a lender willing to proceed.

From the credit committee’s perspective at the time, financing expansion with their strongest clients appeared reasonable and well-supported by the available data. The depth of the 2025 correction wasn’t yet visible in those metrics.

The Processor View

For processors, the math centers on fixed costs and throughput. Depreciation, labor, and energy don’t decline proportionally when a plant runs below capacity. With billions invested in new cheese, powder, and specialty facilities over the past decade, plant managers face pressure to run at high utilization, spread fixed costs effectively, and maintain market share.

That creates incentives to encourage volume growth from existing shippers, sign new suppliers, and move cautiously on base-excess programs that might push producers toward competitors. Some buyers have implemented tiered pricing systems that discount over-base milk, but these tools are often adopted late in the cycle and rarely coordinate across an entire region.

The result is a system in which internal metrics rewarded growth and utilization, even as external data pointed to a building supply. That’s not a criticism—it’s recognizing how institutional incentives shape behavior.

Regional Variations: Same Prices, Different Realities

One aspect that gets lost in national averages is how differently the same price environment affects operations across locations. As many of us have seen firsthand, cost structure, regulatory environment, and market access all matter enormously.

California: Navigating Significant Headwinds

California operations face several overlapping pressures this cycle.

Water constraints continue tightening. Implementation of the Sustainable Groundwater Management Act and new dairy waste discharge requirements from the State Water Resources Control Board are limiting groundwater pumping and establishing stricter nitrate standards in parts of the Central Valley. Environmental compliance costs—for covered lagoons, digesters, and monitoring systems—continue adding capital and operating expenses. And labor costs, housing prices, and land values remain substantially higher than in most other dairy regions.

When Class IV prices are in the low teens and world butter and powder prices are soft, those structural costs make breakeven difficult, particularly for operations that recently invested in facility upgrades. Understandably, some families are evaluating whether another 20-year investment cycle makes sense in that regulatory and cost environment.

Upper Midwest: Cost Structure Advantages

Wisconsin and neighboring states present a different picture.

A November 2024 University of Wisconsin-Madison study found that dairy contributes about $52.8 billion annually to Wisconsin’s economy, with substantial value coming through processing rather than just farm-level milk sales. The region’s processing network has grown considerably, with cheese plant expansions and new facilities drawing milk from an expanding geography. Feed costs benefit from local production, and land and labor costs, while rising, remain below coastal levels.

Low Class III prices continue to pressure margins, and smaller operations face ongoing consolidation. But many Upper Midwest producers describe having a cost structure that provides a path through this downturn with good management, even if it’s not comfortable.

New Zealand: Low Costs, High Exposure

New Zealand’s pasture-based system delivers meaningful cost advantages—solids produced with less purchased feed and lower energy use in favorable seasons. The 2025/26 forecast payout around NZ$10 per kgMS suggests many operations are maintaining positive margins, though narrower than recent years.

The trade-off is exposure. New Zealand sells the vast majority of its production into export markets. Shifts in Chinese demand, Southeast Asian buying patterns, or currency movements translate quickly into payout adjustments. Low production costs provide resilience, but global market volatility is a constant factor.

Europe and South America: Policy and Economic Dynamics

EU production has edged modestly higher overall, but policy pressure to limit cow numbers in high-density areas for environmental reasons is influencing regional patterns. The bloc appears to be shifting toward cheese and higher-value products while moderating output of commodity powders and butter.

Argentina’s production surge—that 10.9 percent first-quarter increase—reflects improved weather and on-farm economics. But Argentine producers also navigate inflation, policy uncertainty, and volatile input costs that can shift margins dramatically in short periods.

The point is that $15 milk creates very different situations in Tulare, Green County, Canterbury, and Santa Fe. Regional context matters enormously.

The Breeding Solution: Selecting for Feed Efficiency in a Low-Margin World

Here’s something that deserves more attention in these conversations: your genetic decisions today are one of the most powerful tools you have for navigating tight margins over the next decade. And there are now specific, measurable traits designed exactly for this environment.

Feed Saved: A Trait Built for This Moment

The Council on Dairy Cattle Breeding (CDCB) launched Feed Saved (FSAV) back in December 2020, and it’s become increasingly relevant as margins compress. The trait combines two components:

  • Body Weight Composite (BWC): Selecting for moderate-sized cows that require less feed for maintenance
  • Residual Feed Intake (RFI): Identifying cows that are metabolically more efficient—eating less than expected based on their production and body weight

According to Holstein USA’s April 2025 TPI formula update, every pound of feed saved returns approximately $0.13 per cow per lactation. That might sound modest, but across a 500-cow herd over multiple generations, the cumulative impact is substantial.

What’s particularly interesting is the research backing this. A November 2024 study published in Frontiers in Geneticsexamining genomic evaluation of RFI in U.S. Holsteins found that the difference between the most and least efficient first-lactation cows averaged 4.6 kg of dry matter intake per day—while producing similar amounts of milk. Over a 305-day lactation, that’s a significant difference in feed costs. The same study found even larger spreads in second-lactation animals.

How the Industry Is Weighting Efficiency

The April 2025 Net Merit update from CDCB reflects this shift. As Holstein Association USA’s TPI formula now shows:

  • Production (including Feed Efficiency): 46% of total index weight
  • Feed Efficiency $ Index: Combines production efficiency, lower maintenance costs from moderate body weight, and better feed conversion (RFI)

What’s encouraging is that research shows meaningful genetic variation in feed efficiency—the November 2024 Frontiers in Genetics study found RFI heritability in lactating U.S. Holsteins at approximately 0.43 (43%), indicating substantial potential for genetic progress through selection. That’s higher than many health and fertility traits, which means you can actually move the needle on this.

Efficiency MetricDaily Feed (lbs DM)Annual Feed Cost @ $0.12/lbMilk Production (lbs/day)Breeding Strategy Impact
Standard Efficiency Cow55$2,40985Baseline
High Efficiency Cow (Feed Saved)50$2,19085RFI + Feed Saved traits
Annual Advantage per Cow-5 lbs/day$219 savedSame outputImmediate selection
500-Cow Herd Annual Impact$109,500Same outputHerd-wide savings
10-Year Genetic Improvement$1,095,000Same outputCompound benefits

Practical Application

For producers looking to incorporate feed efficiency into their breeding programs:

  • Look for bulls with positive Feed Saved (FSAV) values in their genomic evaluations
  • Consider Body Weight Composite alongside production traits—extreme frame size increases maintenance costs
  • Balance feed efficiency with health and fertility traits; the most efficient cow isn’t profitable if she doesn’t breed back or stay healthy
  • Work with your AI representative or genetics consultant to model how different selection emphases might affect your herd’s economics over 5-10 years

This isn’t about abandoning production goals. It’s about recognizing that in a low-margin environment, the cow that produces 85 pounds while eating 10% less feed may be more profitable than the cow producing 90 pounds at average efficiency.

What the More Resilient Operations Have in Common

Every downturn separates operations that preserve equity and position well for the recovery from those that don’t. Several patterns are emerging among farms navigating this cycle effectively—and what’s encouraging is that most of these are things within a producer’s control.

Making Culling Decisions with Better Data

Operations that are doing well are generally bringing greater precision to culling. That means tracking income over feed cost by pen or individual cow, using parlor data and feed records to identify animals that are not covering their direct costs, plus a reasonable share of overhead. It means using genomic information and reproductive performance to spot heifers and cows unlikely to generate positive returns. And it means connecting culling plans to realistic replacement availability rather than culling until pens feel empty and then scrambling for springers.

The math consultants’ walk-through is straightforward: a cow generating $9 in milk revenue and consuming $7 in feed, plus $1 in bedding, breeding, and health costs, clears $1 in labor, debt, and margin costs. Replace her with a fresher or higher-producing animal netting $4 daily above direct costs, and over six months, that stall contributes $720 more. Scale that to 30 similar decisions in a 600-cow herd, and the difference exceeds $20,000 in half a year. That kind of analysis is making some producers more willing to make uncomfortable culling decisions earlier.

Managing Margins Rather Than Guessing Prices

Another pattern is shifting from attempting to call price tops to protecting survivable margin ranges.

Dairy Margin Coverage continues providing value for eligible operations, particularly smaller herds. A 2025 Government Accountability Office review noted that USDA paid out nearly $2.7 billion more to DMC participants than it collected in premiums from 2019 through 2024—significant catastrophic protection.

More operations are using Dairy Revenue Protection to establish floors on portions of future production, sometimes combined with feed contracts that define at least a rough margin band. The approach isn’t about optimizing returns; it’s about narrowing the range of outcomes to avoid truly damaging quarters.

Suppose you haven’t explored these tools recently. In that case, your local FSA office or an extension dairy specialist can walk you through current enrollment options and help you model how different coverage levels might fit your operation’s risk profile.

Treating Beef-on-Dairy as a Managed Program

Operations that consistently achieve value from beef-on-dairy tend to approach it systematically rather than opportunistically. That means selecting sires with documented growth, feed efficiency, and carcass data—often aligned with specific feedlot or packer programs. It means coordinating with buyers on calving timing, health protocols, and genetics to capture available premiums. And it means maintaining enough high-merit dairy genetics to ensure replacement availability as conditions change.

This program approach doesn’t eliminate beef market volatility, but it improves the odds of consistent returns and preserves flexibility on the dairy side. If you’re looking to establish these relationships, many breed associations and AI companies now maintain lists of feedlots and packers actively seeking dairy-beef partnerships.

Continuous Focus on Feed Efficiency

Feed remains the largest expense for most operations, and in low-margin periods, every pound of dry matter needs to perform. The farms that manage well keep returning to fundamentals: grouping by lactation stage so rations match requirements, reducing shrink through bunker management and feed-handling practices, and monitoring feed efficiency as a core metric.

Relatively modest improvements—a tenth or two-tenths improvement in feed efficiency, a few percentage points less silage waste—can represent $0.50-1.00 per hundredweight in income over feed cost. Across millions of pounds of annual production, that compounds into meaningful dollars.

Looking Toward 2027-2028: Reasonable Expectations

Forecasting specific prices years out isn’t realistic, but we can identify directions based on current trends and policy trajectories. These are scenarios, not predictions—individual outcomes will vary considerably.

The consolidation pattern is well-documented. Lucas Fuess, Senior Dairy Analyst at Rabobank, noted in his analysis of the 2022 Census of Agriculture that the U.S. lost nearly 40 percent of its dairy farms between 2017 and 2022—from about 39,300 to around 24,000—while total production rose because “larger farms show lower production costs.” This downturn will likely accelerate that trend.

By the late 2020s, several developments seem probable:

The total number of licensed U.S. dairies may fall below 20,000, with an increasing share of national volume coming from herds milking several hundred to several thousand cows. Regional patterns may sharpen, with lower-cost areas—much of the Upper Midwest and Central Plains—holding or gaining share, while higher-cost, more regulated regions see gradual declines in cow numbers as families choose not to reinvest. Beef-on-dairy will likely remain prevalent but may stratify further between well-structured programs that capture consistent premiums and undifferentiated approaches that face greater volatility.

Globally, New Zealand will remain important in the powder and butterfat markets, while the EU continues to shift toward cheese and value-added products within environmental constraints.

The Bottom Line

These are the conversations I’m hearing producers have with their teams, advisers, and families. Every operation faces unique circumstances, and general advice only goes so far—but these questions seem to be helping people think through their situation:

  • Where are you in your own expansion timeline? How many heifers are scheduled to freshen over the next 18-24 months? Do those numbers align with what your facilities, labor, feed base, and market access can profitably support at current price levels?
  • Do you have clear visibility on cow-level economics? Which animals are covering feed plus a reasonable share of labor, debt, and overhead—and which aren’t? What would tightening culling criteria by 5-10 percent look like, and is your replacement pipeline ready for that?
  • How much of your margin is protected versus hoped for? What portion of the next 12-24 months could you realistically put under DMC, DRP, or forward contracts? Have you had direct conversations with your lender about your risk management approach?
  • Is your beef-on-dairy program intentional? Do you know what your calf buyers specifically want, and are you breeding to those specifications? Are you confident that your current approach will leave enough high-quality dairy replacements for the herd you want to be running in three years?
  • Are your genetic criteria aligned with a low-margin reality? Are you selecting strictly for high production, or are you also prioritizing Feed Saved, moderate frame size through Body Weight Composite, and Residual Feed Intake to lower lifetime maintenance costs? In an environment where feed represents 50-60% of production costs, breeding decisions made today will shape your cost structure for the next decade.
  • Are you making decisions for this week or for the next several years? Culling, breeding, feeding, capital allocation, and even family succession—are these being decided tactically or within a longer-term framework?

This cycle is demonstrating that individually sensible decisions—expanding when returns were strong, adding beef value to calves, filling new processing capacity—can produce collective oversupply when everyone responds to the same signals simultaneously. None of us individually controls global supply and demand. What each operation can control is understanding its position within the bigger picture, knowing its own numbers thoroughly, and using available tools—biological, genetic, and financial—to improve the odds of still being here, on your own terms, when conditions improve.

KEY TAKEAWAYS 

  • This is a global supply collision, not a demand problem. The U.S., EU, New Zealand, and Argentina all expanded at once—yet exports hit record highs. Pure oversupply.
  • The 24-month trap is unforgiving. Decisions that made sense at $22 milk are now delivering into a $15 market. Biology doesn’t wait for prices to recover.
  • Beef-on-dairy reshaped the culling equation. Replacement heifers dropped to 3.9 million—the lowest since 1978—limiting flexibility exactly when operations need it most.
  • Resilient dairies share three priorities: precision culling based on income over feed cost, margin protection through DMC and DRP, and breeding for feed efficiency traits.
  • Consolidation will accelerate—preparation separates outcomes. Producers who know their numbers and deploy available tools now will emerge stronger when markets turn.

Complete references and supporting documentation are available upon request by contacting the editorial team at editor@thebullvine.com.

Learn More:

Join the Revolution!

Join over 30,000 successful dairy professionals who rely on Bullvine Weekly for their competitive edge. Delivered directly to your inbox each week, our exclusive industry insights help you make smarter decisions while saving precious hours every week. Never miss critical updates on milk production trends, breakthrough technologies, and profit-boosting strategies that top producers are already implementing. Subscribe now to transform your dairy operation’s efficiency and profitability—your future success is just one click away.

NewsSubscribe
First
Last
Consent
Send this to a friend