Archive for Global Dairy Trade trends

8 Straight GDT Declines. The Genetic Culling and Cash Strategies That Separate 2026 Survivors.

Raising mediocre genetics into an $18 market is a $3,000 mistake walking on four legs. 8 GDT declines say it’s time to cull harder.

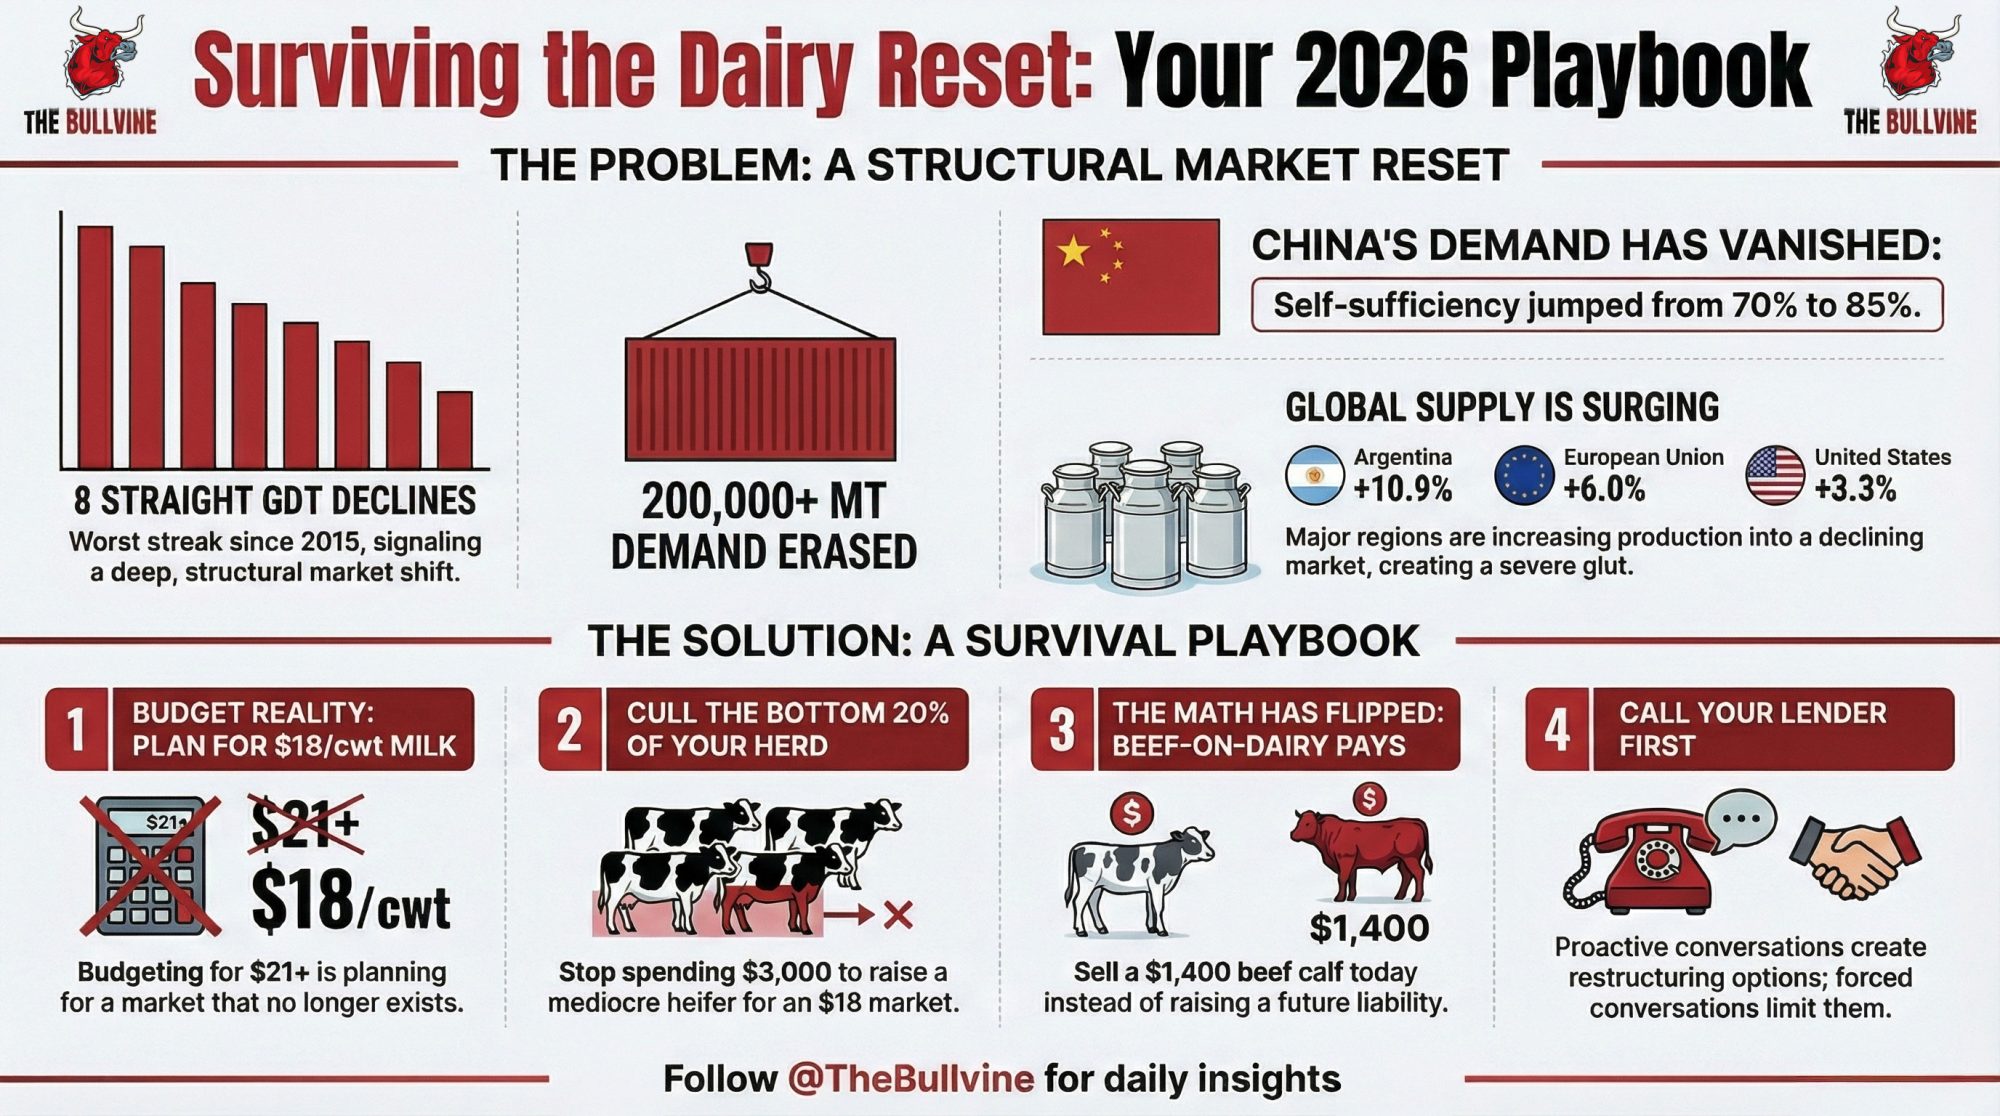
EXECUTIVE SUMMARY: Eight straight GDT declines—the worst streak since 2015—isn’t a cycle. It’s a structural reset. China’s self-sufficiency jumped from 70% to 85%, erasing 200,000+ metric tons of annual demand that isn’t returning. Production keeps accelerating everywhere: the US up 3.3%, the EU up 6%, Argentina up 10.9%. For operations still budgeting $21 milk, the math turns brutal fast—at $18/cwt, working capital burns in months, not years. The response demands ruthless clarity: cull the bottom 20% of your genetics, sell $1,000-1,400 beef-on-dairy calves instead of raising $3,000 replacement heifers, lock in price protection, and call your lender before covenants force the conversation. The dairies thriving in 2027 won’t be those that waited for recovery—they’ll be those that used 2026 to make the hard calls their competitors avoided.

Something shifted in global dairy markets this fall. Those of us watching the twice-monthly Global Dairy Trade auctions could sense it building, but the numbers from Event 393 on December 2nd brought it into sharp focus.

The damage in one auction:

  • GDT Price Index: Down 4.3%
  • Butter: Down 12.4% (the hardest hit)
  • Whole Milk Powder: Down 2.4%
  • Average price: US$3,507/MT (lowest in nearly two years)
  • Streak: Eight consecutive declines—worst since 2015
Butter prices collapsed 12.4% at Event 393. Anhydrous milk fat fell 9.8%. These aren’t modest corrections—they’re demand destruction in fat products. Meanwhile cheddar climbed 7.2% and lactose 4.2%. Message: high-fat commodity products are vulnerable in this market. Component strategy must shift toward cheese and protein, away from butter margin dependency.

For producers mapping out Q1 and Q2 of 2026—whether you’re managing a 200-cow operation in Vermont, running 3,000 head in the Central Valley, or navigating the unique economics of Southeast pasture-based systems—these results raise questions that deserve careful thought.

Is this a cyclical correction that resolves in a few months? Or does it reflect something more structural?

Here’s my read: eight consecutive declines with this breadth across product categories suggests supply-demand fundamentals that may take longer to rebalance than we’d like. That’s not cause for panic, but it is a reason for strategic action. The operations that navigate the next 12-18 months successfully will be those that understand what’s driving this weakness—and position accordingly.

The Supply Picture: Everyone’s Running Hot

The basic dynamic is pretty clear once you lay it out. Global milk production across major exporting regions is growing faster than demand can absorb. USDA Foreign Agricultural Service data and Rabobank’s quarterly analysis both point to this imbalance persisting through at least mid-2026.

Everyone’s running hot. Argentina’s milk production surged 10.9% in Q1 2025. The EU is up 6%. The US 3.3%. The problem? Demand isn’t returning. When all suppliers produce simultaneously into shrinking demand, there’s only one outcome: prices collapse.

What makes this period particularly concerning is the breadth. It’s not one region running hot while others moderate. Everyone’s pushing milk at the same time:

RegionGrowth RateSource
New ZealandSeason-to-date up 3.0%Fonterra November Update
United StatesAugust production up 3.3% (24 major states)USDA Milk Production Report
European UnionSeptember deliveries up 6.0%AHDB Market Analysis
ArgentinaQ1 2025 up 10.9%USDA Attaché Reports

Fonterra has already raised their collection forecast from 1,525 million kgMS to 1,545 million kgMS. The US herd continues expanding even as futures soften. You know how it goes—once you’ve invested in facilities, genetics, and labor, the economic pull favors keeping stalls occupied.

“This cycle, we’re seeing production accelerate into declining prices. That pattern—when it persists—typically indicates a longer adjustment period ahead.”

The China Shift: This Isn’t Cyclical

No factor shapes the global dairy trade outlook quite like China’s changing import patterns. For nearly a decade, China served as the primary growth engine for dairy exports worldwide. What’s shifted there helps explain everything we’re seeing at GDT.

China’s government-backed self-sufficiency push worked. From 70% to 85% domestic production in five years. Translation: 200,000+ metric tons of annual demand that exported countries will never see again. This isn’t a market cycle. It’s geopolitics as food security policy.

The key numbers:

  • Self-sufficiency: Climbed from ~70% (2020-2021) to ~85% (2025) per USDA and Rabobank estimates
  • WMP imports: Dropped from 845,000 MT at peak to ~430,000 MT by 2023
  • Missing demand: 200,000-240,000 MT annually that isn’t coming back soon

Rabobank’s Mary Ledman, its global dairy strategist, framed it clearly: China moved from about 70% self-sufficiency to roughly 85%, and that shift cascades through global trade flows. When China’s import demand contracts, it affects pricing for exporters worldwide.

What this means: Business planning built around a rapid return to peak Chinese imports probably warrants reconsideration. Beijing invested heavily in domestic processing capacity as a food security priority. Some analysts believe import demand could stabilize if domestic production growth slows—but for planning purposes, assuming reduced Chinese appetite persists seems prudent.

Where’s the Milk Going?

With China absorbing less, displaced volume is finding alternative homes—but at a cost:

Secondary markets are absorbing volume. The Middle East, Southeast Asia, and parts of Latin America have increased purchases at competitive pricing. But these markets are smaller and more price-sensitive. They take the milk—just at prices that drag everything down.

Product mix is shifting. EU processors are directing more milk toward cheese and whey rather than powder. This doesn’t eliminate surplus; it redistributes pressure across product streams.

Inventories are building. US nonfat dry milk stocks have grown through 2025, according to USDA Dairy Products data. The milk is moving, but it’s backing up. That overhang suppresses spot prices until stocks normalize.

Farm-Level Math: Where It Gets Real

For individual operations—particularly those carrying debt from recent expansions—extended margin compression creates genuine planning challenges.

Fonterra’s adjustment illustrates how GDT weakness hits farmgate: They narrowed their 2025/26 price range from NZ$9.00–$11.00/kgMS to NZ$9.00–$10.00/kgMS. For a farmer supplying 200,000 kgMS, that 50-cent midpoint reduction means roughly NZ$100,000 less this season.

US operations face a similar arithmetic:

  • 500-cow dairy producing 25,000 lbs/cow annually
  • Each $1/cwt change = approximately $125,000 in gross revenue impact

I recently spoke with a producer running about 450 cows in east-central Wisconsin—debt-to-asset ratio around 47%, which isn’t unusual for operations that expanded during 2021-2022. At $22/cwt, modest positive cash flow. At $18-19/cwt, he’s projecting monthly shortfalls of $35,000-45,000. Working capital covers roughly three months at that burn rate.

His approach? Running all projections at $18 now, not $21.

“I’d rather be surprised by better prices than caught short by worse ones.”

The timeline pressure: Working capital reserves on many operations cover 2-4 months of shortfalls. When those deplete, operating lines of credit come at higher rates—what was 6-7% might now cost 10-11%, further pressuring cash flow.

Practical Responses That Are Working

Across regions, proactive producers are responding with concrete adjustments. The specifics vary—feed costs differ between California and Wisconsin, Southeast operations face different heat-stress economics, and Northeast producers navigate distinct cooperative structures—but certain approaches work broadly.

Get Brutally Honest on Cash Flow

Run projections at $18.00/cwt, not $21-22. Answer these questions candidly:

  • What’s the monthly cash flow at current prices through Q2 2026?
  • How many months can you sustain negative cash flow before exhausting working capital?
  • At what price does the operation return to breakeven?

Operations projecting shortfalls above $30,000-50,000/month should initiate lender conversations now—before covenant pressures force them.

Lock In Some Protection

Forward contracting and hedging deserve fresh attention:

  • Forward contract 30-50% of near-term production through co-ops or direct processor contracts
  • Put options on Class III or Class IV milk for downside floors with upside participation
  • Dairy Margin Coverage enrollment at coverage levels matching your debt structure

Options protection typically costs $0.20-0.40/cwt. That’s insurance math—worth evaluating against your exposure.

Strategic Cost Management

Ration optimization remains the biggest lever. Maximize the number of components per pound of dry matter intake. With butterfat and protein premiums available through many marketing arrangements, component-focused feeding can partially offset lower base prices. Transition cow nutrition and fresh cow management remain areas where investment pays returns—you probably know this, but it bears repeating during tight margins.

Forward purchase feed ingredients at current favorable levels for 6-12 months.

Capital discipline—defer projects that don’t show clear payback within 12 months at $18/cwt.

Ruthless Heifer Inventory Calibration

This is where genetics strategy meets financial survival.

Stop raising the bottom 20% of your genetics. Move from 110% of replacement needs to strictly 100%. Use beef-on-dairy crosses on everything that isn’t top-tier. In a market like this, raising a mediocre heifer is a luxury you cannot afford.

Downturns are the time to concentrate genetic investment. Focus sexed semen only on your elite animals. Let beef sires cover the rest. The operations that emerge strongest from price cycles are typically those that used the pressure to accelerate genetic progress—not those that kept feeding average genetics because “we’ve always raised our own replacements.”

Here’s what’s interesting about the economics right now. Dairy beef has become a meaningful revenue stream—according to Hoard’s Dairyman, dairy-beef crosses now represent 15-20% of national beef production. That $1,000-1,400 dairy-beef calf you’re selling at a few days old is worth far more than a replacement heifer you’ll spend $2,500-3,000 raising only to freshen into an $18 milk market. The math has completely flipped from where it was just a few years ago, when those calves were bringing $350-400.

Early Lender Engagement

For operations where projections suggest restructuring may be needed, earlier conversations produce better outcomes. Options farmers are exploring:

  • Extending term debt amortization (10 → 15 years) to reduce annual payments
  • Converting operating lines to term debt for covenant breathing room
  • Adjusting payment timing to align with milk check cycles
  • Providing additional collateral for better terms

Lenders prefer restructuring to foreclosure. But that preference is strongest when borrowers approach proactively—not when they’re already in technical default.

The Coordination Reality

Could coordinated production cuts accelerate rebalancing? Probably not.

US antitrust law restricts coordination on production or pricing. Cooperative structures require accepting all member milk. And even if one region cut output, others would expand to capture the opportunity—Argentina’s 10.9% Q1 surgeshows how fast capacity elsewhere fills gaps.

Historical precedent: During 2014-2016, US milk production actually grew despite severely compressed margins. Recovery came when demand improved—not from coordinated supply reduction. The survivors managed through individually: maintaining reserves, restructuring early, achieving efficiencies their neighbors didn’t.

Market rebalancing will occur through aggregated individual responses to economic pressure. That places the burden on each operation to assess its own position and act accordingly.

How the Next 18 Months Might Unfold

Here’s one informed perspective—not prediction:

Through Q1 2026: Current dynamics persist. Production growth continues despite weak prices, China maintains a reduced import posture, and inventories stay elevated. GDT likely stays below $3,500/MT, potentially testing $3,200-3,300.

By mid-2026: Margin compression forces more decisive responses. Some operations exit through individual financial pressure. Others restructure and emerge leaner. Consolidation accelerates.

Late 2026 into 2027: If sufficient capacity adjusts, supply comes into better balance. Prices recover—though likely to equilibrium levels reflecting China’s structurally lower imports and more consolidated global production.

The operations positioned well for 2027 won’t necessarily be the largest. They’ll be those that assessed their situations honestly now, made difficult decisions while options remained, and configured for a market that differs from 2021-2022.

The Bottom Line

This market weakness is structural, not cyclical. Eight consecutive GDT declines, plus China’s sustained import reduction, create headwinds that won’t resolve quickly.

Run your numbers at $18/cwt. Operations showing significant monthly negative cash flow face decisions within 6-12 months.

Talk to lenders before you have to. Proactive conversations yield better outcomes than forced ones.

Concentrate your genetic investment. Stop subsidizing mediocre genetics with expensive heifer development. Use beef-on-dairy aggressively—at $1,000+ per calf, the economics have never been better.

Protect some downside. Evaluate forward contracting and options based on your specific debt exposure.

Early action preserves options. Delayed response narrows them.

These are genuine challenges—and ones the industry has navigated before. The operations thriving when conditions improve will be those making informed decisions now: understanding what market signals indicate, assessing their position realistically, and acting while choices remain.

Your local extension dairy specialists and farm business management educators can provide perspective tailored to your specific circumstances. Run your numbers, have the conversations, and position your operation for whatever comes next.

We’ll continue tracking these developments. In the meantime—sharpen your pencil, sharpen your genetics, and sharpen your strategy.

Key Takeaways 

  • Stop waiting for recovery. China’s at 85% self-sufficient. That 200,000+ MT of vanished demand isn’t returning. This is the market now.
  • Budget at $18. Today. At $21, you’re planning for a market that no longer exists. Run your numbers at $18 and see if your runway is months—or weeks.
  • Cull the bottom 20%. Ruthlessly. A $1,400 beef calf at 3 days old beats a $3,000 heifer raised to freshen into $18 milk. That math has permanently flipped.
  • Call your lender this week. Proactive conversations get restructuring options. Forced conversations get whatever terms are left.
  • The 2027 winners are being decided now. They won’t be the biggest operations—they’ll be the ones that culled harder, budgeted tighter, and moved while competitors waited.

Complete references and supporting documentation are available upon request by contacting the editorial team at editor@thebullvine.com.

Learn More:

Join the Revolution!

Join over 30,000 successful dairy professionals who rely on Bullvine Weekly for their competitive edge. Delivered directly to your inbox each week, our exclusive industry insights help you make smarter decisions while saving precious hours every week. Never miss critical updates on milk production trends, breakthrough technologies, and profit-boosting strategies that top producers are already implementing. Subscribe now to transform your dairy operation’s efficiency and profitability—your future success is just one click away.

NewsSubscribe
First
Last
Consent

Cheddar Market Shock: GDT Prices Crash 9.2% As Dairy Markets Signal Major Shift

Cheddar prices CRASH 9.2% at GDT! What’s fueling the cheese market meltdown – and how to protect your profits.

EXECUTIVE SUMMARY: Tuesday’s Global Dairy Trade auction snapped a three-month rally with a 0.9% index drop, driven by cheddar’s shocking 9.2% price collapse to $2.27/lb. While mozzarella and anhydrous milk fat held firm, the dramatic divergence signals fractured dairy markets demanding strategic agility. With China’s shrinking imports and shifting consumer preferences reshaping trade patterns, producers must reassess milk allocation, risk management, and component strategies. The next GDT auction on June 3 will test whether this is a temporary correction or a sustained trend. Bottom line: volatility reigns – adapt or get left behind.

KEY TAKEAWAYS:

  • Cheddar crisis: 9.2% price plunge exposes vulnerability in cheese-focused operations.
  • Market fragmentation: AMF (+0.9%) and mozzarella (+0.7%) outperformed, highlighting value in diversified production.
  • Global ripple effects: China’s rising self-sufficiency (85%) and seasonal NZ production shifts amplify volatility.
  • Action required: Revisit processor contracts, component strategies, and hedging plans before June’s critical GDT auction.
  • Watch the spread: Narrowing CME block-barrel gap signals shifting inventory pressures between retail/food service markets.
Cheddar price crash, Global Dairy Trade trends, dairy market volatility, cheese market analysis, dairy risk management

Tuesday’s Global Dairy Trade auction delivered a bombshell to dairy markets with its first index decline since early March, plunging 0.9% after three consecutive events of significant gains. The spotlight? A dramatic 9.2% collapse in cheddar cheese prices to $5,007/metric ton. This sharp reversal, contrasted with stable to rising values for products like mozzarella and anhydrous milk fat, signals increasing market fragmentation that demands immediate strategic attention from producers tied to cheese production streams.

THE NUMBERS DON’T LIE: DISSECTING THE PRICE SHAKE-UP

The party’s over at the GDT. After a solid 7.3% climb since March 4, the index finally stumbled at Tuesday’s auction. Don’t let the modest 0.9% overall dip fool you – the devil is in the details. A hefty 15,194 metric tons of dairy products changed hands among 110 winning bidders through fifteen rounds of competitive bidding, showing robust market participation despite the price correction.

The weighted average price across all products settled at $4,589 per metric ton, but this average masks the dramatic divergence between product categories:

ProductPrice ChangeFinal Price (USD)Per PoundWhat’s Really Happening
Cheddar cheese-9.2%$5,007/MT$2.27/lbThe Big Loser – is the cheddar bubble bursting?
Lactose-13.2%$1,398/MT$0.63/lbTaking an even bigger hit than cheddar
Butter-1.5%$7,821/MT$3.54/lbMinor cooling but still commanding premium prices
Whole milk powder-1.0%$4,332/MT$1.96/lbSlight step back on key volume product
Skim milk powder-0.7%$2,817/MT$1.27/lbHolding relatively steady
Anhydrous milk fat+0.9%$7,273/MT$3.29/lbFat continues to shine!
Mozzarella cheese+0.7%$4,788/MT$2.17/lbThe other cheese story – quietly gaining ground

The stark contrast between cheddar’s nosedive and mozzarella’s modest gain, alongside AMF’s continued strength, screams one thing: we’re in an era of product-specific markets, not a monolithic dairy industry.

WHY CHEDDAR’S CRASH SHOULD SET OFF YOUR ALARM BELLS

Let’s be blunt: a 9.2% drop in cheddar isn’t just some abstract number for economists to ponder. This hits your bottom line directly. For operations heavily invested in cheese, particularly cheddar, this is a torpedo below the waterline of your revenue projections. What makes it even more jarring is that it comes on the heels of a 4.6% GDT index jump just two weeks ago. Whiplash, anyone?

This volatility isn’t isolated to the GDT; it’s echoing in domestic markets too. Monday’s CME session saw cheddar blocks tumble 3.25¢ to $1.8975/lb and barrels drop 2.50¢ to $1.8550/lb, indicating buyer hesitancy following mid-May rallies. This global-local market connection isn’t a coincidence – it confirms a broader shift in cheese market fundamentals.

What This Means For Your Operation: If your milk flows predominantly into cheddar production, it’s time for serious conversations with your processor. This dramatic price differential between cheese varieties signals that global buyers are increasingly selective. The operations that will thrive are those with the flexibility to pivot between product streams as these market signals evolve.

GLOBAL CHESS MATCH: TRACKING THE HIDDEN MARKET FORCES

This GDT shakeup isn’t happening in a vacuum. The timing is particularly significant as this marks the final New Zealand dairy season auction, which officially concludes on May 31. Most Kiwi farmers are currently drying off their herds for the winter rest period before calving begins in July-August. This seasonal factor typically influences market psychology and trading patterns.

The next GDT auction, scheduled for Tuesday, June 3, will provide crucial signals about whether this cheddar correction represents a temporary adjustment or the beginning of a more sustained trend. That’s a date every dairy producer should circle on their calendar.

THE BOTTOM LINE: DON’T JUST WATCH – TAKE ACTION NOW!

This GDT result, especially the cheddar collapse, demands an immediate strategic response. But panic is a terrible strategy. Instead, focus on these tactical moves:

  1. Interrogate Your Milk Contract & Processor Relationship: What’s your exposure to cheddar? If these trends continue, how flexible is your processor in shifting milk to more lucrative streams like mozzarella or milk fat products? Have this conversation now, not after prices slide further.
  2. Re-evaluate Your Component Strategy: If fat is holding strong (and AMF prices suggest it is), should you be tweaking your nutrition program to optimize fat production? The 0.9% increase in AMF versus the 9.2% crash in cheddar speaks volumes about where value is currently concentrated.
  3. Lock in Your Risk Management Plan: With the June GDT auction approaching, now is the time to review hedging strategies and protection options. These increasingly fragmented product markets demand more sophisticated risk management approaches than ever before.
  4. Watch the Block-Barrel Spread: The narrowing block-barrel spread in the CME (down to 4.25 cents from 7.75 cents last week) provides additional market intelligence about inventory balances between retail and food service channels. These domestic signals and GDT trends can help you anticipate market directions.

The bottom line? This isn’t about doom and gloom; it’s about recognizing market signals early and positioning your operation to thrive amid volatility. In today’s fragmented dairy markets, the winners aren’t just those who produce the most milk – they’re the ones who most strategically direct that milk to the highest-value destinations. The cheddar crash is your wake-up call. What will you do with it?

Learn more:

Join the Revolution!

Join over 30,000 successful dairy professionals who rely on Bullvine Weekly for their competitive edge. Delivered directly to your inbox each week, our exclusive industry insights help you make smarter decisions while saving precious hours every week. Never miss critical updates on milk production trends, breakthrough technologies, and profit-boosting strategies that top producers are already implementing. Subscribe now to transform your dairy operation’s efficiency and profitability—your future success is just one click away.

NewsSubscribe
First
Last
Consent

U.S. Dairy Exports Surge as Global Buyers Raid American Bargain Barn

Dairy Exports Hit 2-Year High! Price Cuts & Global Demand Fuel Boom – Japan Goes All-In on U.S. Cheese & Butter.

EXECUTIVE SUMMARY: U.S. dairy exports surged to two-year highs in March 2025 as bargain prices and a weaker dollar lured global buyers, with cheese shipments to Japan smashing records and butter/milkfat sales hitting decade highs. American producers capitalized on price gaps up to $2,800/MT for butter compared to EU/Oceania, while shifting output toward nutrient-dense cheeses and butter over traditional powders. Despite a 1% milk production increase, manufacturers’ strategic focus on high-value products and rebounding powder exports positioned the U.S. as the world’s dairy discount leader. However, sustaining this momentum faces challenges from volatile global prices, trade policy risks, and the need to balance growing domestic supplies with export demand. Farmers and processors must stay agile to ride this wave while it lasts.

KEY TAKEAWAYS:

  • Record Exports Driven by Pricing: U.S. butter traded $2,800/MT cheaper than global competitors, sparking unprecedented demand from Mexico, Canada, and Japan.
  • Japan’s Cheese Craze: March shipments to Japan hit all-time highs (+59% YoY in January), signaling regained market dominance in premium Asian markets.
  • Powder Paradox: Milk powder exports rebounded in March despite 9-12% production cuts, proving price elasticity rules global dairy trade.
  • Farmer Impact: Strong exports help absorb growing U.S. milk supplies (+1% March YoY), but reliance on volatile international markets demands risk management.
  • Window Closing? Global dairy prices at 3-year highs may shrink U.S. discounts – strategic shifts to value-added products critical for long-term success.
2025 US dairy exports, dairy export price competitiveness, record dairy exports Japan, butter milkfat trade surge, Global Dairy Trade trends

American dairy products are flying off the shelves faster than show-quality heifers at a dispersal sale. March 2025 exports hit two-year highs as international buyers capitalize on dirt-cheap U.S. prices and a dollar weaker than a newborn calf.

Cheese exports nearly matched their record-breaking March 2024 levels, with shipments to Japan reaching an all-time high. Butter and milkfat exports achieved their strongest first-quarter performance since 2014, with 53 million pounds shipped abroad from January through March.

The export boom comes as global dairy prices continue to climb. At the most recent Global Dairy Trade auction, butter prices reached an all-time high, while cheddar and whole milk powder hit their highest levels in three years.

Price Gap Wider Than Your Silage Trench

The key driver behind this export success isn’t complicated – American dairy products sell cheaper than last year‘s show cattle.

U.S. butter, priced around $2.34/lb ($5,160/MT) in late March, sits at a massive $2,800/MT discount compared to European butter at $8,060/MT and Oceania butter at $7,450-$7,650/MT. That price gap is wider than your silage trench and just as deep.

“I’ve never seen our butter this competitive globally,” says Jessica Newsome, Chief of Market Information at USDA’s Agricultural Marketing Service. “Foreign buyers are backing up the truck while prices stay this low.”

The price advantage extends beyond butter. U.S. cheddar cheese trades about $1,600/MT below international benchmarks, giving American exporters a field day in key Asian markets.

Dollar Drops Like Milk Prices in 2020

Currency exchange rates have piled on another advantage. The U.S. Dollar Index has been hovering around 99.30, showing more weakness than a calcium-deficient fresh cow.

This currency advantage makes American dairy a steal for buyers in key markets like Mexico, Canada, Japan, and South Korea. Japanese buyers are loading up on U.S. cheese like it’s the last feed delivery before a blizzard.

“We’re seeing unprecedented demand from Japan,” notes Wisconsin cheese exporter Tom Wilson. “Our March shipments were off the charts – they’re buying every pound we can produce while this price advantage holds.”

Farmers Shift Production Like Seasonal Grazing Rotations

During the export boom, U.S. dairy manufacturers have strategically shifted their milk allocation faster than you’d rotate a struggling pasture. According to USDA’s latest Dairy Products report, March production increased significantly for high-value products:

  • Cheese: +1.4% year-over-year
  • Butter: +8.6% year-over-year

This focus on nutrient-dense products has come at the expense of powder production. Output of nonfat dry milk and skim milk powder fell 9.6% compared to March 2024, while dry whey production dropped by 19.6%.

Stack ‘Em High While the Sun Shines

Despite making less powder, manufacturers’ stocks of milk and whey powders grew modestly from February to March – a bit like watching your replacement heifer inventory swell even when you’ve cut back on breeding.

For dairy farmers, this inventory build underscores the balancing act of growing milk production against market outlets. For example, when trying to manage spring flush without enough processing capacity, the industry needs every export outlet to fire on all cylinders.

“These exports couldn’t come at a better time,” says Maria Gonzalez, who milks 450 cows in California’s Central Valley. “Our milk production is up 3% this year, and without strong exports, our milk price would tank faster than a bulk tank refrigeration system on a 100-degree day.”

Global Demand Strong as a Well-Fed Bull

The enthusiastic bidding at recent Global Dairy Trade auctions reflects robust international demand stronger than that of a well-fed bull at breeding time.

At the early May GDT auction:

  • Butter prices rose 3.8% to reach $7,992/MT (an all-time high)
  • Cheddar jumped 12.0% to $5,519/MT
  • Whole milk powder increased 6.2% to $4,374/MT

These price levels, the highest in years for many products, signal that global dairy markets are as hungry for product as a fresh TMR in an empty bunk.

Outlook: Weather Eye on the Horizon

The export surge creates excellent opportunities for U.S. dairy producers. However, maintaining this momentum will depend on several factors that could shift, such as the weather in the Midwest in spring.

The current price advantage for U.S. products could erode if domestic prices climb or if global prices retreat from their peaks. Additionally, tariff threats hang over exports like a storm cloud over pasture – quick to form and potentially devastating.

“I’m locking in feed costs now while export demand is strong,” explains John Peterson, a 200-cow dairy farmer from Minnesota. “When our export advantage is this good, I know my milk price has some cushion. But I’ve been through enough cycles to know it won’t last forever – like good hay-making weather, you’ve got to make the most of it while it’s here.”

What This Means for Your Operation

For dairy farmers, these exports provide welcome support for your milk check while your production grows. But like any good herd manager, you need to watch the signs.

The shift toward higher-value products aligns with global demand trends and your bottom line. As you focus on components in your breeding program, processors maximize returns from milk components.

“We’re seeing our component premiums increase as processors chase butterfat and protein,” notes Maria Gonzalez. “It’s changed how I feed and breed my herd – I’m selecting bulls with higher fat and protein numbers, just like the market is selecting for those products globally.”

The Bottom Line

U.S. dairy exports are hotter than your TMR mixer in July, with international buyers swarming around American products like flies at feed time. This export surge provides crucial relief for growing U.S. milk production.

The price gap between U.S. and global dairy products is your friend right now – like that extra two inches of freeboard on your manure lagoon before spring rains. Enjoy it while it lasts but keep a weather eye on those international markets.

The global dairy market is now providing a welcome outlet for America’s growing milk production. This favorable alignment might not last longer than a perfect cutting of alfalfa, so smart producers are making contingency plans while enjoying stronger milk prices and export demand support.

Learn more:

Join the Revolution!

Join over 30,000 successful dairy professionals who rely on Bullvine Weekly for their competitive edge. Delivered directly to your inbox each week, our exclusive industry insights help you make smarter decisions while saving precious hours every week. Never miss critical updates on milk production trends, breakthrough technologies, and profit-boosting strategies that top producers are already implementing. Subscribe now to transform your dairy operation’s efficiency and profitability—your future success is just one click away.

NewsSubscribe
First
Last
Consent
Send this to a friend