You can’t breed your way to cheaper diesel.” North Dakota did the math, lost 1,792 dairies, and left one 1,000‑cow family asking what to do next.
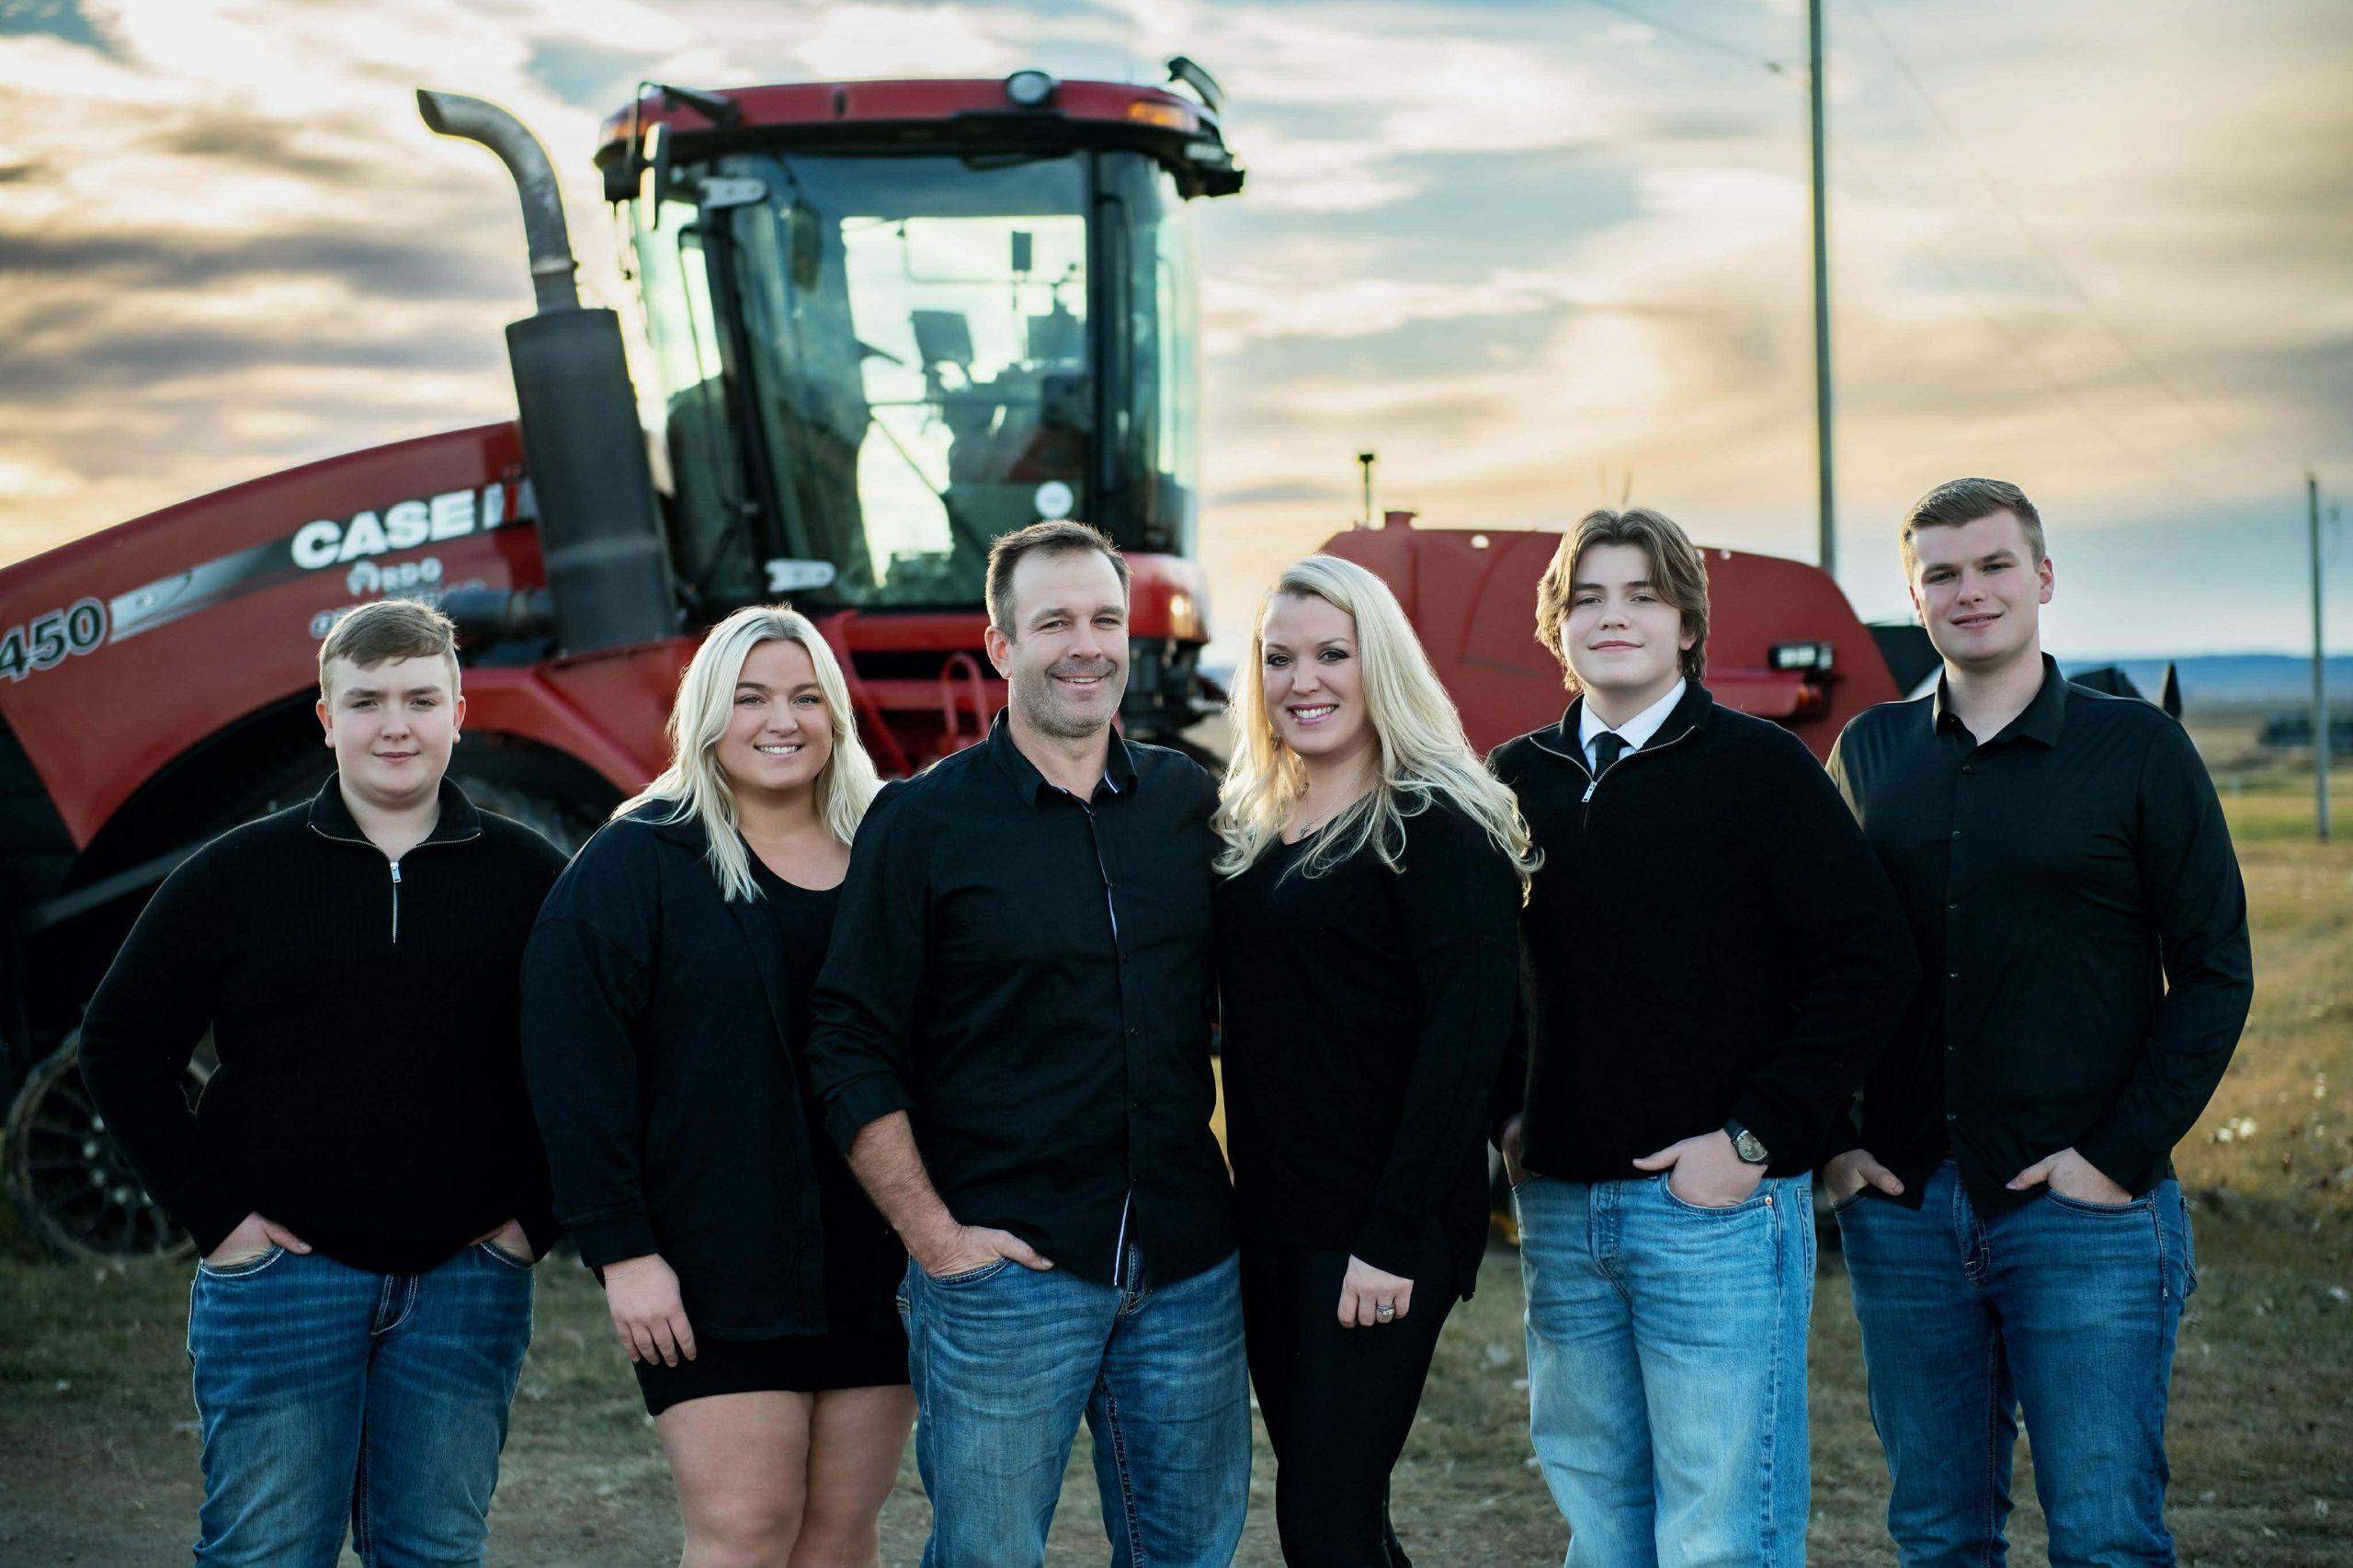
Northern Lights Dairy sits about 12 miles south of Mandan, North Dakota — a 1,000‑cow Holstein operation run by the Holle family. Over the past 30 months, the Holles have been forced to find a new market for their milk twice. Not because of anything they did wrong, but because every processing facility in their state either closed or stopped taking raw milk. They now ship to a Bongards plant in Perham, Minnesota—a haul that runs about 5 hours one way, several times a day.
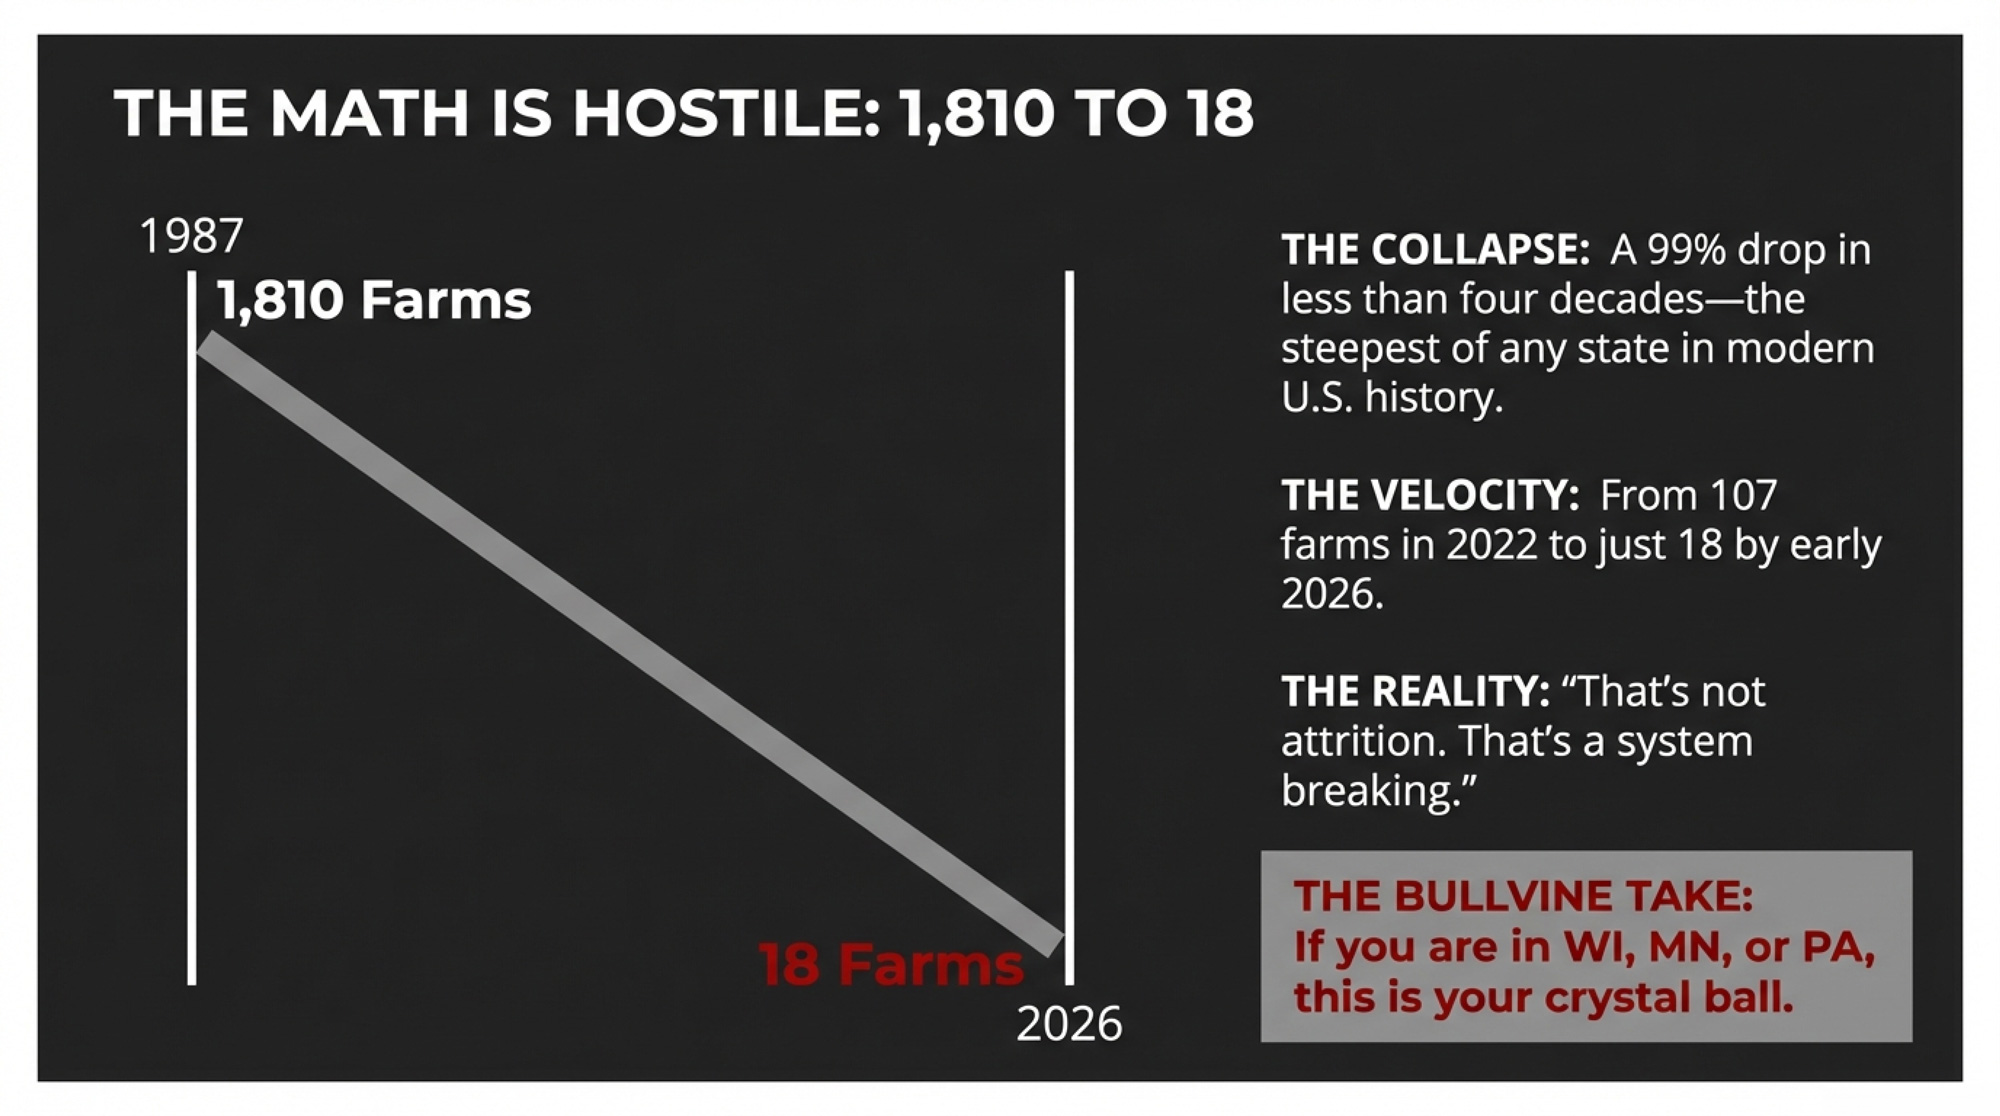
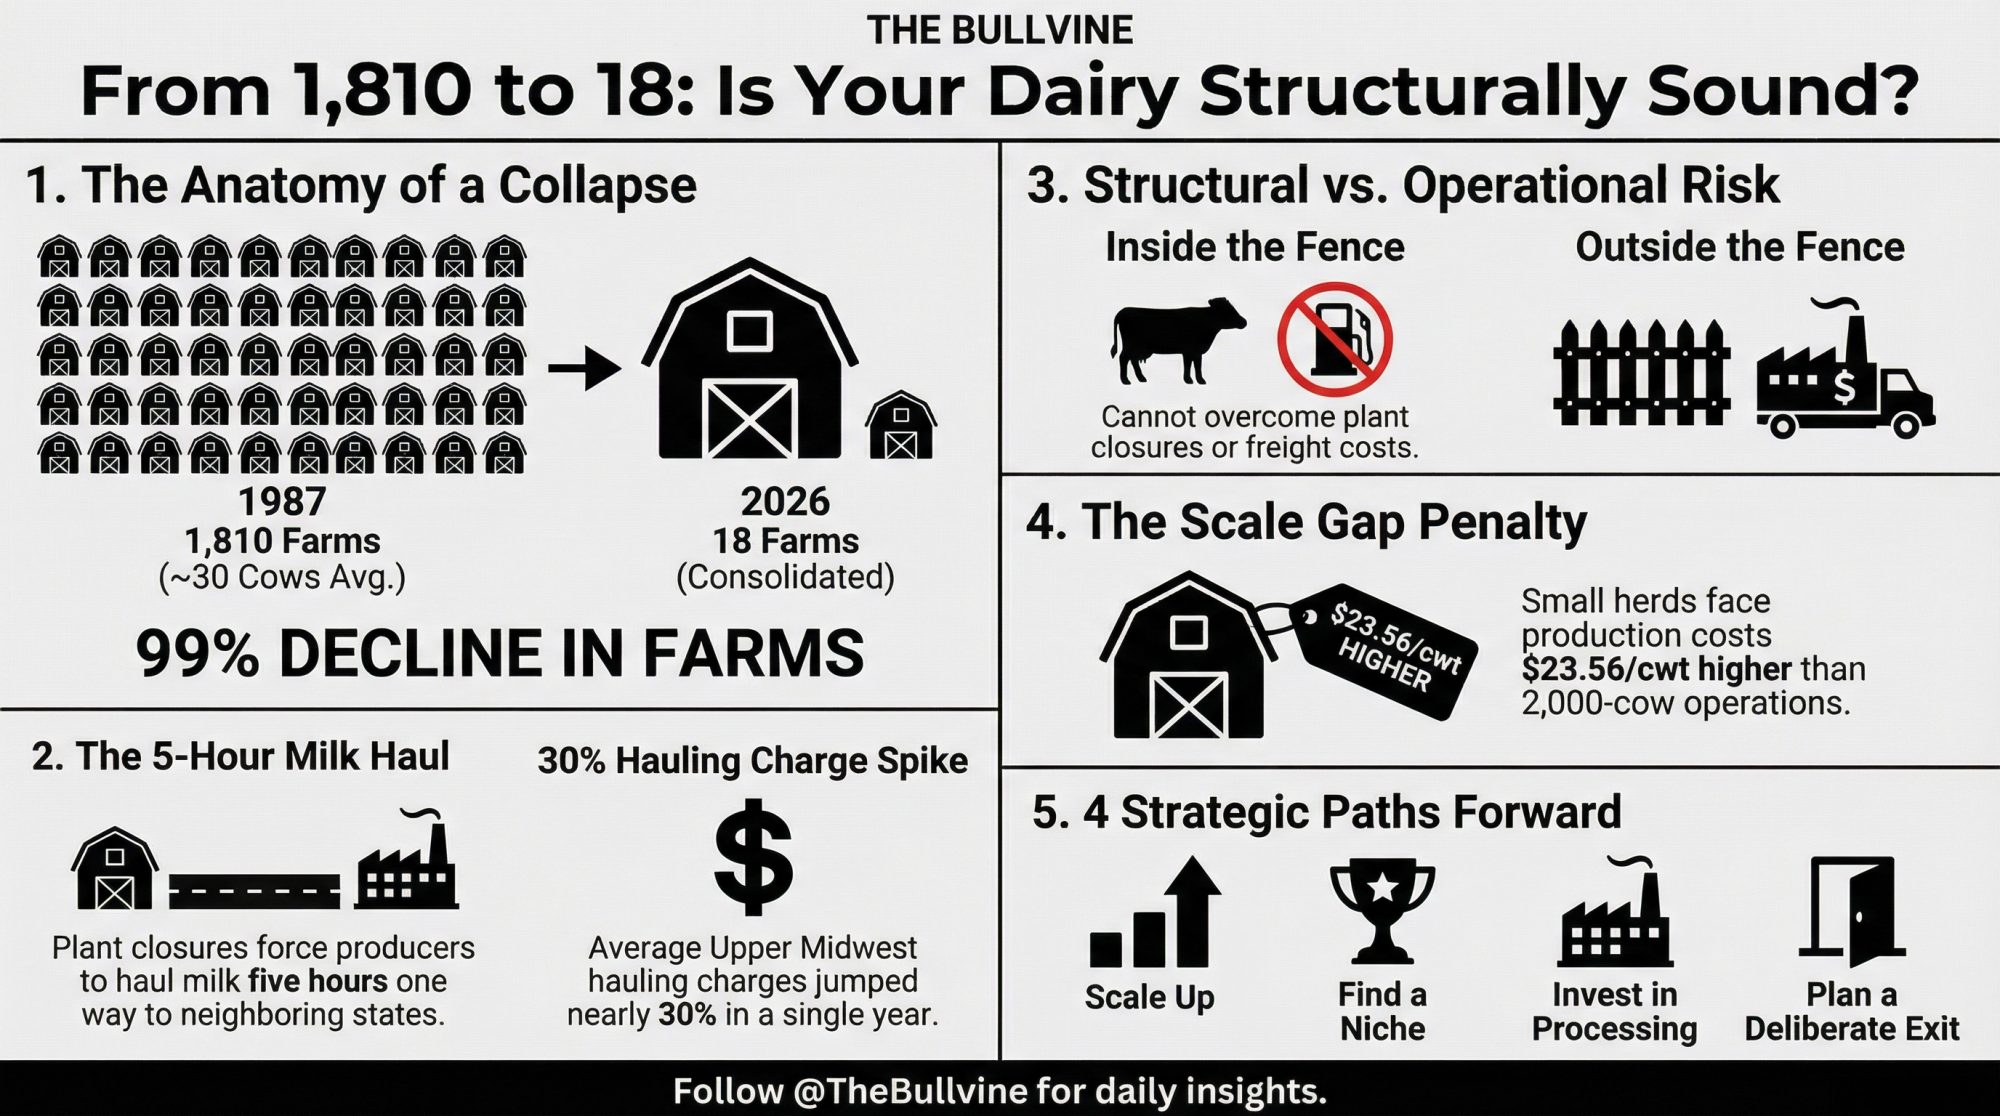
According to the Holle family, there are now just 18 Grade A dairy farms left in North Dakota as of early 2026. In 1987, there were 1,810. That’s a dairy farm collapse of more than 99% in less than four decades — the steepest of any state in modern American history, according to USDA Census of Agriculture data and the North Dakota Milk Marketing Board. If you’re milking in Wisconsin, Minnesota, Pennsylvania, or Vermont, North Dakota isn’t someone else’s cautionary tale. It’s a diagnostic tool for your own operation.
The Numbers: 1,810 to 18
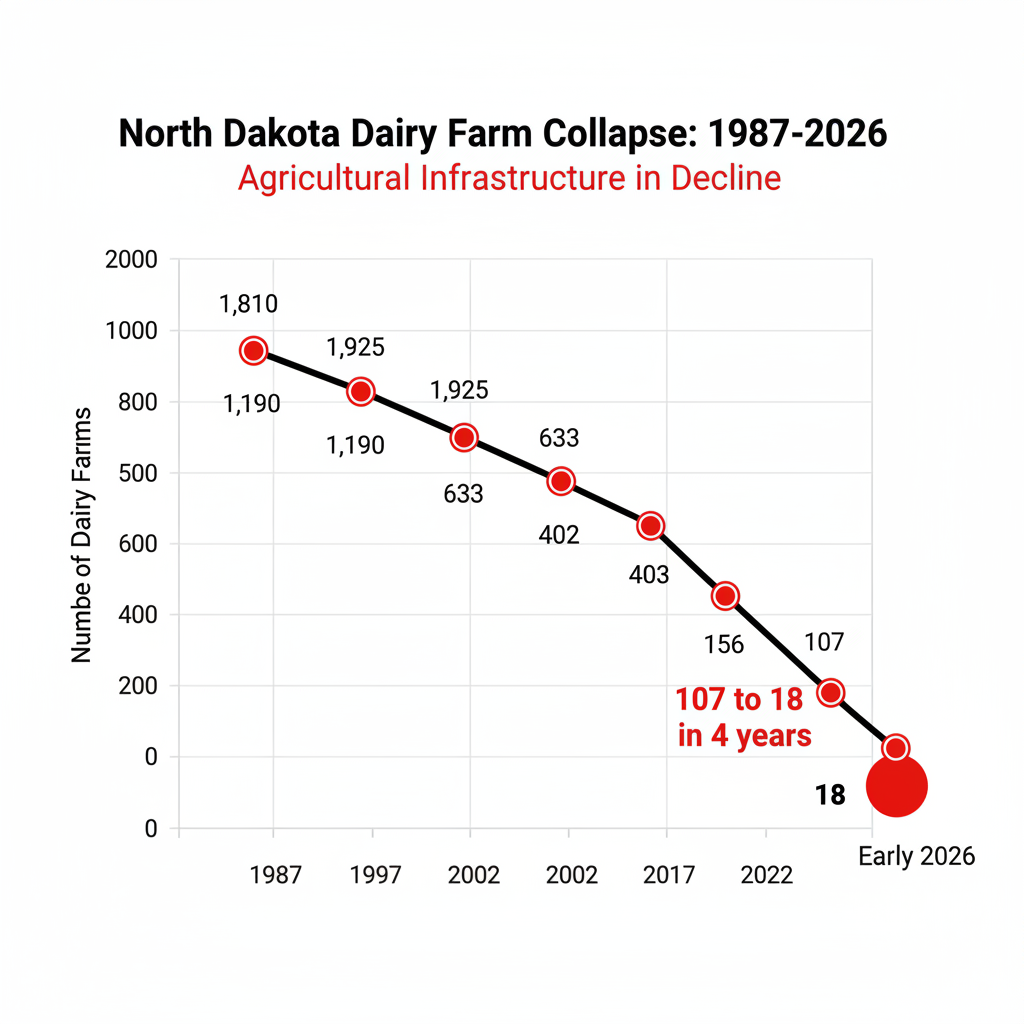
North Dakota’s dairy collapse was both a slow grind and a sudden implosion. USDA Census data tells the story in five‑year snapshots:
| Year | Dairy Farms | Milk Cows | Avg. Herd Size |
| 1987 | 1,810 | Not specified | ~30 |
| 1992 | 1,925 | 74,885 | 39 |
| 1997 | 1,190 | 53,835 | 45 |
| 2002 | 633 | 34,505 | 55 |
| 2007 | 402 | 26,479 | 66 |
| 2017 | 156 | 16,470 | 106 |
| 2022 | 107 | 14,191 | 133 |
| 2025 | ~23–25 | ~8,700–10,000 | ~400 |
| Early 2026 | 18 | — | — |
Note: Farm counts vary by source and methodology. Deputy Agriculture Commissioner Tom Bodine testified in March 2025 that 23 permitted dairy farms remained, with one not operating and “about 8,700 cows.” Dairy Star reported 25 regular‑milk dairies and 10,000 cows in June 2025. USDA NASS and NDSU Extension list approximately 10,000 cows for 2025. The Holle family at Northern Lights Dairy reports 18 Grade A dairy farms remaining as of early 2026.
From 107 farms in 2022 to 18 by early 2026. That’s not attrition. That’s a system breaking.
For comparison, Wisconsin went from 5,661 licensed herds in January 2024 to 5,348 by January 2025 — a loss of 313 farms, or 5.5%. By January 2026, state figures showed roughly 5,100 active dairy herds. A decade ago, Wisconsin had 10,081 dairy farms. Nearly half are gone. The rate is steadier and slower than North Dakota’s implosion. But the physics are the same. When processing density thins and routes stretch, the math turns hostile for everyone on the wrong end of the haul.
Two Plant Closures That Broke a State
Your dairy is only as viable as your ability to get raw milk onto a truck and into a plant at a cost that leaves a margin. When that chain breaks, everything you do inside the fence — genetics, feed efficiency, cow comfort — stops mattering.
North Dakota’s chain broke in two stages.
In September 2023, Prairie Farms Dairy closed its processing facility in Bismarck and converted it to distribution only. That plant had been the primary Class I destination for central and western North Dakota. Agriculture Commissioner Doug Goehring didn’t mince words: “With no other processors nearby, those dairies will likely pay for shipping longer distances that will be deducted from their milk checks. This will have a dramatic impact on their bottom line.” He was right. One producer about 50 miles northwest of Bismarck — identified in Dairy Star’s September 2023 reporting as Henke — saw his milk rerouted 151 miles to a DFA facility in Pollock, South Dakota, at an immediate freight surcharge of $0.55 per hundredweight. He also had to invest in an additional bulk tank to store two days’ worth of milk between every‑other‑day pickups. “That is going to be more important all the time,” Henke told Dairy Star.
Then, DFA closed the Pollock plant effective August 30, 2024, displacing 33 full‑time and four part‑time employees. That eliminated the backup destination. Suddenly, milk wasn’t traveling dozens of miles. It was traveling hundreds — into Minnesota plants that had no particular reason to pay a premium for distant, hard‑to‑route volume. Today, the only milk plant still operating in North Dakota is Cass‑Clay’s facility in Fargo, pressed against the Minnesota border. For smaller herds west of the Missouri, those added miles wiped out whatever thin margin remained.
Who Survived — and Why It Matters
The farms still milking aren’t random survivors. They sort into three models, and each tells you something about what works — and what doesn’t — when regional infrastructure collapses.
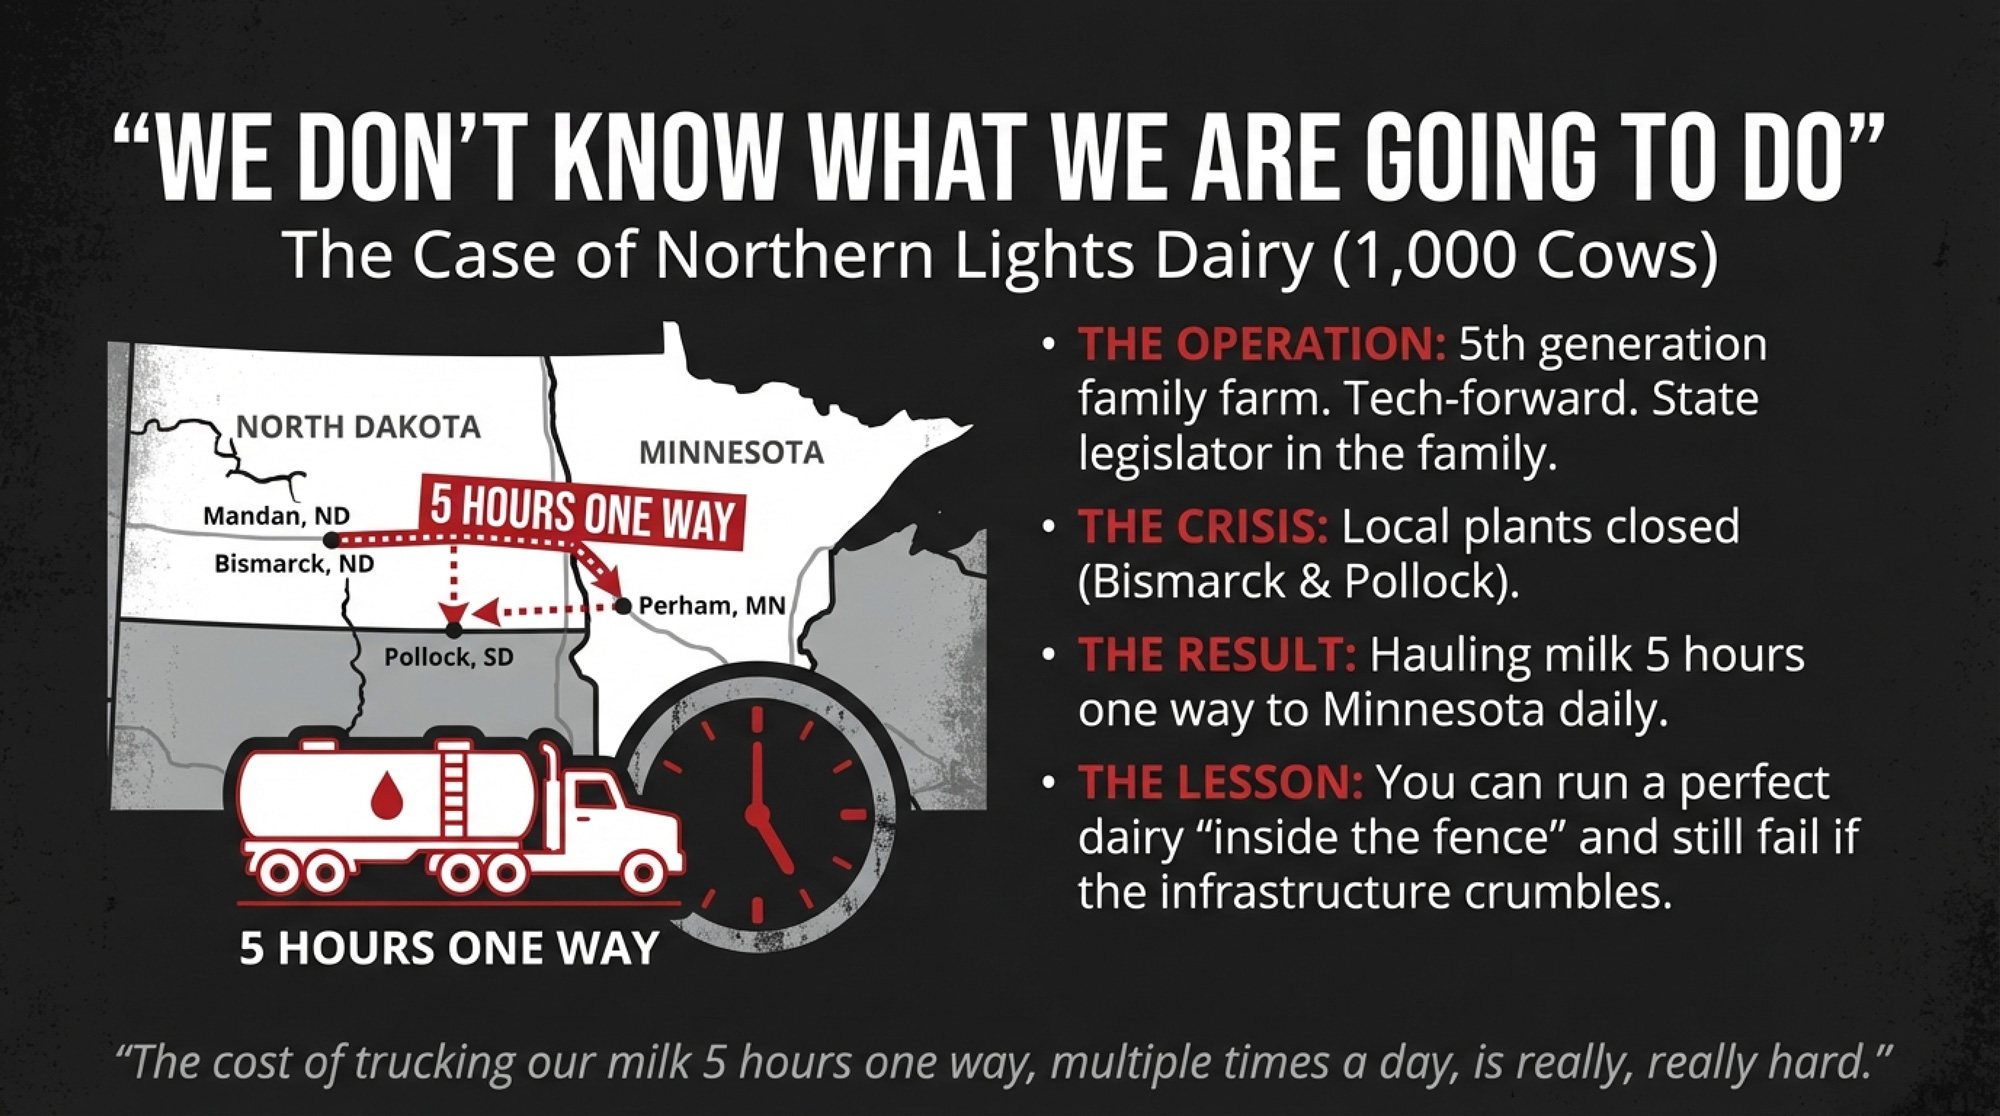
The scaled conventional — hanging on by the freight bill. Northern Lights Dairy’s permit allows up to 1,275 milking cows, and the Holles are currently milking about 1,000. That’s enough volume to keep haulers coming — but not enough to make a five‑hour haul one way, multiple times a day, feel anything but brutal. “The cost of trucking our milk 5 hours one way, multiple times a day, is really, really hard,” the family told The Bullvine in early 2026. “Dairying is really hard right now… we’re praying for the milk price to rebound, but the year looks bleak.”
The numbers back them up. The January 2026 Class III price landed at $14.59 per hundredweight (USDA AMS) — the lowest since April 2021. Strip the Holles’ massive freight costs off that already‑depressed price, and you can see why the family describes this as the toughest stretch they’ve faced.
In March 2025, Dawson Holle told the North Dakota House Agriculture Committee that the family had been researching on‑farm processing — a logical response after being forced to switch milk markets twice. But a year later, the family told The Bullvine they aren’t sure they’re in a financial position to build, that it’s “extremely expensive,” and that state funding may not be a realistic option. When asked directly about their plans, the answer was blunt: “We don’t know what we are going to do.”
Sit with that for a second. A 1,000‑cow operation. Fifth‑generation family. Fiber‑connected monitoring technology. A state legislator in the family. And the honest answer about the future is we don’t know. That’s not a failure of management or planning. That’s what it sounds like when every option outside the fence has been stripped away and the ones that remain are either unaffordable or uncertain.
Jennifer Holle, who serves as calving manager and oversees an average of three to four births a day — sometimes up to 15 — has described the farm’s monitoring technology as critical to managing individual cow care at that scale. Inside the fence, they’re running a tight, modern operation. Outside the fence, the system offers them no good answers.
The industrial entrant. Riverview LLP, based in Morris, Minnesota, is developing two massive projects in eastern North Dakota: a 25,000‑head facility in Traill County and a 12,500‑head facility in Richland County. An NDSU Extension analysis from December 2025 estimated the two dairies would inject approximately $270 million in initial investment and generate gross annual revenue ranging from $122 to $227 million. Both sites sit near the Minnesota border and the I‑29 processing corridor. North Dakota may stay on the map for total cow numbers. But these aren’t family farms — they’re industrial production units built for integration with large‑scale processing.
The direct‑to‑consumer niche. Twenty‑three farms sell raw milk directly to consumers under HB 1515, which legalized those sales effective August 1, 2023. These aren’t necessarily the same 23 farms Bodine referenced as permitted dairies — there’s overlap, but some raw‑milk sellers may not hold conventional permits and vice versa. Dawson Holle, who co‑sponsored HB 1515, told Dairy Star that “more are poised to come on board” as the 2025 legislature expanded sales to include raw milk products. “This also gives consumers in some of those 50‑person towns the chance to buy local, fresh milk,” he said. By capturing a far larger share of the retail dollar, these farms sidestep FMMO pricing and long‑haul freight entirely.
Here’s the tension worth sitting with: North Dakota will likely remain a dairy state in cow numbers. But the era of family‑scale dairy as a widespread enterprise there is over — unless someone can rebuild the processing link on terms the math can support. Right now, even the families best positioned to try can’t make it pencil.
Three Forces That Grind Margins to Zero
Plant closures pulled the trigger. But three deeper forces had been weakening the foundation for years.
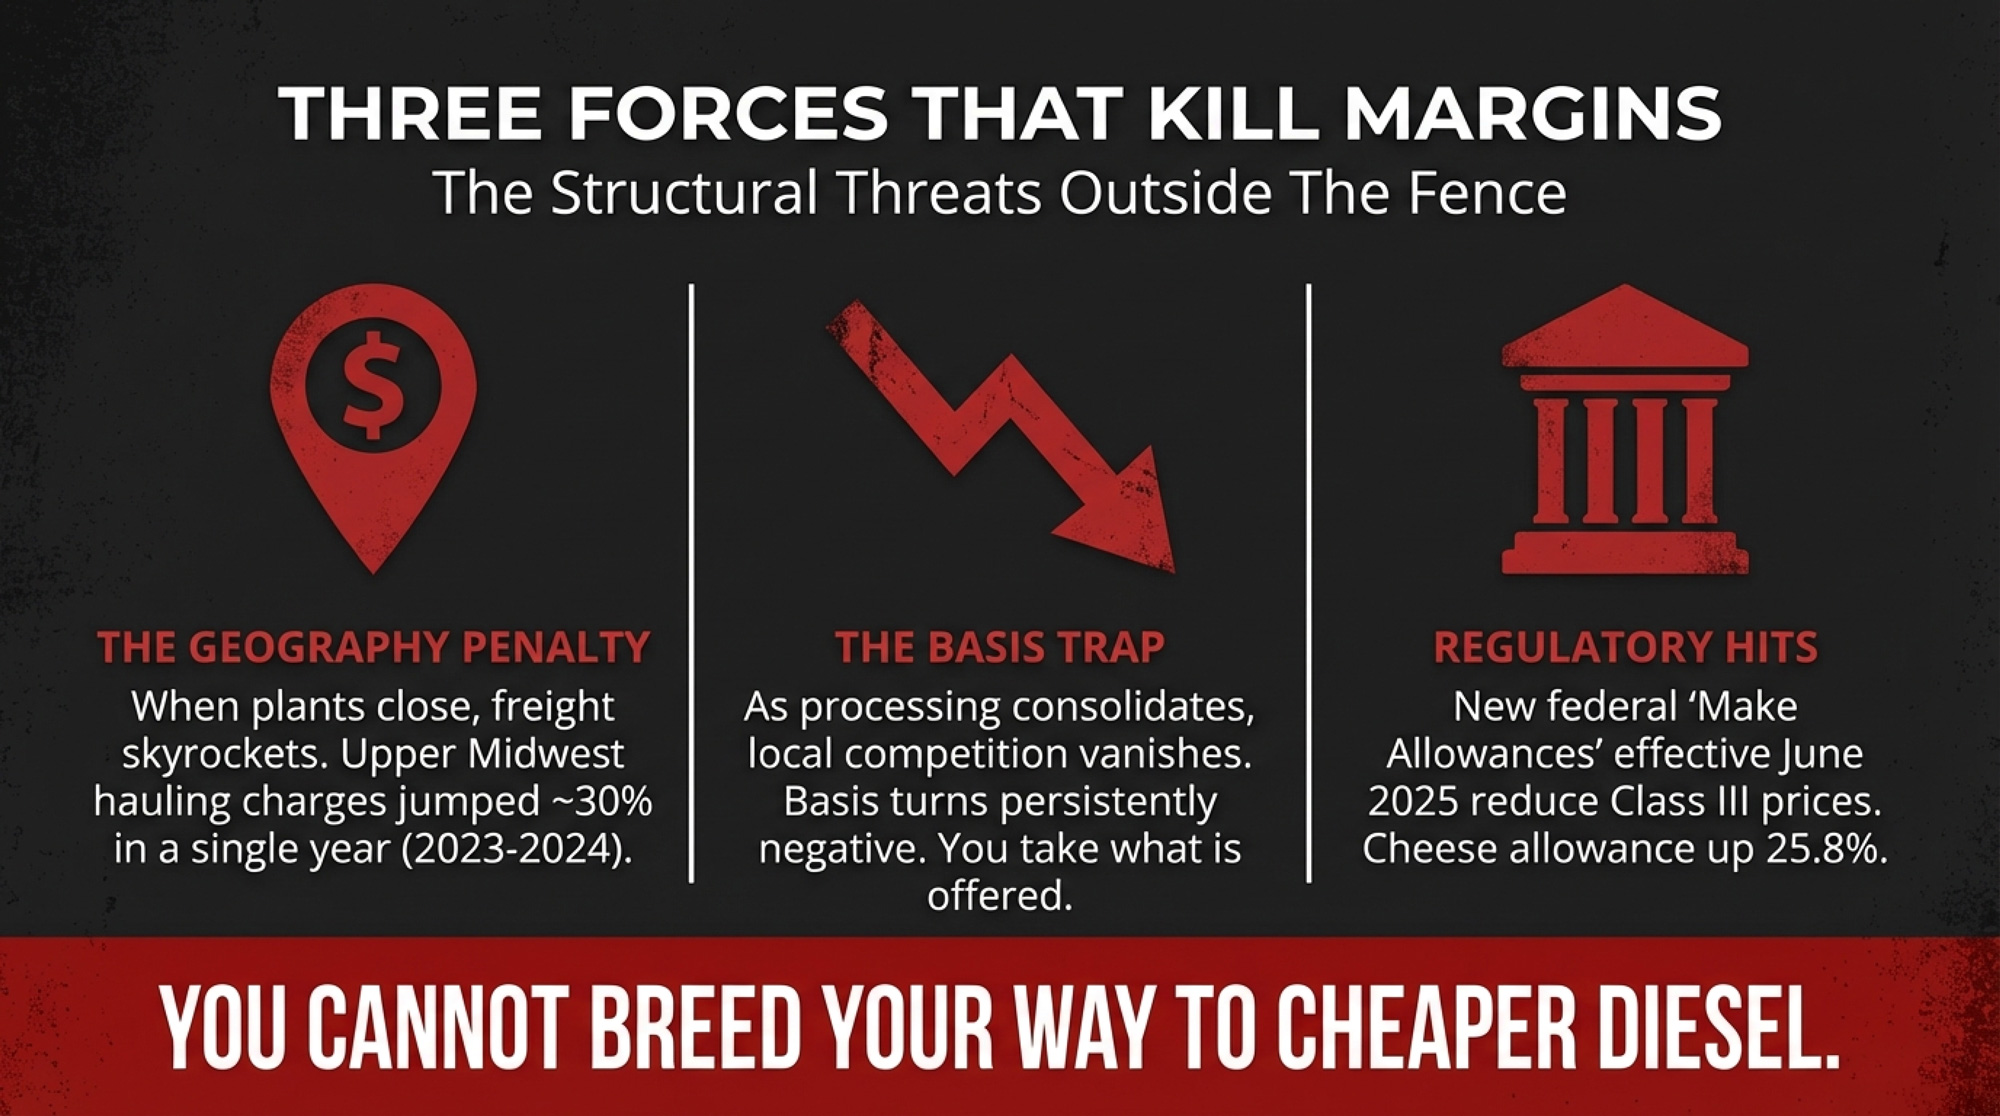
Basis and the geography penalty. Basis — the gap between what you actually get paid and the CME benchmark — is shaped by how far your milk travels and how badly the nearest plant needs it. As processing consolidated along the I‑29 corridor, North Dakota producers saw their basis turn persistently negative with no local plant competition to bid it back up. You took what was offered, or you quit.
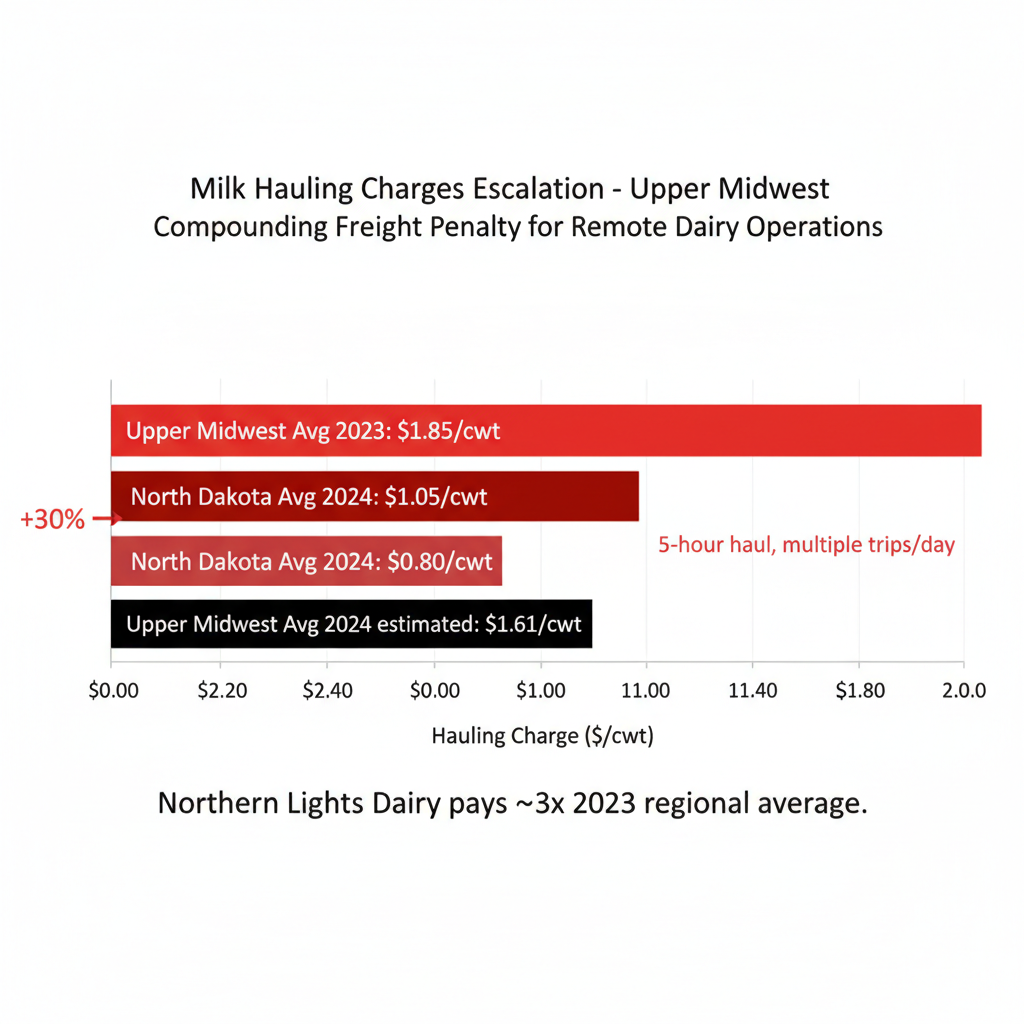
Federal Order 30 hauling data makes the geography penalty concrete. The weighted average milk hauling charge across the Upper Midwest jumped from $0.6137 per cwt in 2023 to $0.7969 in 2024 — a 30% increase — and North Dakota carries the highest average hauling charge of any state in the order. For an operation like Northern Lights, those averages understate reality. They’re hauling roughly 5 hours one way, several times a day, and describing the freight bill as “really, really hard” to carry, even though headline Class III is already at $14.59.
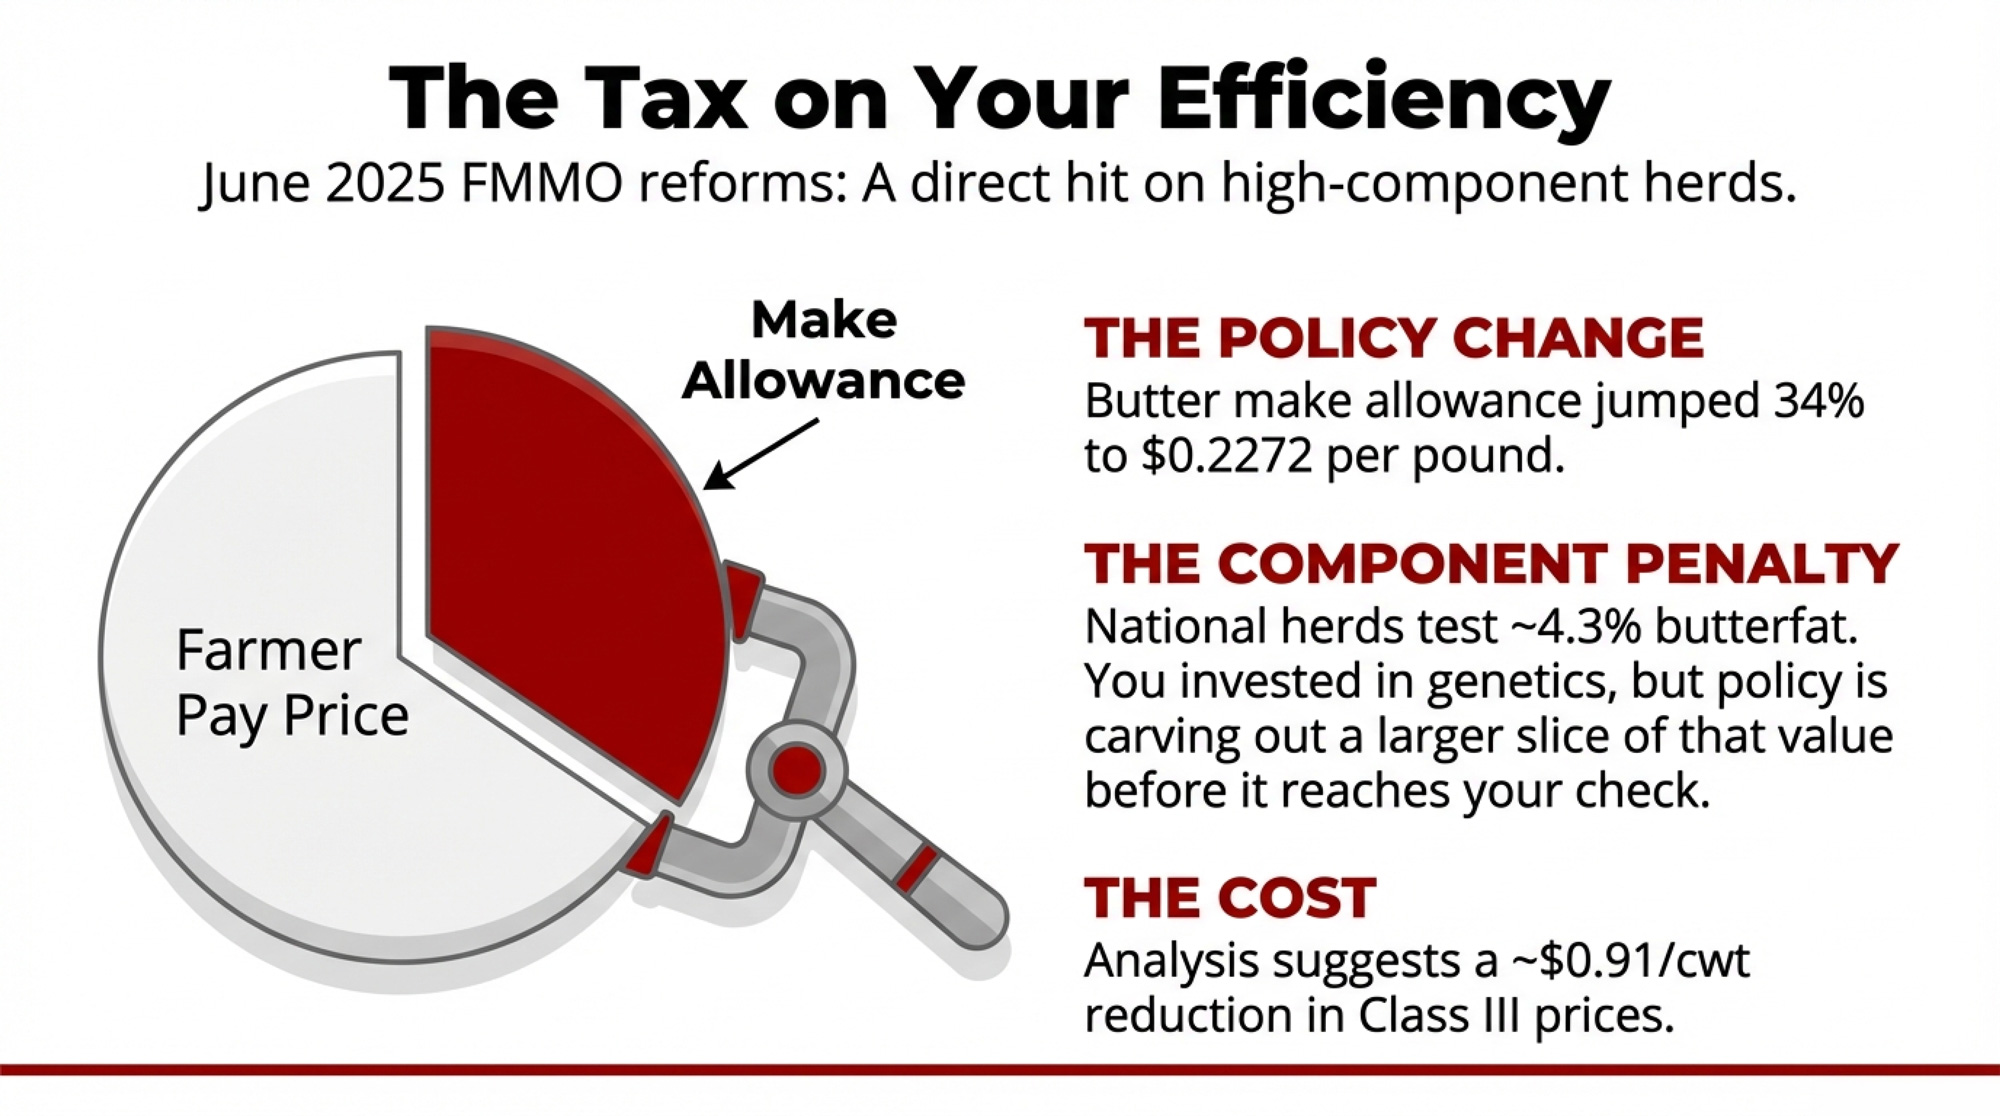
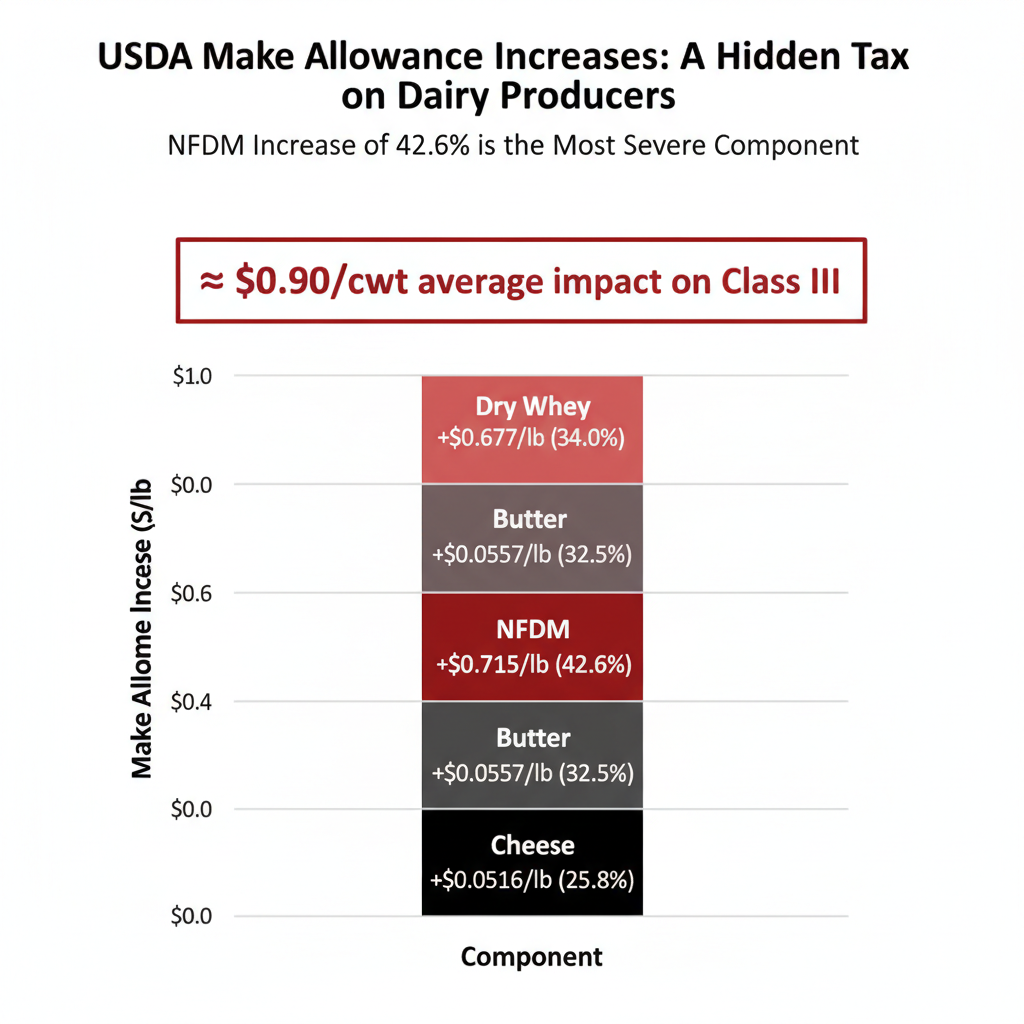
Make allowances: the quiet regulatory hit. In November 2024, USDA issued its final decision on FMMO pricing amendments—the most significant since 2000. The referendum passed in all 11 FMMOs in January 2025, with changes effective June 1, 2025. The cheese make allowance rose from $0.2003 to $0.2519 per pound (25.8%). Butter: $0.1715 to $0.2272 (32.5%). Nonfat dry milk: $0.1678 to $0.2393 (42.6%). Dry whey: $0.1991 to $0.2668 (34.0%).
The American Farm Bureau Federation estimated that if these increases had been in place from 2019 to 2023, they’d have reduced Class III prices by an average of $0.90 per hundredweight and cut annual pool values by over $91 million beyond the $1.26 billion decline already projected. On paper, that hits every farm equally. In practice? Producers in dense processing regions sometimes claw back some of the premium through higher prices. Producers in remote areas with one buyer and long hauls take it dollar‑for‑dollar on a check that was already thin.
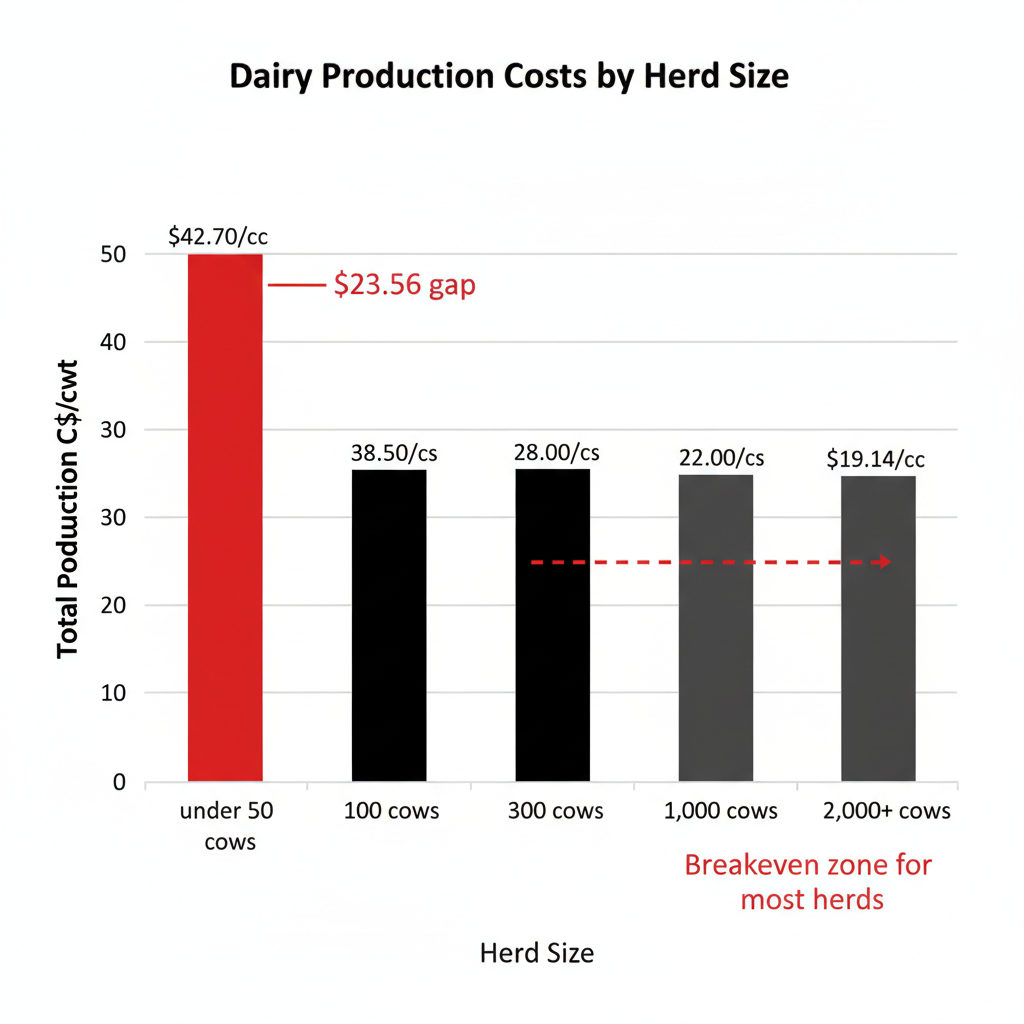
The scale gap. USDA Economic Research Service data from the 2021 Agricultural Resource Management Survey, published in August 2024, found the average total production cost was $42.70 per cwt for herds under 50 cowscompared with $19.14 per cwt for herds of 2,000 or more — a cost gap of $23.56 per hundredweight. That gap is wider than many producers’ entire margin. Illinois Farm Business Farm Management data for 2024 reinforces the pattern: across all herd sizes, the average dairy posted a net economic return of negative $409 per cow, and returns haven’t exceeded total economic costs in any of the last ten years.
Our own internal benchmarking puts it in profitability terms: roughly 89% of operations milking 1,000+ cows report positive returns in typical conditions, compared with about 31% at 300 cows and roughly 11% at 100 cows or fewer. (Specific breakpoints vary significantly by region, management, and debt level.)
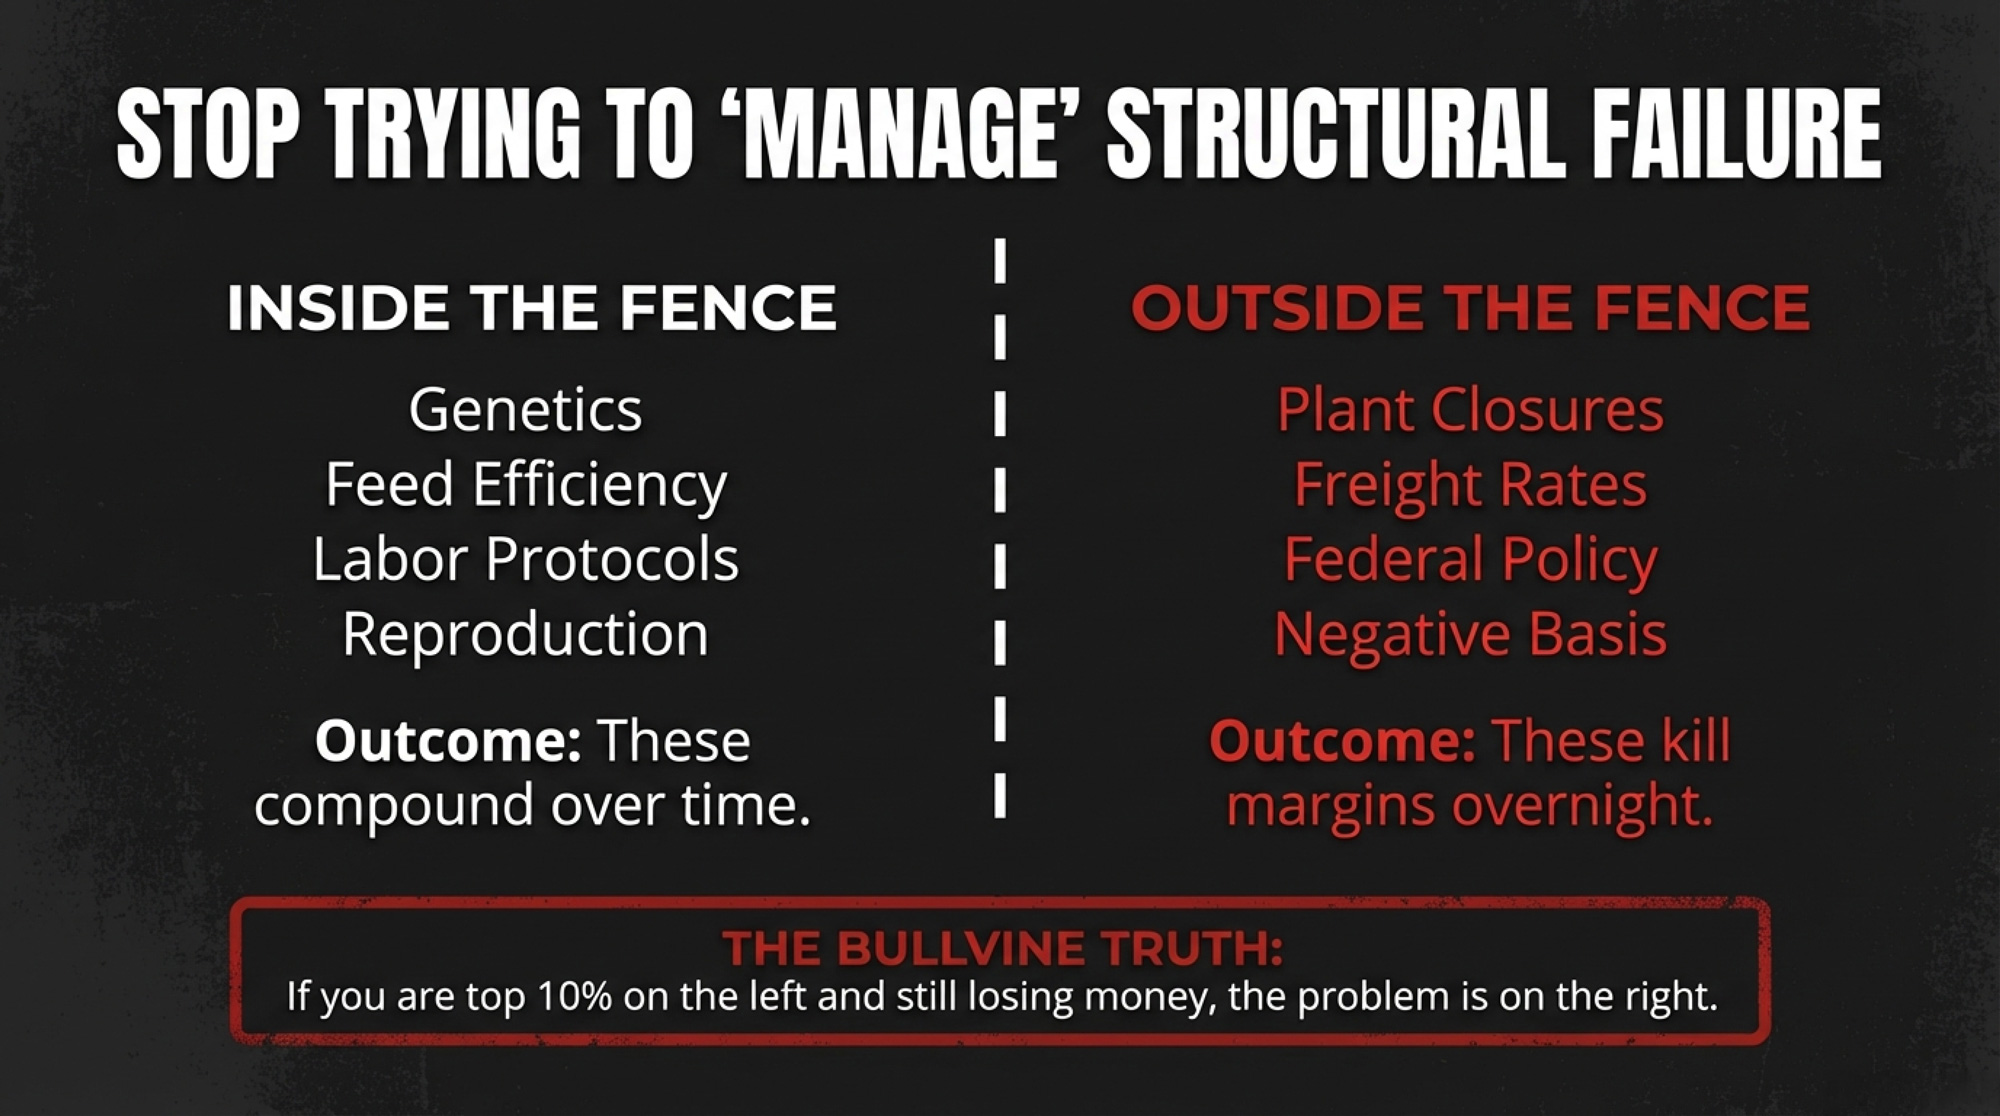
And that brings us to the distinction that matters most in this entire story: inside the fence versus outside the fence.Feed efficiency, reproduction, labor protocols — those live inside the fence, and improving them compounds over time. Basis, plant closures, make‑allowance hikes, route economics — those live outside it. If you’ve become top‑10% at everything inside the fence and your three‑to‑five‑year average still shows red, North Dakota’s lesson is blunt. The problem is structural, not operational. You can’t breed your way to cheaper diesel.
| Factor | Inside the Fence (You Control) | Outside the Fence (You Don’t Control) |
| Feed Efficiency | Ration formulation, feed additives, bunk management | Commodity prices, regional drought, tariffs |
| Reproduction | Heat detection, semen selection, protocol timing | Bull stud consolidation, semen price inflation |
| Labor | Training, retention, shift structure | Regional wage competition, immigration policy |
| Milk Quality | Parlor hygiene, milking routine, mastitis protocols | Processor quality premiums (or lack thereof) |
| Basis | Herd size, contracts, buyer relationships | Plant density, regional supply/demand, co-op pricing |
| Freight | Bulk tank size, pickup frequency negotiation | Hauling distance, route economics, plant closures |
| Regulatory | Compliance, record-keeping | Make allowances, FMMO rules, environmental regs |
The National Numbers Say You’re Next
The forces that dismantled North Dakota aren’t slowing down. Nationally, the U.S. lost roughly 15,866 dairy farms between 2017 and 2022, according to the USDA Census of Agriculture, followed by an estimated 8,400 more between 2022 and 2025. The average age of U.S. farm producers reached 58.1 years in the 2022 Census (USDA NASS), up from 57.5 in 2017. Producers over 65 grew by 12%, while the 35‑to‑64 bracket shrank by 9%. Widely cited family‑business research puts the third‑generation survival rate at roughly 12%, and dairy’s capital intensity makes it especially exposed.
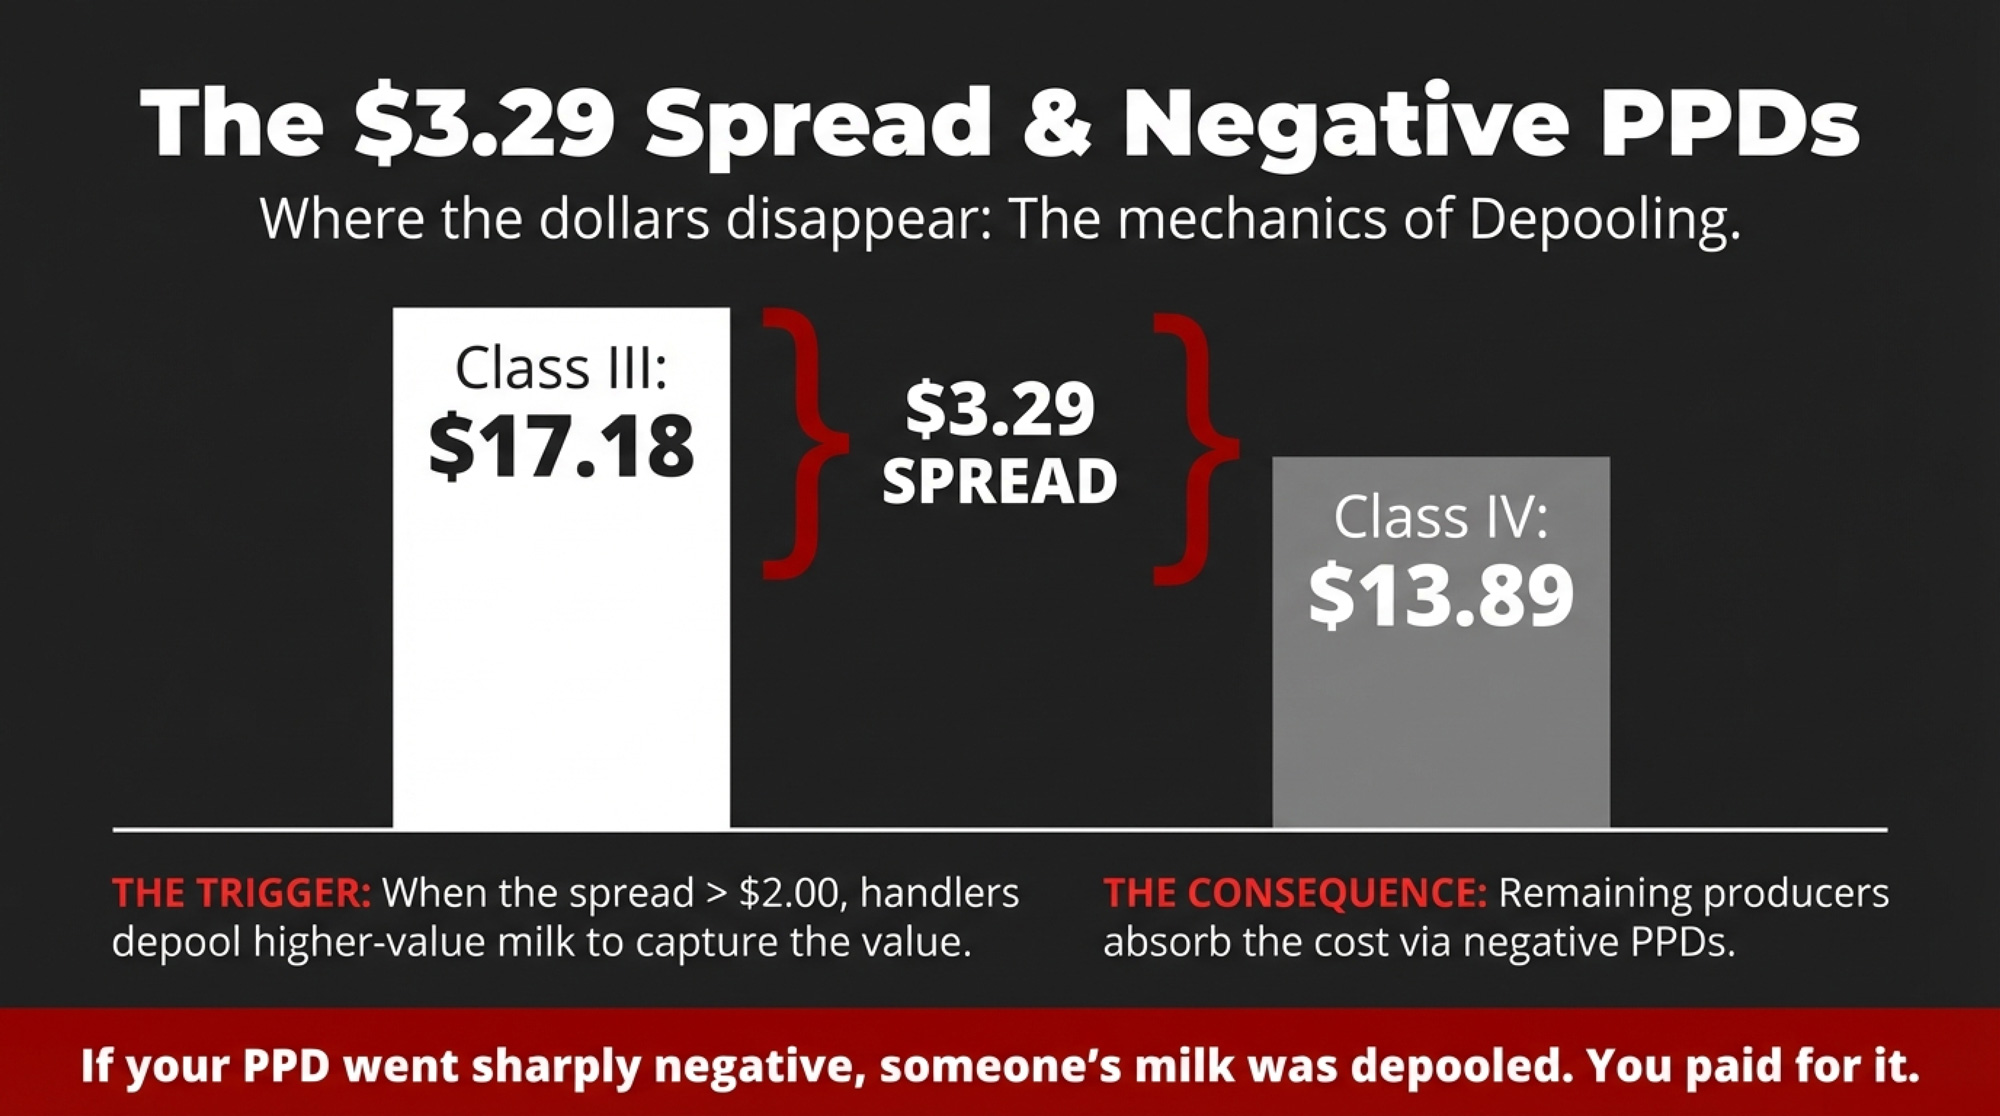
Then there’s depooling. When the spread between Class III and Class IV prices gets wide enough, processors opt out of the federal pool, destabilizing pricing for everyone who stays in. By late October 2025, The Bullvine’s own CME market data showed the Class III–Class IV spread hitting $4.06 per hundredweight — Class III at $17.81, Class IV at $13.75 — creating a gap of roughly $3,800 per month per 100 cows between cheese‑plant shippers and butter‑powder shippers . The producers who get hurt the worst are in regions with limited local Class I demand and no bargaining power.
And 2026 offers no relief. USDA’s January 2026 WASDE projects the all‑milk price at roughly $18.25 per cwt, but Class III futures are hovering in the mid‑$16s with some contracts dipping toward the mid‑$15s. Capital Press reported in December 2025 that Class III is expected to average $17.05 in 2026 — down 7.3% from 2025 — while Class IV is forecast at $14.40, a 17% drop. The February 2026 Base Class I price fell to $14.70 — down $1.65 from January. The pricing environment is the most restrictive in half a decade. For producers already absorbing long hauls and thin basis, 2026 may be the year the structural math becomes undeniable.
What This Means for Your Operation
North Dakota’s lesson isn’t “work harder.” It’s “know whether your business model is structurally viable — and act on the answer before someone else makes the decision for you.”
The core diagnostic is one number: your true all‑in cost of production per hundredweight — including family labor at a realistic market wage, full debt service, and capital replacement — minus your three‑to‑five‑year average mailbox price after hauling, co‑op fees, and deductions. If that gap is consistently negative, you’re not in a bad year. You’re in the same structural position that killed 1,792 North Dakota dairies.

From that single number, everything else follows:
- Know your freight exposure. What’s the hauling distance to your second‑nearest plant? If your current processor closes and your milk has to travel an additional 100 miles, what does that do to your net margin? If you effectively have only one buyer within practical distance, your vulnerability mirrors that of pre‑collapse North Dakota.
- Track your basis monthly. Compare your actual mailbox price to the relevant CME Class price over 12 to 36 months. A persistently negative basis with no offsetting premium is a structural warning, not noise.
- Stress‑test your debt service coverage. A DSCR consistently below 1.25 in average milk‑price years — or one that drops below 1.0 with a $1.50/cwt price dip — signals structural vulnerability.
- Sort your problems: inside or outside the fence? If you’ve become top‑10% at feed, repro, and labor, and your multi‑year average still shows red, the problem is structural. You need a strategic pivot, not better protocols.
- Have the succession conversation with a date attached. Not “someday.” If no committed successor exists, use that clarity to design a deliberate exit while you still have options.
- Ask your processor one direct question: What’s your five‑year plan for this plant?
Four Paths Forward — and What Each Costs
If you recognize pieces of this pattern in your own operation, four strategic paths emerge. None is universally right.
Path 1: Scale toward the efficiency band. If you can credibly reach 1,000 to 1,500 cows, have strong plant relationships, and sit in a geography where processing is growing, the USDA ERS cost data says the math favors you. But scaling in a region with thinning plant density is a different bet than scaling near an I‑29 corridor. If your second‑nearest plant is more than 150 miles away and you don’t have a direct contract, bigger might just mean a bigger version of the same trap.
Path 2: Build a defensible niche. Organic, grass‑fed, A2, farmstead cheese, direct‑to‑consumer — these can work, but only with real margins. The threshold: your niche needs to deliver roughly $8 or more per hundredweight above commodity after all added costs — certification, labor, marketing, packaging. North Dakota’s 23 raw‑milk sellers prove the model. But they depend on location and customer base, not just good intentions.
Path 3: Own or invest in processing — but be honest about what it actually takes. On paper, producer‑owned processing is the logical answer to a processing desert. In practice, it’s “extremely expensive,” as the Holles put it, and state grant programs may not bridge the gap. North Dakota’s SB 2342, sponsored by Sen. Paul Thomas (R‑Velva), offers grants of 5% of processing plant construction costs, capped at $10 million. “Dairy without processing is going to be really tough to kick back in,” Thomas told the House Agriculture Committee. He’s right. But the Holles — a 1,000‑cow, fifth‑generation operation with a state legislator in the family and every reason to make this work — looked at the numbers and told The Bullvine flatly: “We don’t know what we are going to do.” If they can’t pencil it, that tells you something about the gap between policy intent and farm‑level reality. Cooperative models like Idaho’s Glanbia and Wisconsin’s Foremost Farms show producer‑aligned processing can work at scale — but organizing those structures requires volume, capital, and regional density that places like central North Dakota no longer have.
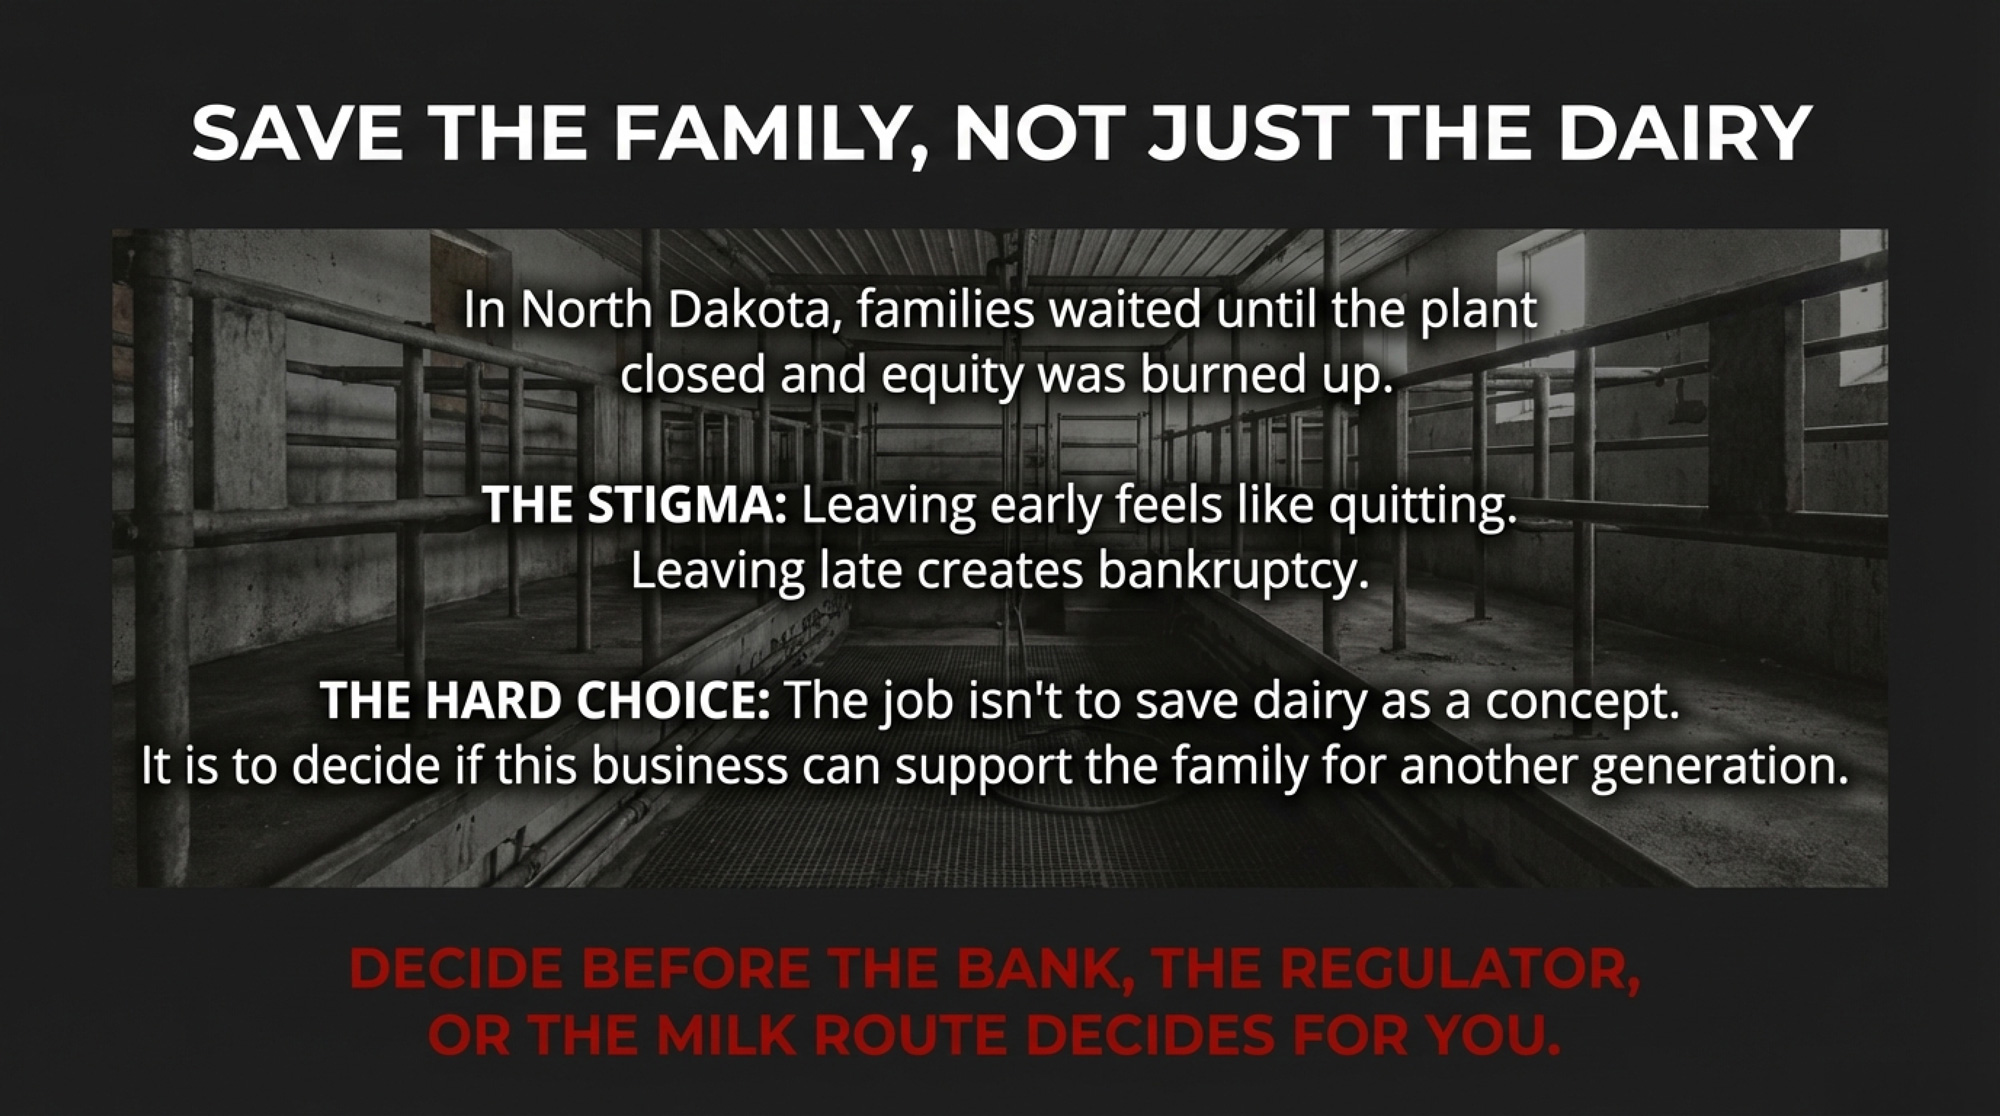
Path 4: Plan a profitable, deliberate exit. If your structural math is negative over a multi‑year average, no successor is committed, and major capital expenditures loom, the most rational move may be to sell cows and equipment while they still command reasonable prices, keep the land, and redeploy capital. In North Dakota, hundreds of families waited until plant closures and exhausted equity forced distressed exits. The families who got out earlier kept more of what they’d built.
One trade‑off nobody talks about openly: in tight‑knit dairy communities, exiting early carries real social stigma. That pressure keeps people milking past the point of economic sense. Acknowledging it doesn’t make the math any friendlier.
The Choice That Sits Heaviest
There’s a moment every producer in a structurally challenged region eventually faces. The morning you realize you’re no longer fighting to save the dairy, you’re deciding whether to fight to preserve the family and the land.
In North Dakota, too many families reached that moment after the plant closed, when equity was burned and options had narrowed to a distressed sale. The ones who came through with something to show — whether they’re still milking or whether they pivoted to cropping and kept the ground — ran the numbers honestly, believed what the math told them, and moved while they still had choices.
Your job isn’t to save dairy as a concept. It’s to decide — clearly, honestly, and soon enough to matter — whether this business, in this form, can support your family for another generation. If the answer is yes, invest accordingly and fight like hell. If it’s no, preserve what you’ve built and redirect it before the route, the regulator, or the bank makes the call for you.
If the financial and emotional weight of these decisions feels overwhelming, resources are available. The Farm Aid hotline (1‑800‑FARM‑AID) connects producers with local support services, and most state extension programs offer confidential financial counseling for farm families.
Key Takeaways
- North Dakota’s crash from 1,810 dairies to 18 is your warning label for what happens when processing deserts, long hauls, and weak basis stack up.
- The Holle family’s 1,000‑cow Northern Lights Dairy — hauling milk five hours one way and saying, “We don’t know what we are going to do” — shows how structural risk can corner even well‑run herds.
- National and Upper Midwest data confirm the math: small and remote herds often face >$23/cwt higher production costs than 2,000‑cow farms, plus roughly 30% higher hauling charges in just one year.
- You need to run the six diagnostics in this article to sort your problems into “inside the fence” (feed, repro, labor) versus “outside the fence” (basis, plants, freight, policy).
- If your three‑ to five‑year average mailbox price sits under your true all‑in cost, your job isn’t to work harder — it’s to choose one of the four paths laid out here before the route, the regulator, or the bank chooses for you.
The Bottom Line
Northern Lights Dairy is still milking today, still hauling to Minnesota on a five‑hour route, still doing everything they can to keep the lights on. When we asked about the future, the family didn’t offer a polished plan or a confident prediction. They said, “We don’t know what we are going to do.” Honestly? That might be the most important sentence in this entire article. Because if a 1,000‑cow, fifth‑generation operation with every advantage inside the fence can’t see a clear path forward, the structural crisis isn’t coming. It’s here.
Complete references and supporting documentation are available upon request by contacting the editorial team at editor@thebullvine.com.
Learn More
- The $0.90/Cwt FMMO Hit: Reset Your Breakeven, DMC Coverage, and Heifer Strategy for 2026 – Arms you with a four-step breakeven reset to neutralize the 90-cent pricing hit from last June. This guide delivers immediate management shifts for your 2026 plan, turning DMC into a structural margin shield rather than a last resort.
- The $11 Billion Reality Check: Why Dairy Processors Are Banking on Fewer, Bigger Farms – Exposes the massive processing expansion that is actually accelerating regional consolidation rather than saving smaller herds. It reveals how to secure your operation’s 3-to-5-year market position before the “processing desert” expands further into your milk shed.
- The $1750 Calf: Is Your 2026 Breeding Plan Leaving $800 a Head on the Table? – Unlocks a high-margin revenue pipeline by transitioning your surplus genetics into a high-value beef-on-dairy system. This unconventional strategy breaks through the milk-price ceiling, capturing massive annual profit gains while your neighbor is still chasing vanishing milk checks.
 Join the Revolution!
 Join the Revolution!
Join over 30,000 successful dairy professionals who rely on Bullvine Weekly for their competitive edge. Delivered directly to your inbox each week, our exclusive industry insights help you make smarter decisions while saving precious hours every week. Never miss critical updates on milk production trends, breakthrough technologies, and profit-boosting strategies that top producers are already implementing. Subscribe now to transform your dairy operation’s efficiency and profitability—your future success is just one click away.