Kooser Farms has filed for Chapter 12 protection twice in the past 6 years. Before you say ‘that’ll never be us,’ grab your balance sheet and check three numbers.
Executive Summary: Chapter 12 farm bankruptcies jumped to 315 cases in 2025 — a 46% surge that’s the bill for margins that broke 18 months ago, not last month’s milk price. Kooser Farms in Pennsylvania, which sold its dairy herd and switched to crops after a 2019 filing, is now back in Chapter 12, and their public case file shows exactly how rising rates, stubborn input costs, and weather turned “Plan B” into a second restructuring. Using that story as the anchor, the piece walks through how Chapter 12 really works for farm families: court‑forced cramdowns on over‑secured loans, seasonal payment schedules, and tax rules like Section 1232 that can erase six‑figure IRS bills. It puts honest numbers on the odds of success, comparing national surveys that show about 60% of confirmed plans reach discharge with Missouri data that show only 38.1% do, so you see the tool’s power and its limits. Then it hands you a simple three‑number diagnostic — debt‑to‑asset ratio, real breakeven per cwt including unpaid family labor, and months of cash on hand — with clear thresholds for “caution,” “danger,” and “call an attorney this week.” The message is blunt but practical: if two of those three have been in the red for a year or more, Chapter 12 isn’t a scary headline about somebody else, it’s an option you should understand while you still have equity and choices.

On October 2, 2025, Kooser Farms LLC filed Chapter 12 bankruptcy in the Western District of Pennsylvania — Case #25-22656. It was the second filing in six years for this Mill Run operation in Fayette County’s Laurel Highlands. Liabilities between $1 million and $10 million. Assets between $100,001 and $1 million.
The filings don’t point to mismanagement. They point to structural economics—and to an enterprise pivot that carries a warning for every dairy producer considering jumping ship.
According to attorney Daniel White of Calaiaro Valencik in Pittsburgh, Kooser Farms sold its “extensive herd of dairy cattle” during its first bankruptcy in August 2019 and converted to row crops. White told the Pittsburgh Business Timesthe logic was straightforward: the farm had shifted from “receiving monthly payments from milk sales” to a crop operation that “yields produce annually, necessitating a payment schedule that aligns with this larger yearly income rather than monthly disbursements”. But the timing complicates that narrative — weeks after that first filing, the Pittsburgh Post-Gazette reported on Kooser Farms in a story on Fayette County dairy operations whose diversification ambitions depended on broadband access that rural Mill Run couldn’t reliably provide. The pivot to crops came after.
And the crops didn’t cooperate. White told PBT that adverse weather made it “challenging to achieve the expected yields”. WPXI reported the Koosers “had a difficult time getting the yield anticipated” across multiple seasons. The restructuring plan from the first bankruptcy took Chief Bankruptcy Judge Gregory L. Taddonio over four years to confirm — he didn’t sign off until October 11, 2023 — and the case was dismissed on May 10, 2024.
On February 9, 2026, Judge Taddonio confirmed Kooser Farms’ second restructuring plan. That’s two court-approved plans in three years. Whether the second one holds depends on weather, crop prices, and whether the restructured payment schedule actually fits the income stream this time. The structural risk hasn’t changed: Kooser Farms traded a monthly milk check for an annual crop harvest, and annual income concentrates all your risk into a single harvest window.
Kooser Farms is one of 315 Chapter 12 filings in 2025 — a 46% increase over 2024, according to the American Farm Bureau Federation’s February 2026 analysis of U.S. Courts data.
315 Families — and the Dairy States Are Lighting Up
Not all 315 filings are dairy. Arkansas’s 33 cases — the most of any state, more than double 2024 — were overwhelmingly rice, with producers losing over $200 per acre even after supplemental assistance. Georgia followed with 27 filings, up 145%. But look at the dairy-heavy states, and the pattern sharpens fast.

| State | 2025 Filings | % Change vs. 2024 | Primary Commodity |
|---|---|---|---|
| Arkansas | 33 | +100%+ | Rice, row crops |
| Georgia | 27 | +145% | Row crops |
| Iowa | 18 | +220% | Dairy, pork, row crops |
| California | 17 | Steady | Dairy, specialty |
| Missouri | 16 | +167% | Dairy, row crops |
| Wisconsin | 16 | ~700% | Dairy |
| Minnesota | 13 | +300% | Dairy, row crops |
| Pennsylvania | ~10 | +160% | Dairy |
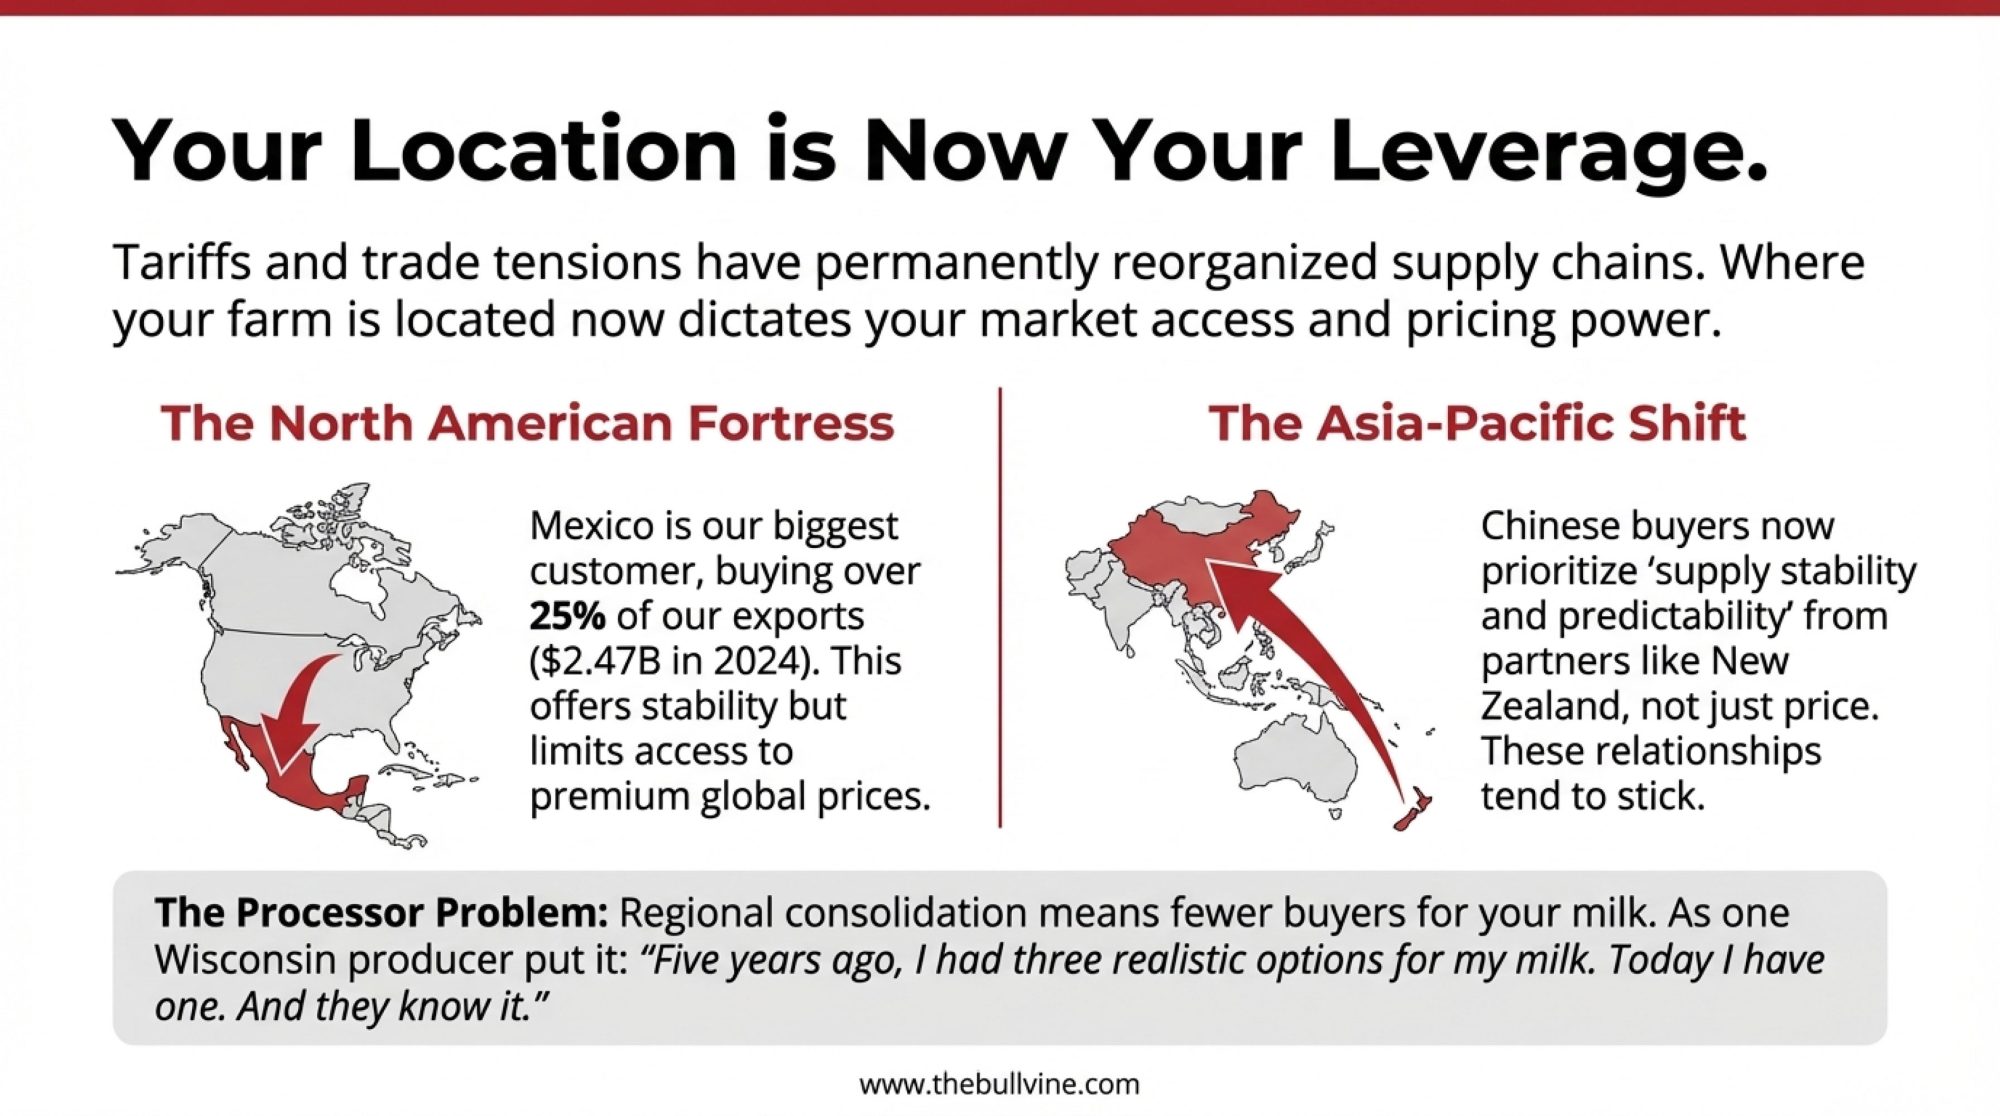
Wisconsin logged 16 filings — a roughly 700% increase off a base of just two the year before. The AFBF reported that “principal row crop losses combined with weakening dairy, hog and poultry markets” drove double-digit filings in Iowa (18, up 220%), Minnesota (13, up 300%), and Missouri (16, up 167%). Pennsylvania climbed 160%. California held steady at 17 filings — tied for fourth-highest nationally —, but Fresno bankruptcy attorney Peter Fear told AgAlert he’s now seeing “new Chapter 7 filings by dairies,” cases where there’s “just no way to make it work financially”. Chapter 12 doesn’t even capture those.
These numbers sit inside the structural forces that have already eliminated 76% of Wisconsin’s dairy herds — and the filing spike is a lagging confirmation that the consolidation thesis isn’t theoretical.
After bottoming at 139 filings in 2023 — the lowest since Chapter 12 became permanent in 2005 — farm bankruptcies surged 55% in 2024 and another 46% in 2025. Linda Coco, a law professor at the University of the Pacific’s McGeorge School of Law who studies farm bankruptcy, put it simply: “Upticks in Chapter 12 filings’ usually indicate ‘something’s really, really wrong.'”
The Credit Line Is Stretching
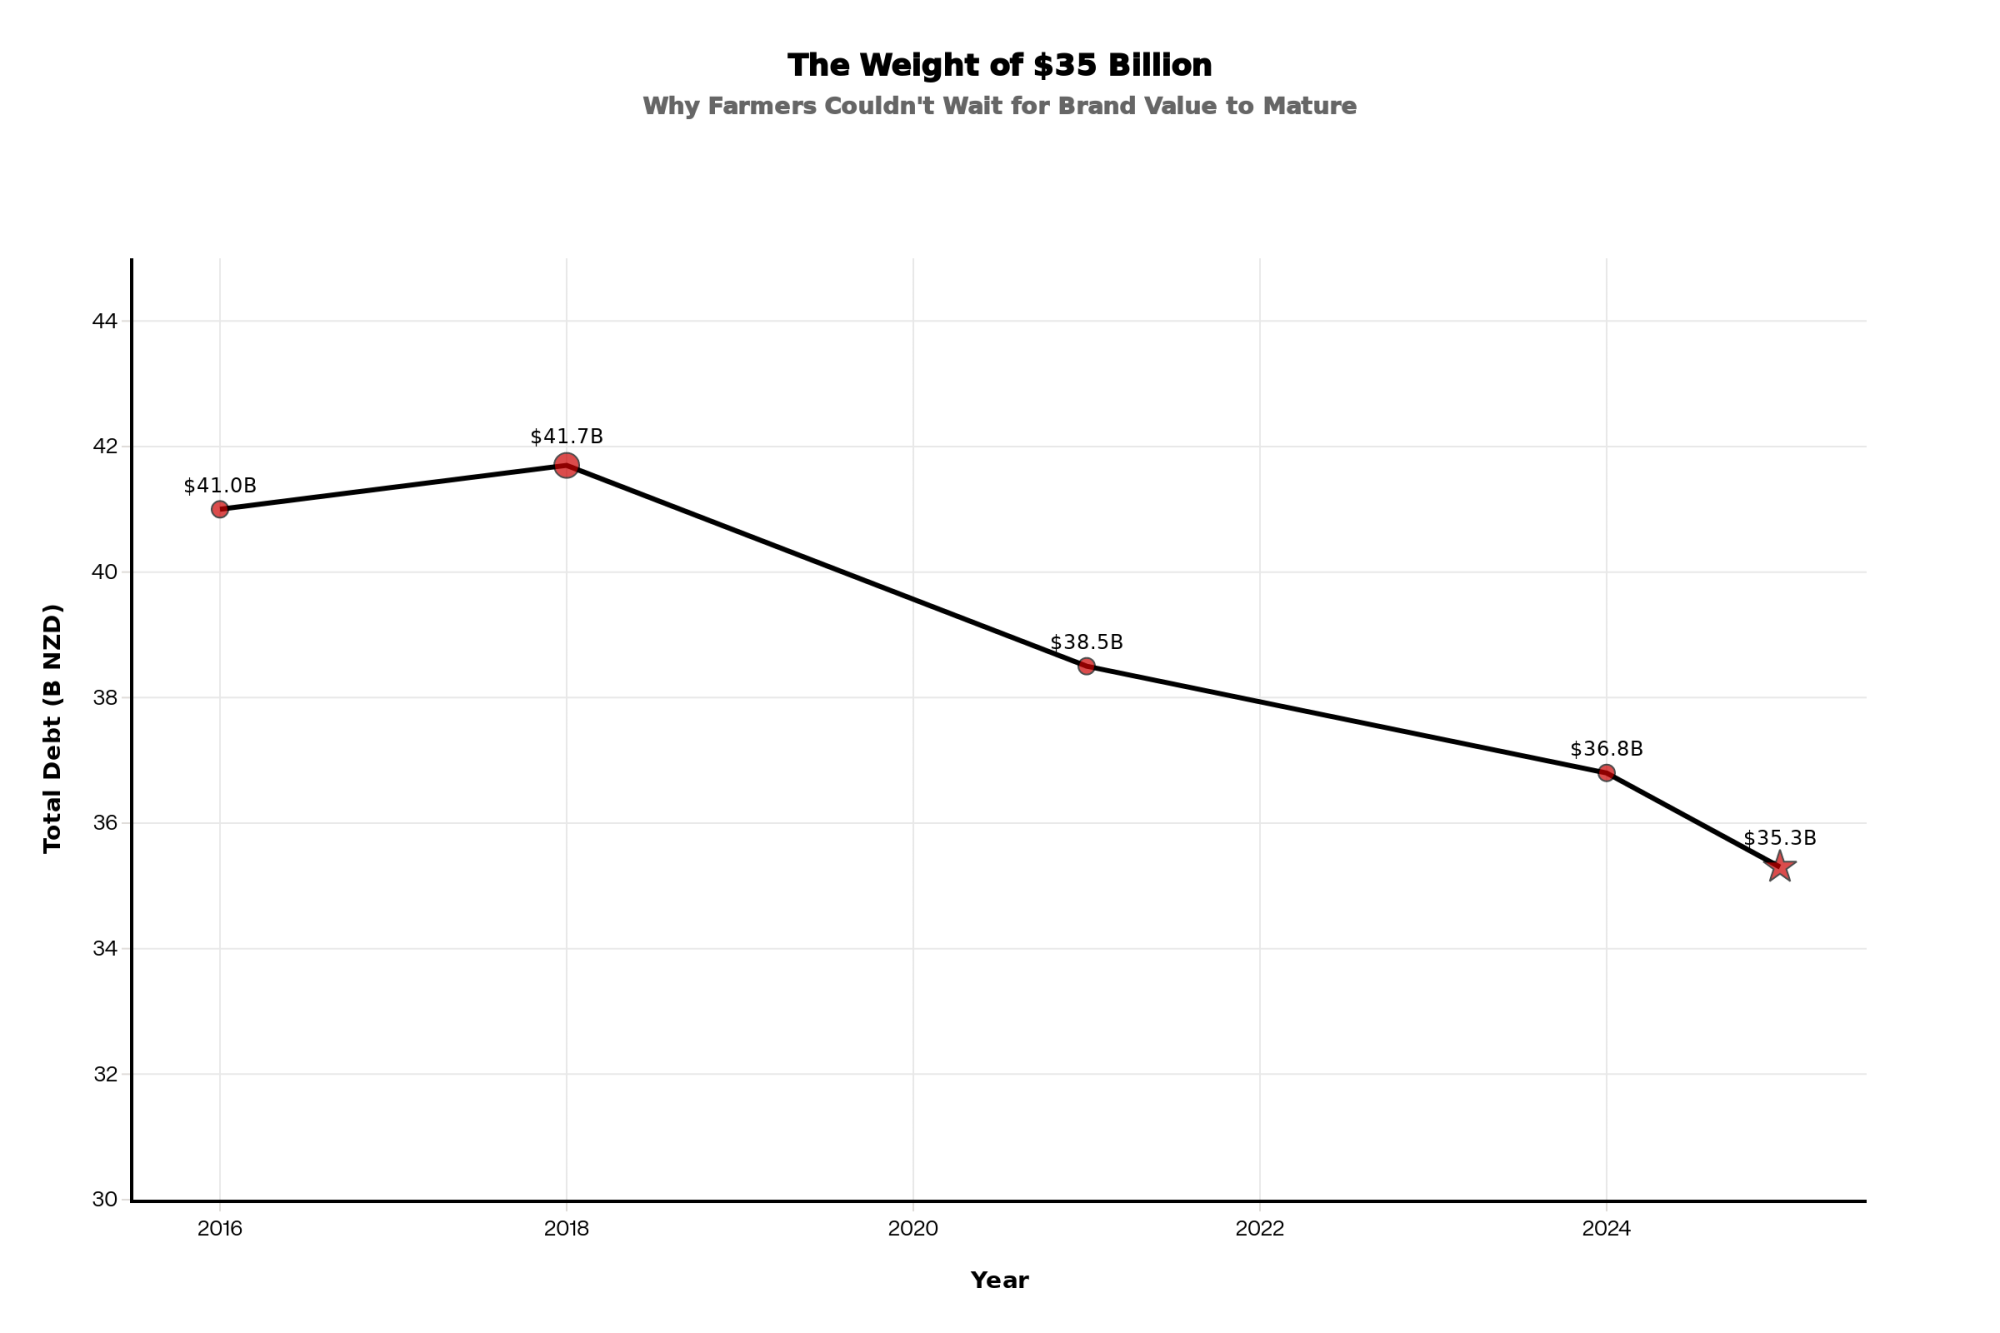
The AFBF’s analysis, authored by economist Samantha Ayoub, was blunt: “A fourth consecutive year of expected declines in farm income will continue to strain agriculture, placing further reliance on credit options that are growing thin”. USDA projects total farm sector debt will hit a record $624.7 billion in 2026, up 5.2% year over year.
In the fourth quarter of 2025, the volume of new farm operating loans rose nearly 40% from the year-prior quarter, according to the Kansas City Fed. For the full year, the average operating loan was 30% larger in inflation-adjusted terms, with average maturities 3 months longer than in 2024. For machinery and equipment loans specifically, average maturity hit the highest level since 2021. That’s the sound of lenders giving farmers more time because the cash isn’t there to pay faster.
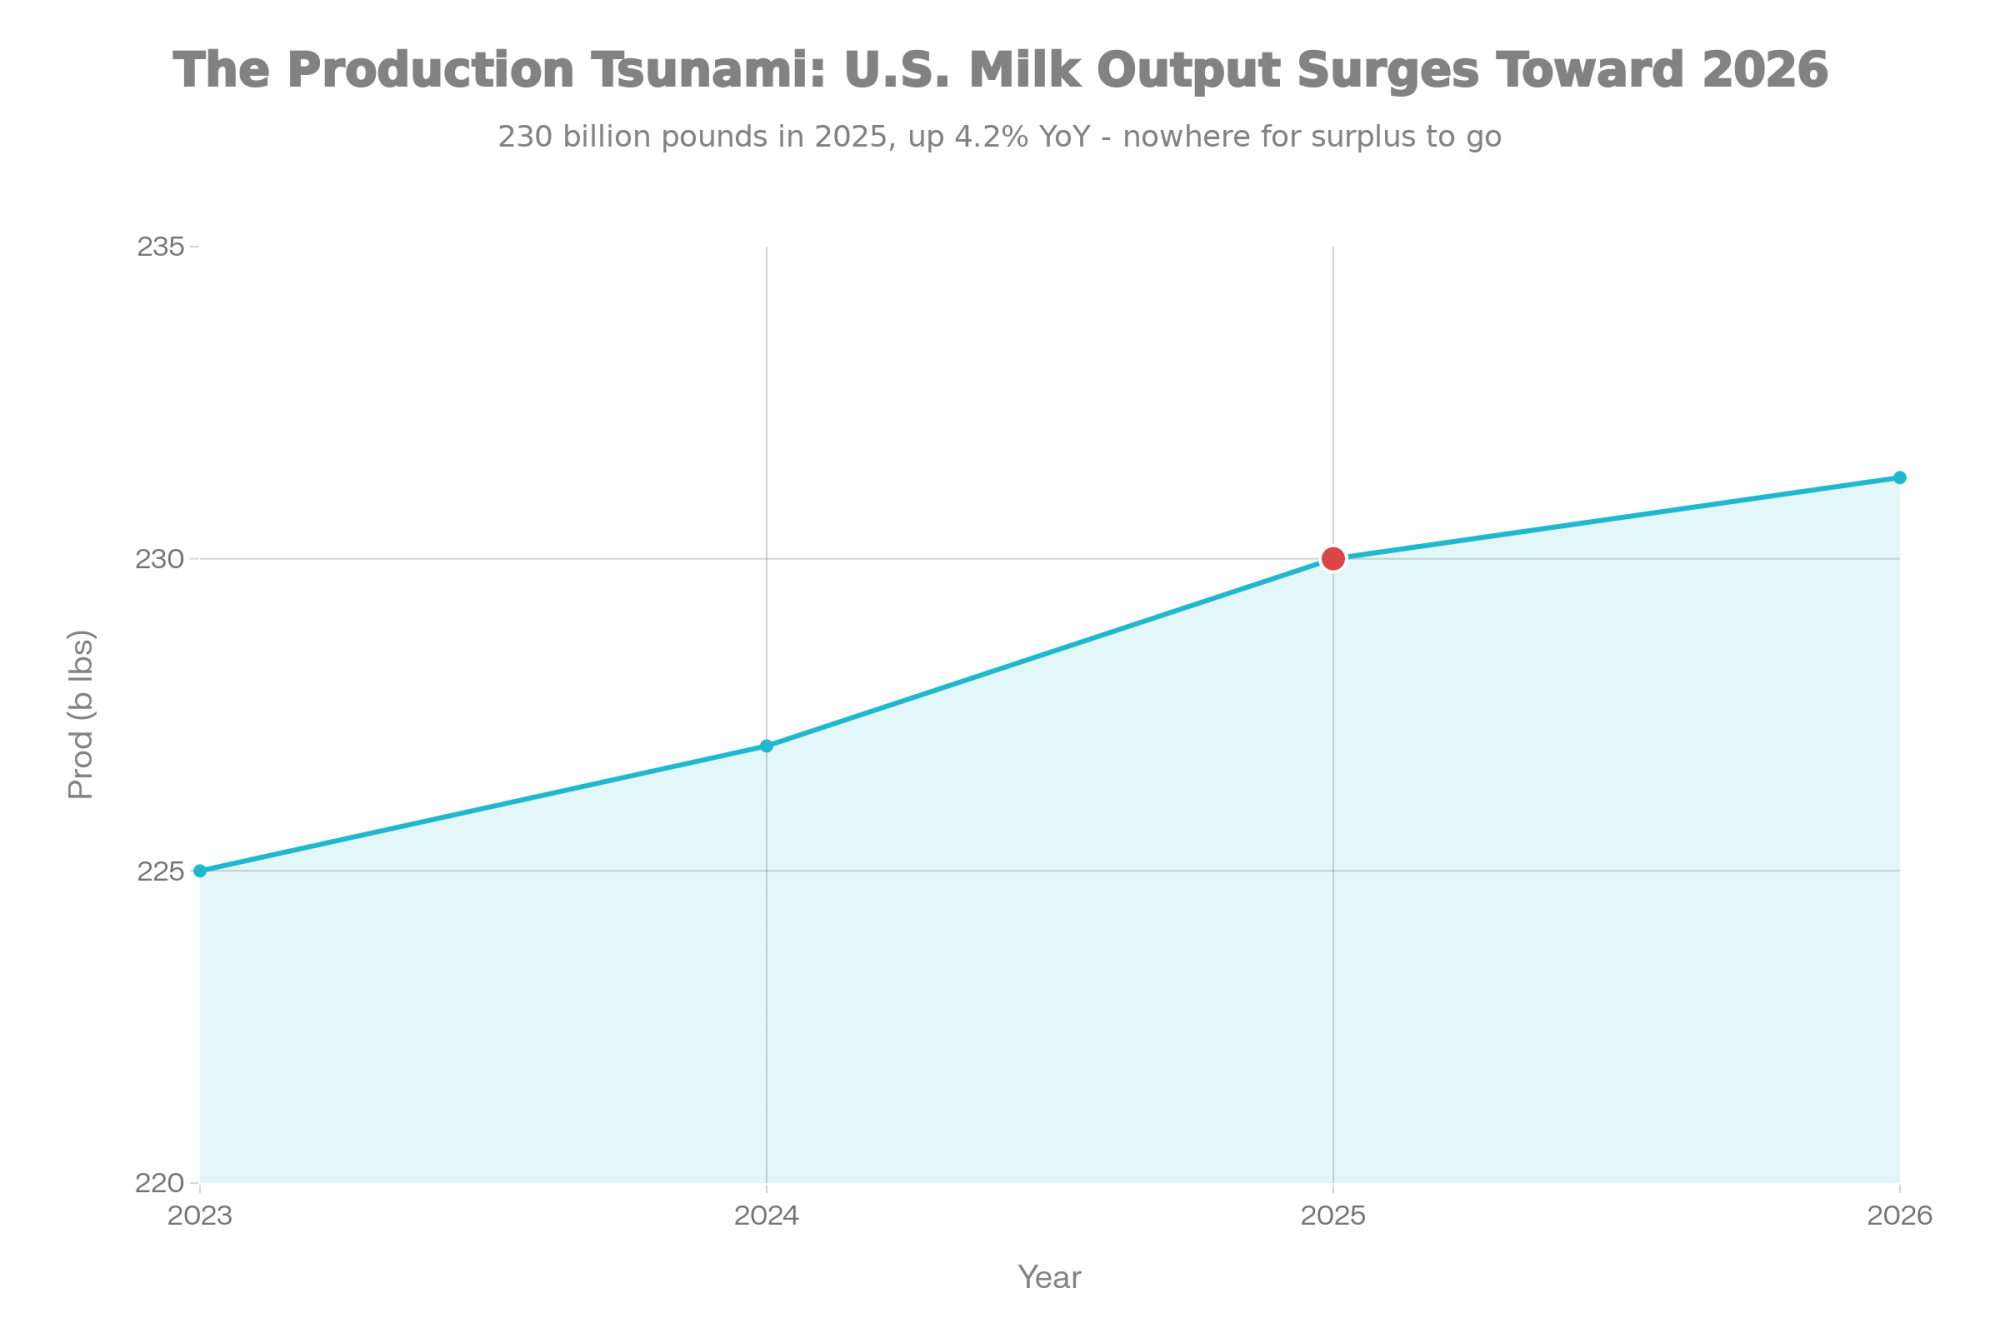
And here’s the part that confuses people: milk prices in 2025 looked okay. Not great, but not terrible. USDA’s February 2026 Farm Sector Income Forecast projects dairy cash receipts will fall $6.2 billion — a 12.8% decline — to $42.5 billion in 2026 as prices retreat from recent strength. So why are families filing when the milk check looked survivable?

Because bankruptcy is a lagging indicator — often 18 months or more behind the margin squeeze that triggered it.
| Year | Chapter 12 Filings | Milk Price ($/cwt) |
|---|---|---|
| 2023 | 139 | $20.50 |
| 2024 | 215 | $21.80 |
| 2025 | 315 | $22.40 |
| 2026 (proj.) | ? | $19.75 |
Why Do Filings Spike When Milk Prices Look Decent?
The cost squeeze of late 2023 and 2024 didn’t kill operations in real time. It bled them — through working capital, stretched operating lines, deferred maintenance, and rolled-over payments. The filings showing up now are the bill for margins that broke a year and a half ago. We laid out the brutal math of consolidation and margin pressure earlier — these filings are that math playing out in courtrooms.
Interest rates hit first. Federal Reserve hikes pushed farm loan rates to 16-year highs by Q4 2023. According to USDA data and the AFBF’s January 2024 Market Intel analysis, interest expenses jumped about 43% in 2023, rising by roughly $10.3 billion. With record farm debt projected at $624.7 billion in 2026, interest expenses will remain near those historic highs. The Bullvine’s December 2025 analysis of the rate repricing crisis hitting mid-size dairies laid out the damage on a representative 400-cow operation carrying $4.5 million in debt: real estate notes resetting from 3.5% to 7.5%, equipment debt jumping from 4% to 7%, operating lines surging from 3% to 8% — adding $120,000 in annual debt service, or roughly $1.30/cwt, before a single operational change. One 380-cow Wisconsin dairyman profiled in that reporting saw his breakeven jump from $17.50 to $19.20/cwt from a single repricing letter. “My costs went up $110,000 from a single letter,” he said, “and there’s nothing I can do with the cows to fix it”.
| Loan Type | Before Repricing (2022) | After Repricing (2024) | Increase |
|---|---|---|---|
| Real estate ($3M) | $105,000 @ 3.5% | $225,000 @ 7.5% | +$120,000 |
| Equipment ($1M) | $40,000 @ 4.0% | $70,000 @ 7.0% | +$30,000 |
| Operating line ($500K) | $15,000 @ 3.0% | $40,000 @ 8.0% | +$25,000 |
| Total Annual Debt Service | $160,000 | $335,000 | +$175,000 |
| Per Cwt Impact (135,000 cwt/year) | — | — | +$1.30/cwt |
Every other input ratcheted the floor higher. According to USDA data compiled by Investigate Midwest (October 2025), total farm labor costs have risen nearly 50% since 2020. Seed expenses are up 18%. Fuel and oil up 32%. Fertilizer up 37%. These aren’t temporary spikes. They’re the new baseline every breakeven calculation has to absorb. For Kooser Farms, every one of these cost escalations compounded on a debt structure already stretched from the 2019 restructuring — a plan that took four years to confirm and survived barely six months after dismissal.
The lag works like this: In year one, the family burns through working capital. Year two, they stretch the operating line and defer maintenance. By year three, the lender’s patience thins, the balance sheet shows the accumulated damage, and the Chapter 12 conversation happens. Peter Fear confirmed the timeline: “This is not something that happened in the last 90 days. This is something that has been happening for several years”.
What Attorneys Are Seeing Right Now
Joe Peiffer has watched this cycle for 44 years. He grew up on a Delaware County, Iowa dairy farm, lived through the 1980s farm crisis, and built his practice — Ag & Business Legal Strategies — to serve families in financial distress. What he saw in late summer 2025 broke the usual pattern.
“In the last week of August to the first week of September, we signed up five new farm clients,” Peiffer told American Farmland Owner in December 2025. “Most of them are crop farmers… and in every case, they’re in dire situations.” Normally, distressed farmers don’t show up until November, after harvest. These came three months early.
One client was, in Peiffer’s words, “upside down, two to one. Assets worth a little over $7 million, liabilities north of $16 million.” And then: “That’s one of the worst I’ve seen, and I’ve been at this 44 years.”
His son and associate attorney, Austin Peiffer, put the broader picture even more starkly: “We can’t write a cash flow that shows a profit this year. We haven’t seen that for any of our farm clients.”
Here’s the barn math that makes those quotes land. Take an operation carrying $2.4 million in total debt against $5.5 million in assets — a debt-to-asset ratio of 43.6%. Yellow zone, not red. Now add 18 months of margins running $2/cwt below true breakeven on a herd shipping 7,000 cwt per year. That’s $14,000 in uncovered annual losses, funded by the operating line. Within two years, the ratio has crept toward 50%, working capital has thinned to almost nothing, and the next loan renewal conversation changes tone completely.
What Does Two Out of Three Red Mean for Your Operation?
Three numbers. You can calculate all of them tonight with your most recent balance sheet and last three milk statements:
| Metric | 🟢 Green Zone | 🟡 Yellow Zone | 🔴 Red Zone |
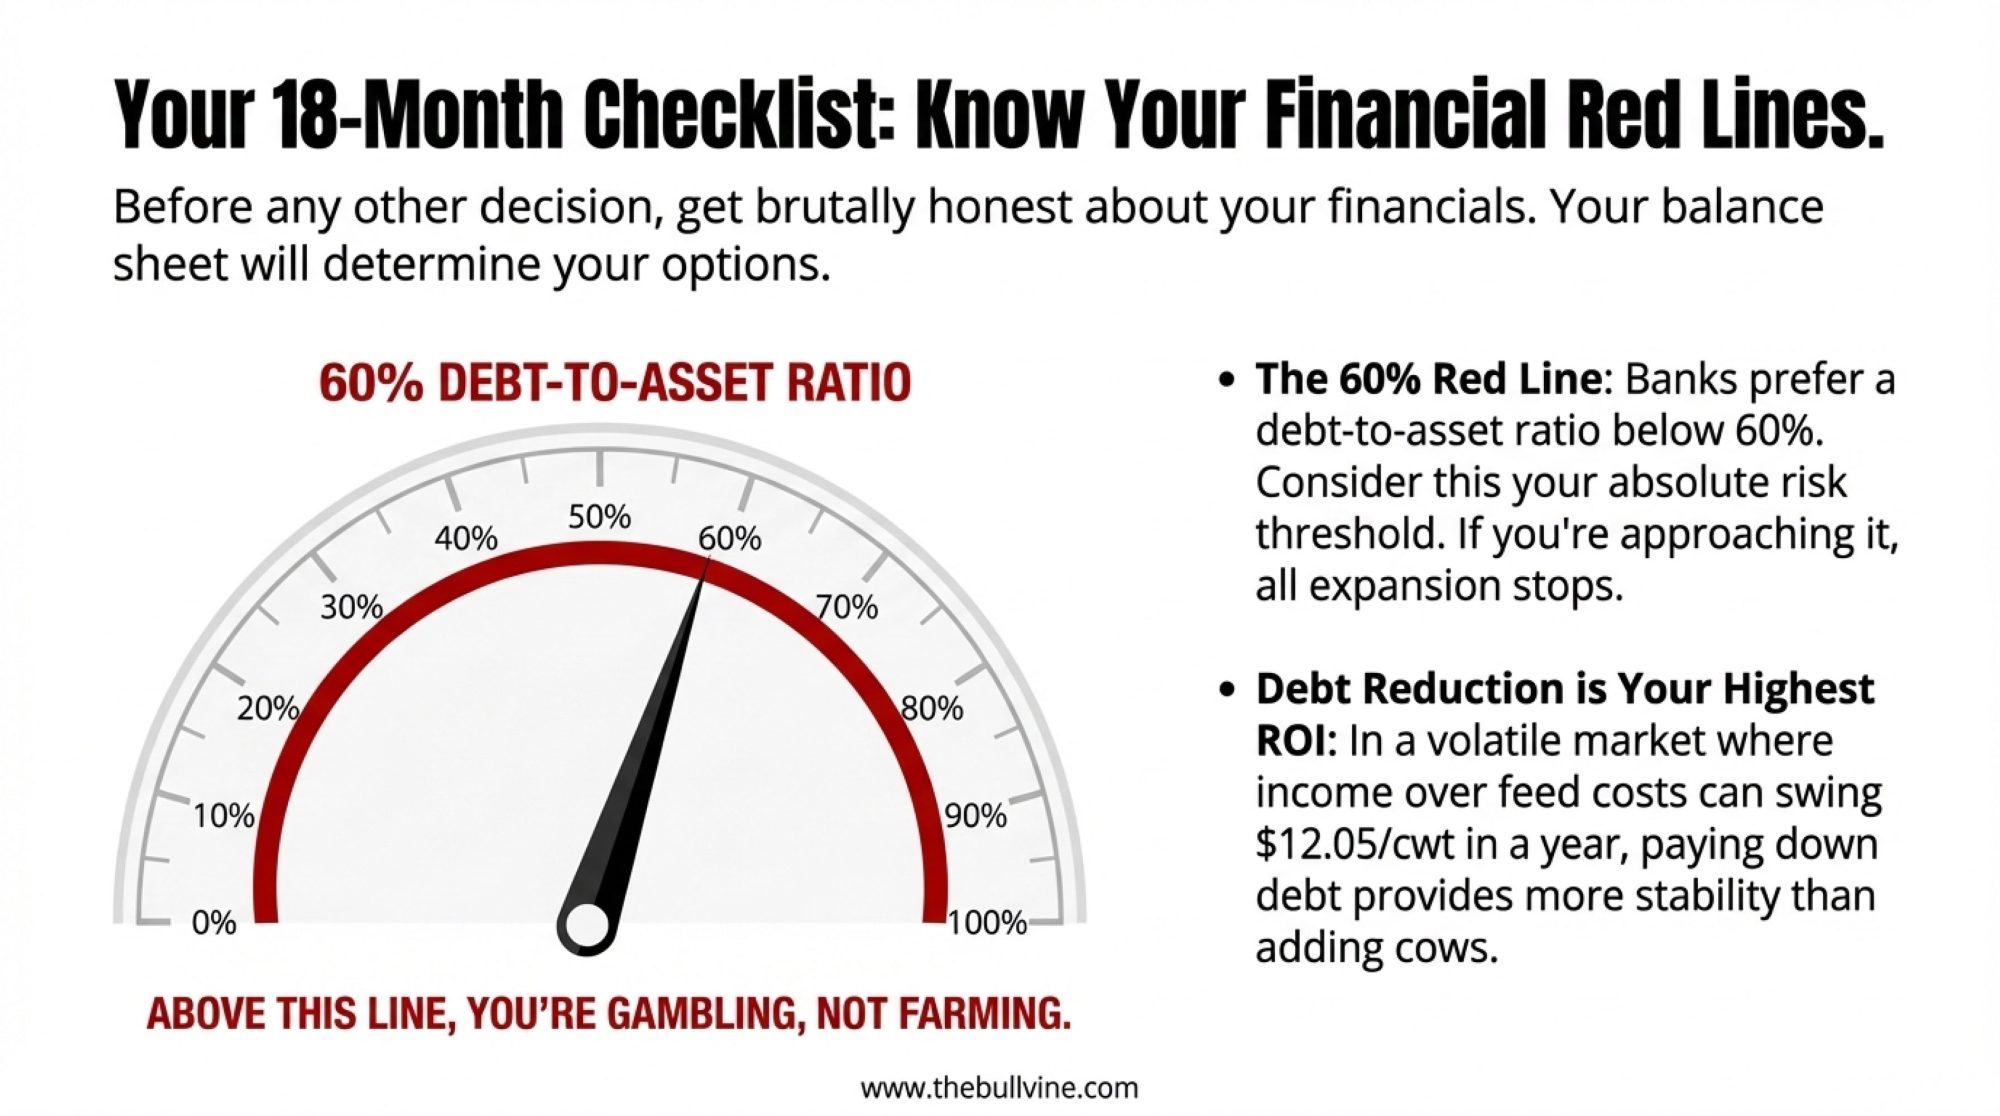
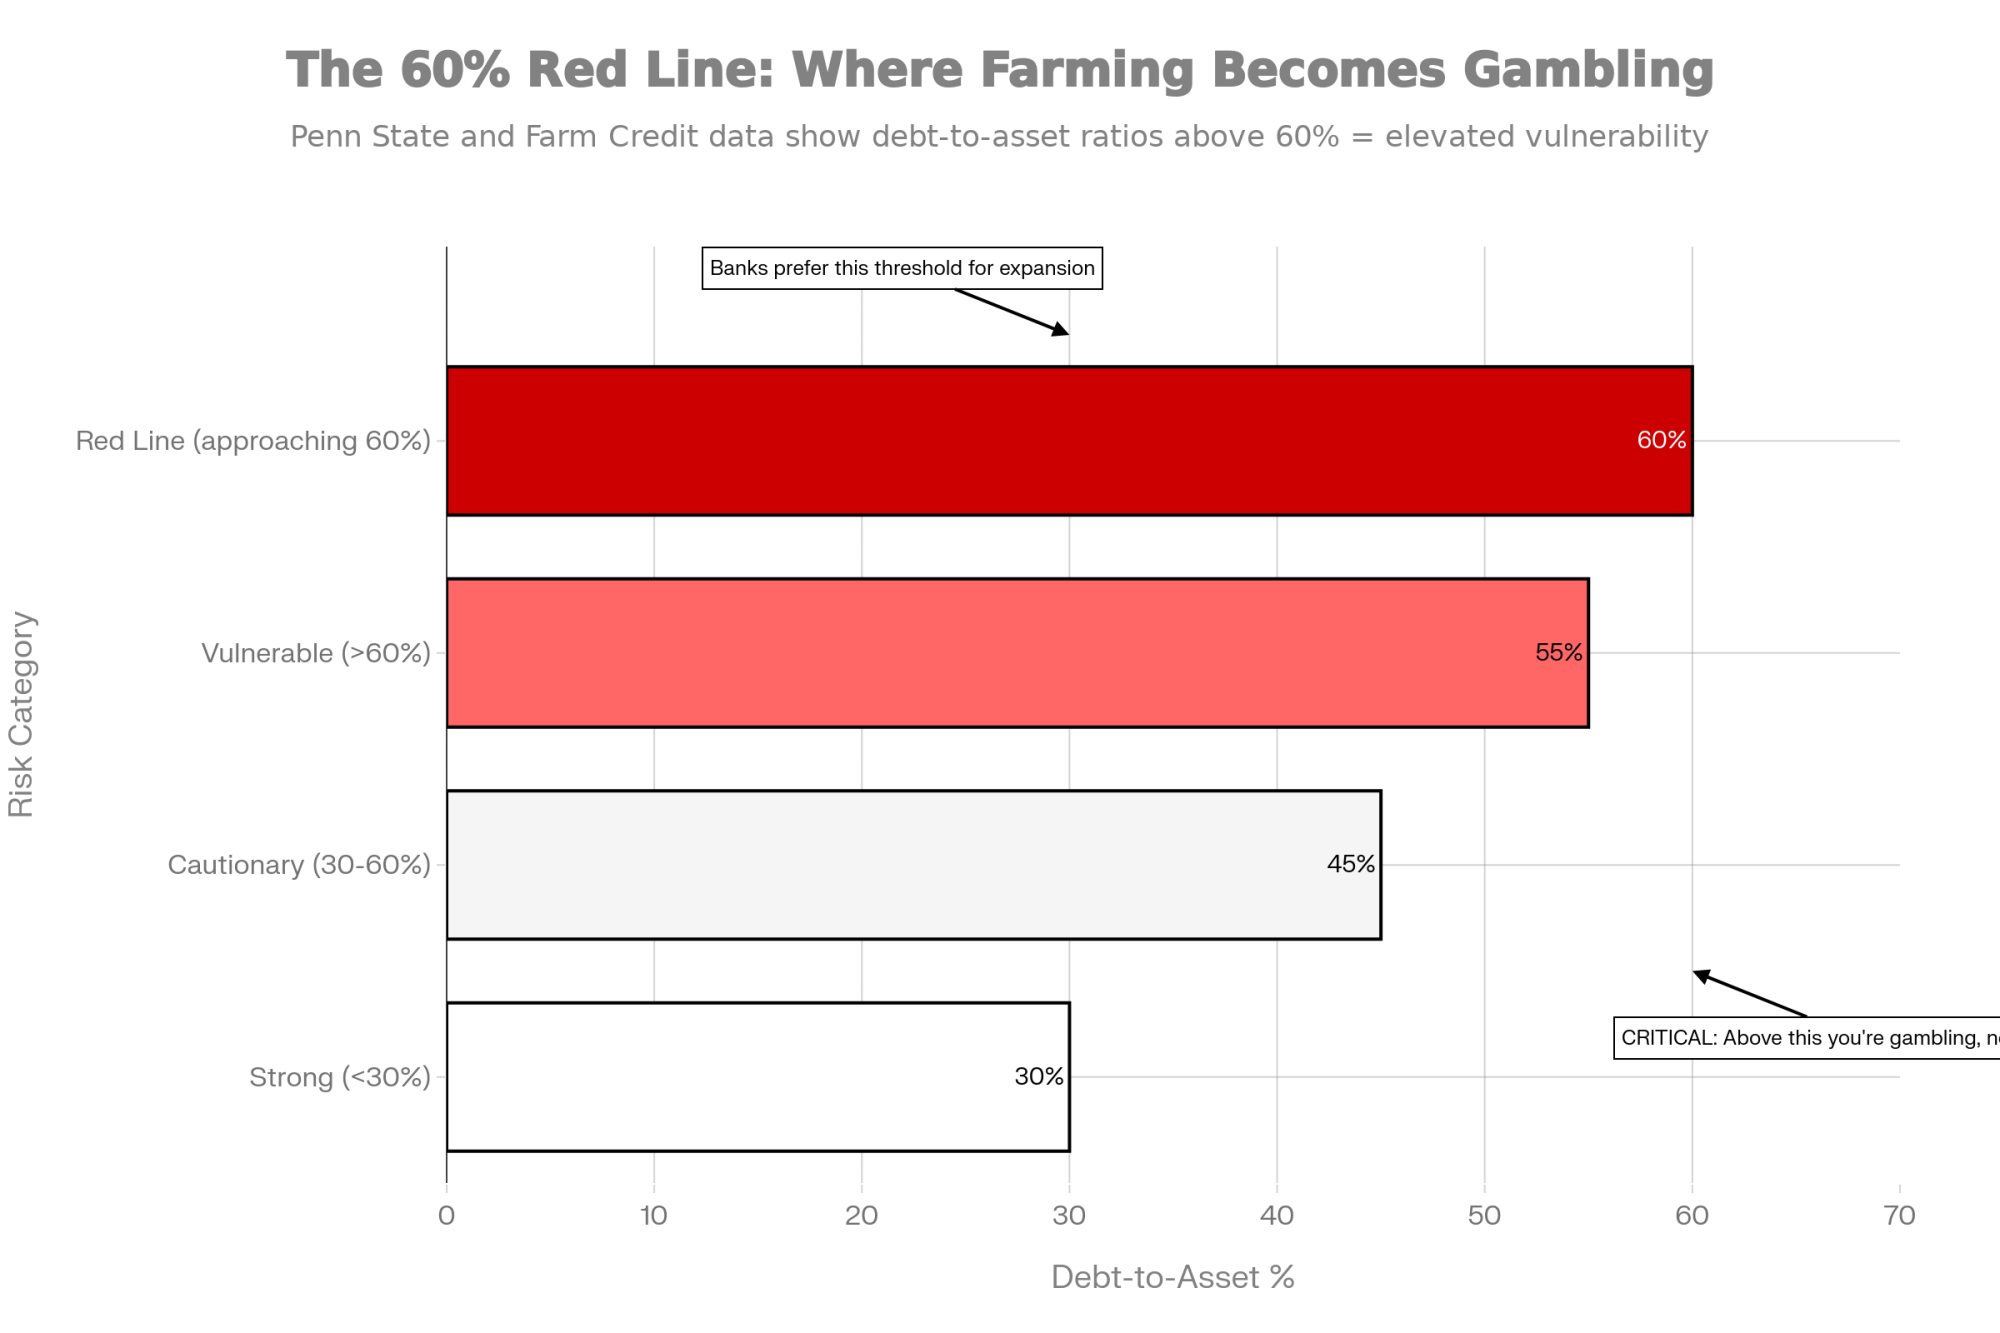
| Debt-to-Asset Ratio | Below 40% | 40% – 60% | Above 60% |
| Real Breakeven vs. Milk Check | Breakeven below milk price | Breakeven at or near milk price | Breakeven above $24/cwt against sub-$22 milk |
| Cash Reserves | 6+ months | 3 – 6 months | Under 3 months |
Debt-to-asset ratio. Total liabilities divided by total assets — use market values, not book. Under 40% gives you room. Between 40% and 60%, your lender is already watching closely — these are thresholds commonly used in ag lending to gauge financial health. Above 60%, restructuring conversations should be happening. Above 80%, call an agricultural attorney this week.

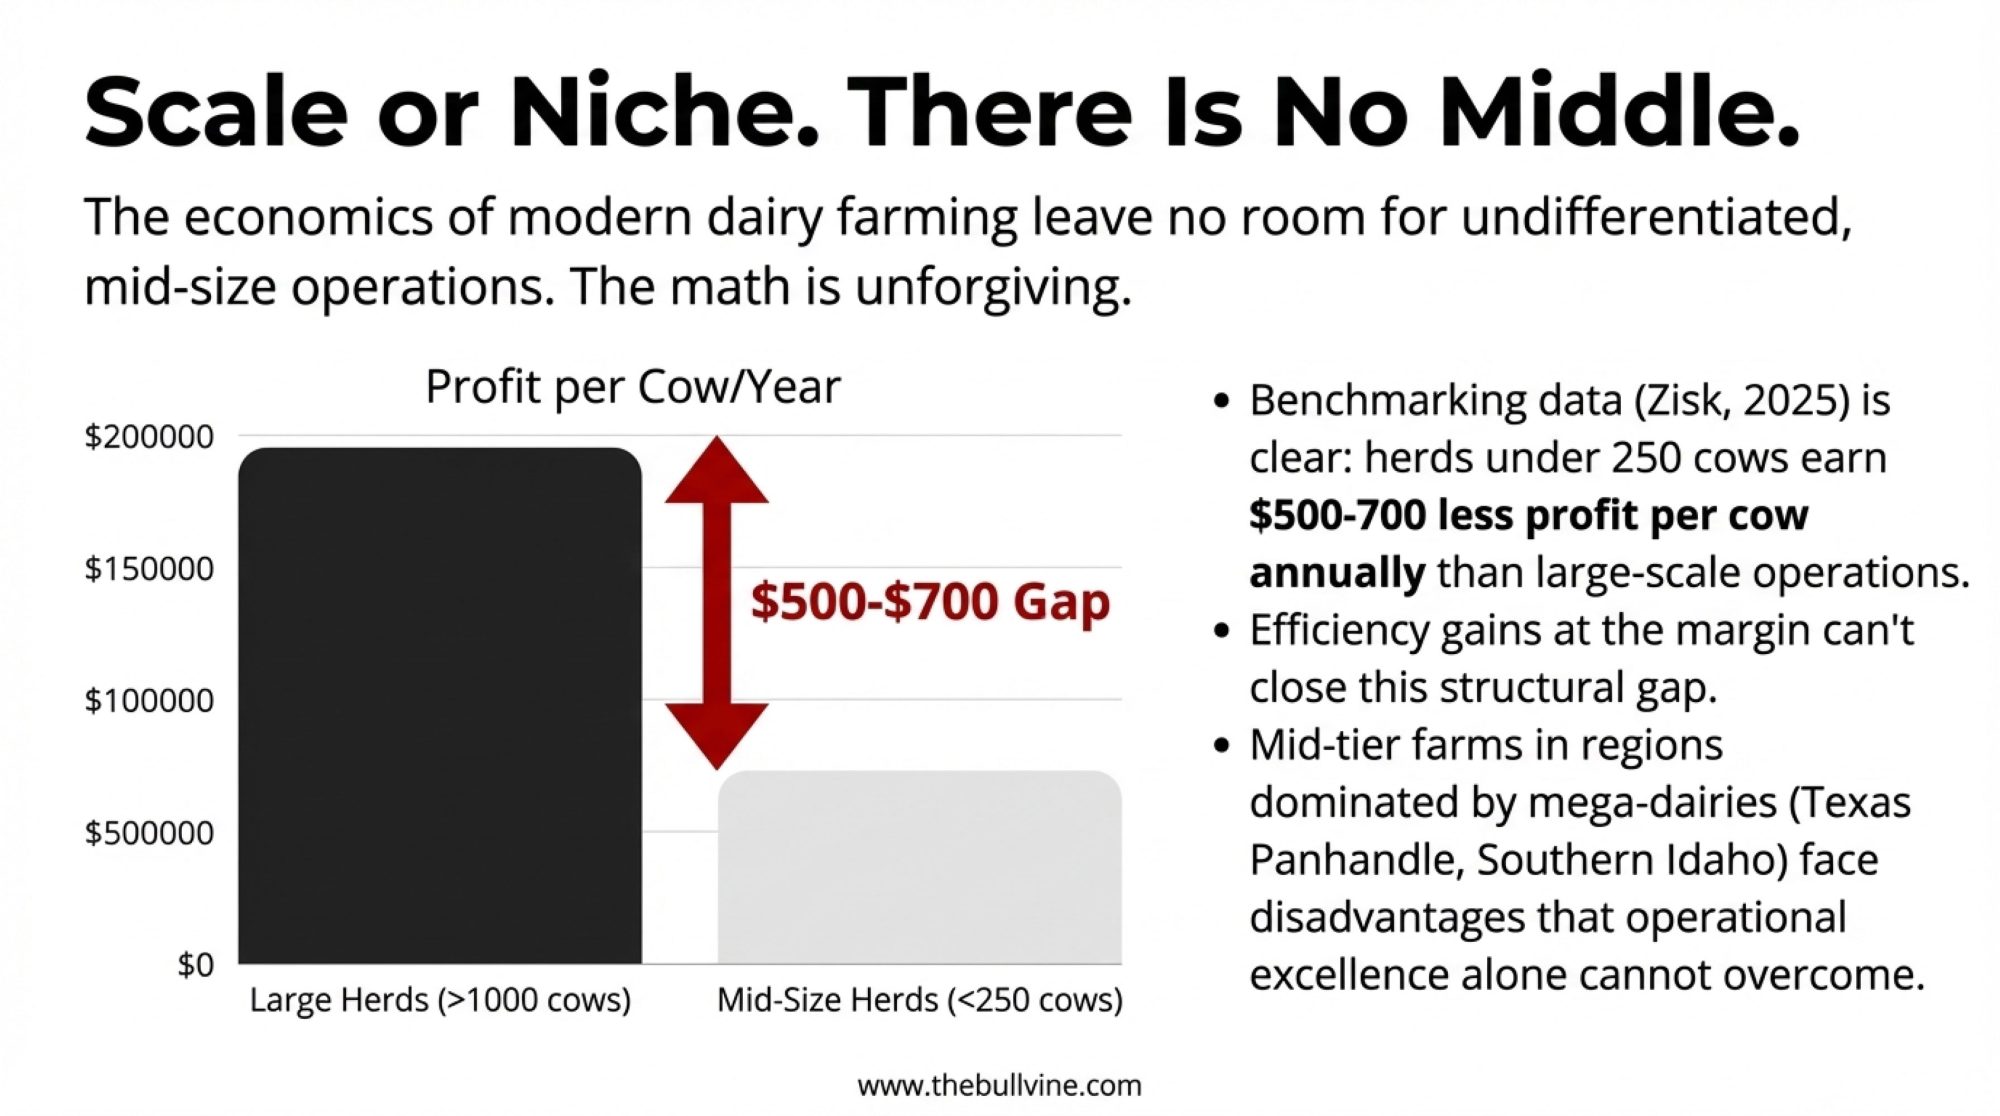
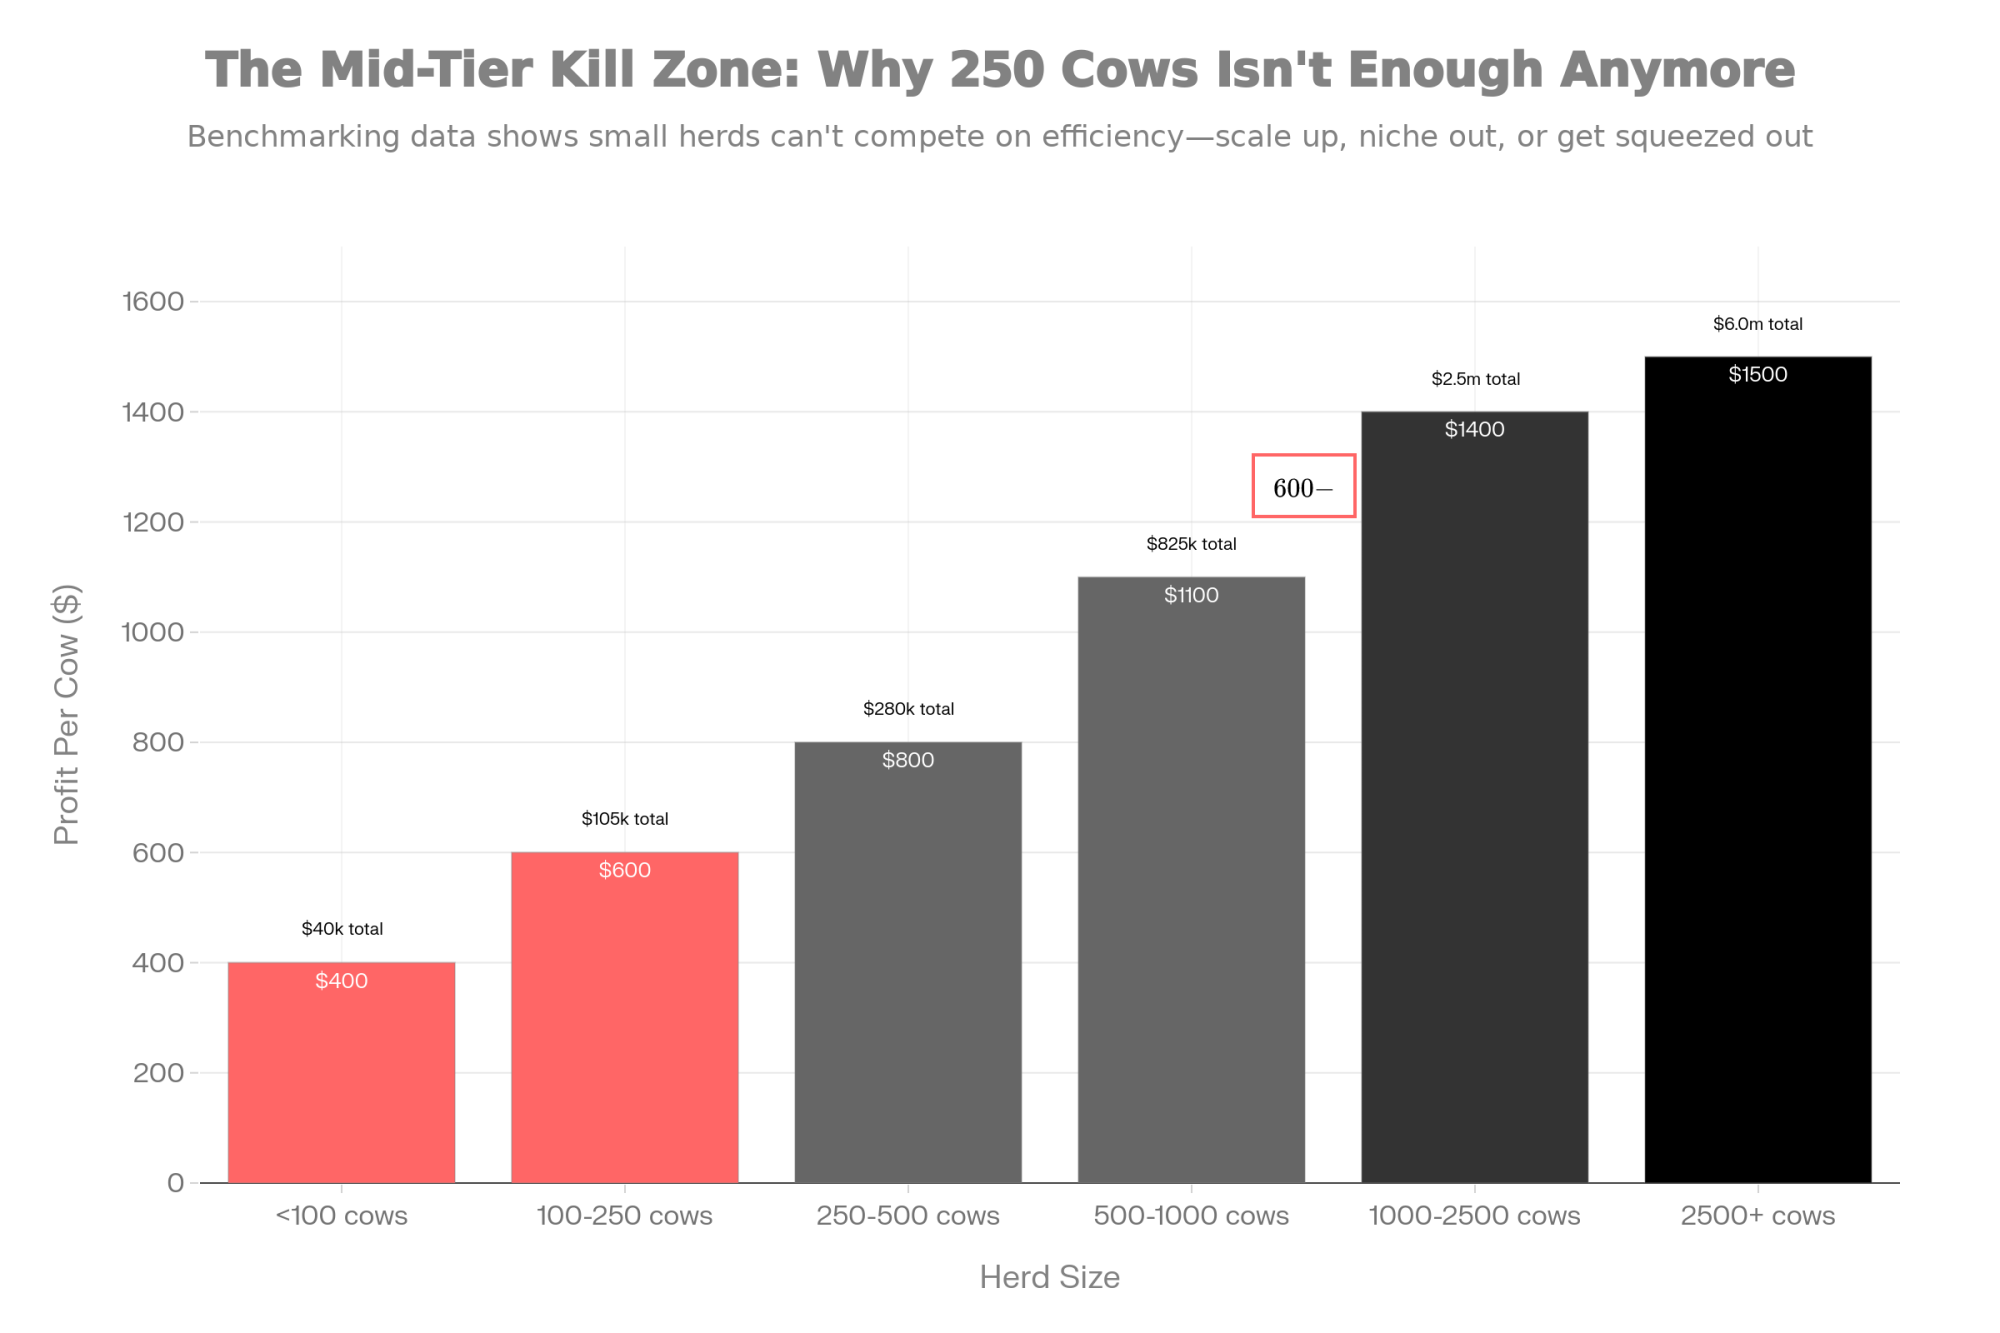
Real breakeven per cwt. This is the one that trips people up. Your breakeven needs to include every cash cost — feed, hired labor, vet, utilities, repairs, hauling — plus depreciation at replacement cost, debt service, and a charge for unpaid family labor at $18–$22/hour. If your family puts in 3,000 combined unpaid hours per year, that’s $54,000–$66,000 you’re probably not counting. There’s a reason management intensity matters more than scale — Cornell data shows well-managed 150-cow dairies outearning sloppy 500-cow operations by $100,000.
Cornell’s 2023 Dairy Farm Business Summary — 127 New York farms — averaged $23.36/cwt total cost of production, including owner labor and equity charges. Herds under 500 cows averaged $26.03/cwt. Herds of 500–1,049 came in at $24.98/cwt. And those are DFBS participants — farms that volunteer to be benchmarked, which tend to be better-managed than the overall population. Your real number might be higher. If your breakeven sits above $24/cwt and your milk check averages below $22, the gap is structural. Not seasonal.
Cash reserves in months. Add up cash, savings, and unused operating line. Divide by monthly total obligations — all loan payments, operating costs, and family living draw. Six months or more means you can absorb a hit and choose your next move. Three to six is tight. Under three months, any single disruption cascades fast.
If two of those three have been red for more than a year, Chapter 12 isn’t hypothetical for you. It’s a tool you need to understand before the window to use it narrows.
Chapter 12 Is a Tool — But Not a Free Pass
The mechanism that quietly saves the most operations — and causes the most confusion — is cramdown. In plain terms, the court can force your lender to accept less than you owe on a loan, based on what the collateral is actually worth today.

Say you owe $400,000 on an equipment loan. The collateral — your chopper and tractor — is worth $250,000 on today’s used market. Outside bankruptcy, the lender is secured for the full $400k. Inside Chapter 12, the court splits that claim: $250,000 stays secured and gets paid back at a court-approved rate over time. The remaining $150,000 flips to unsecured status, landing in the same pool as old feed bills and unpaid vet invoices. Whatever isn’t paid through your plan’s disposable income by discharge gets wiped.
Your original payment on that $400k note at 8% over 7 years: roughly $6,234/month. After a cramdown — $250k secured at 6% over 15 years — the payment drops to about $2,110/month. That’s about $49,500 a year back into your cash flow from restructuring a single loan.
| Scenario | Monthly Payment | Annual Payment |
|---|---|---|
| Before Cramdown ($400K loan, 8%, 7 years) | $6,234 | $74,808 |
| After Cramdown ($250K secured, 6%, 15 years) | $2,110 | $25,320 |
| Savings | −$4,124/month | −$49,488/year |
The judge can confirm this plan over the lender’s objection. Chapter 12 is the only bankruptcy chapter where the debtor proposes the plan, and no creditor vote is required for confirmation. That’s leverage you don’t have anywhere else. Chapter 12 also allows seasonal payment structures — payments timed to when income actually arrives — and Section 1232 tax treatment that can convert capital gains on asset sales within bankruptcy into dischargeable unsecured debt. We covered in depth earlier how Section 1232 changes the calculus for farm families considering Chapter 12 — the short version is that a $285,600 IRS bill on a typical Wisconsin farm sale can drop to $57,120 in Chapter 12, saving the family $228,480.
To qualify, total debts can’t exceed $12,562,250 — the current ceiling per U.S. Courts, reflecting the April 2025 triennial adjustment — at least 50% must arise from farming operations, and you need “regular annual income,” which includes milk checks, crop sales, and government payments. But the AFBF flagged a catch that matters: if most of your household income comes from off-farm employment, you may not qualify for Chapter 12 at all, which means “many families may face the even more difficult decision to sell land, limit production or close their farm altogether”.
So, How Many Chapter 12 Plans Actually Make It?
Most ag publications will tell you Chapter 12 “saves farms.” And it can. But the completion data tells a more complicated story—and how you read it depends on which dataset you trust.

The Association of Chapter 12 Trustees surveyed members covering approximately 15% of all national Chapter 12 cases filed from 2011 to 2013. The completion rate for confirmed plans: 53.5% in 2011, 62.2% in 2012, and 63.9% in 2013, averaging 59.4%. A follow-up survey in 2019, covering 33 trustees, produced a nearly identical average: 59.6%. The AFBF noted that Chapter 12 typically has “the highest percentage of successfully completed cases of the reorganization chapters” — far above Chapter 11’s completion rate of roughly 15% or less.
That’s the national picture. The state-level picture can look very different.
David Warfield, an attorney in Thompson Coburn’s Financial Restructuring practice, analyzed all 168 Chapter 12 cases filed in Missouri between 2000 and 2020. Only 64 — or 38.1% — reached full discharge, meaning the debtor completed the entire repayment plan and emerged on the other side. Of the 135 plans confirmed by a judge, 28 remained pending as of the study’s March 2022 data cutoff. Among the 107 confirmed cases that had fully closed, 43 defaulted and were dismissed or converted to Chapter 7 — a post-confirmation failure rate of 40.1%. Warfield compared Missouri’s outcomes to nationwide data from the Executive Office of the U.S. Trustee covering fiscal years 2009–2014, which showed a 41.9% discharge rate.
| Data Source | Completed/Discharged | Dismissed/Converted/Pending |
|---|---|---|
| National Trustee Surveys (2011–2019) | 59.6% | 40.4% |
| Missouri 20-Year Study (2000–2020) | 38.1% | 61.9% |
So the honest range: somewhere between 38% and 60%, depending on the dataset, the time period, and the state. The AFBF makes a fair point that not every dismissal is a failure — some cases end in a negotiated outcome that works for both the farmer and the creditors, but gets counted as a “non-completion” in the stats.
But here’s what matters for your decision: somewhere between 4 and 6 out of every 10 families who file Chapter 12 and have a plan confirmed will make it all the way through. The rest won’t. Chapter 12 is a real tool with real power — cramdown alone can reduce your annual debt service by tens of thousands of dollars. It’s also a three-to-five-year commitment with a meaningful failure rate even after confirmation. Go in with your eyes open.
Kooser Farms sits on both sides of that ledger. Their first plan took four years to confirm and failed within six months. Their second plan was confirmed on February 9, 2026. Whether it holds is an open question — and the structural risk of annual crop income versus the monthly milk check they gave up hasn’t changed.
The Conversation That Doesn’t Happen
The math is only half of what lands at that kitchen table.
Farmers die by suicide at significantly elevated rates. The commonly cited figure — 3.5 times the general population — comes from CDC analyses of farming occupations, though the specific multiplier varies by study, region, and time period. Illinois Agriculture Director Jerry Costello stated the 3.5× figure in late 2025. While the exact ratio depends on which dataset you use, the direction isn’t in dispute: farming is among the highest-risk occupations for suicide in the United States. Financial distress is one of the strongest predictors.
And the culture of “tough it out” — the same grit that gets you through calving at 3 a.m. — becomes a liability when it keeps someone from picking up the phone. We’ve written before about how financial stress and isolation compound each other on family farms — that piece is a playbook for what neighbours can do when they see the barn lights burning late.
If you or someone you know is in that space right now, write these down:
- 988 Suicide & Crisis Lifeline — dial 988, 24/7. Confidential.
- Farm Aid Hotline — 1-800-FARM-AID (1-800-327-6243). Farm-savvy people who understand debt, foreclosure, and the weight of it.
- Crisis Text Line — text HOME to 741741.
- AFBF Farm State of Mind — fb.org/land/fsom for state-by-state counseling directories.
Making that call is the same kind of stewardship we’ve been talking about with Chapter 12 — acting while you still can.
Four Paths — and Why the First One Starts Tonight
Every one of the 315 families who filed in 2025 landed on some version of these paths. Where you go depends on your three numbers.
Path 1: Run the diagnostic and get ahead of it. This is your 30-day action. Calculate your three numbers this week. Write them on paper — not in your head, on paper. Show them to someone outside the family: your accountant, Extension agent, or lender. If two of three are yellow or red, book a consultation with an agricultural attorney experienced in Chapter 12. That first meeting commits you to nothing. It gives you information while choices still exist.
Path 2: Strategic Chapter 12 filing while equity remains. This works when debt-to-asset is in the 55–70% range, you have three or more months of cash, and the operation can pencil after restructuring. Cramdown, seasonal payments, and Section 1232 are powerful tools — but only if the underlying business works at realistic prices and honest production costs. The data is a gut check — nationally, about six in ten confirmed plans reach completion, but in some states, the number drops closer to four in ten. Filing creates a public court record, requires strict compliance for three to five years, and incurs legal fees well into five figures. Filing early isn’t a defeat. It’s not a guarantee, either.
Path 3: Restructure without court. If your lender relationship is strong and your situation reads more yellow than red, out-of-court refinancing — extending terms, selling non-core assets, renegotiating rates — may bridge the gap. The risk: these fixes often treat symptoms without addressing structural margin problems, and they consume the equity and time you’d need if Chapter 12 becomes necessary later. The long-term consolidation trajectory projects U.S. dairy farms shrinking from roughly 25,000 herds today to 15,000–16,000 by 2035 — restructuring without fixing the structural problem just delays your position on that curve.
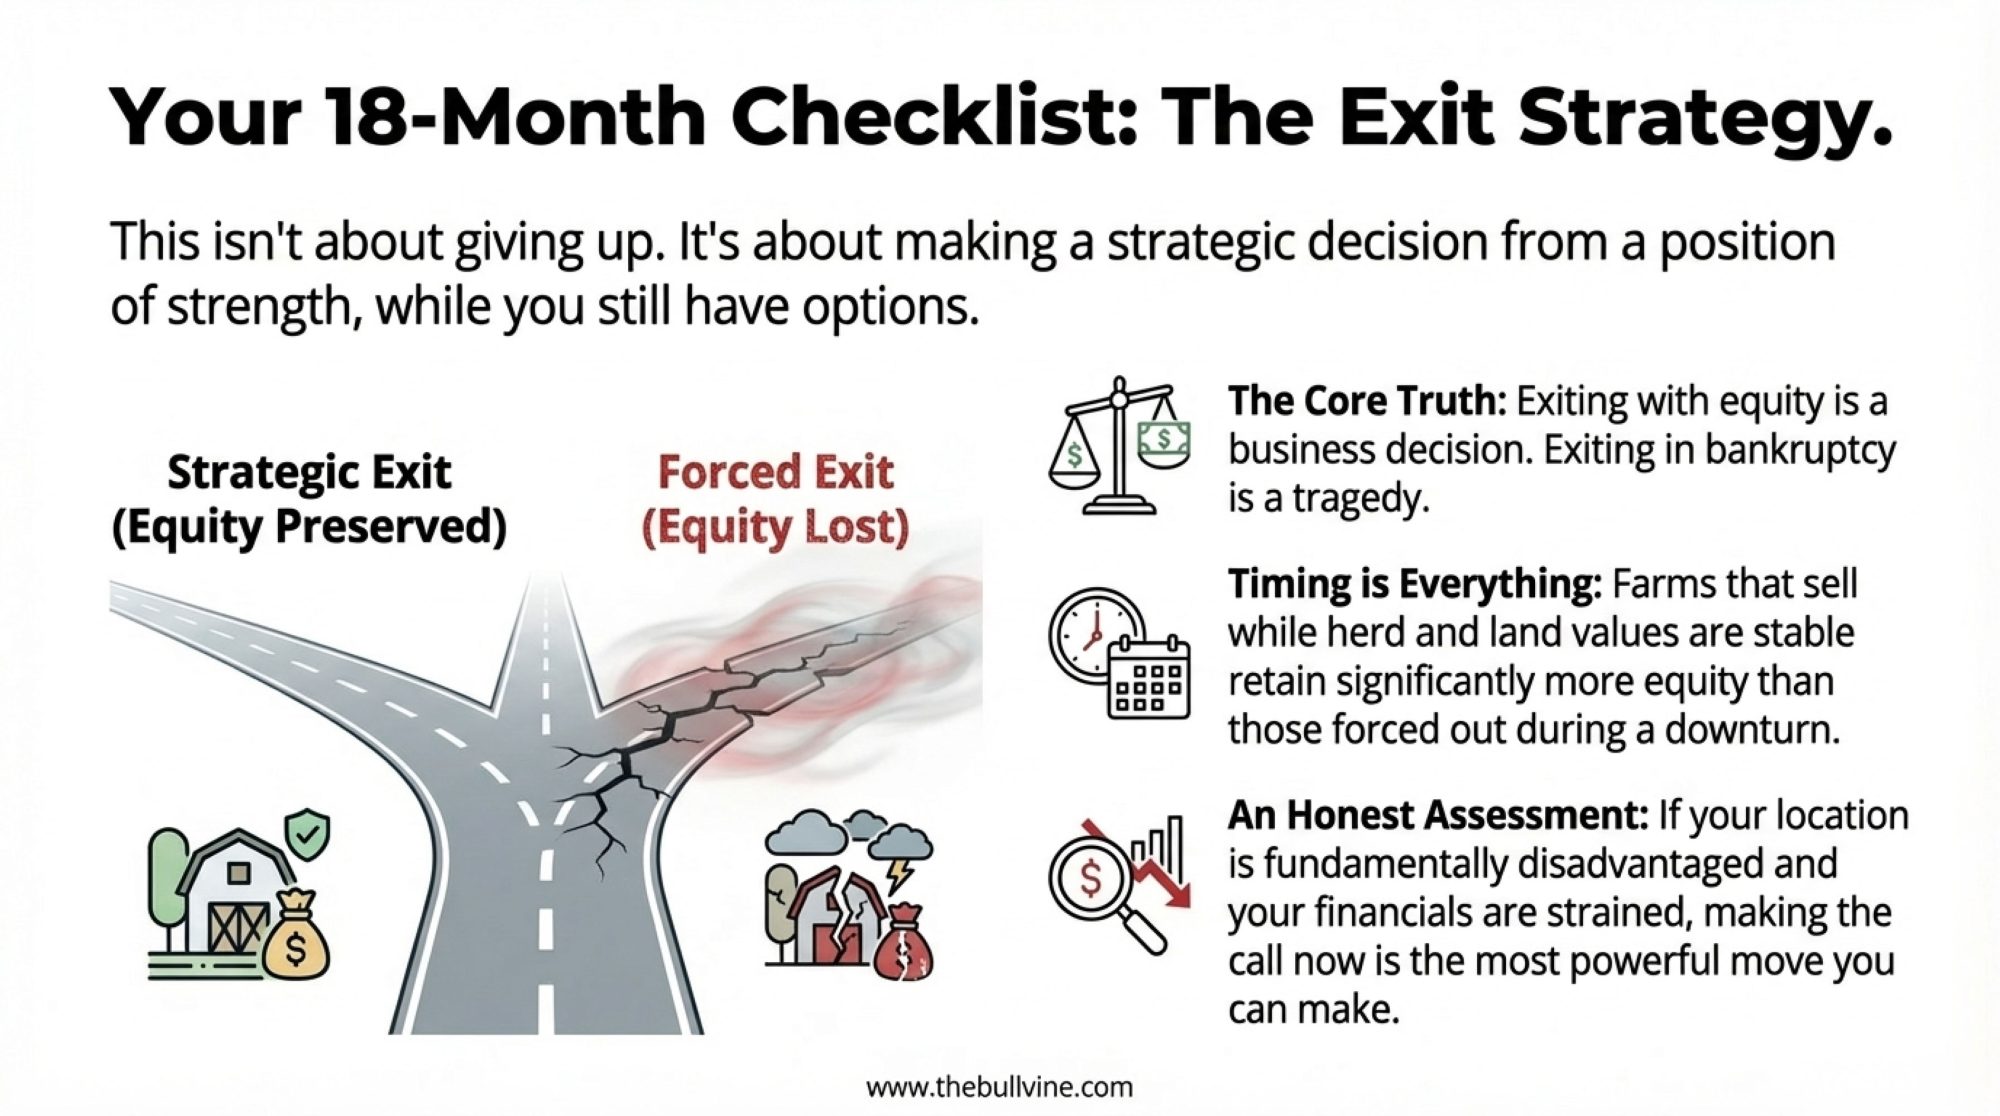
Path 4: Planned exit with equity intact. For some families, the honest answer is that the operation won’t pencil out at any reasonable scale—or that the next generation has already chosen a different life. Exiting on your terms while equity still exists preserves assets for whatever comes next. A planned exit at 55% debt-to-asset looks nothing like a forced liquidation at 85%.
And the Kooser record carries a specific caution for Paths 3 and 4: pivoting to a completely different enterprise — crops, beef, agritourism — isn’t an exit from financial risk. It’s a swap. Kooser Farms traded a monthly milk check for an annual crop harvest, and when weather destroyed that harvest across multiple seasons, the debt caught up faster the second time. A September 2019 Post-Gazette report documented the farm’s ambitions for diversification. Six years later, the operation is in a courtroom for the second time, having diversified entirely away from dairy.

Key Takeaways
- If your debt-to-asset ratio is above 60%, your real breakeven exceeds your milk check, and you have less than three months of cash, two of three red flags for 12 months or more mean it’s time to understand Chapter 12 before you need it. Use the diagnostic table above.
- If you’ve been covering the gap between income and true costs with working capital or a stretched operating line since 2023–2024, the filing clock is already ticking — those 315 families didn’t get in trouble last month.
- Compare your total cost — including unpaid family hours at $18–22/hr — to Cornell’s $26.03/cwt for herds under 500 cows. If you’re above it and your milk check sits below $22, the gap is structural.
- Nationally, about 60% of confirmed Chapter 12 plans reach completion; in Missouri’s 20-year dataset, it’s 38.1%. The tool works. Not every time.
- If most of your household income is off-farm, Chapter 12 may not be available to you, which makes running the diagnostic even more urgent.
- If the conversation at your kitchen table has shifted from “how do we make this work” to something darker, 988and 1-800-FARM-AID are confidential, farm-literate, and available right now.
- Thinking about pivoting out of dairy? The Kooser record is public. Swapping enterprises swaps risks. Monthly milk checks are frustrating. Annual crop income is a cliff.
The Bottom Line
Pull your last three milk statements and your most recent balance sheet tonight. Calculate your debt-to-asset ratio. Run your real breakeven — including the hours your spouse works that you’ve never assigned a dollar figure. Count your months of cash.
Write those three numbers down. If you don’t like what you see, a call to an ag attorney this week gives you information. The call 18 months from now costs everything.
On February 9, Judge Taddonio confirmed Kooser Farms’ second restructuring plan. Whether it holds is an open question — the plan still has to survive three to five years of execution in an agricultural economy that has already broken it once. The structural risk hasn’t changed: Kooser Farms left dairy for crops, traded a monthly check for an annual harvest, and faces the same weather-dependent income risk that contributed to the first plan’s failure. In 60 days, The Bullvine will report on whether the early milestones are holding. This is The Filing — a new series tracking named Chapter 12 cases from petition to resolution. Courts are public record. The outcomes deserve to be, too.
Complete references and supporting documentation are available upon request by contacting the editorial team at editor@thebullvine.com.
Learn More
- Why 150 Well-Managed Cows Beat 500 Poorly-Run Ones by $100,000 – Exposes why chasing scale often kills profit and reveals the specific management benchmarks that allow smaller, elite-managed herds to outearn mega-dairies by six figures. Arms you with the efficiency metrics to stop bleeding cash Monday morning.
- The Bullvine Dairy Curve: 15,000 U.S. Farms by 2035 and Under 10,000 by 2050 — Who’s Still Milking? – Breaks down the inevitable consolidation timeline and delivers the structural survival guide you need to position your operation for the next decade. Gain the foresight to choose your place on the curve before the market chooses for you.
- $1.6B to Texas and Kansas, 76% of Wisconsin Farms Gone: Scale Up, Go Premium or Get Out – Reveals the massive regional shifts and high-margin “Premium” models disrupting traditional dairy markets. Discover how to leverage genetic and marketing innovations to escape the commodity trap and secure your farm’s future in a consolidating industry.
 The Sunday Read Dairy Professionals Don’t Skip.
 The Sunday Read Dairy Professionals Don’t Skip.
Every week, thousands of producers, breeders, and industry insiders open Bullvine Weekly for genetics insights, market shifts, and profit strategies they won’t find anywhere else. One email. Five minutes. Smarter decisions all week.