Your antibiotics aren’t failing. The bacteria are hiding—in fortresses 1,000x stronger than the treatment you’re using. Here’s how farmers are finally winning.
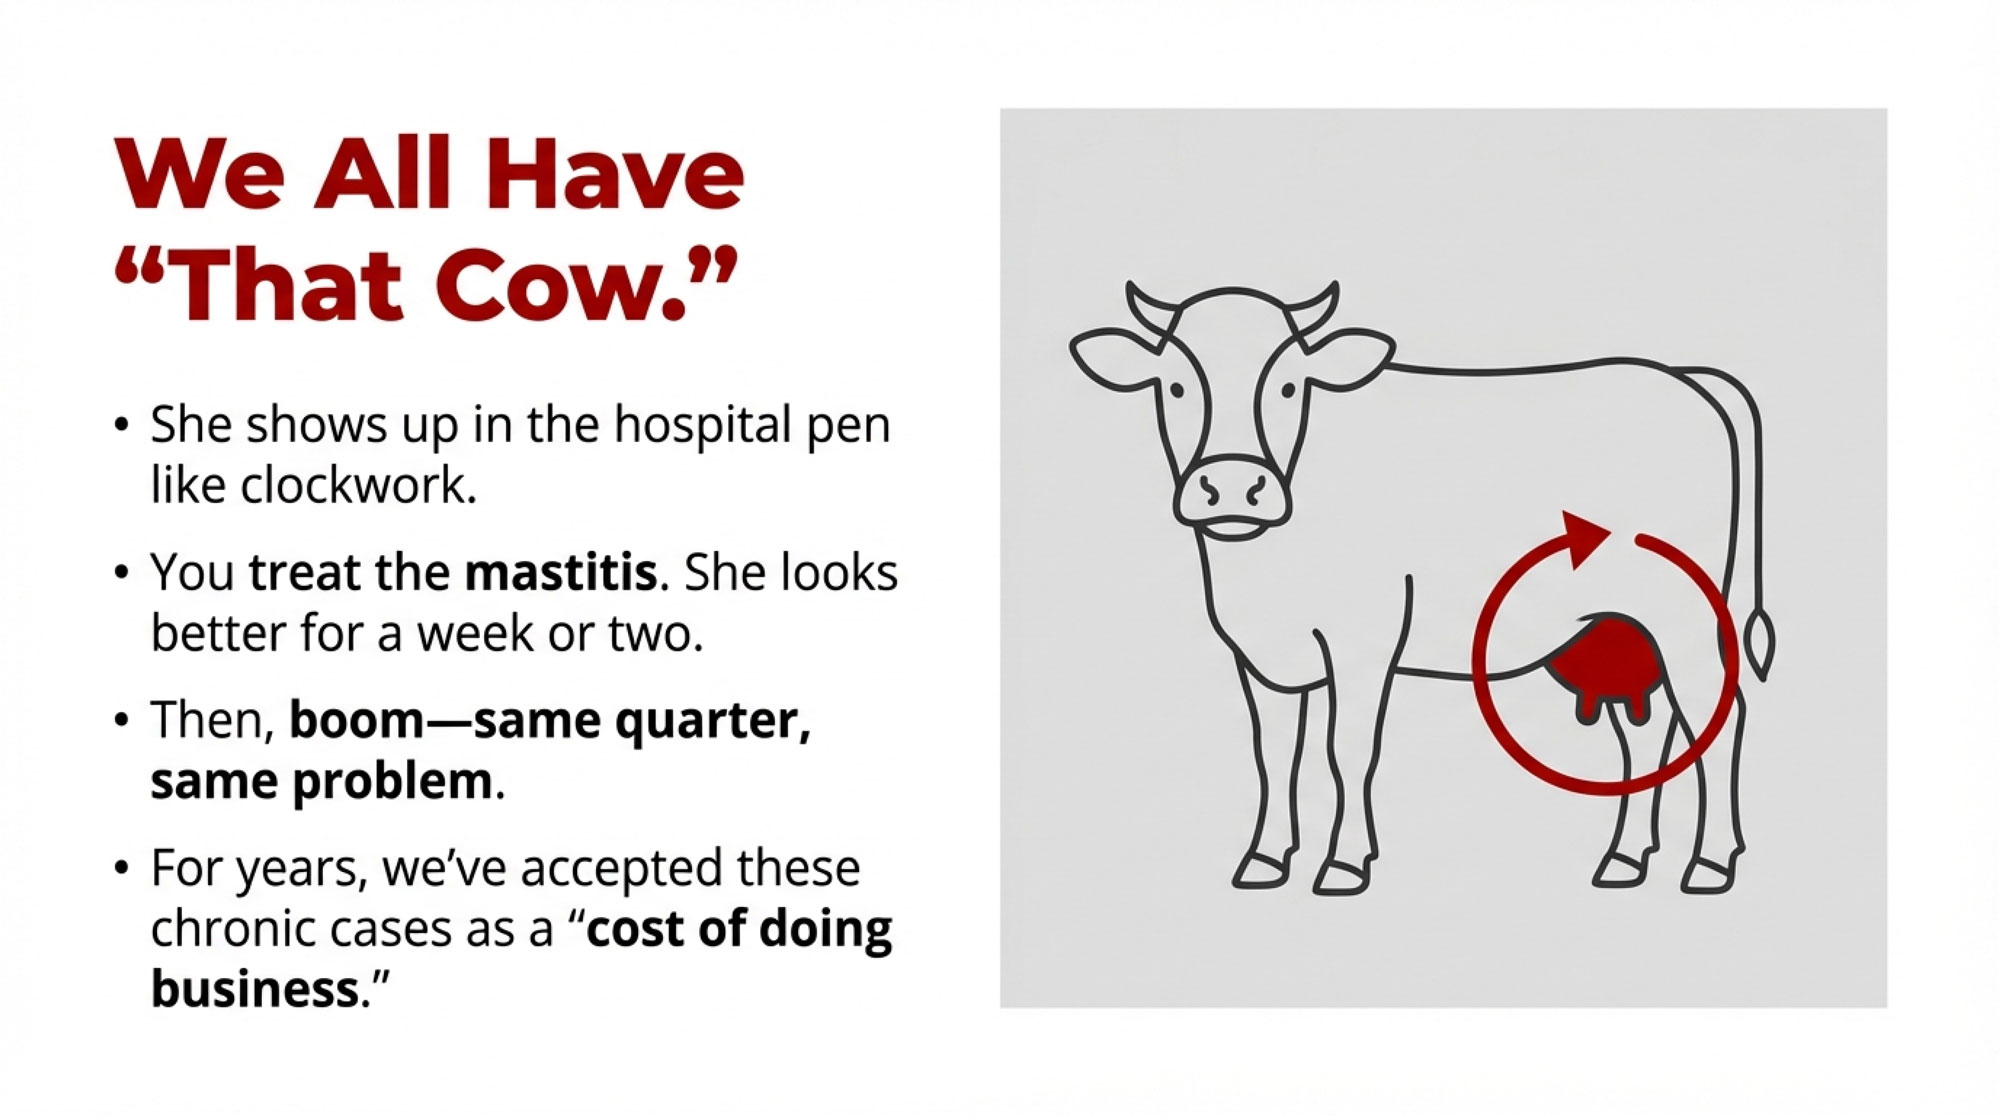
You know that cow that keeps showing up in your hospital pen? The one where you treat the mastitis, she looks better for a week or two, then boom—same quarter, same problem.
We’ve all got them. And we’ve all accepted them as part of doing business.
But here’s what’s changing: More operations are reporting dramatically fewer of these chronic cases. Some, like Trevor Nutcher’s California dairy, haven’t used a mastitis tube in months since switching protocols. “We haven’t used a mastitis tube since switching to AHV,” Nutcher says, and the surprise in his voice tells you everything.
What’s happening isn’t just a matter of tweaking protocol. It’s a complete rethinking of why some cows become permanent residents in the hospital pen.
The Science Behind Those Repeat Offenders
The frustrating reality of chronic mastitis finally has a biological explanation that makes sense.
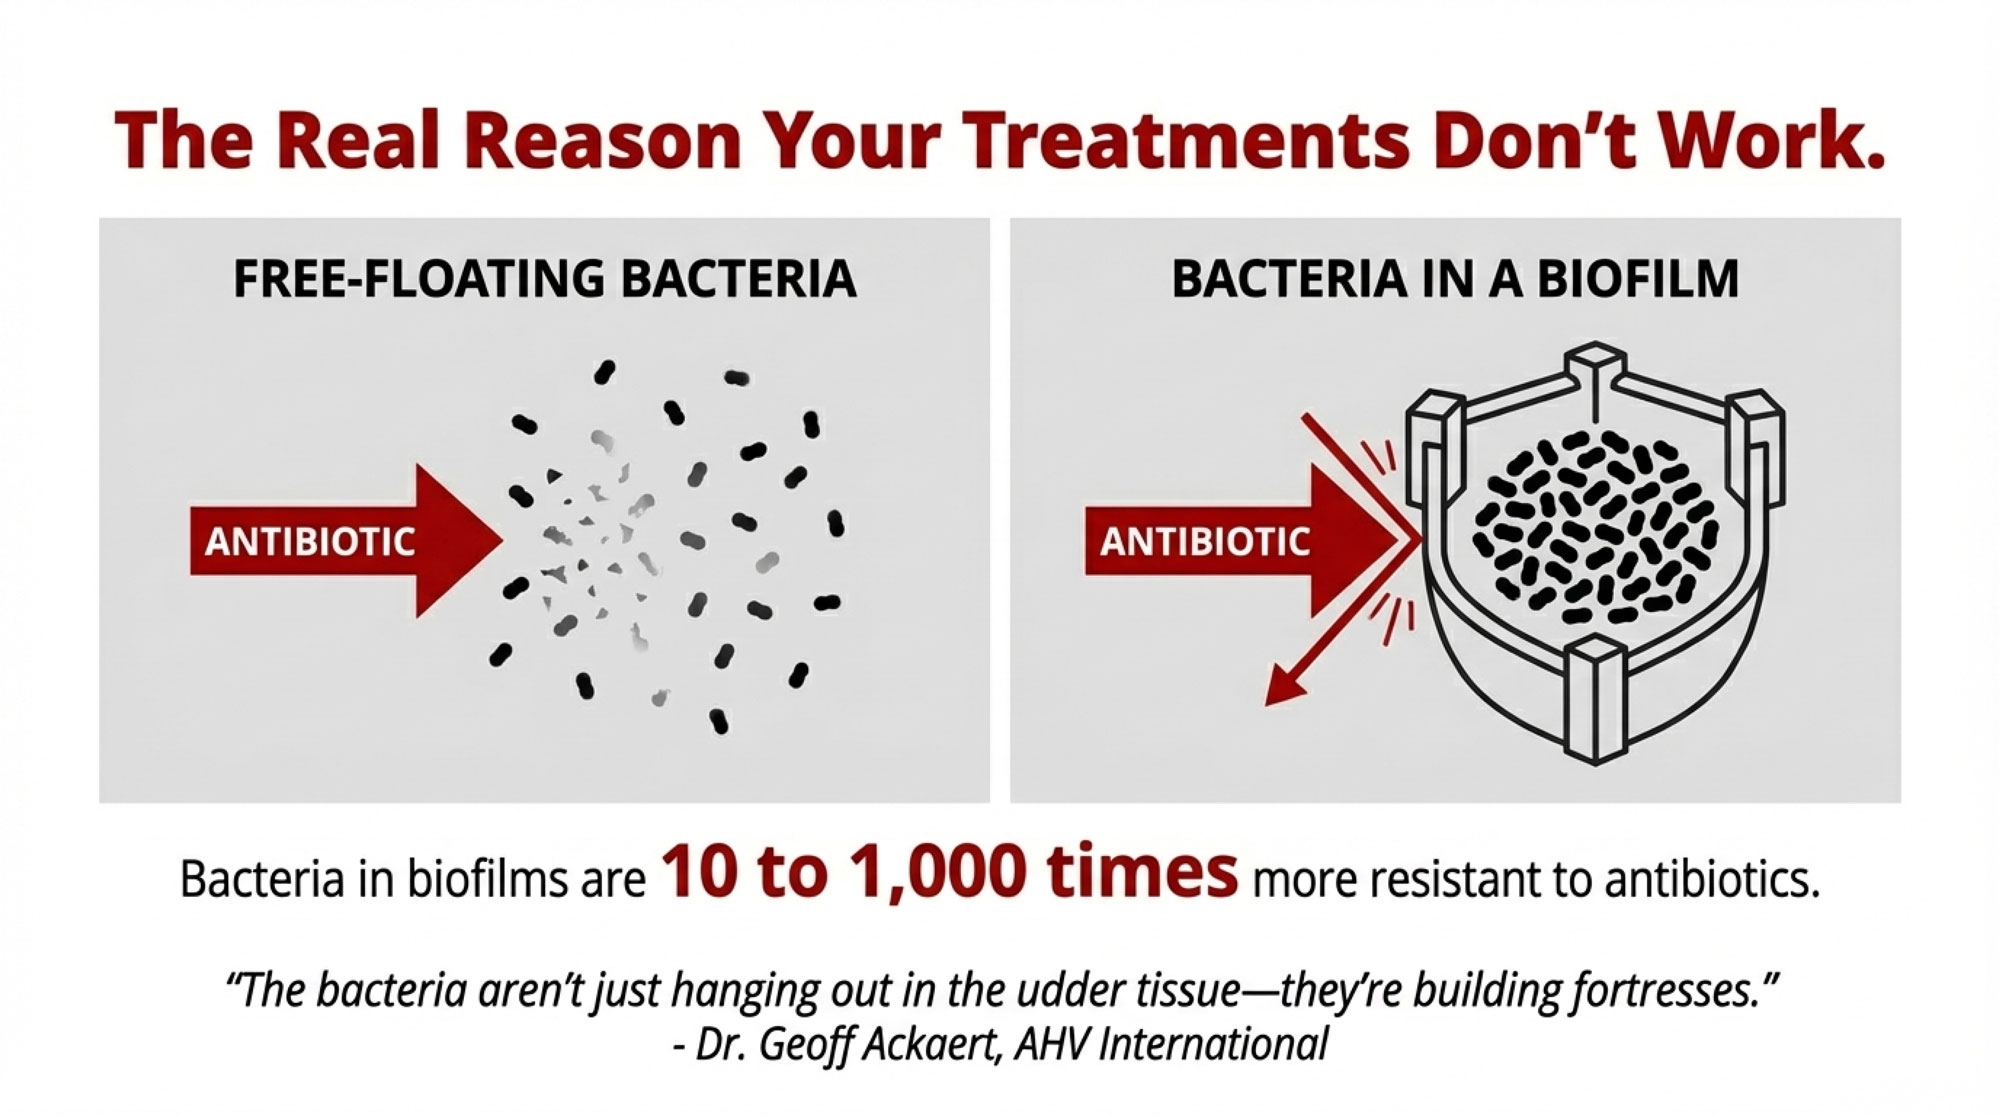
According to field trial data from AHV International’s research team, bacteria living in biofilms can be 10 to 1,000 times more resistant to antibiotics than the same bacteria floating free.
Dr. Geoff Ackaert, their technical director, puts it in terms we can all understand: “The bacteria aren’t just hanging out in the udder tissue—they’re building fortresses.”
Think about the difference between hosing fresh manure off concrete versus trying to clean it after it’s been baked on for a week. Same bacteria, completely different challenge.
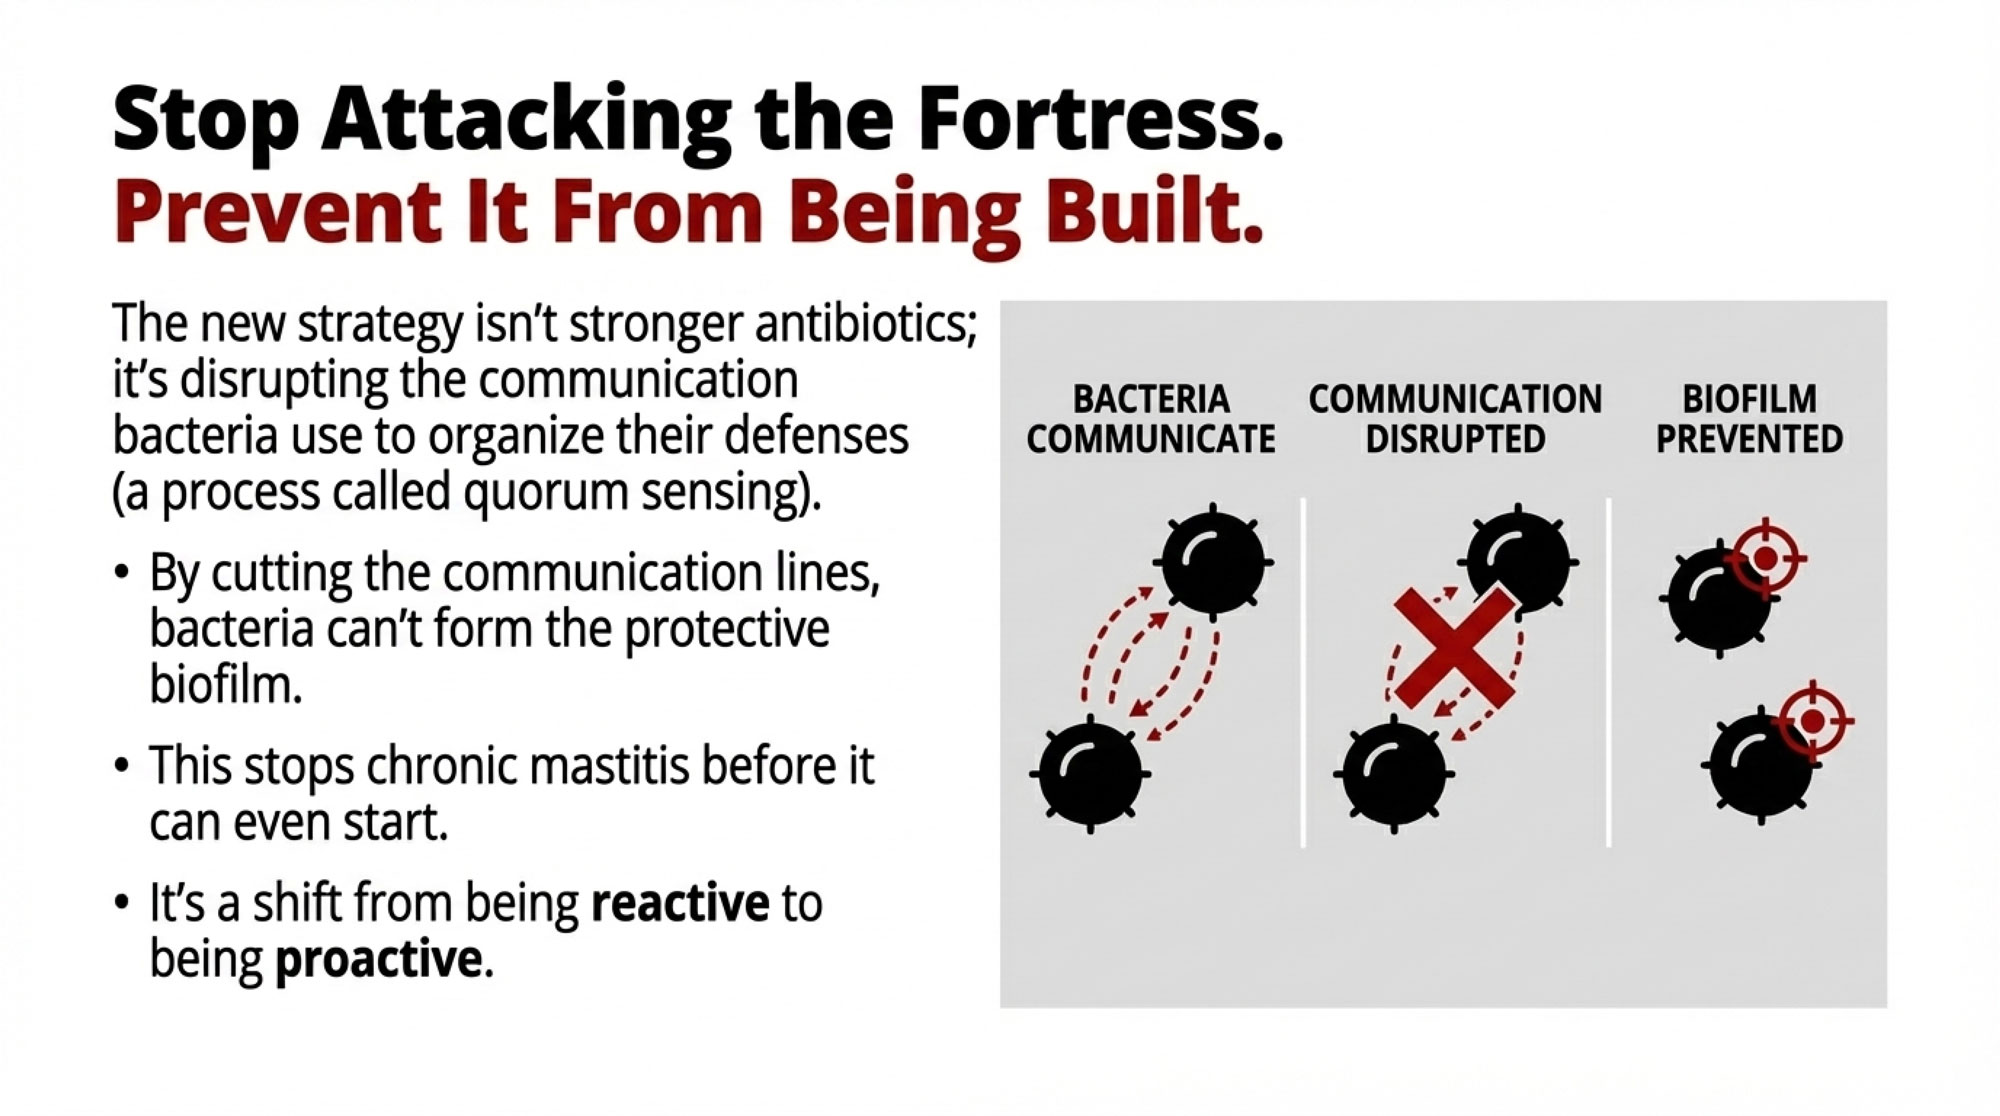
Rather than developing stronger antibiotics—which only lead to more resistance—researchers are now focusing on preventing biofilms from forming in the first place. They’re disrupting a process called quorum sensing, essentially cutting the communication lines bacteria use before they can organize their defenses.
The Results Farmers Are Actually Seeing
What’s compelling about biofilm prevention isn’t the science alone—it’s what’s happening on farms that have made the switch.

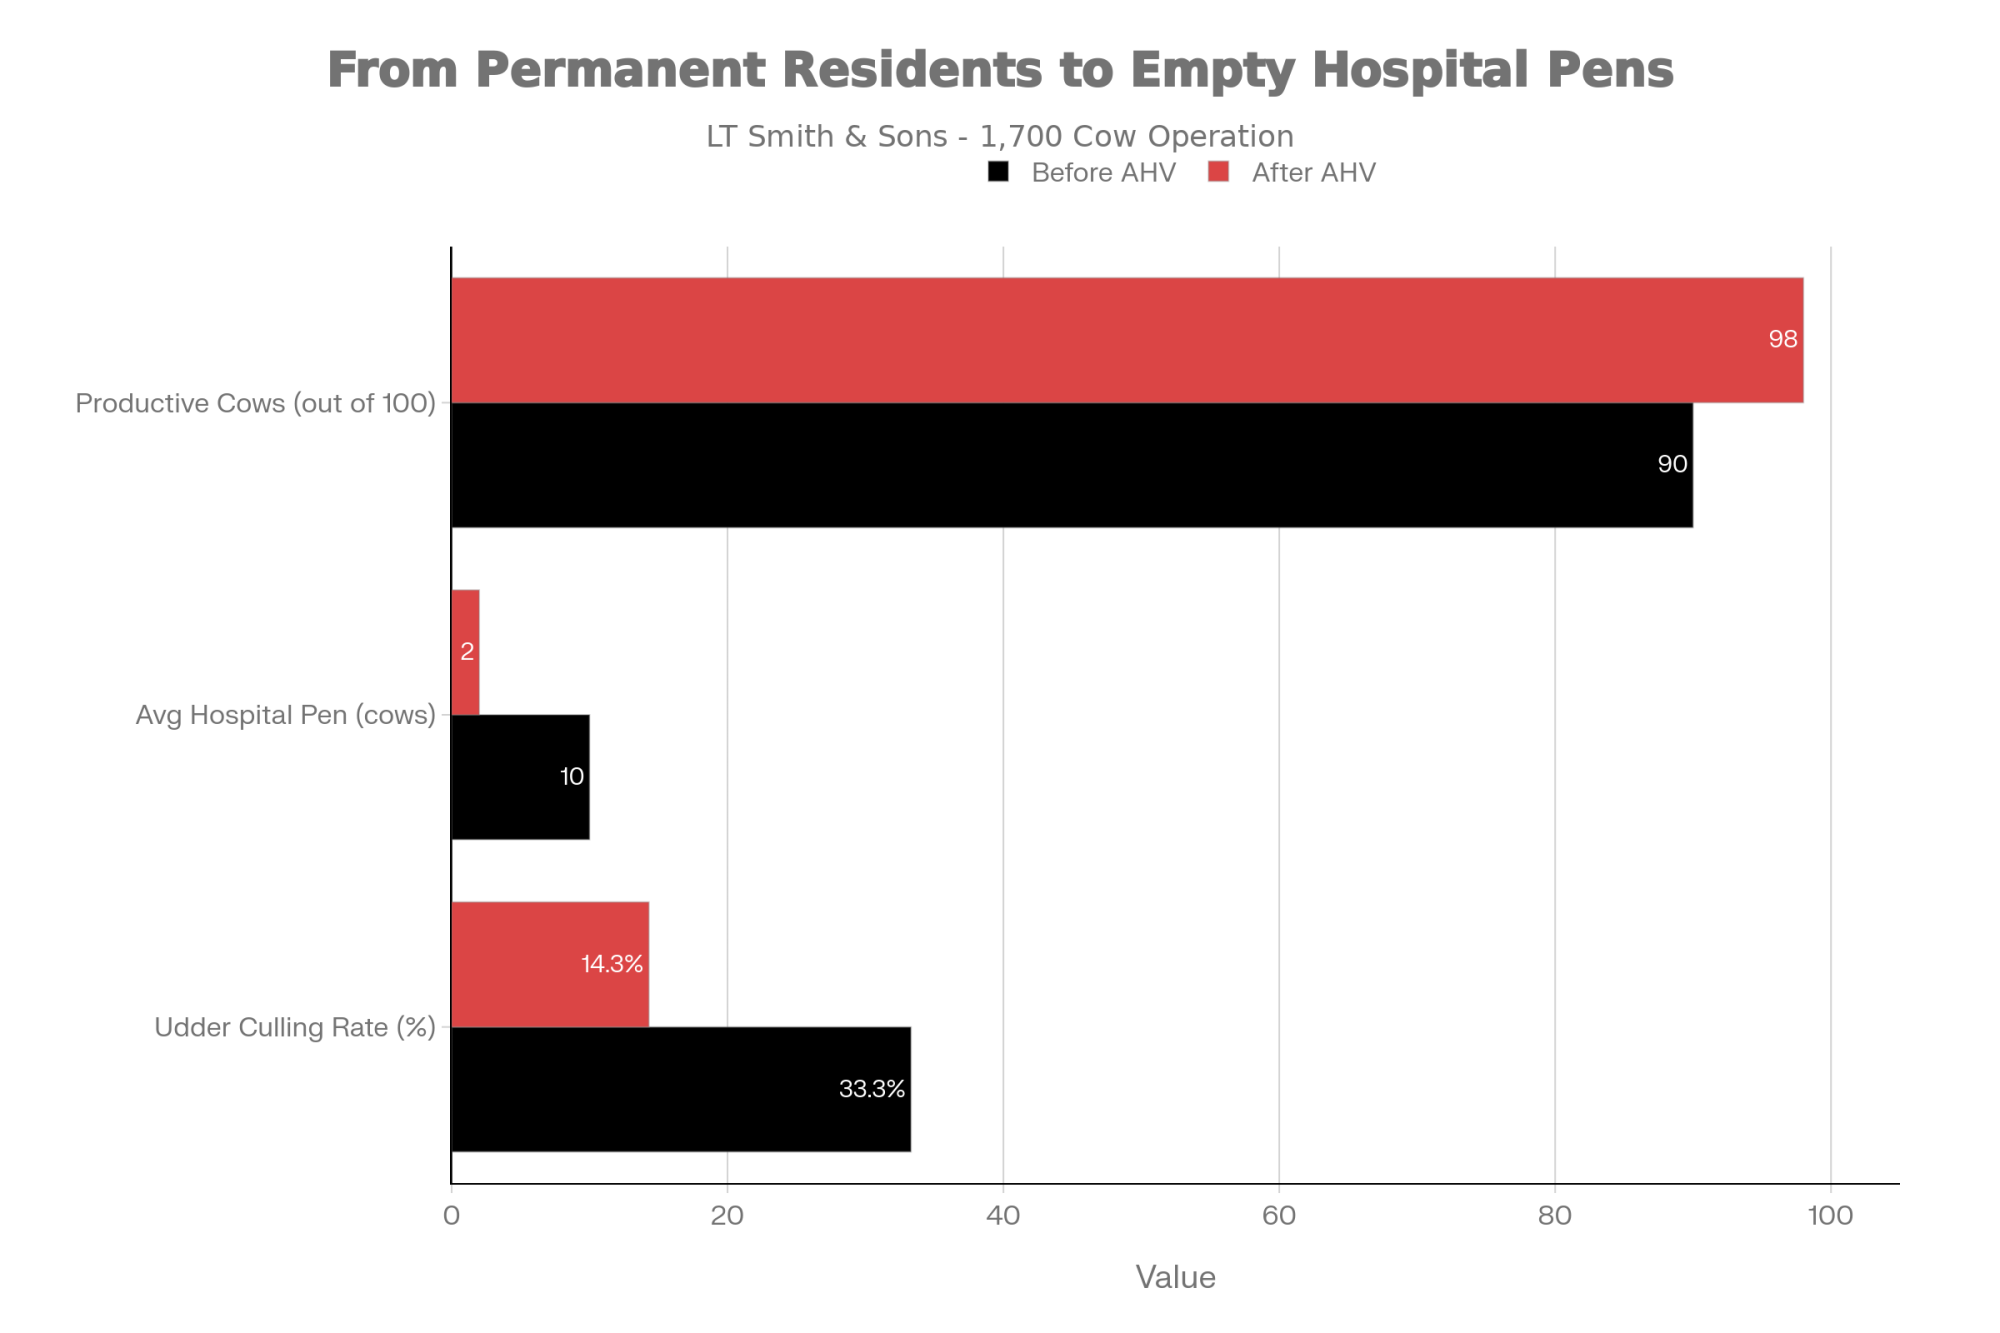
Peter Smith from LT Smith & Sons saw his udder health culling drop from one-in-three to one-in-seven after implementing AHV’s biofilm prevention protocols. That’s a dramatic shift in how many cows stay productive versus getting shipped early.
“Our udder health culling went from one-in-three to one-in-seven. Come back in 5 years, and I’m extremely confident we’ll still be using these protocols.” – Peter Smith, LT Smith & Sons
And then there’s Nutcher’s experience—no mastitis tubes at all since the protocol change. His hospital pen, which used to have a rotating cast of chronic cases, now sits empty most days.
These aren’t isolated examples. Across AHV’s field trials, farms implementing biofilm prevention protocols are reporting significant reductions in chronic mastitis recurrence.
Why Farmers Are Taking Notice: The Economics
So let’s talk about what really matters—the numbers.
For a typical 100-cow operation, based on data from multiple AHV field trials, here’s how it breaks down:
| Metric | Traditional Antibiotic Tubes | Biofilm Prevention Protocol |
| Upfront Cost (per cow) | $26.71 | $54.02 |
| Milk Withdrawal | 4–10 days (Discarded) | 0 days (Saleable) |
| Labor Requirement | High (Daily sorting/stripping) | Low (Reduced handling) |
| Chronic Recurrence | Common (“Repeat Offenders”) | Rare (Fortress disrupted) |
| Annual Net Return | Baseline | +$26,764 per 100 cows |
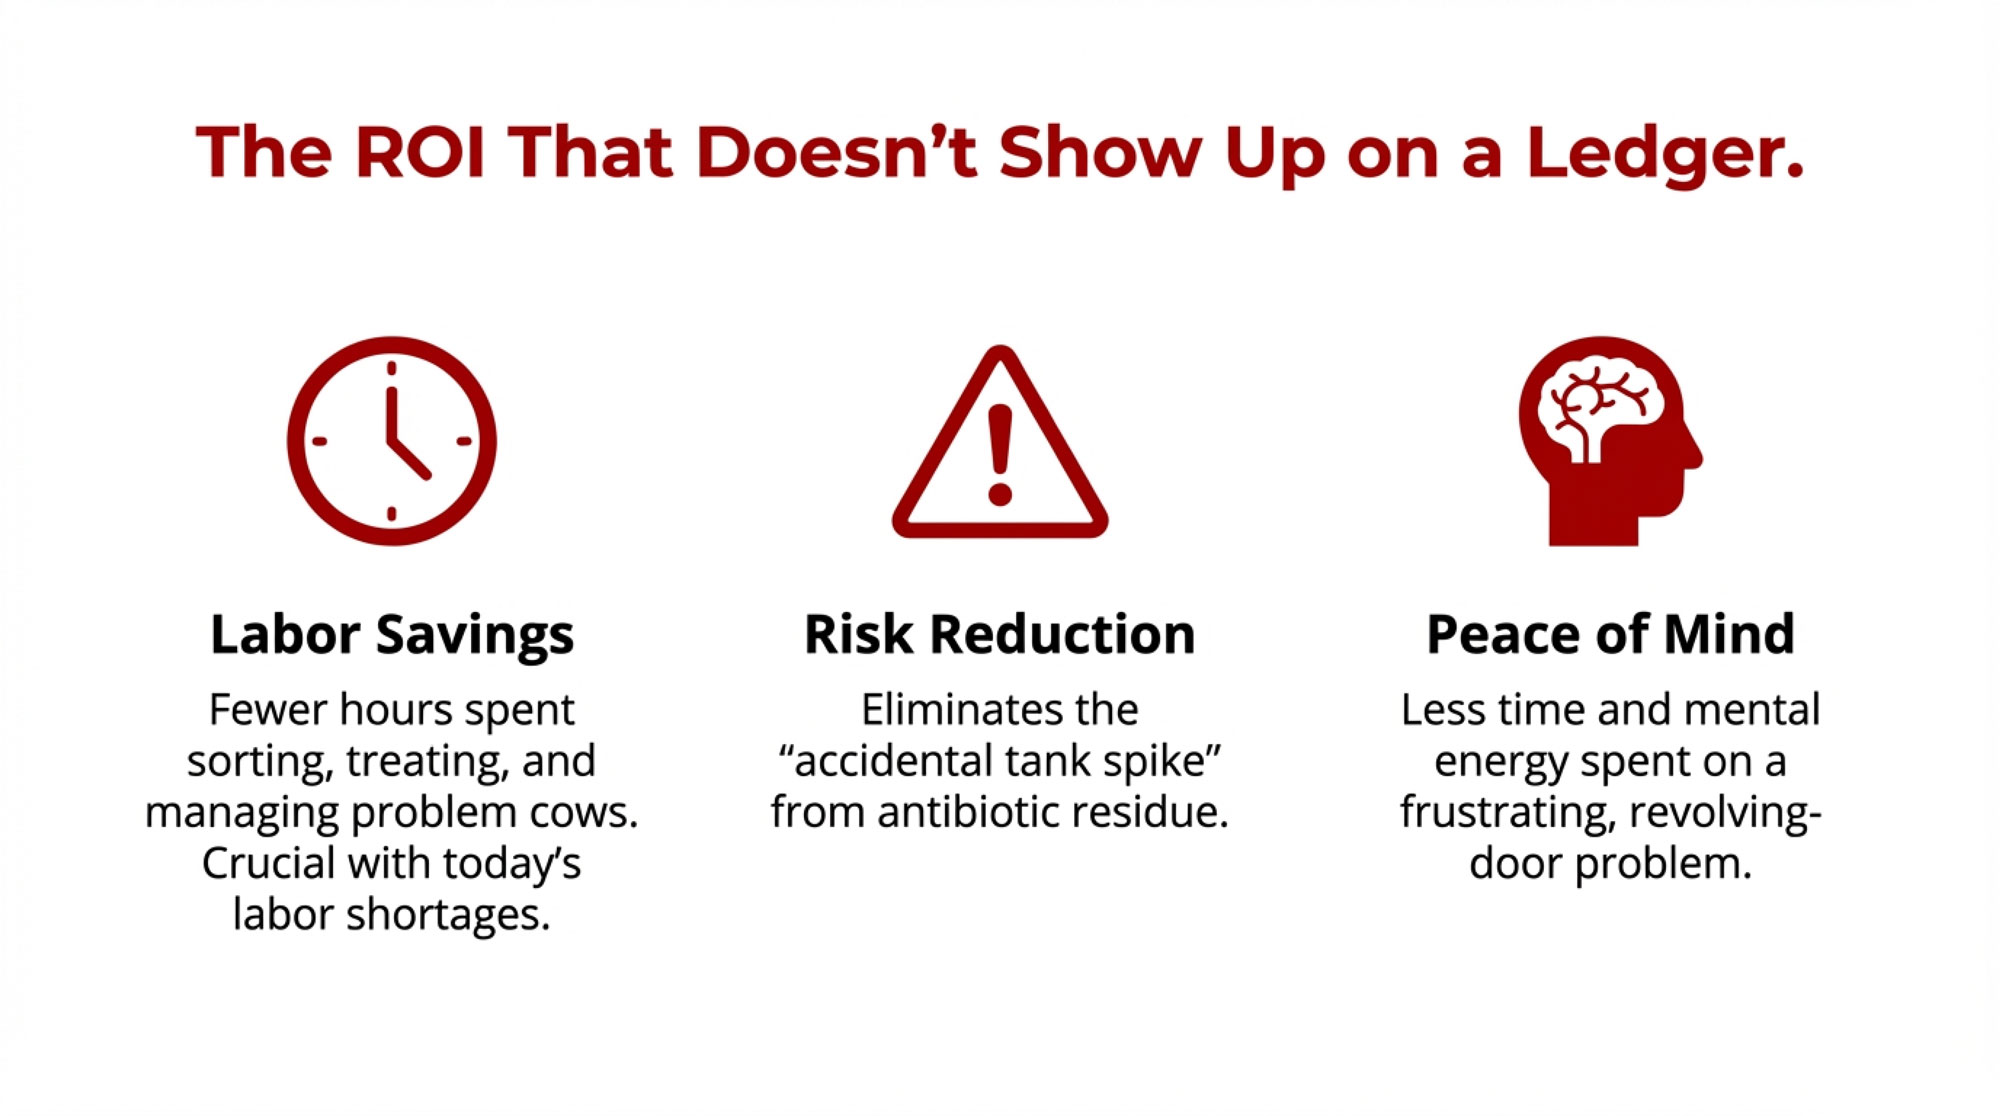
The “Hidden” ROI: Labor and Peace of Mind
Beyond the milk checks, consider the labor savings that don’t always show up on a ledger: fewer hours spent hauling stubborn cows to the hospital pen, zero time spent scrubbing antibiotic residue out of lines, and the elimination of the “accidental tank spike” risk. Farmers are currently struggling with labor more than almost anything else; a protocol that keeps cows in the main line is a protocol that saves man-hours.
Based on field trial calculations from AHV’s economic analysis (assuming milk prices around $20/cwt):
- Additional milk revenue from 5.5-pound daily gain: $20,075 annually
- Treatment cost reductions: $5,988 saved
- Eliminated withdrawal losses: $982 recovered
- Improved reproductive performance: $2,450 value
Conservative total benefit: $29,495 Net return after costs: $26,764
Most farms break even within 3-4 months, with year-two returns typically exceeding 200% of the initial investment. Individual results may vary based on baseline health and the quality of implementation. Even if you’re skeptical and cut these projections in half, the math still works.
For larger operations—say 500 cows or more—the dynamics shift even more dramatically. Fixed costs get diluted while benefits compound.
The Dry-Off Question: Where Does Biofilm Prevention Fit?
We need to talk about Selective Dry Cow Therapy (SDCT).
It’s become a cornerstone of industry sustainability efforts, and deservedly so—treating only the quarters that need it at dry-off is a sensible way to reduce antibiotic use. But it’s worth examining how it fits with biofilm prevention.
The consideration worth raising: selective therapy is inherently reactive. It assumes an antibiotic treatment at dry-off will address whatever issues the cow carried through lactation.
But if bacteria are established in biofilms, the treatment may not reach them effectively. As Dr. Ackaert explains, “If you haven’t disrupted the biofilm before she hits the dry pen, that infection may persist through dry-off and re-emerge at freshening when the immune system is under pressure.”
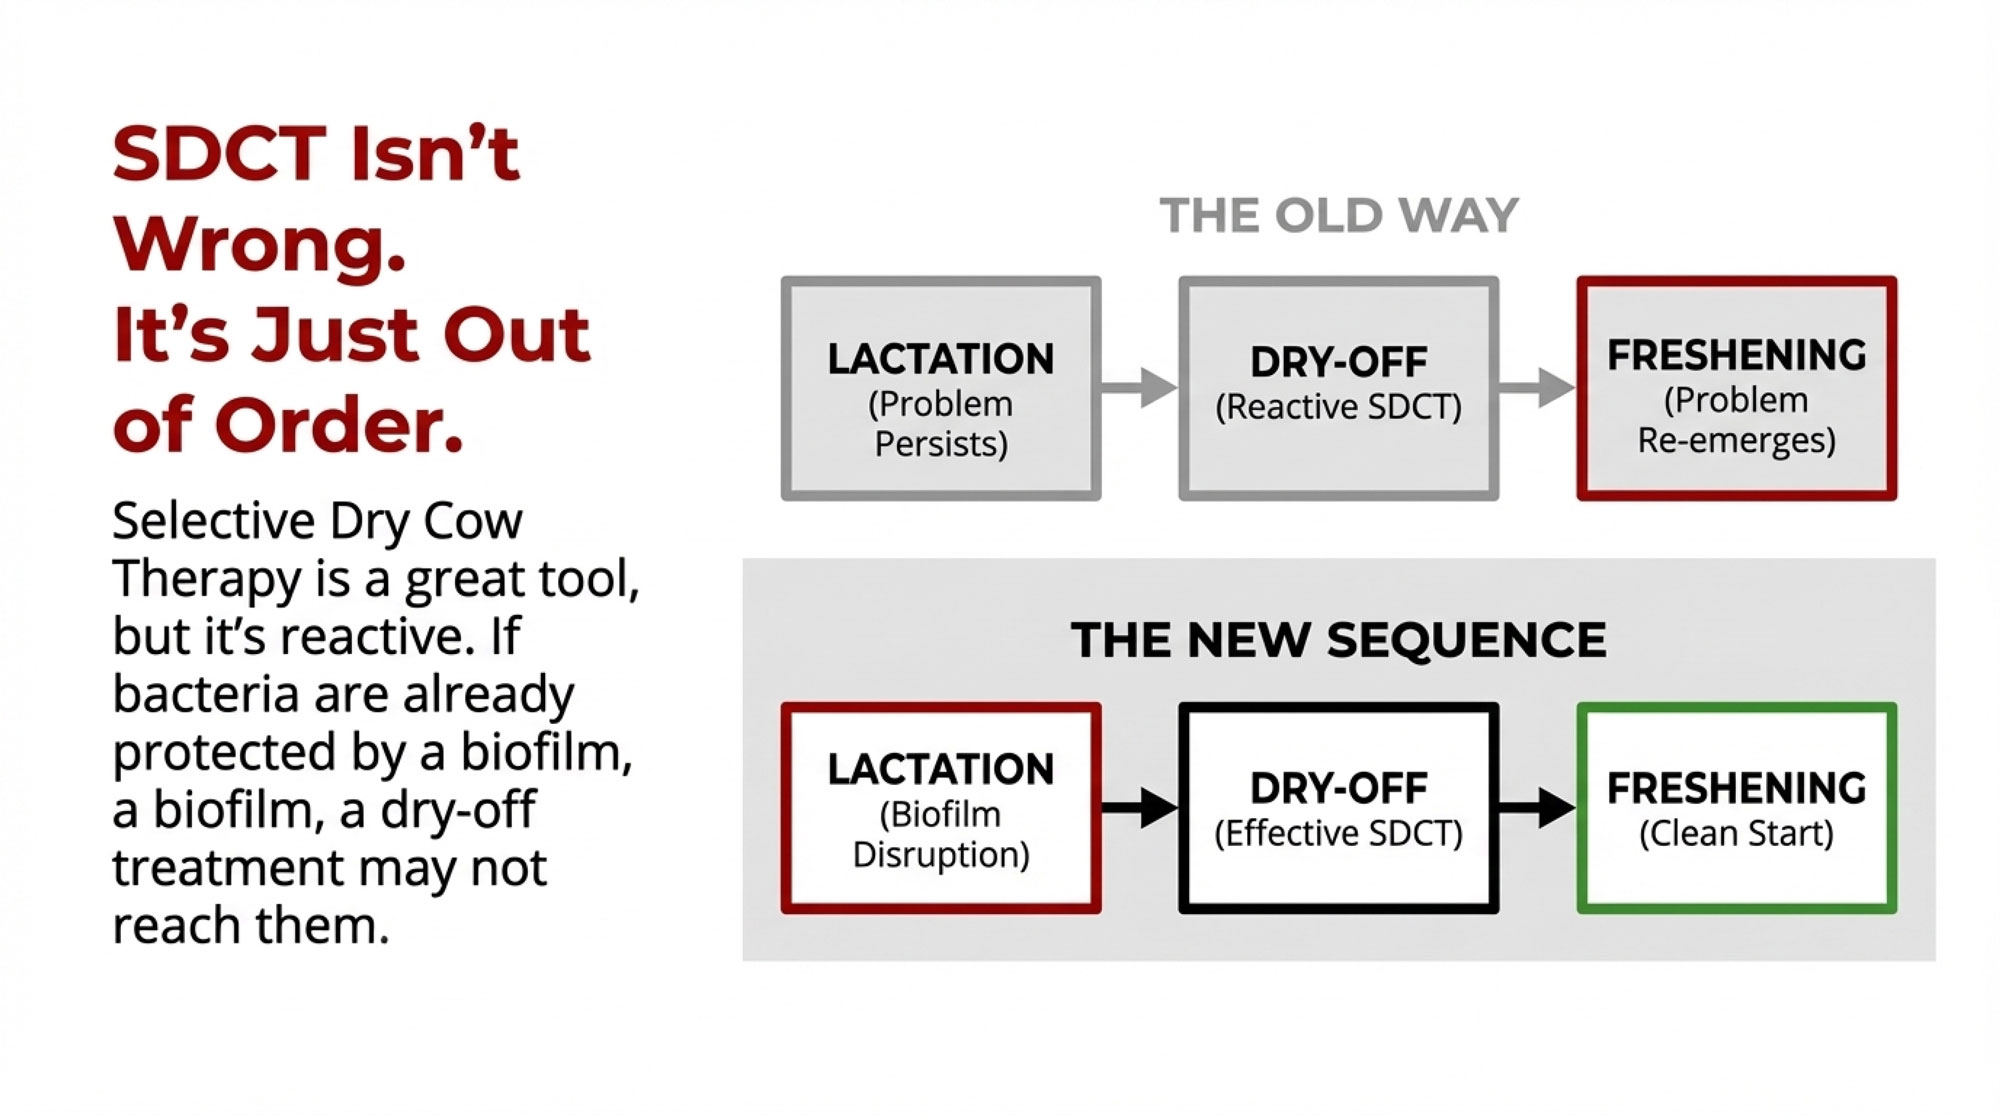
This doesn’t mean SDCT isn’t valuable—it absolutely is. The question is sequencing. Progressive operations are finding that using biofilm disruption during lactation helps ensure the udder is truly clear, making their selective dry cow protocols significantly more effective.
It’s not either/or. It’s getting the order right.
Implementation Realities: Who Sees Results (And Who Doesn’t)
Let’s be honest here—this doesn’t work for everyone.
Based on conversations with producers who’ve made this transition, field observations suggest maybe 5 to 10 percent don’t see these dramatic improvements.
Farms that struggle typically share certain patterns:
- Protocol costs exceed 2-3% of their milk revenue
- They’ve got severe existing problems (over 50 mastitis cases per 100 cows)
- Owner-operators trying to manage everything without dedicated support
- They’re implementing during a crisis rather than preventively
Success seems most likely with:
- Moderate baseline challenges (20-40 cases per 100 cows)
- Systematic health monitoring is already in place
- Accessible technical support
- Veterinary collaboration—or at least neutrality
- Operations of any size, but particularly those with 100+ cows, where fixed costs dilute better
What I find most telling is that it’s less about operational size than about management capacity and timing.
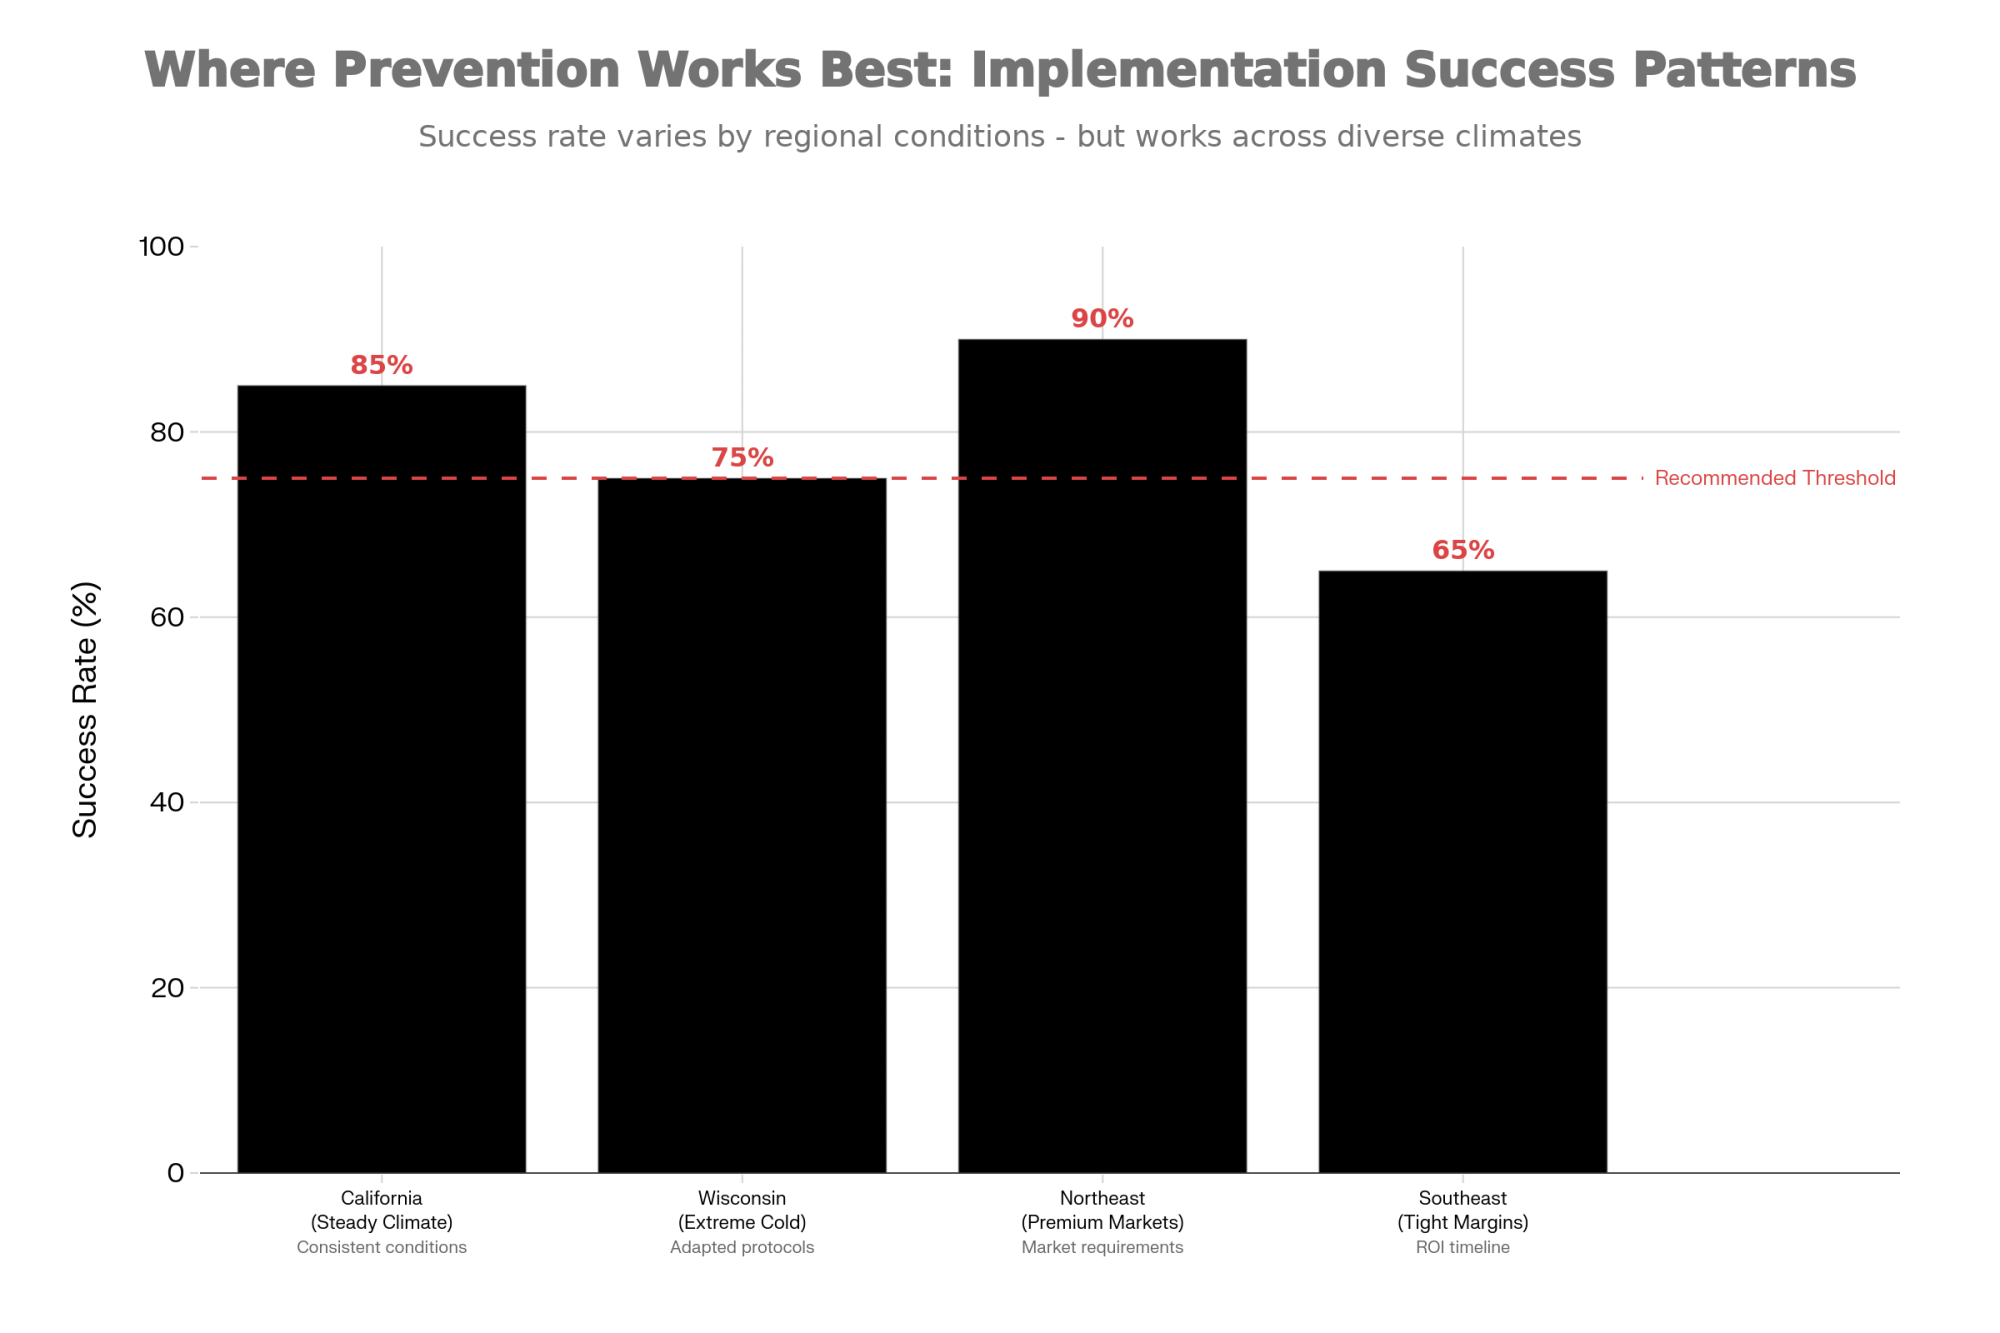
Regional Differences Matter More Than You Think
What works in California doesn’t automatically translate to operations in Wisconsin or Vermont.
A Wisconsin producer dealing with -20°F winters recently told me they had to adjust their protocols significantly. “Those temperature swings hit the immune system differently than California’s steady weather,” he explained. Makes sense when you think about it.
Producers report water quality makes a real difference too—iron content and mineral profiles seem to influence protocol effectiveness, though we’re still documenting the specifics.
Northeast operations serving premium markets face entirely different economics. One Vermont producer shared that their premium contract requirements made the switch almost mandatory. Meanwhile, Southeast producers operating on tighter margins might lack the financial flexibility to make higher upfront investments, even with strong projected returns.
And if you’re export-focused in the West? Antibiotic-free certification is increasingly becoming table stakes for international contracts.
Questions Worth Asking Your Advisor
Before making any protocol changes, here’s what you need to nail down:
- What are your actual baseline costs? Not industry averages—your specific treatment costs per case.
- What measurable improvements would justify this investment? By month six, what would convince you it’s working?
- Is qualified technical assistance available? How does your vet view these approaches?
- How do these protocols compare with other improvements you’re considering?
The Real Implementation Timeline
Based on producer experiences documented in AHV case studies, here’s what to expect:
- Months 1-2: Learning curve. Staff skepticism is normal. Document everything for true baselines.
- Months 3-4: Early indicators emerge. Hospital pen populations might start declining. If you’re seeing nothing by month four, check your implementation.
- Month 6: Decision time. You should see improvement in at least two metrics: mastitis rates, conception rates, and production.
- Month 12: Full economic analysis, including hidden costs. Most producers wish they’d started earlier, though some realize their timing wasn’t right.
Why Environmental Impact Matters to Your Bottom Line
Beyond the economic considerations, a regulatory angle is emerging here as well.
Reduced antibiotic use means less runoff into watersheds. That matters increasingly for permit compliance. Consumer perception, too. Some milk buyers are already asking about antibiotic reduction protocols—and that list is growing.

Sponsored Post
Making the Decision That’s Right for You
Every operation faces unique circumstances.
For dairies with moderate mastitis challenges and reasonable financial flexibility, the documented economics appear compelling. Operations with severe problems or immediate cash flow pressures might need to address fundamentals first.
The key insight? Chronic mastitis isn’t necessarily inevitable. Understanding biofilm-protected bacteria changes how we evaluate every protocol going forward.
Looking Forward
The empty hospital pen is becoming less unusual across the industry.
Whether you’re ready for changes today or still evaluating, recognizing that some of those “permanent” problems might actually be preventable—that opens new possibilities for all of us.
You know those cows we started talking about? The repeat offenders that seem to live in the hospital pen? Maybe it’s time we stopped accepting them as inevitable. Because for a growing number of operations, they’re becoming a thing of the past.
And that’s progress worth understanding.
The Bottom Line
That cow you keep treating for mastitis—same quarter, same problem, every few weeks—isn’t incurable. You’ve just been fighting the wrong battle. Research from AHV International reveals that bacteria in biofilms are up to 1,000 times more resistant to antibiotics, explaining why chronic cases never fully heal, no matter how many tubes you use. Biofilm prevention takes a different approach: disrupting bacterial communication before these protective “fortresses” can form. The proof is in the results—Trevor Nutcher hasn’t touched a mastitis tube in months, while Peter Smith cut udder health culling from one-in-three to one-in-seven. The economics work too: protocols cost double upfront ($54 vs $27/cow), but deliver $26,764 net return per 100 cows annually, with most farms breaking even in 3-4 months. For dairies tired of accepting chronic mastitis as “part of the business,” empty hospital pens are finally within reach. Ask your technical advisor for a Biofilm Audit.
Key Takeaways
- Why chronic cases never heal: Bacteria in biofilms are 1,000x more resistant to antibiotics—you’re not failing, you’re fighting fortresses
- Proof it works: Trevor Nutcher hasn’t touched a mastitis tube in months; Peter Smith cut udder health culling from 1-in-3 to 1-in-7
- The economics: Double the upfront cost ($54 vs $27/cow), but $26,764 net return per 100 cows—most farms break even in 3-4 months
- Success factors: Works best with moderate baseline problems (20-40 cases/100 cows), systematic monitoring, and preventive implementation—not crisis response
- The shift: Chronic mastitis isn’t inevitable. Empty hospital pens are becoming normal for farms that stop treating symptoms and start preventing biofilms
Complete references and supporting documentation are available upon request by contacting the editorial team at editor@thebullvine.com.
 Join the Revolution!
 Join the Revolution!
Join over 30,000 successful dairy professionals who rely on Bullvine Weekly for their competitive edge. Delivered directly to your inbox each week, our exclusive industry insights help you make smarter decisions while saving precious hours every week. Never miss critical updates on milk production trends, breakthrough technologies, and profit-boosting strategies that top producers are already implementing. Subscribe now to transform your dairy operation’s efficiency and profitability—your future success is just one click away.