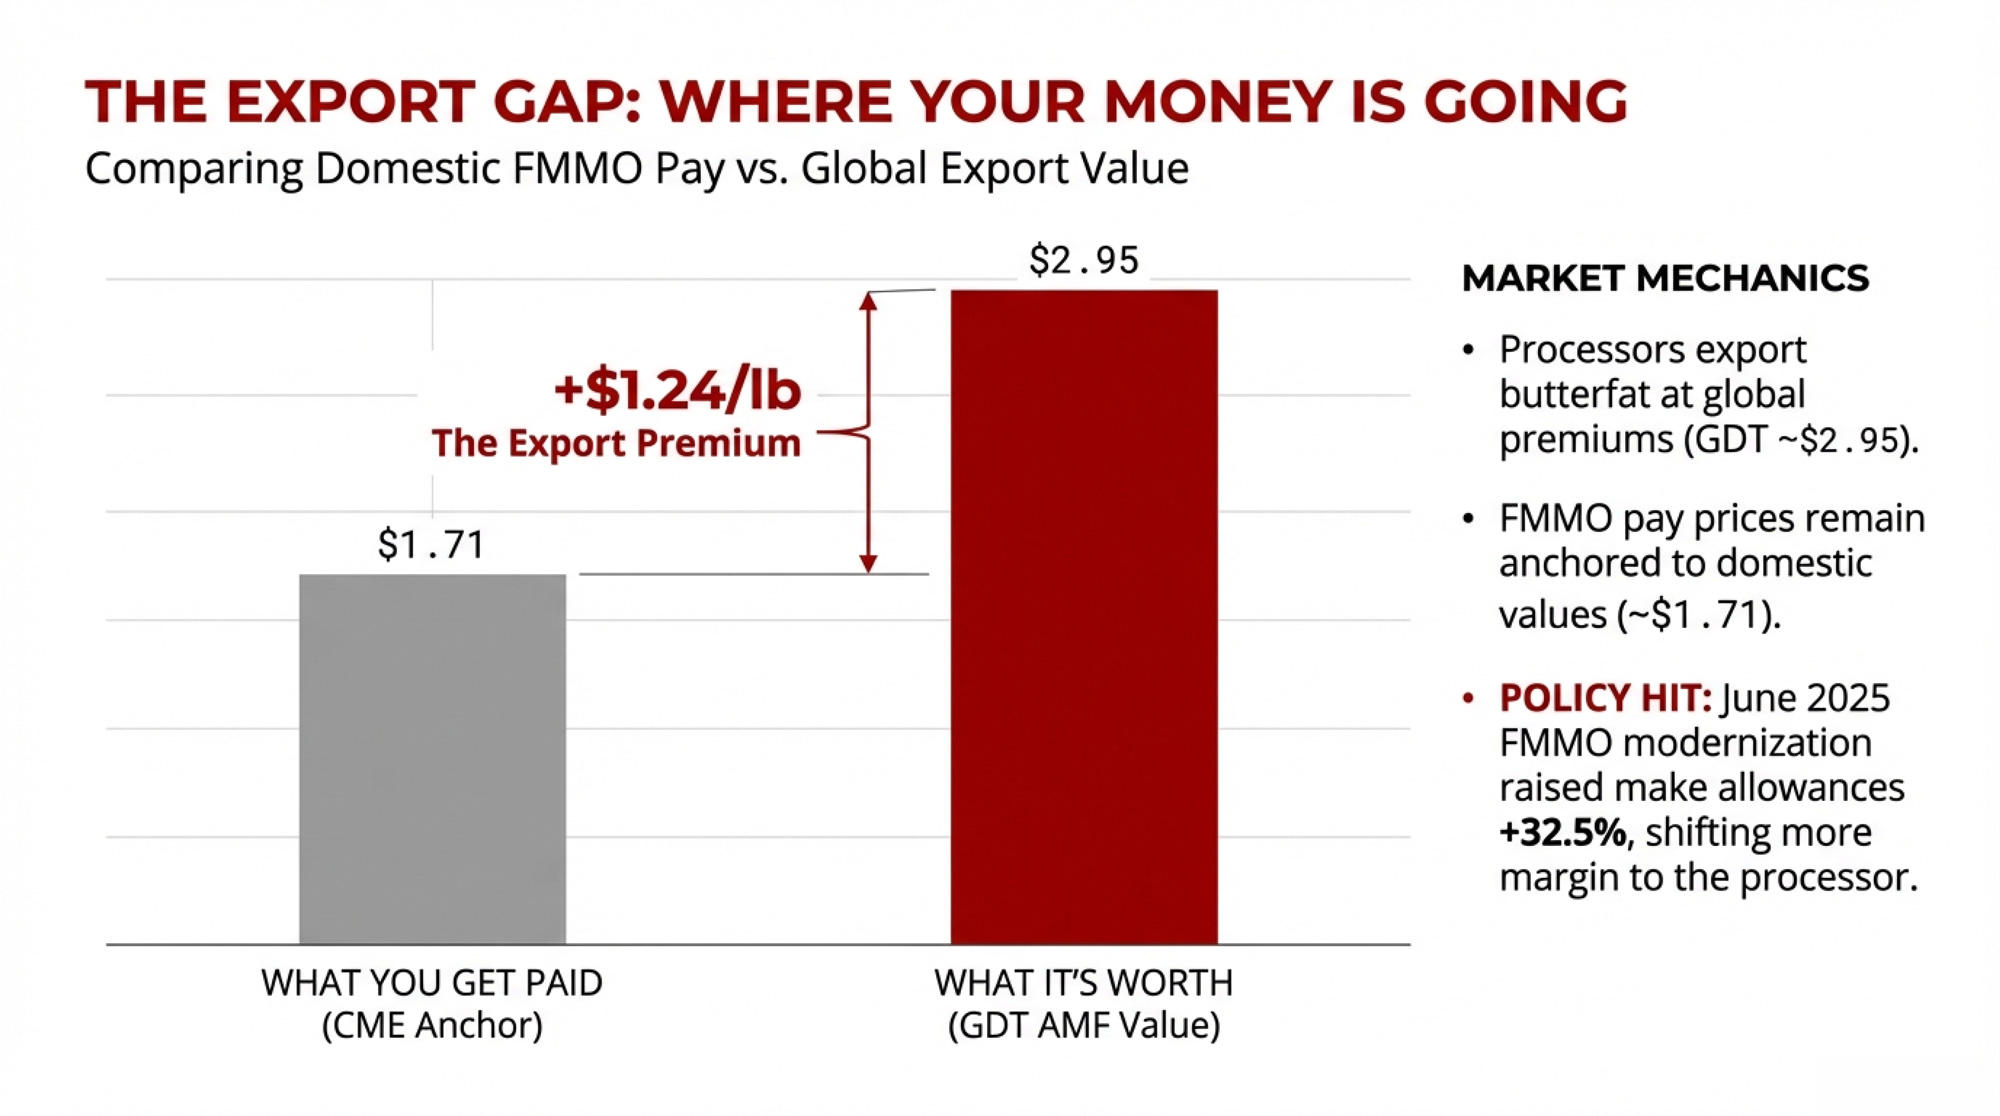
Processors are exporting your butterfat at roughly $2.95/lb while the FMMO pays you based on ~$1.71. Here’s how that gap formed — and what you need to lock in before spring flush closes the window.
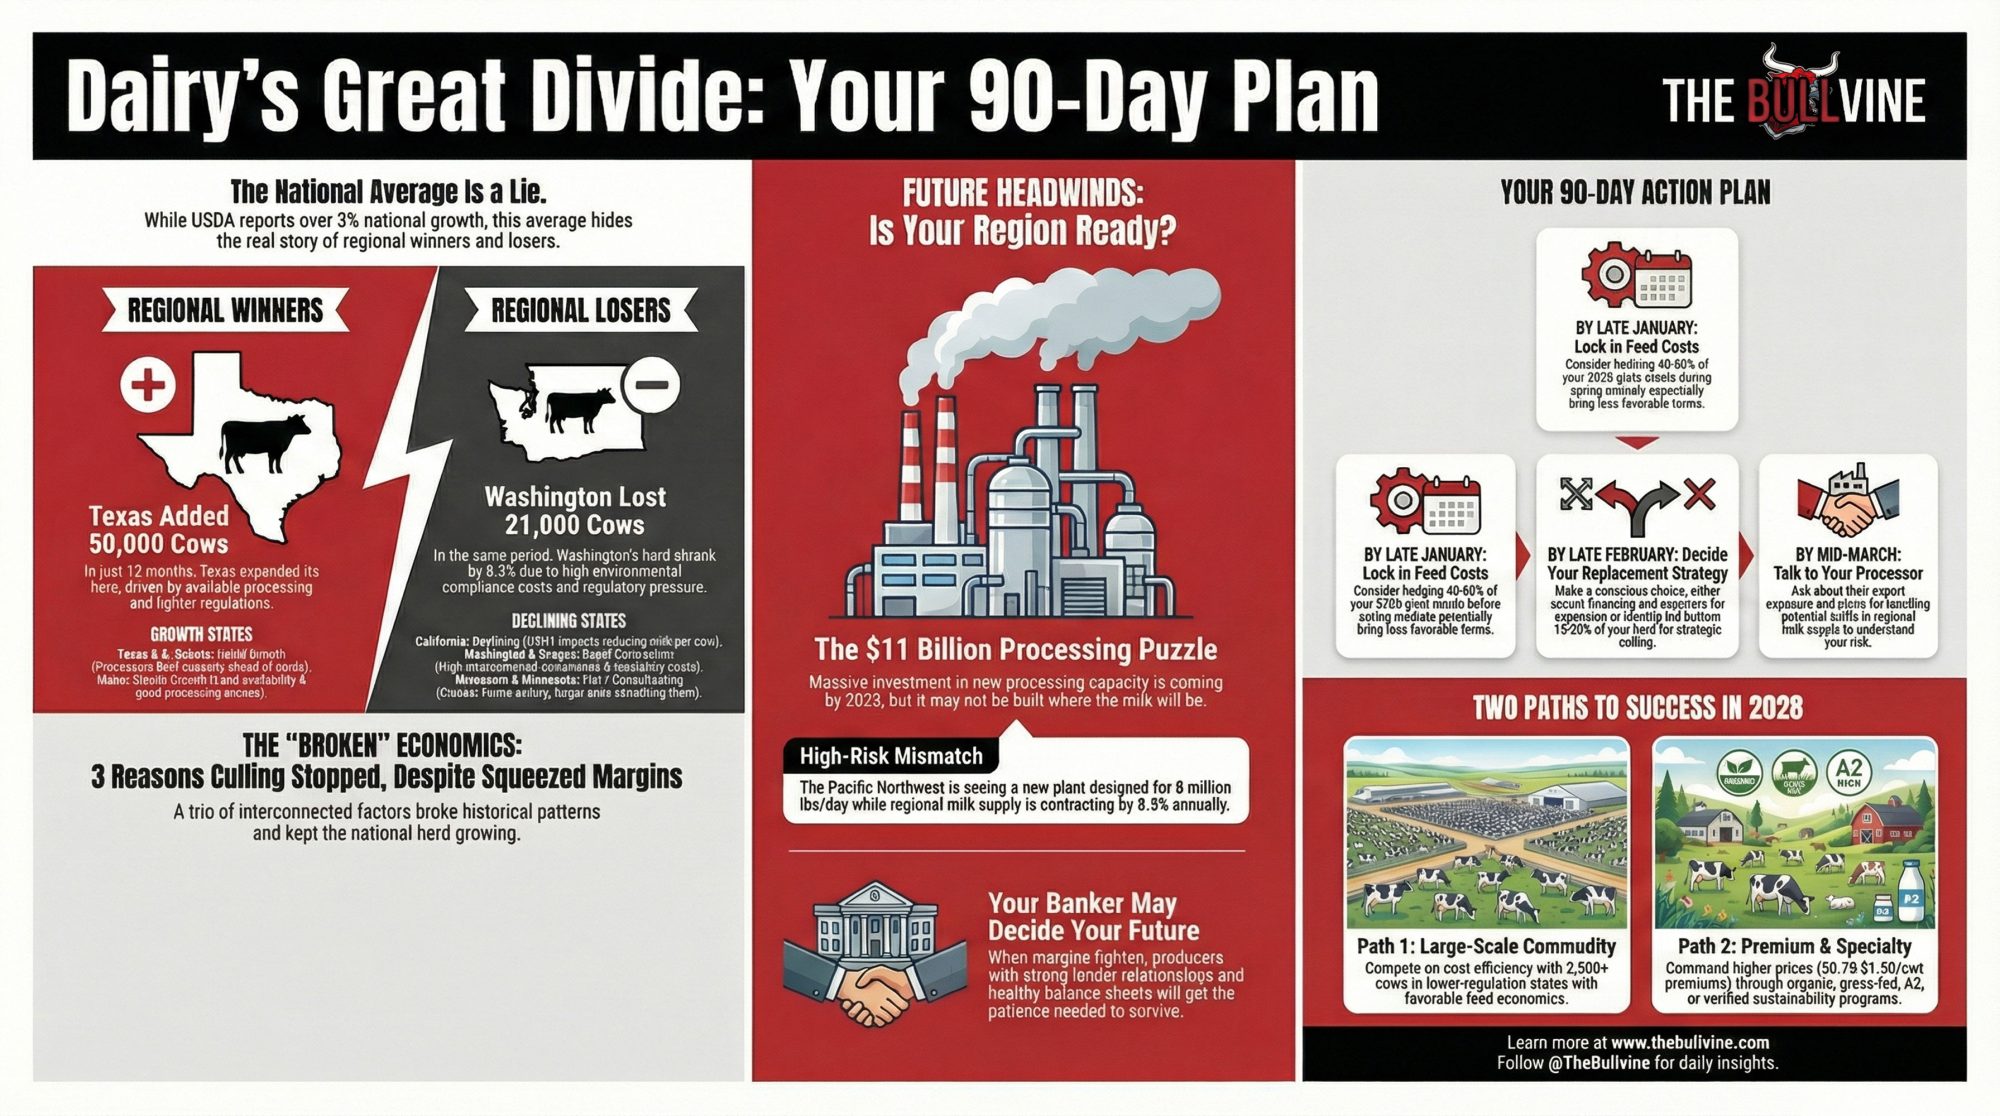
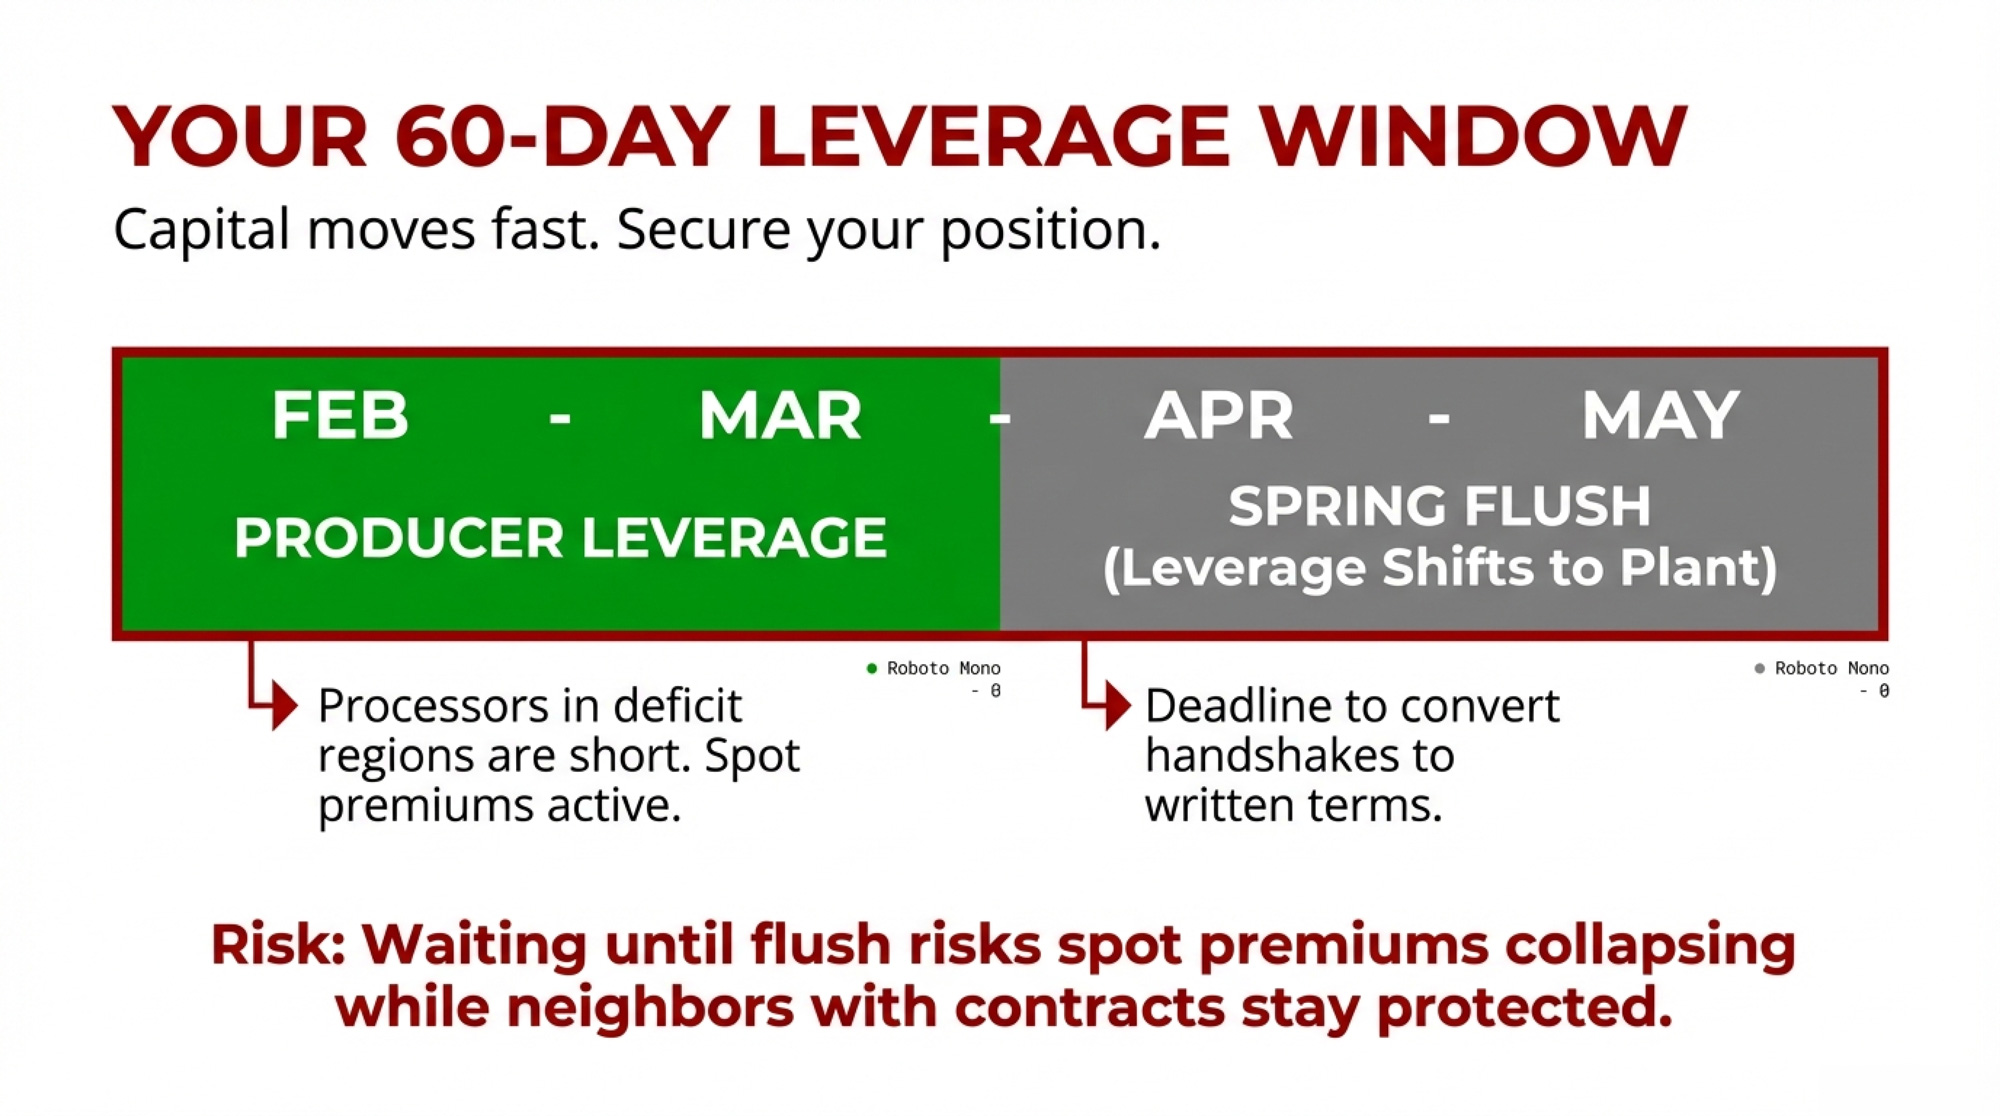
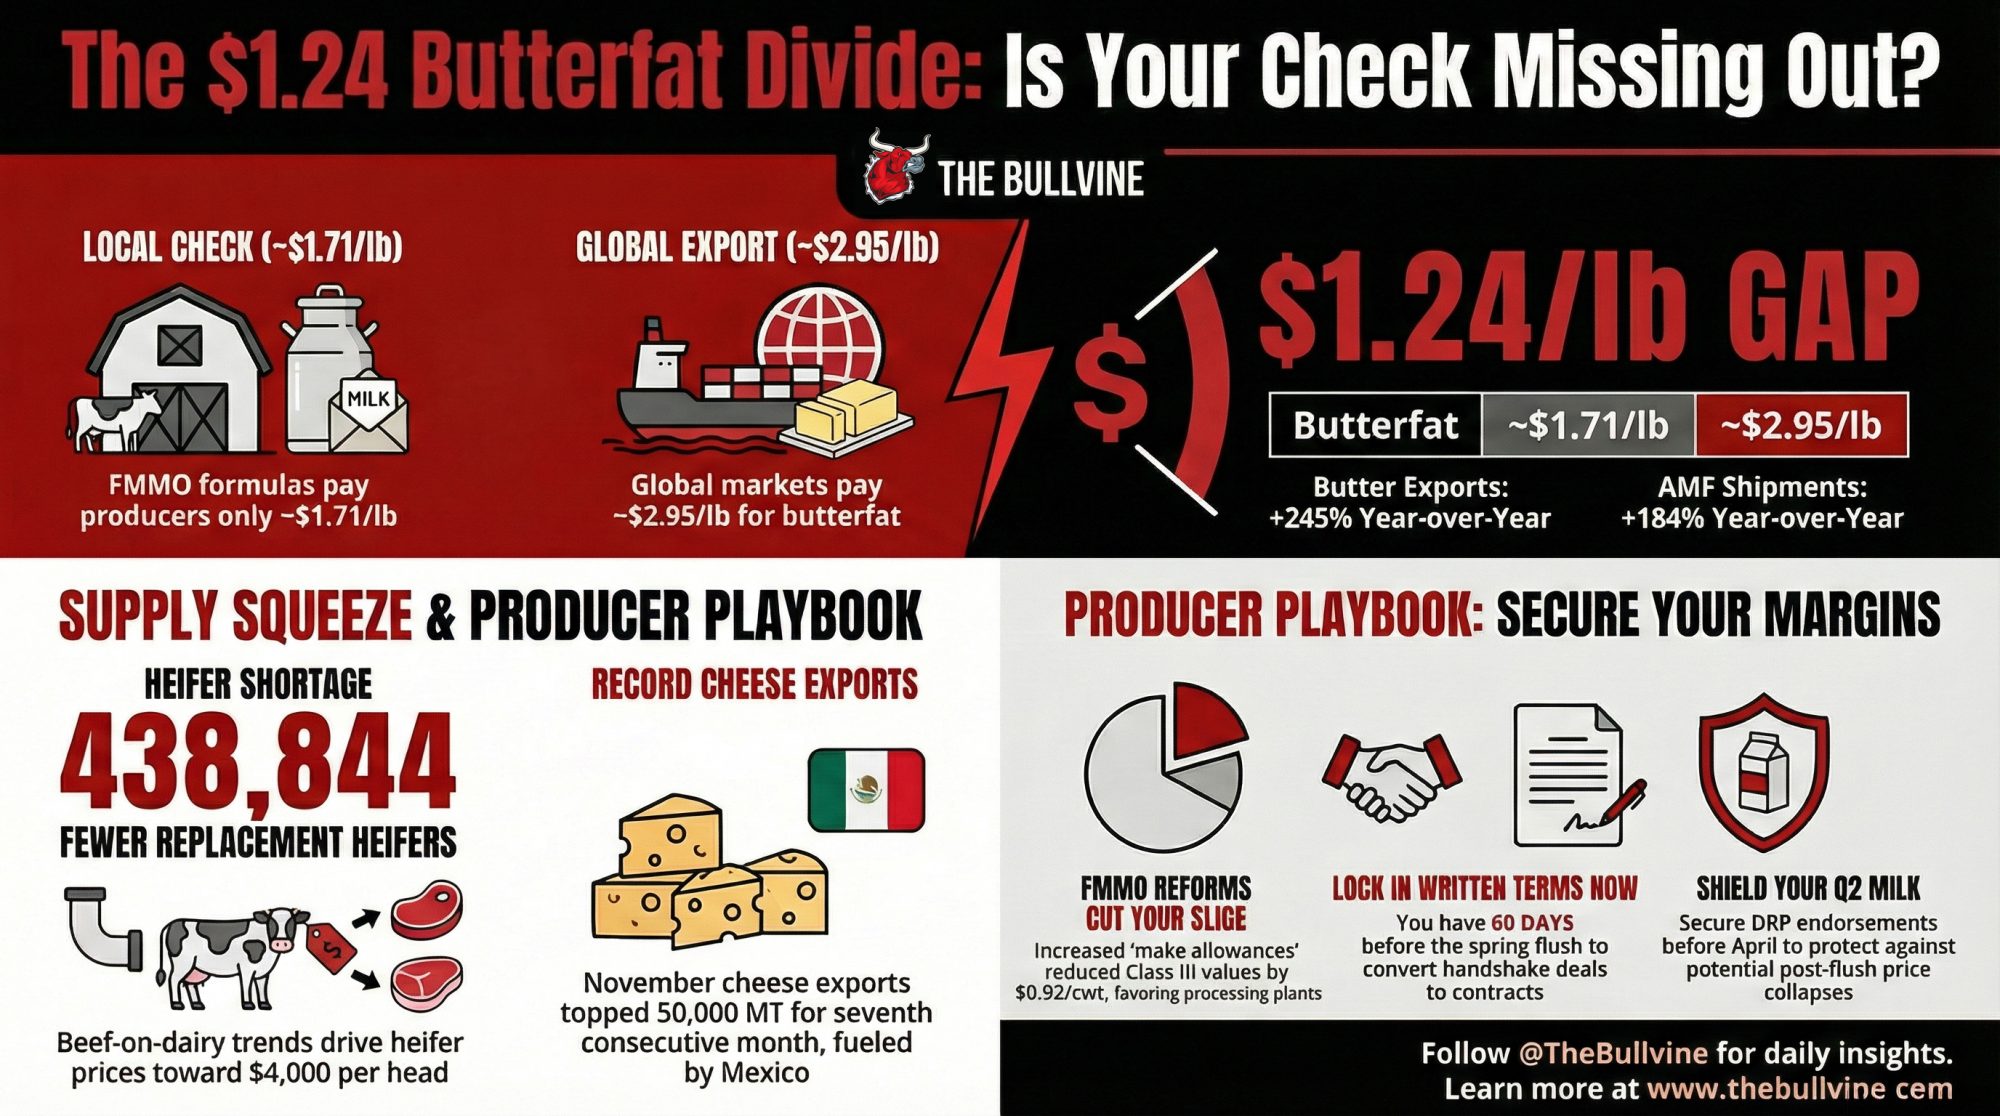
EXECUTIVE SUMMARY: Your butterfat is worth $2.95/lb on the global market. The FMMO pays you based on $1.71. That $1.24/lb gap — exposed in USDA’s December 2025 report — flows to processors exporting record butter and AMF volumes, not to the producers making the components. June’s FMMO modernization widened the divide: raised make allowances cut Class III by $0.92/cwt handing plants a bigger slice while yours shrank. Supply pressure is building from the other direction — CoBank projects 438,844 fewer replacement heifers by 2026, with prices at $3,010–$4,000/head, just as $10 billion in new processing capacity needs milk. Component-focused operations in deficit regions have roughly 60 days before the spring flush to convert handshake deals into written terms. After that, the leverage shifts.
Cheese blew past expectations. Butter missed — again. NFDM production fell, but stocks climbed anyway. When USDA dropped the December 2025 Dairy Products report on February 5, 2026, futures barely flinched. Everything traded flat except powder, which caught immediate sell-side pressure.
The headline numbers look simple enough: total cheese at 1.28 billion pounds (+6.7% year over year), butter at 204 million pounds (+2.0%), nonfat dry milk at 127 million pounds (down 2.7%), per USDA NASS. But underneath those percentages sits a widening disconnect between the global value of your components and what actually shows up on your milk check — a gap that should be front-of-mind for every component-focused operation heading into spring 2026.
For the component-focused operations tracking their butterfat premium against the blend, December’s milk check told a familiar story: the premium was up, but not nearly as much as the export math suggested it should be. The rest of the value? It left the country.
Cheese: $10 Billion in Capacity, and the Export Machine Is Absorbing It
Cheddar alone hit 340,350 thousand pounds in December — up 9.0% from a year ago. Not a one-month blip. Full-year 2025 cheddar finished 5.3% above 2024, and total cheese came in 2.9% higher. Italian types weren’t far behind: mozzarella up 5.9%, Parmesan up a striking 22.9%.
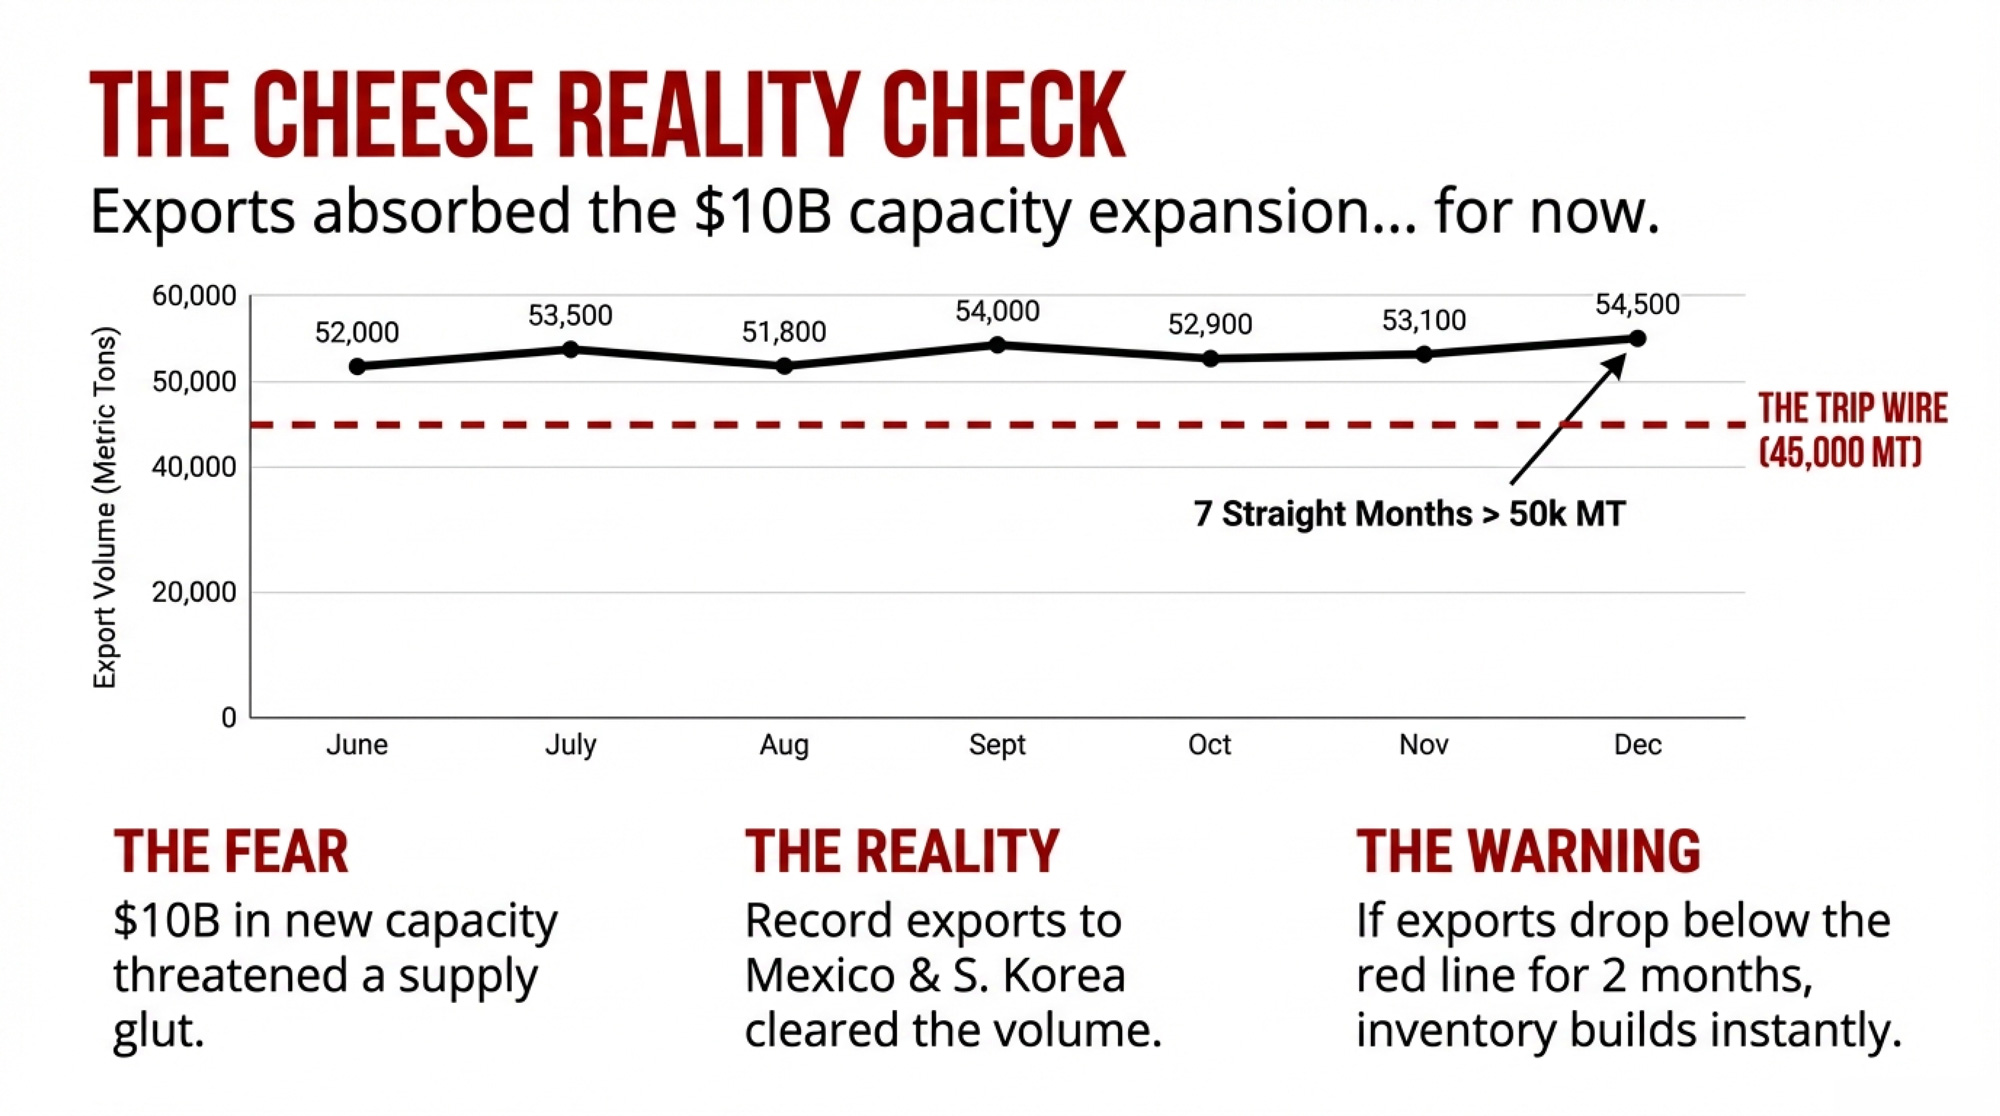
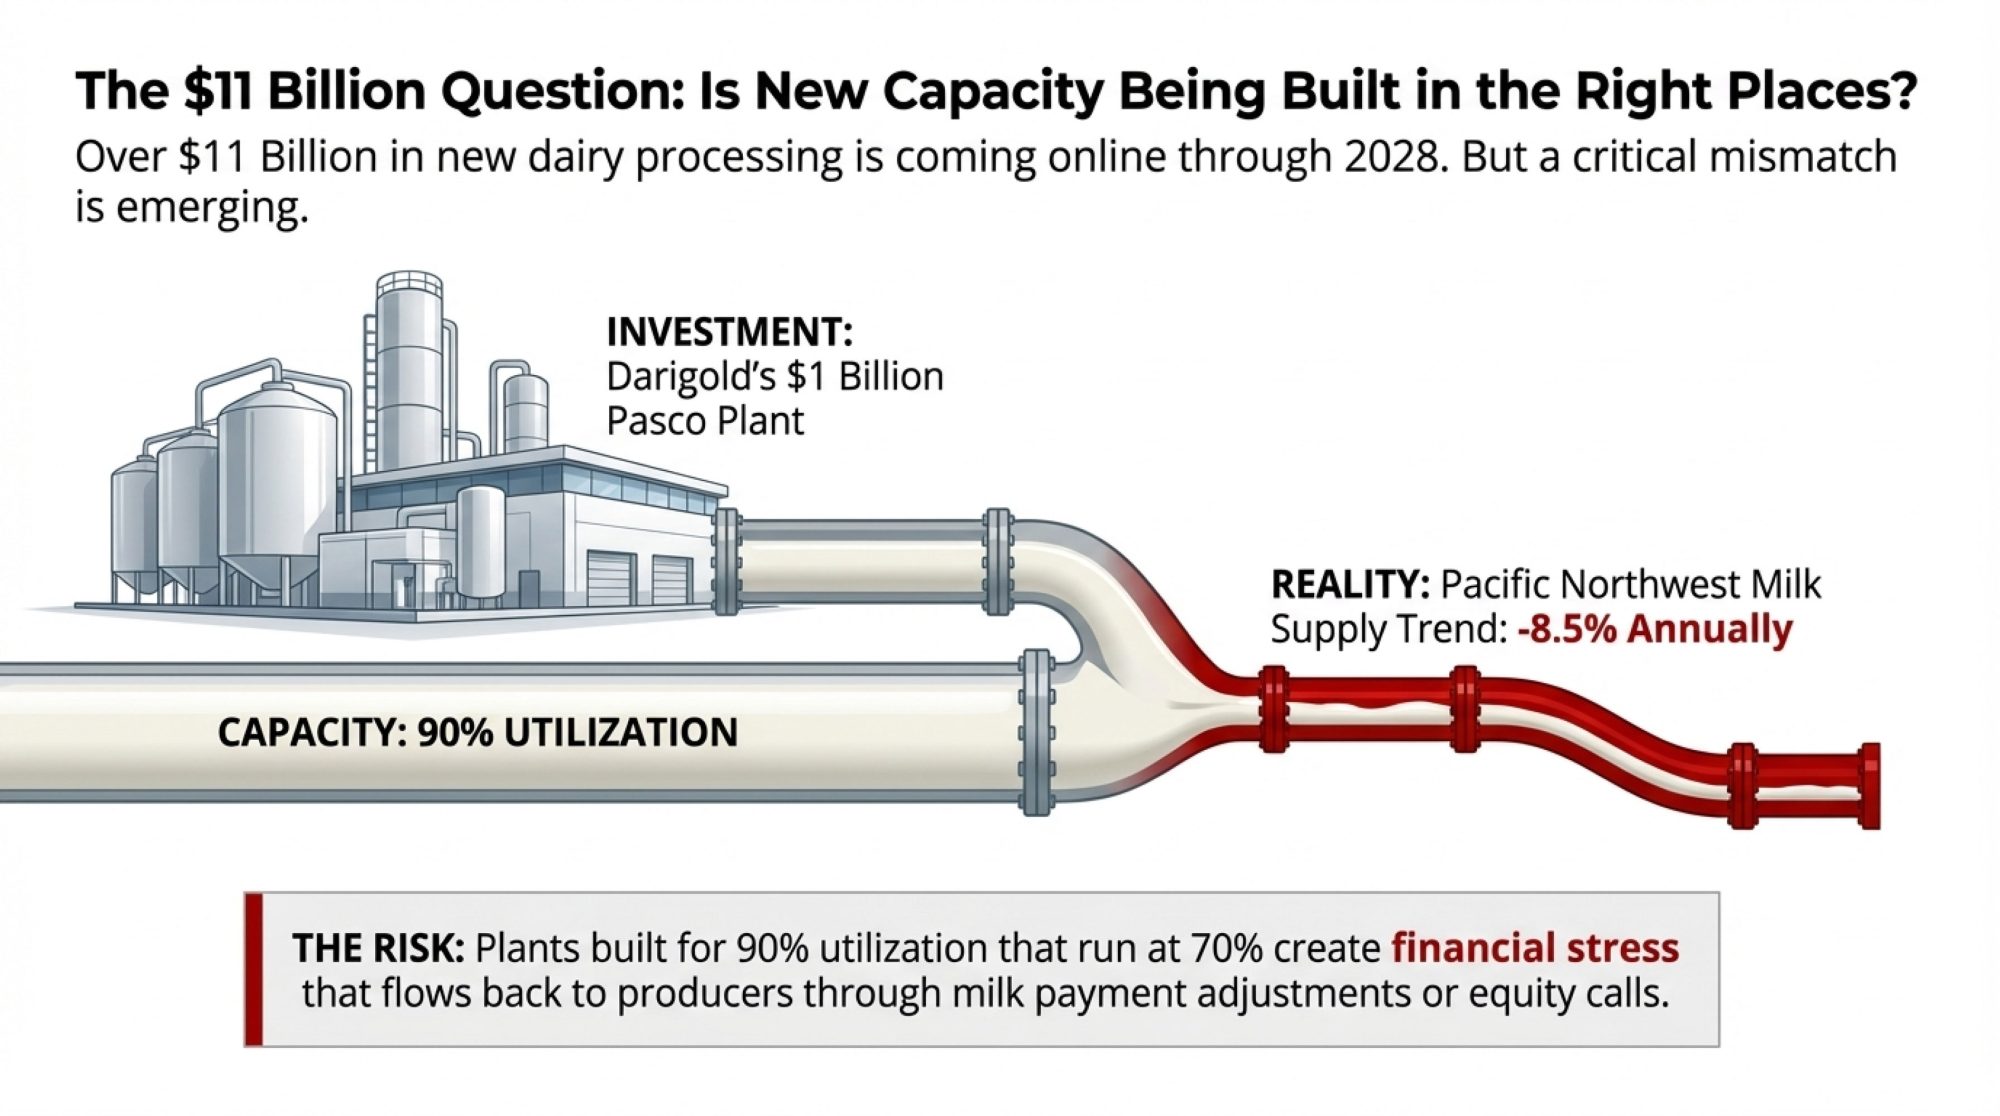
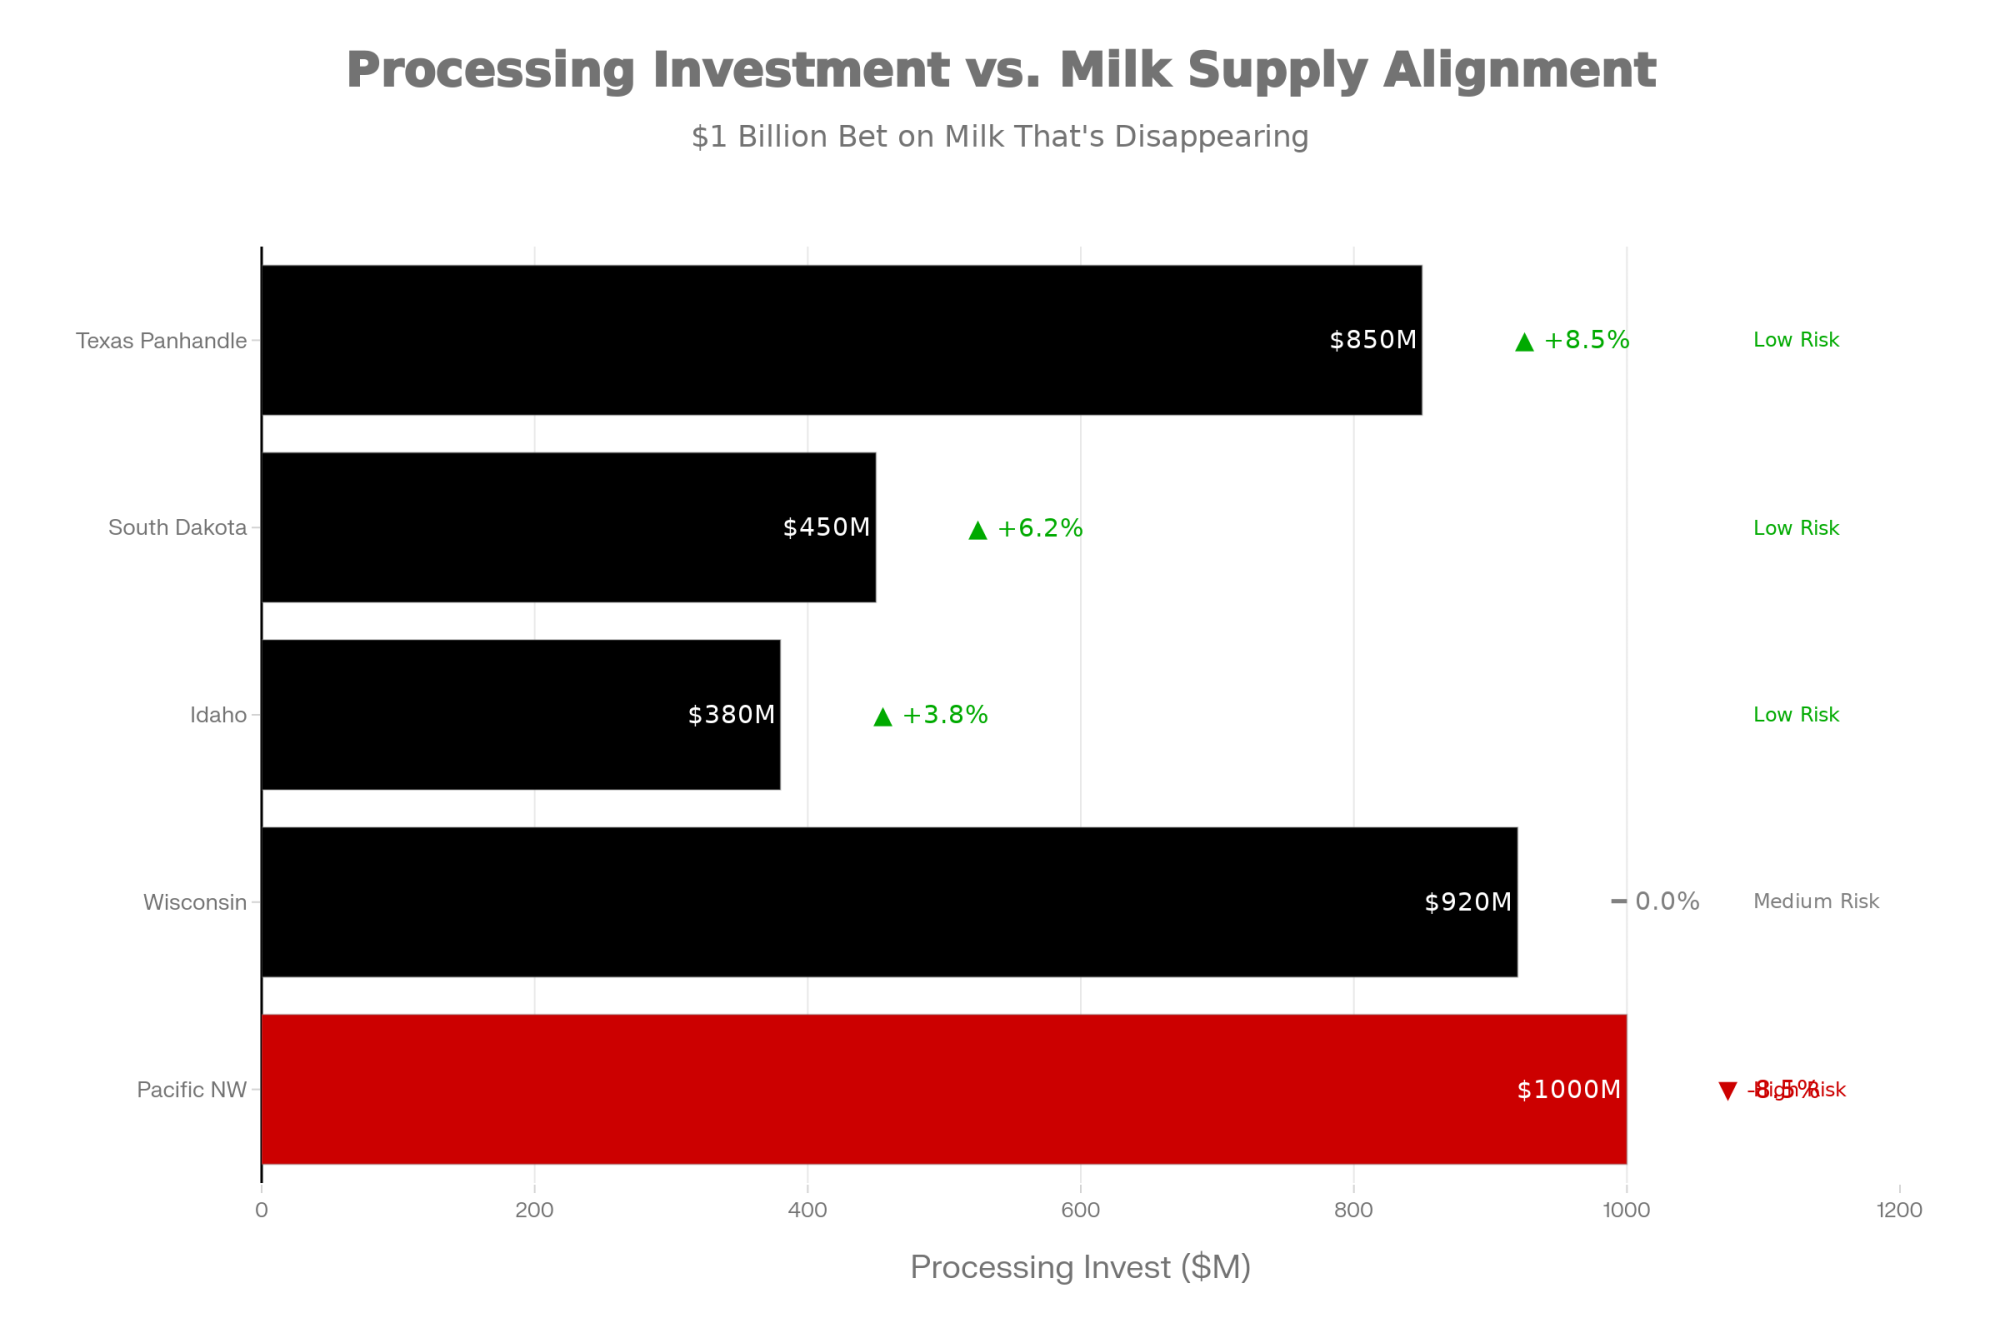
Announced U.S. dairy processing investments total roughly $10 billion through 2027, according to CoBank. The industry braced for a glut that would crush the board.
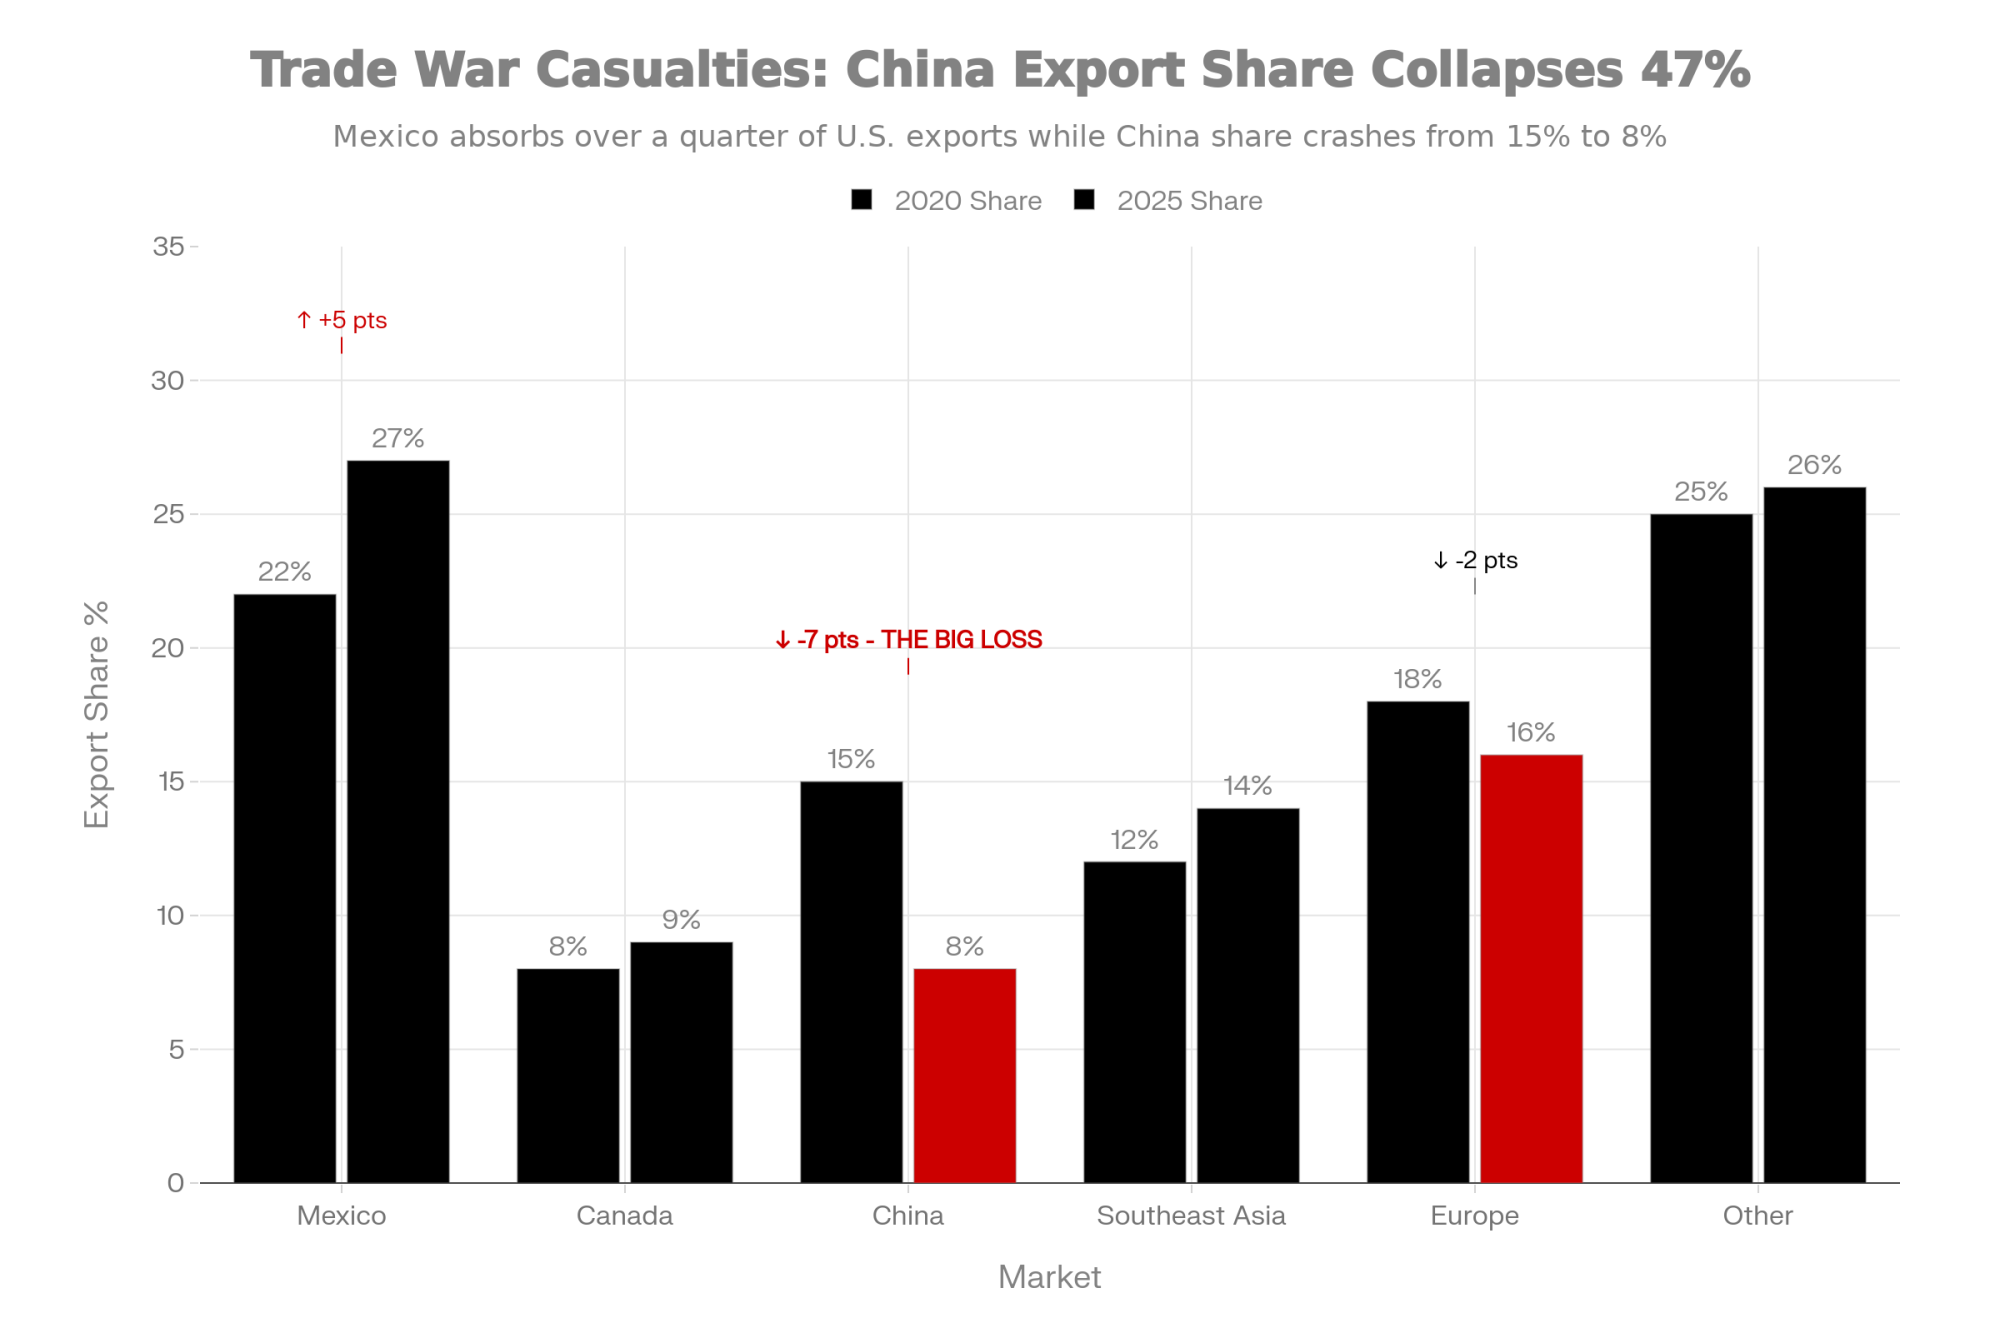
It hasn’t happened — because export demand ate through the extra volume. USDEC’s January 2026 trade summary puts November 2025 cheese exports at 50,775 metric tons, up 28% year over year. That’s the seventh consecutive month above 50,000 MT — a threshold never breached before 2025. Volume rose significantly to Mexico and South Korea, which USDEC says is “poised to set an annual record for U.S. cheese purchasing.” Southeast Asia cheese exports surged 92%.
| Month | U.S. Cheese Exports (MT) | YoY Change (%) | Status vs. 50k MT Threshold |
|---|---|---|---|
| May 2025 | 51,240 | +18% | ✓ Above |
| June 2025 | 52,890 | +22% | ✓ Above |
| July 2025 | 53,470 | +24% | ✓ Above |
| Aug 2025 | 51,920 | +21% | ✓ Above |
| Sept 2025 | 54,110 | +26% | ✓ Above |
| Oct 2025 | 52,650 | +23% | ✓ Above |
| Nov 2025 | 50,775 | +28% | ✓ Above |
But 28% export growth isn’t a number you can bank on forever. Here’s the threshold worth watching: if monthly cheese exports drop below 45,000 MT for two consecutive months while new plants keep ramping, domestic inventories will build faster than the market can clear. That’s not a prediction. It’s a trip wire.
Butter: Your Fat Leaves the Country at ~$2.95. Your Check Reflects ~$1.71.
Butter production came in at 203,848 thousand pounds, just 2.0% above December 2024. Full-year 2025 butter was up 5.7% — not a collapse — but December fell well short of private forecasts for the second straight month. USDA’s January 23 Milk Production report showed December output in the 24 major states at 18.8 billion pounds, up 4.6%year over year, with 222,000 more cows and 42 more pounds per cow generating plenty of cream.
So where’d all the butter go? Overseas. Where the margins are.
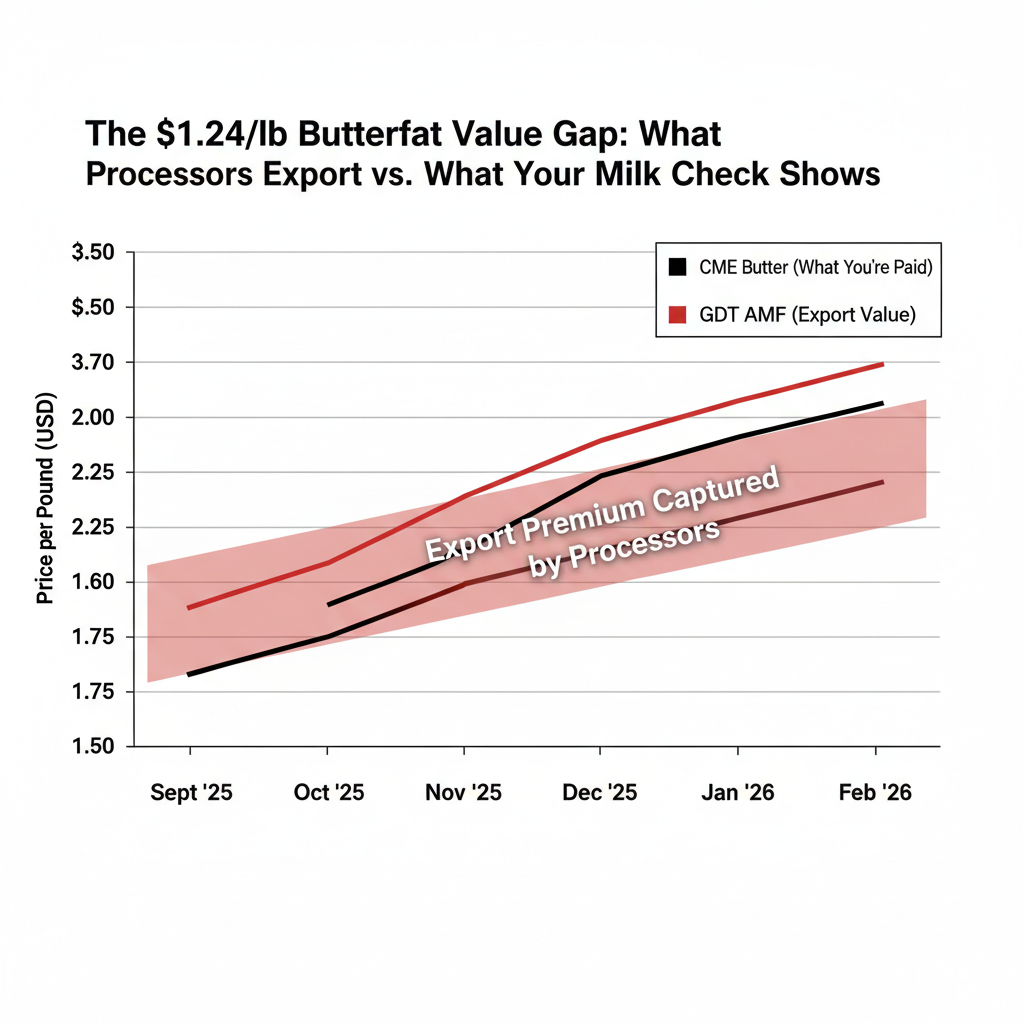
Per the CME cash dairy trade the week of February 3 (prices as of February 5, 2026), spot butter closed at approximately $1.71/lb, up from around $1.58 earlier in the week. GDT futures for February 2026 delivery had butter at roughly $2.64/lb and anhydrous milk fat at roughly $2.95/lb, per the Daily Dairy Report. That’s a spread of about $0.93/lb between CME and GDT butter — and $1.24/lb between CME butter and GDT AMF.
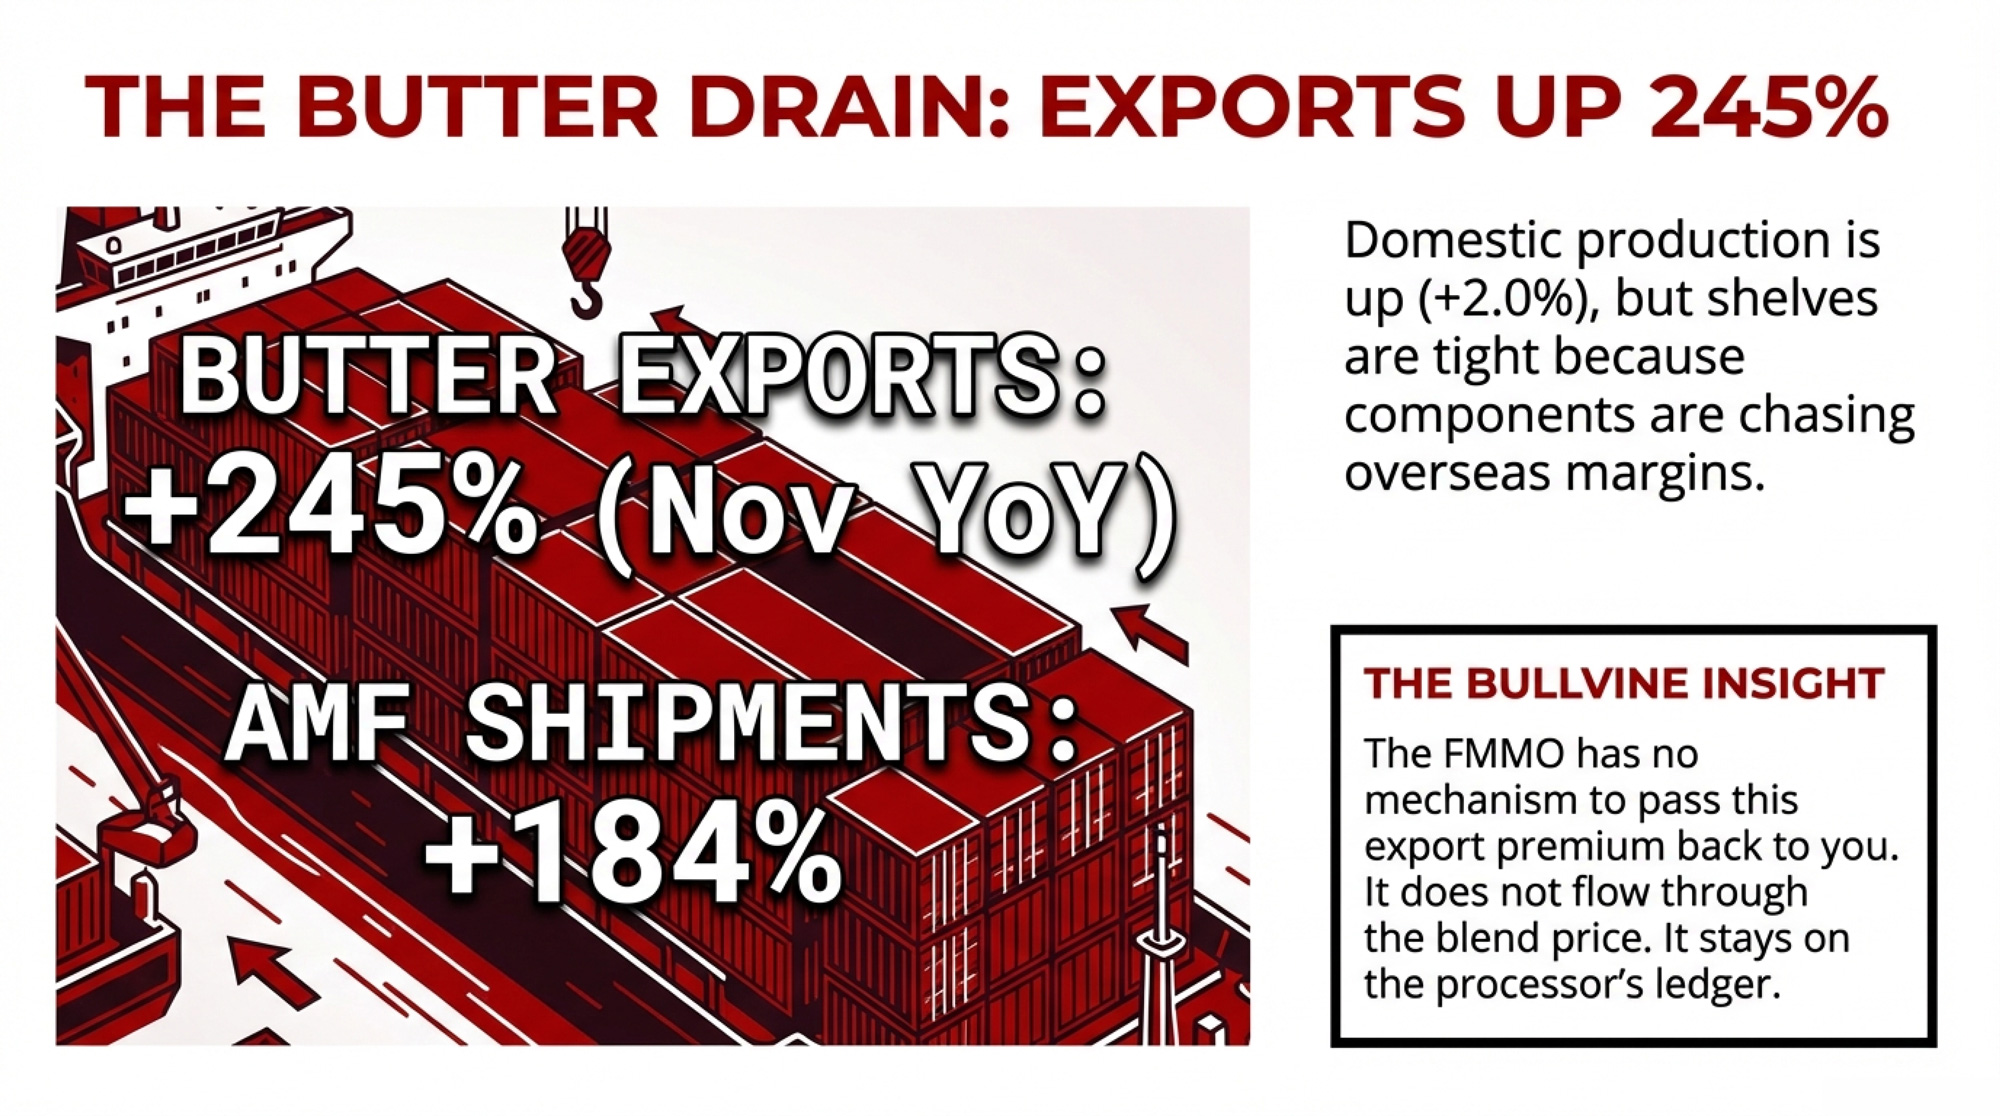
USDEC confirms processors are leaning hard into that spread. November butter exports surged 245% year over year. AMF shipments jumped 184%. USDEC called it the highest single month on a milk-fat basis for U.S. dairy exports — total butterfat exports reached 15,308 metric tons.
Now stack FMMO math on top. The June 2025 Federal Order modernization raised the butter make allowance from $0.1715/lb to $0.2272/lb — a 32.5% increase, per the USDA final rule published January 17, 2025. The changes “lowered the value of producer milk,” with the new cheese make allowances alone reducing the Class III price by $0.92/cwt.
The formula changes gave plants a bigger slice of the value pie. Your slice got smaller.
You produce the butterfat. Your plant converts it to 82% butter or AMF and sells it into an export channel, priced off GDT. Your milk check stays anchored to CME butter minus a bigger make allowance. The FMMO has no mechanism to pass that export premium back to you. Not through your blend price. Not through your component premium.
| Product / Metric | CME Price ($/lb) | GDT Price ($/lb) | Spread ($/lb) | Value Gap per Tanker |
|---|---|---|---|---|
| Butter (82% fat) | $1.71 | $2.64 | +$0.93 | ~$5,580 |
| Anhydrous Milk Fat | $1.71* | $2.95 | +$1.24 | ~$7,440 |
| Your Butterfat (3.7% test) | Based on $1.71 CME | Actual export value $2.95 | +$1.24 | ~$7,440 |
| Per Cwt Impact (80 lb/cwt @ 3.7% BF) | Paid ~$5.06/cwt BF | Worth ~$8.74/cwt BF | -$3.68/cwt | -$221/tanker |
One partial exception worth investigating: if you’re a co-op member, your cooperative may return a share of export value through patronage dividends or retained earnings. Pull your co-op’s annual financial statement. Ask the question directly at your next member meeting. You might not like the answer — but you deserve to know it.
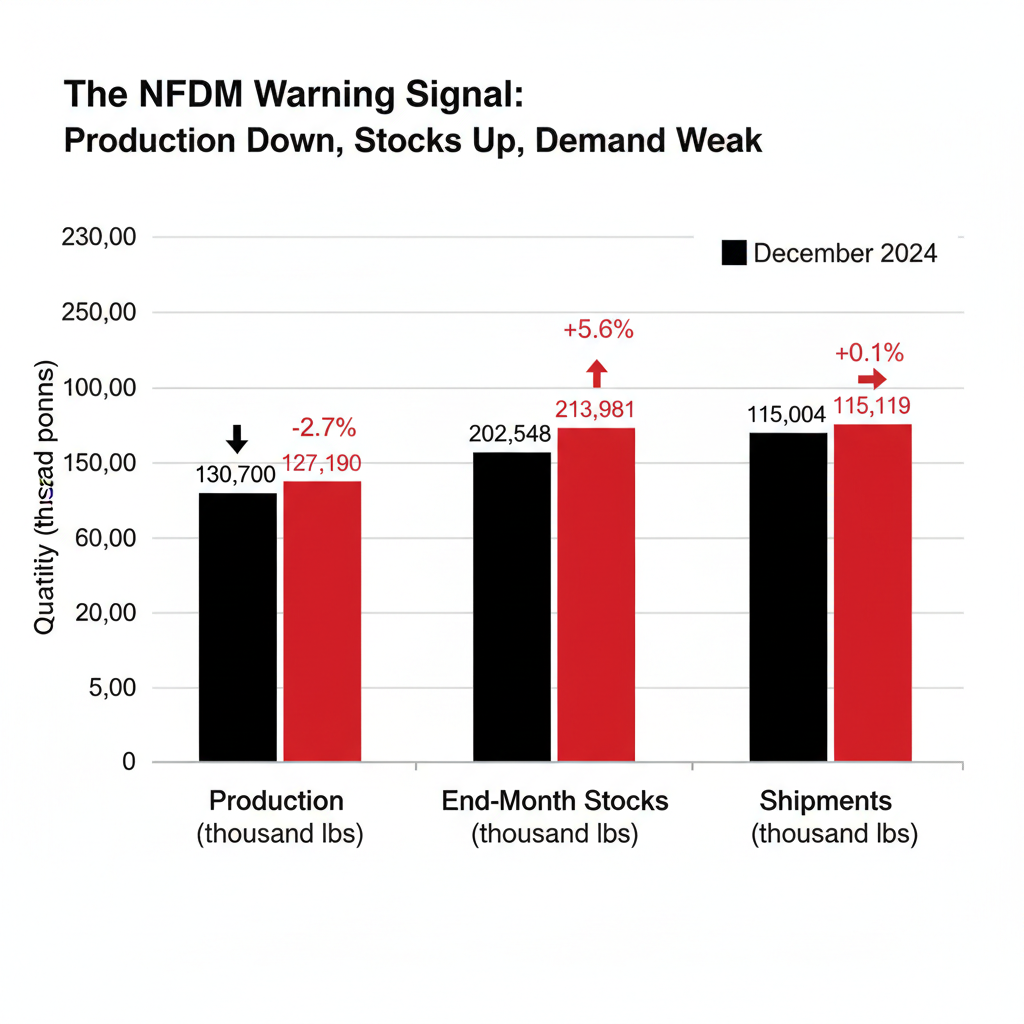
NFDM: Production Down, Stocks Up — Powder Took the Only Futures Hit
This is where the December report sent its clearest signal, and the one place futures actually listened.
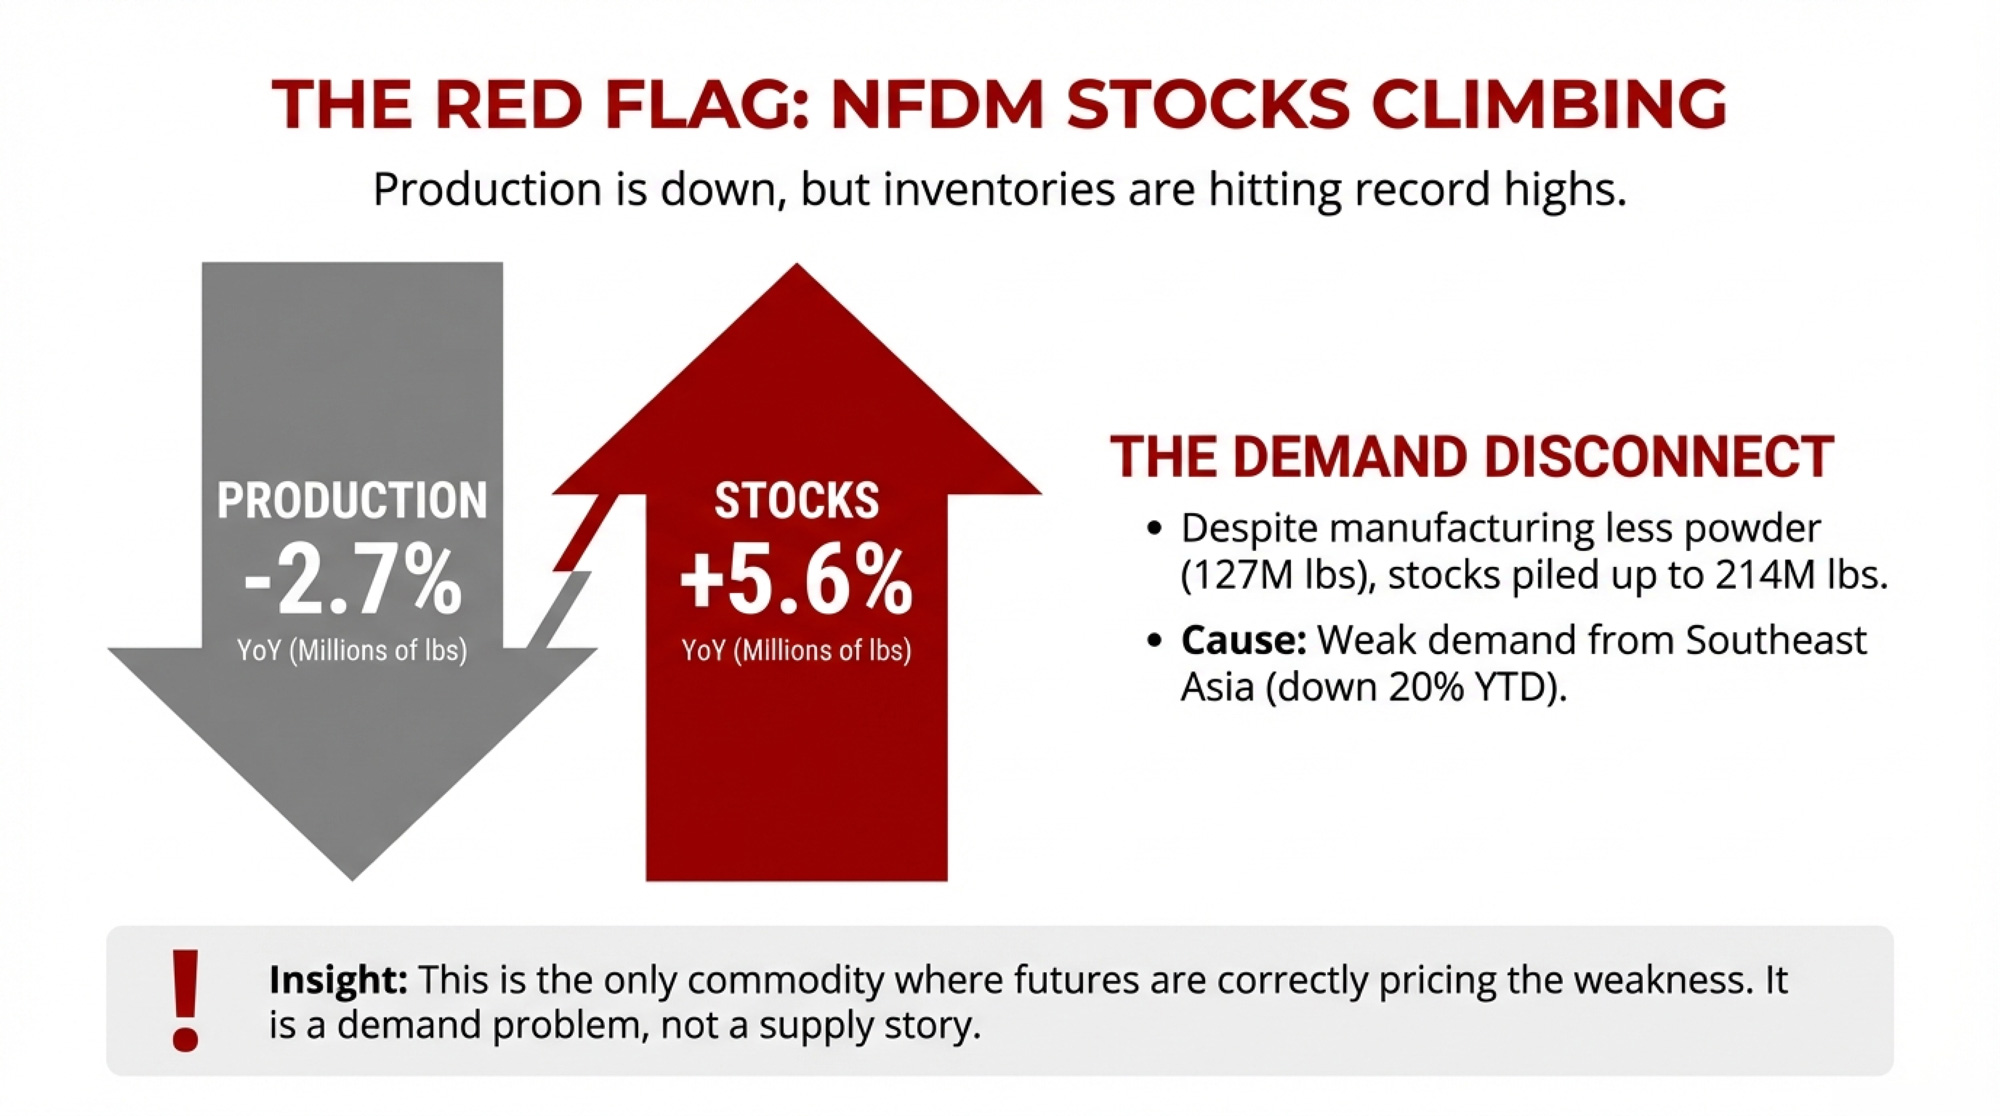
December NFDM production came in at 127,190 thousand pounds, down 2.7% year over year. Skim milk powder dropped even harder — down 15.2%. If you only saw the production side, you’d assume a tightening powder complex.
| Category | Dec 2024 | Dec 2025 | Change |
|---|---|---|---|
| Production | 130,700 | 127,190 | -2.7% ↓ |
| End-Month Stocks | 202,548 | 213,981 | +5.6% ↑ |
| Shipments | 115,004 | 115,119 | +0.1% → |
End-of-month manufacturer stocks told a different story: 213,981 thousand pounds, up 5.6% from 202,548 a year ago. NFDM shipments were essentially flat at 115,119 thousand pounds (+0.1%). USDEC’s trade data through three quarters showed total export volume up only 1.7% through September, while powder shipments to Mexico and Southeast Asia posted year-over-year declines. USDEC directly noted that “a decline in exportable supplies of milk powder from the U.S., combined with tepid demand from SEA, has caused volumes into the region to fall.”
November did bring a rebound in Southeast Asian powder shipments — NFDM/SMP to the region jumped 23%, driven almost entirely by Indonesia — but year-to-date milk powder exports to Southeast Asia were still down 20% through November.
Falling production. Rising stocks. Flat-to-weak exports. That’s a demand problem, not a supply story.
The Quiet Whey Shift: Putting a Floor Under Class III
One number buried in this report deserves your attention. Whey protein isolate production jumped 11.7% year over year to 20,644 thousand pounds, while WPI stocks fell 5.4%. Consumer demand for high-protein products is pulling whey streams into higher-value WPI — human dry whey was up only 4.0% despite 6.7% more cheese generating more liquid whey.
Because dry whey feeds the Class III formula, that structural pull is quietly supporting one of the inputs that determines your Class III price. If you’re on Class III, your dry whey component isn’t eroding the way the powder side is. Small bright spot in a complicated picture.
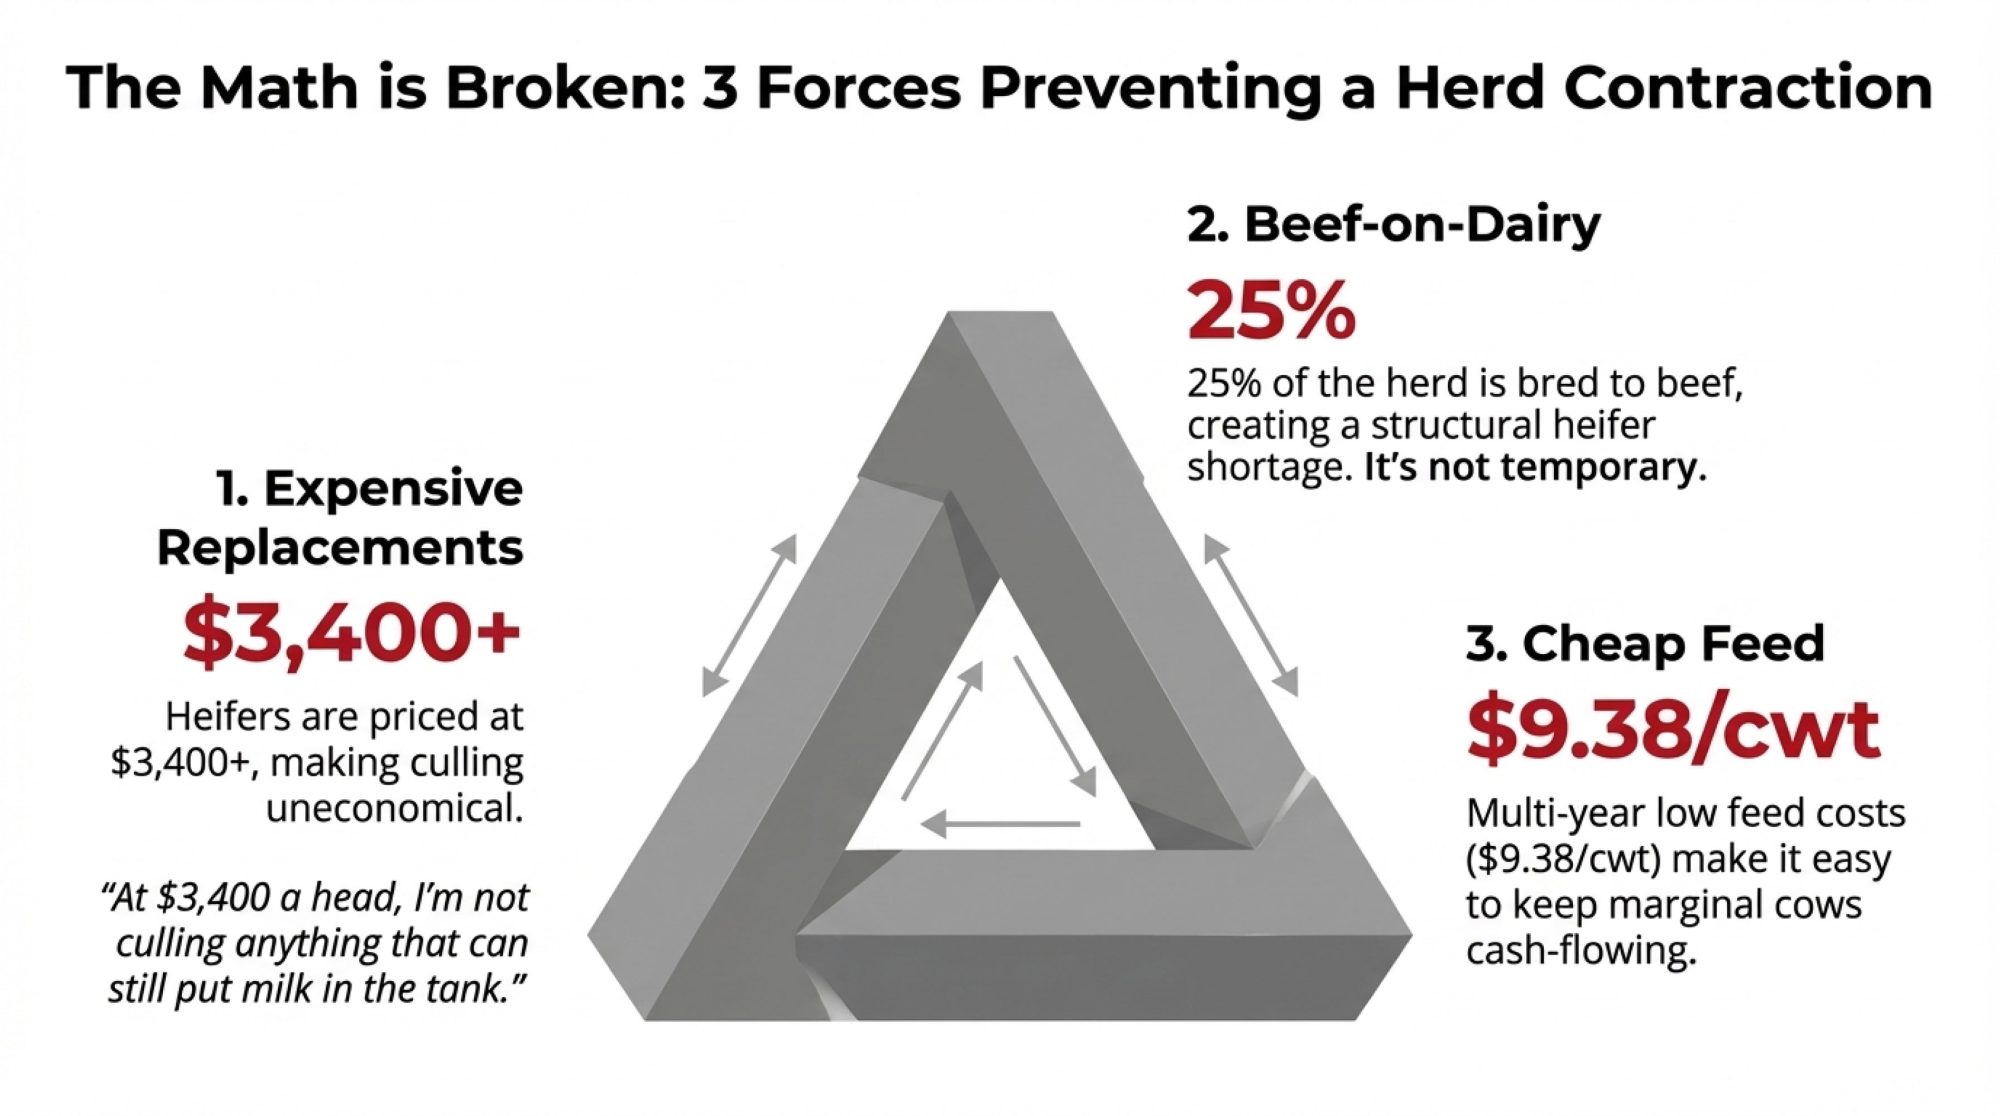
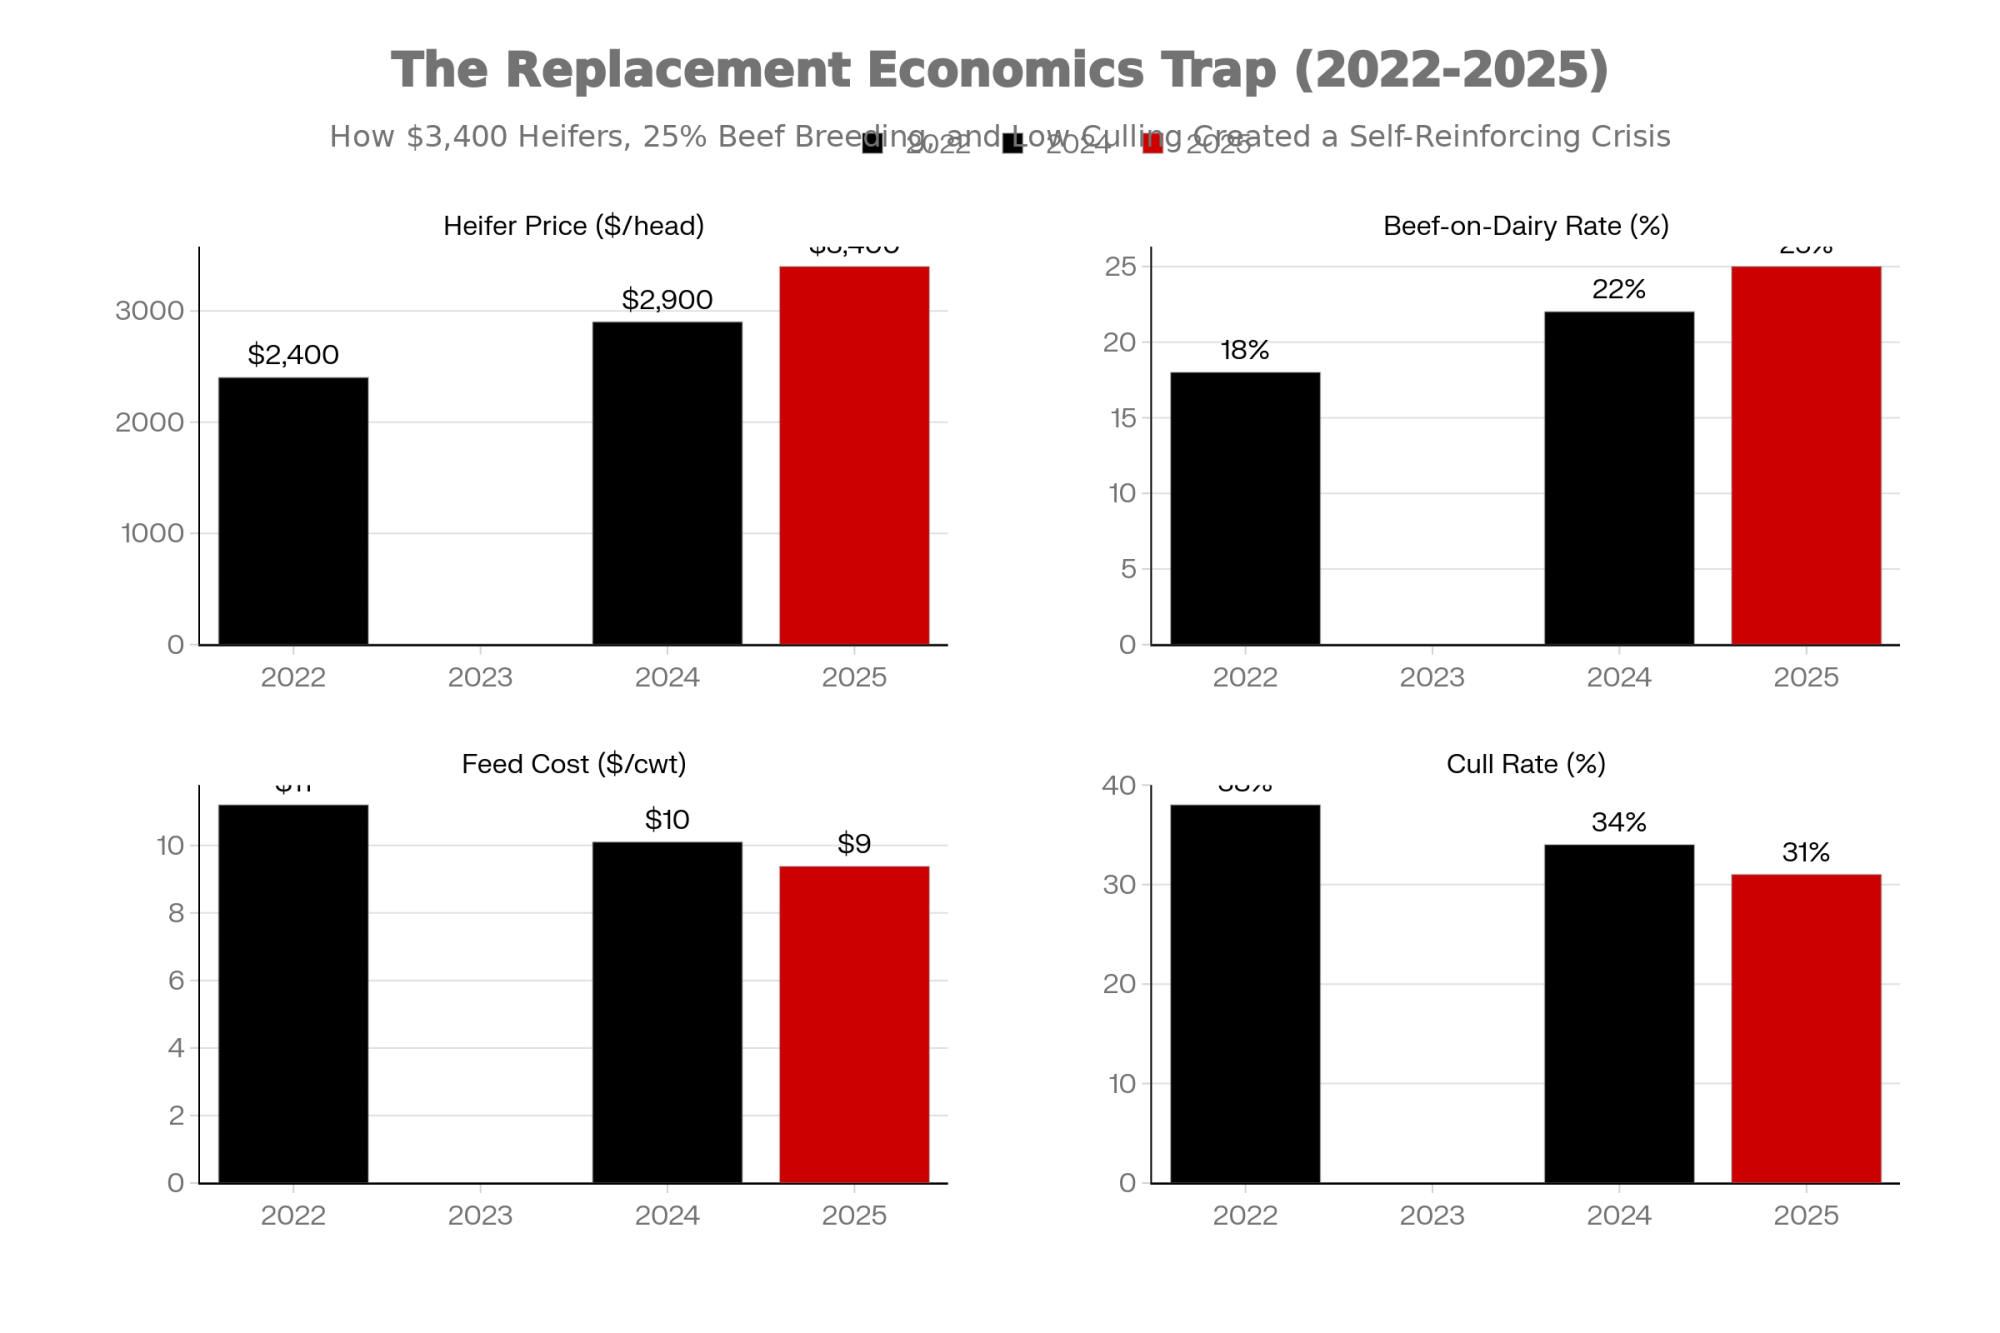
438,000 Fewer Heifers vs. $10 Billion in Hungry Plants
Every capacity story runs into the same wall. Biology doesn’t move at the speed of capital.
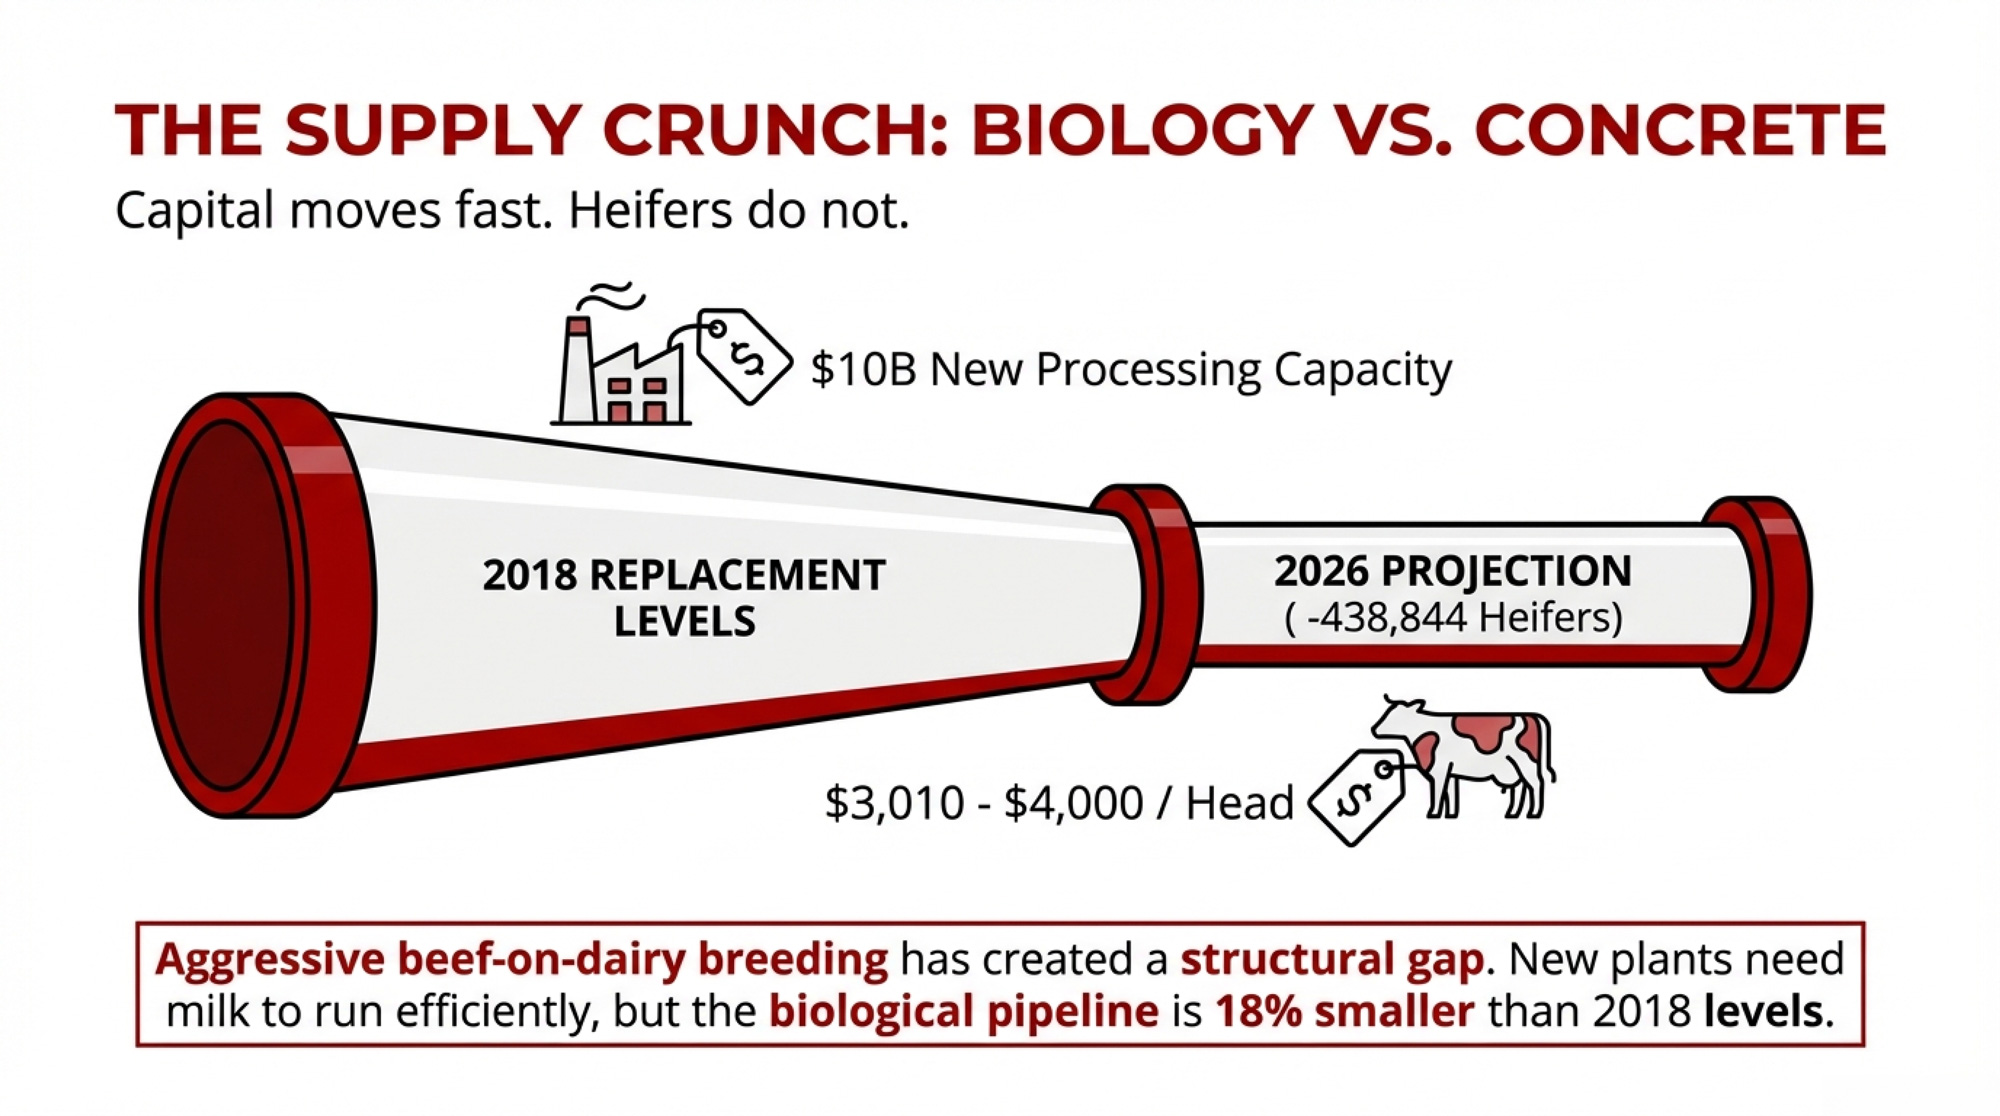
CoBank’s Corey Geiger projected in August 2025 that U.S. dairy heifer inventories would shrink by 438,844 head between 2025 and 2026, driven by beef-on-dairy breeding decisions that sent skyrocketing volumes of beef semen into dairy herds — 7.9 million units in 2024 alone, per NAAB data. Over two years, CoBank estimates the total decline could reach roughly 800,000 fewer replacement heifers, with a rebound starting in 2027. USDA’s January 2025 Cattle report showed 3.914 million dairy replacements — 18% fewer than in 2018.
| Year | Heifer Inventory (million) | Cumulative Capacity Investment ($B) |
|---|---|---|
| 2024 | 3.91 | $2.5 |
| 2025 | 3.69 | $5.8 |
| 2026 | 3.47 | $8.5 |
| 2027 | 3.58 (projected rebound starts) | $10.0 |
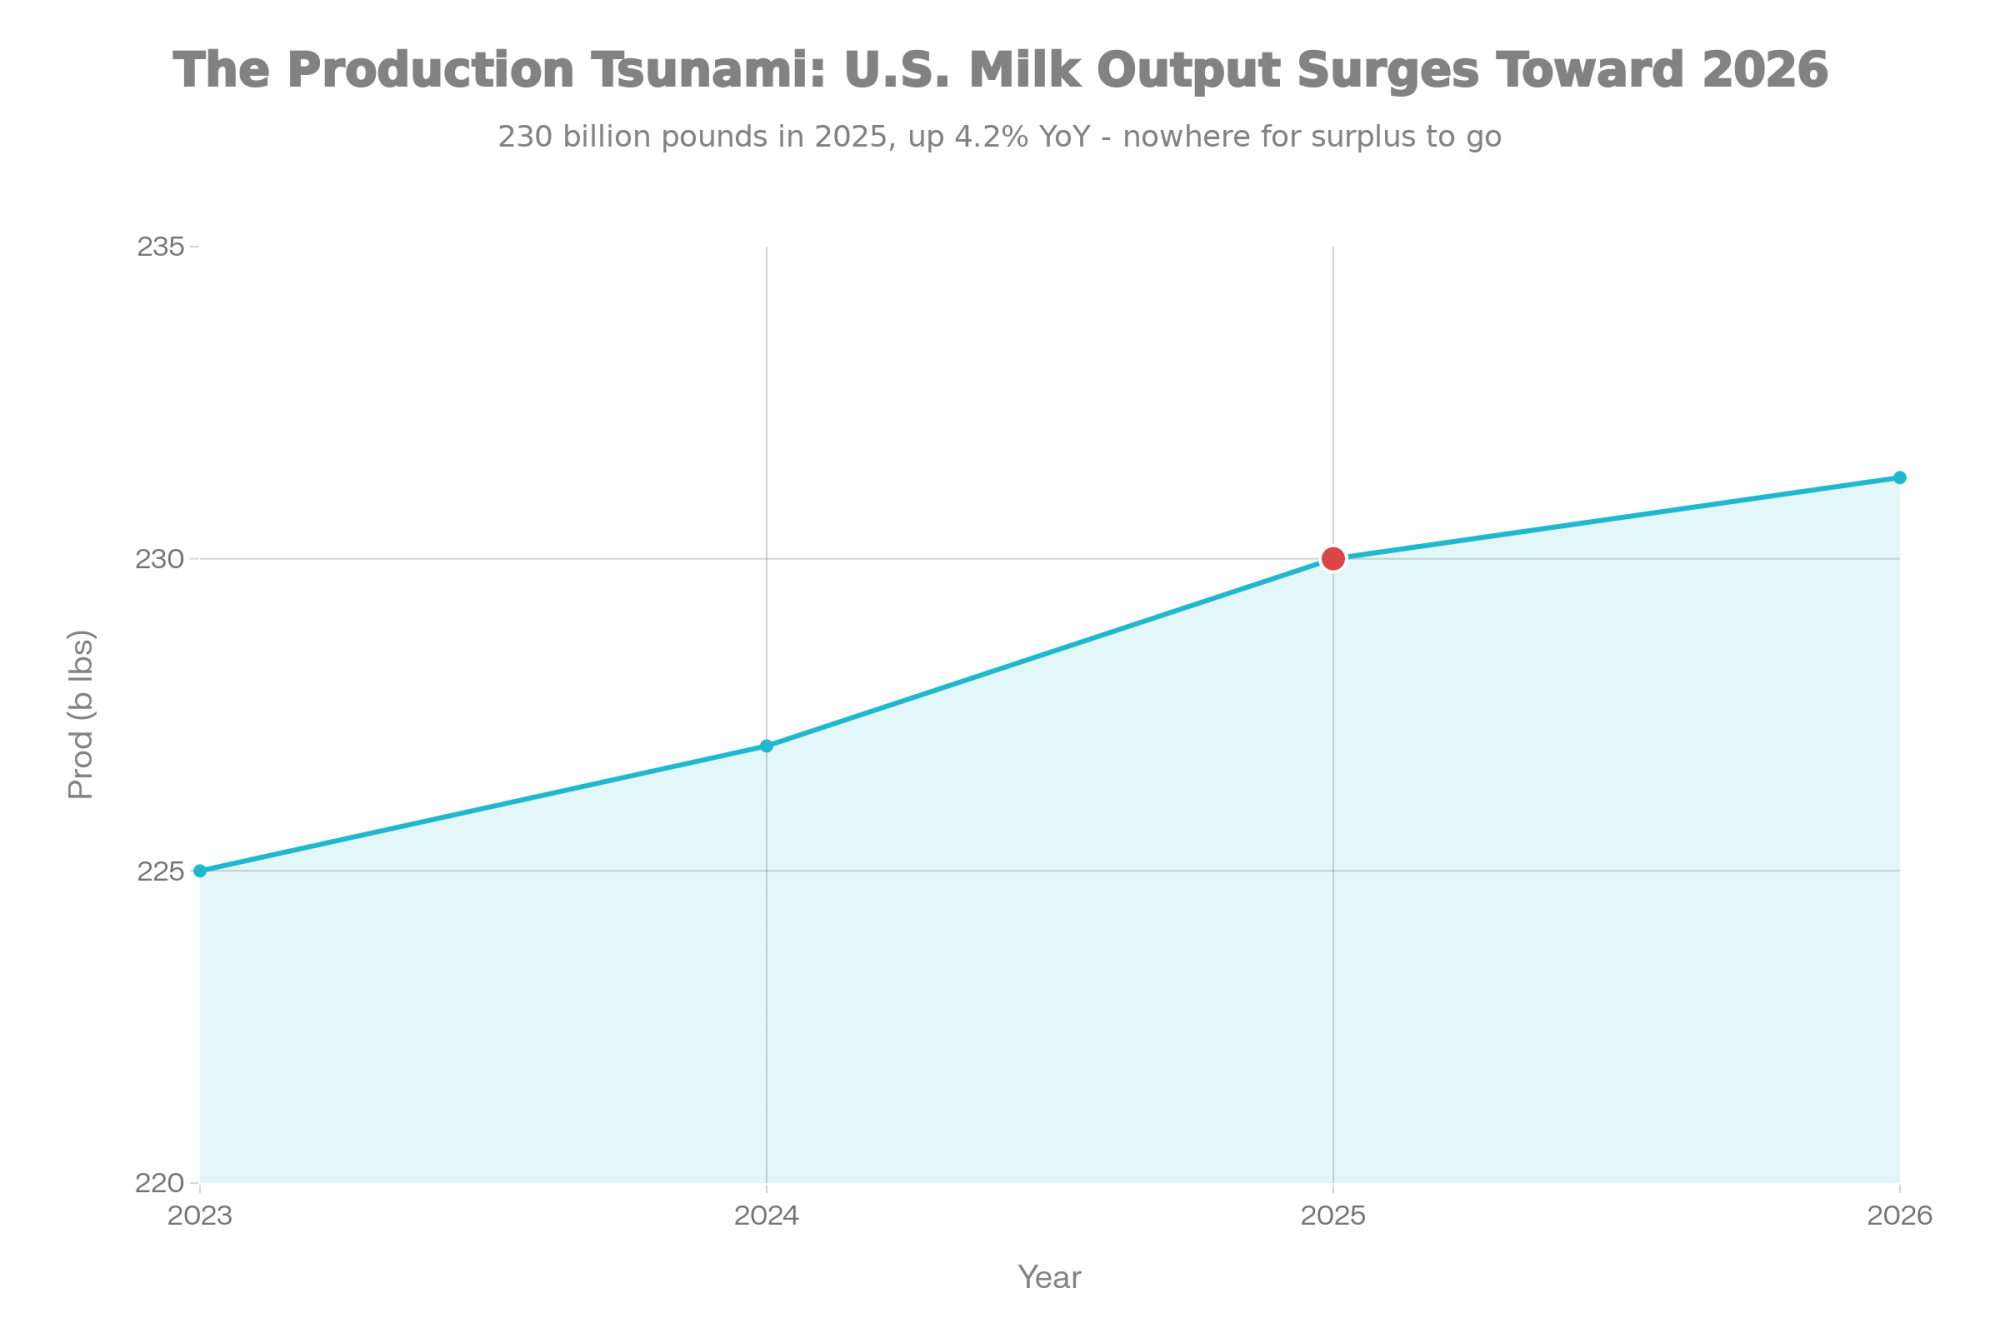
December 2025 milk production still looked strong — up 4.6% in the 24 major states with 222,000 more cows and 42 more pounds per cow. But USDA’s January 2026 WASDE pegs 2026 production at 234.3 billion pounds, up roughly 1.4% from 2025, as a thinning replacement pipeline starts to constrain herd expansion.
Geiger didn’t sugarcoat it: “The short answer is that it will be tight. Those dairy plants will require more annual milk and component production, largely butterfat and protein. And it will take many more dairy heifer calves in future years to bring the national herd back to historic levels.”
Heifer prices already reflect the squeeze, from $1,720/head in April 2023 to roughly $3,010 by mid-2025 per the USDA’s July 2025 Agricultural Prices report. Top dairy heifers in California and Minnesota auction barns were bringing upwards of $4,000 per head by mid-year 2025, according to CoBank.
Why Flat Futures Don’t Mean the Fundamentals Are Wrong
If all this tension is real, why did cheese and butter futures trade flat on report day?
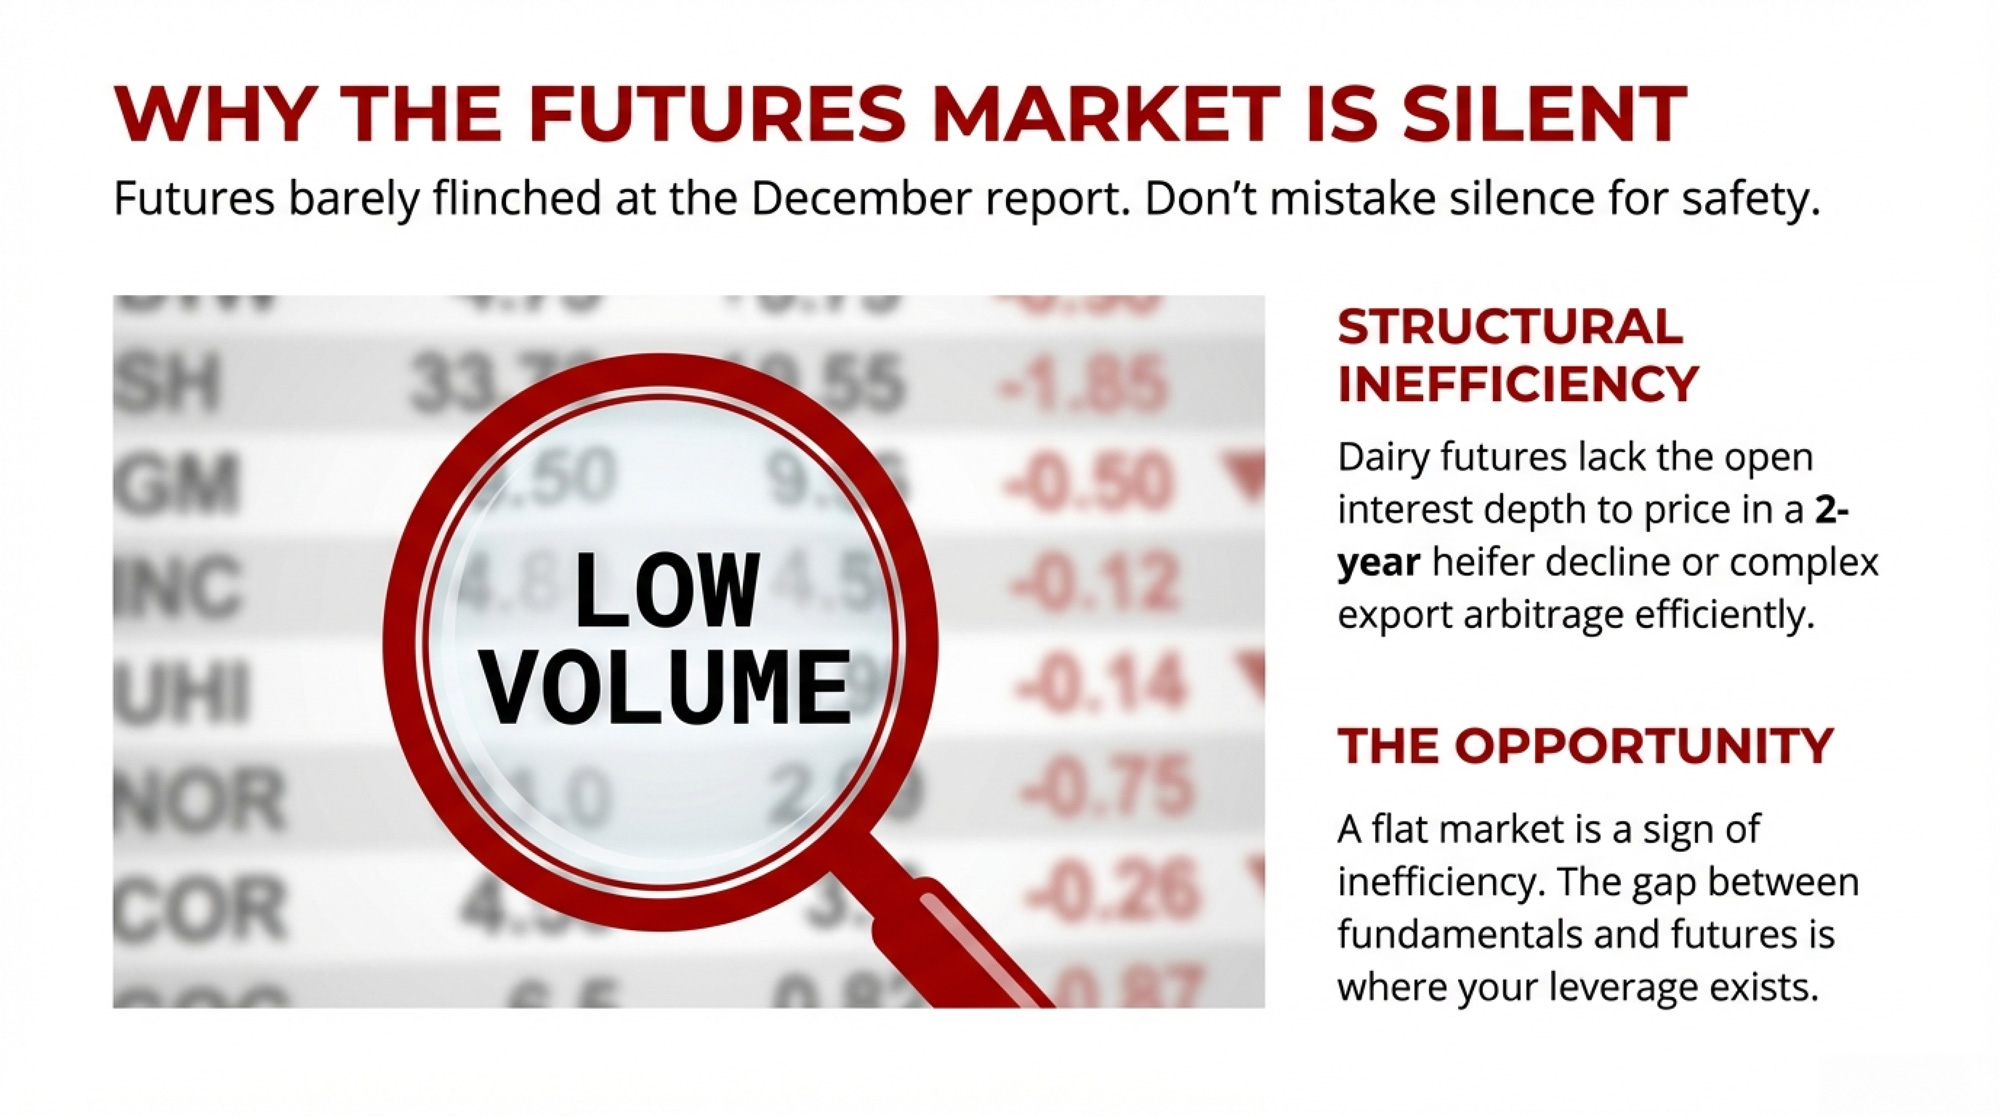
Near-term data wasn’t wildly off expectations. Cheese was already strong in November. Butter’s miss fit the ongoing “tight but not panicked” narrative. NFDM was the exception because rising stocks directly contradicted the bullish price story—a signal even a thin market could quickly process.
The deeper issue is structural. Dairy futures trade at a fraction of the open interest depth seen in cattle or hog contracts. That’s not a market that can efficiently price a two-year heifer decline or a multi-year butterfat export arbitrage. The flat response isn’t the market disagreeing with the fundamentals. It’s the market admitting it can’t fully express them.
And that gap between what futures say and what the fundamentals show? That’s where the opportunity sits for producers paying close attention.
What This Means for Your Operation
- Your butterfat is underpriced relative to global value. As of February 5, 2026: GDT AMF at roughly $2.95/lb; CME butter at approximately $1.71/lb. Your Class IV price is anchored to CME plus a bigger make allowance. Component optimization still pays inside the system, but the extra export margin sits on the processor’s ledger. The spread to watch: if CME stays below $1.80 while GDT holds above $2.50, processors have no incentive to redirect cream to domestic channels, and your Class IV component value stays compressed. Pull your last three milk checks. Compare your butterfat premium per hundredweight to the CME butter price on those settlement dates. The gap between what you’re getting and what GDT says your fat is worth — that’s the number this article is about.
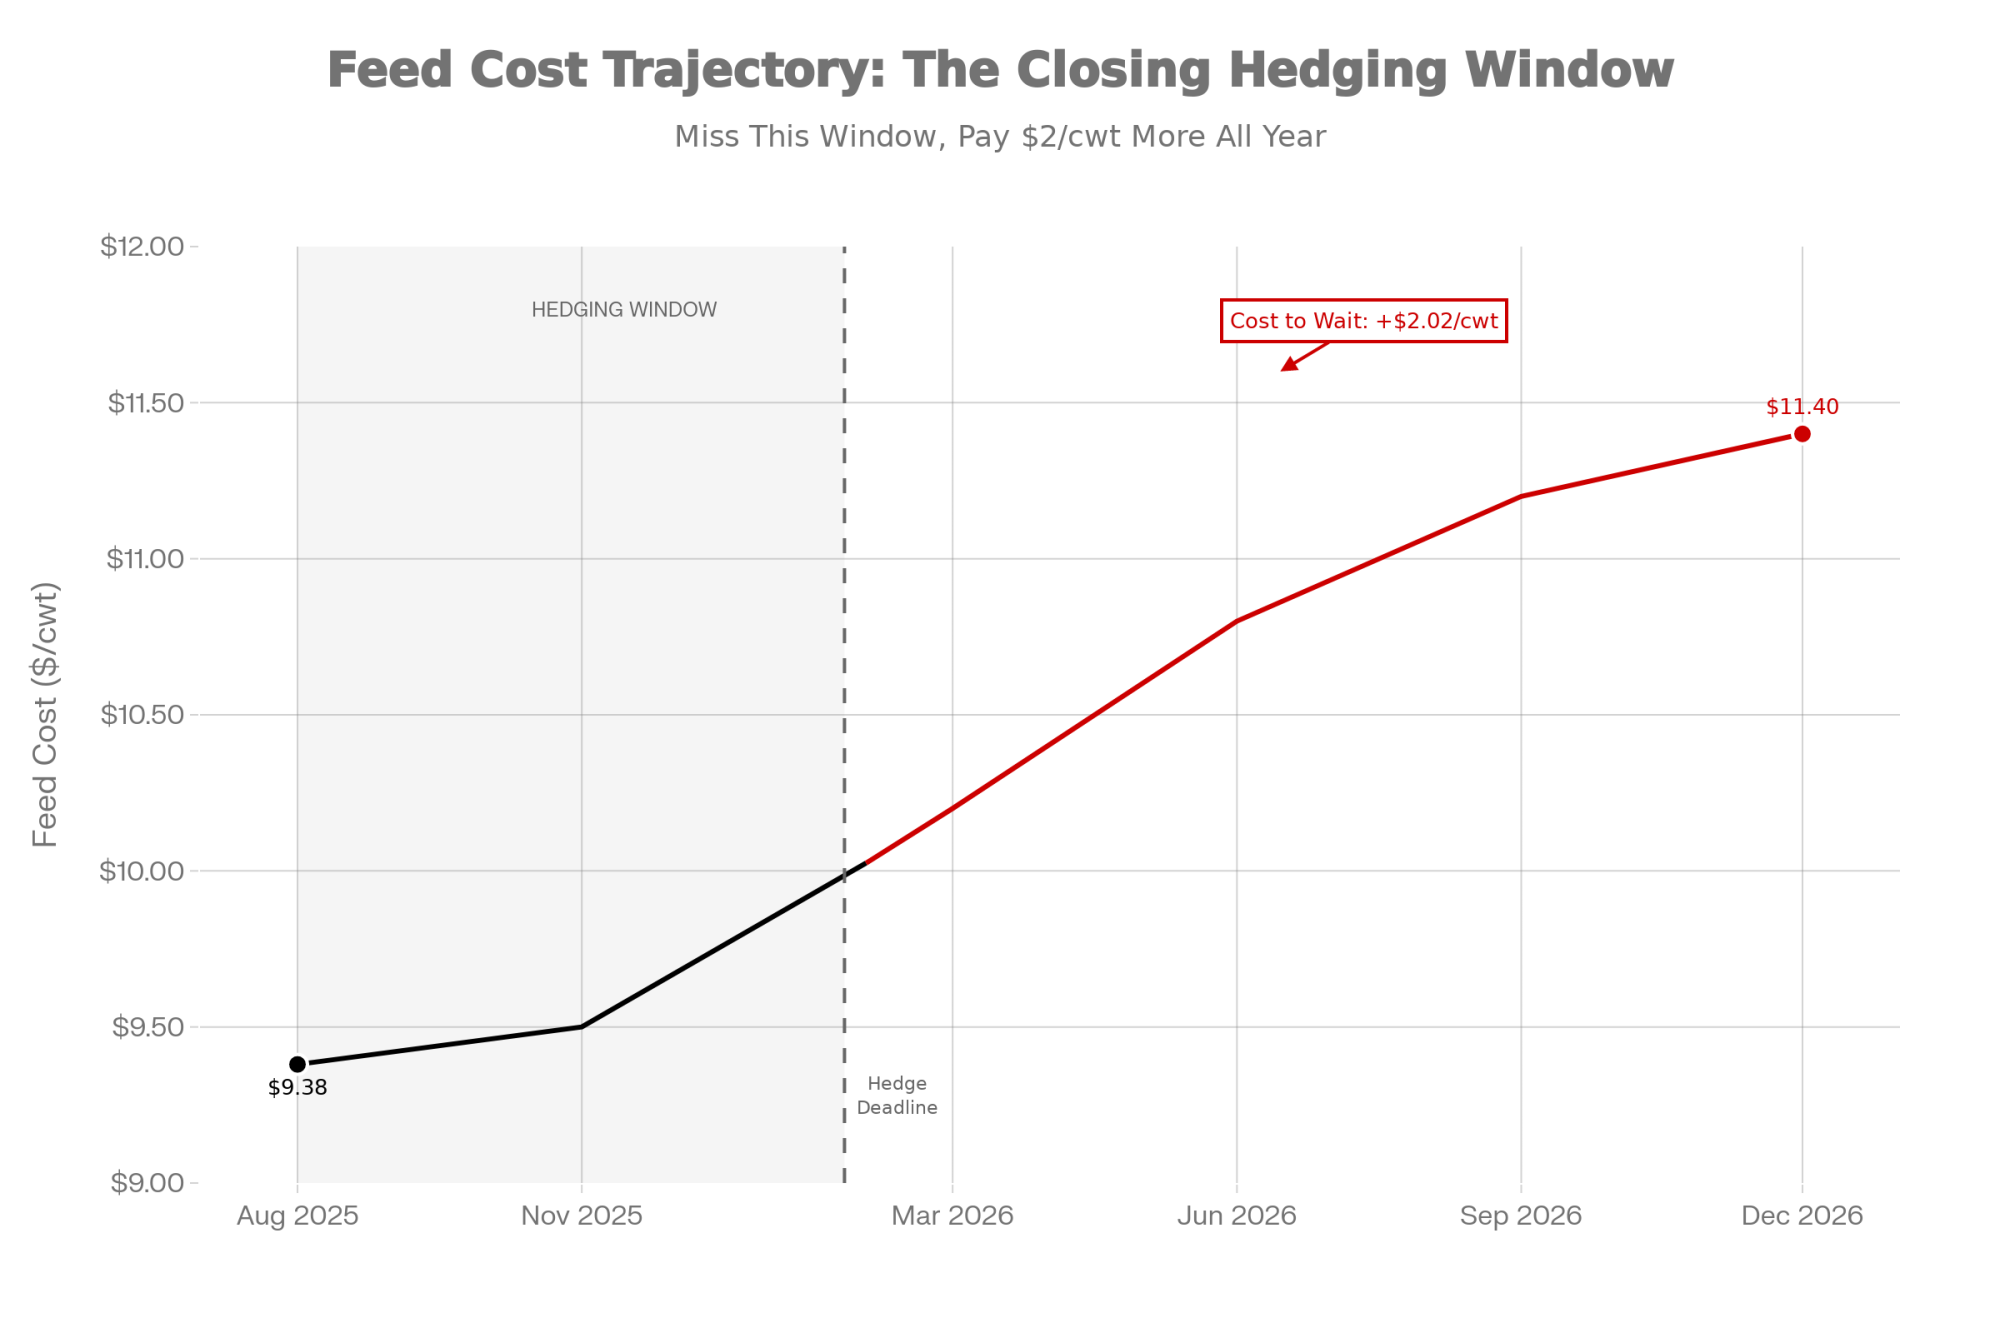
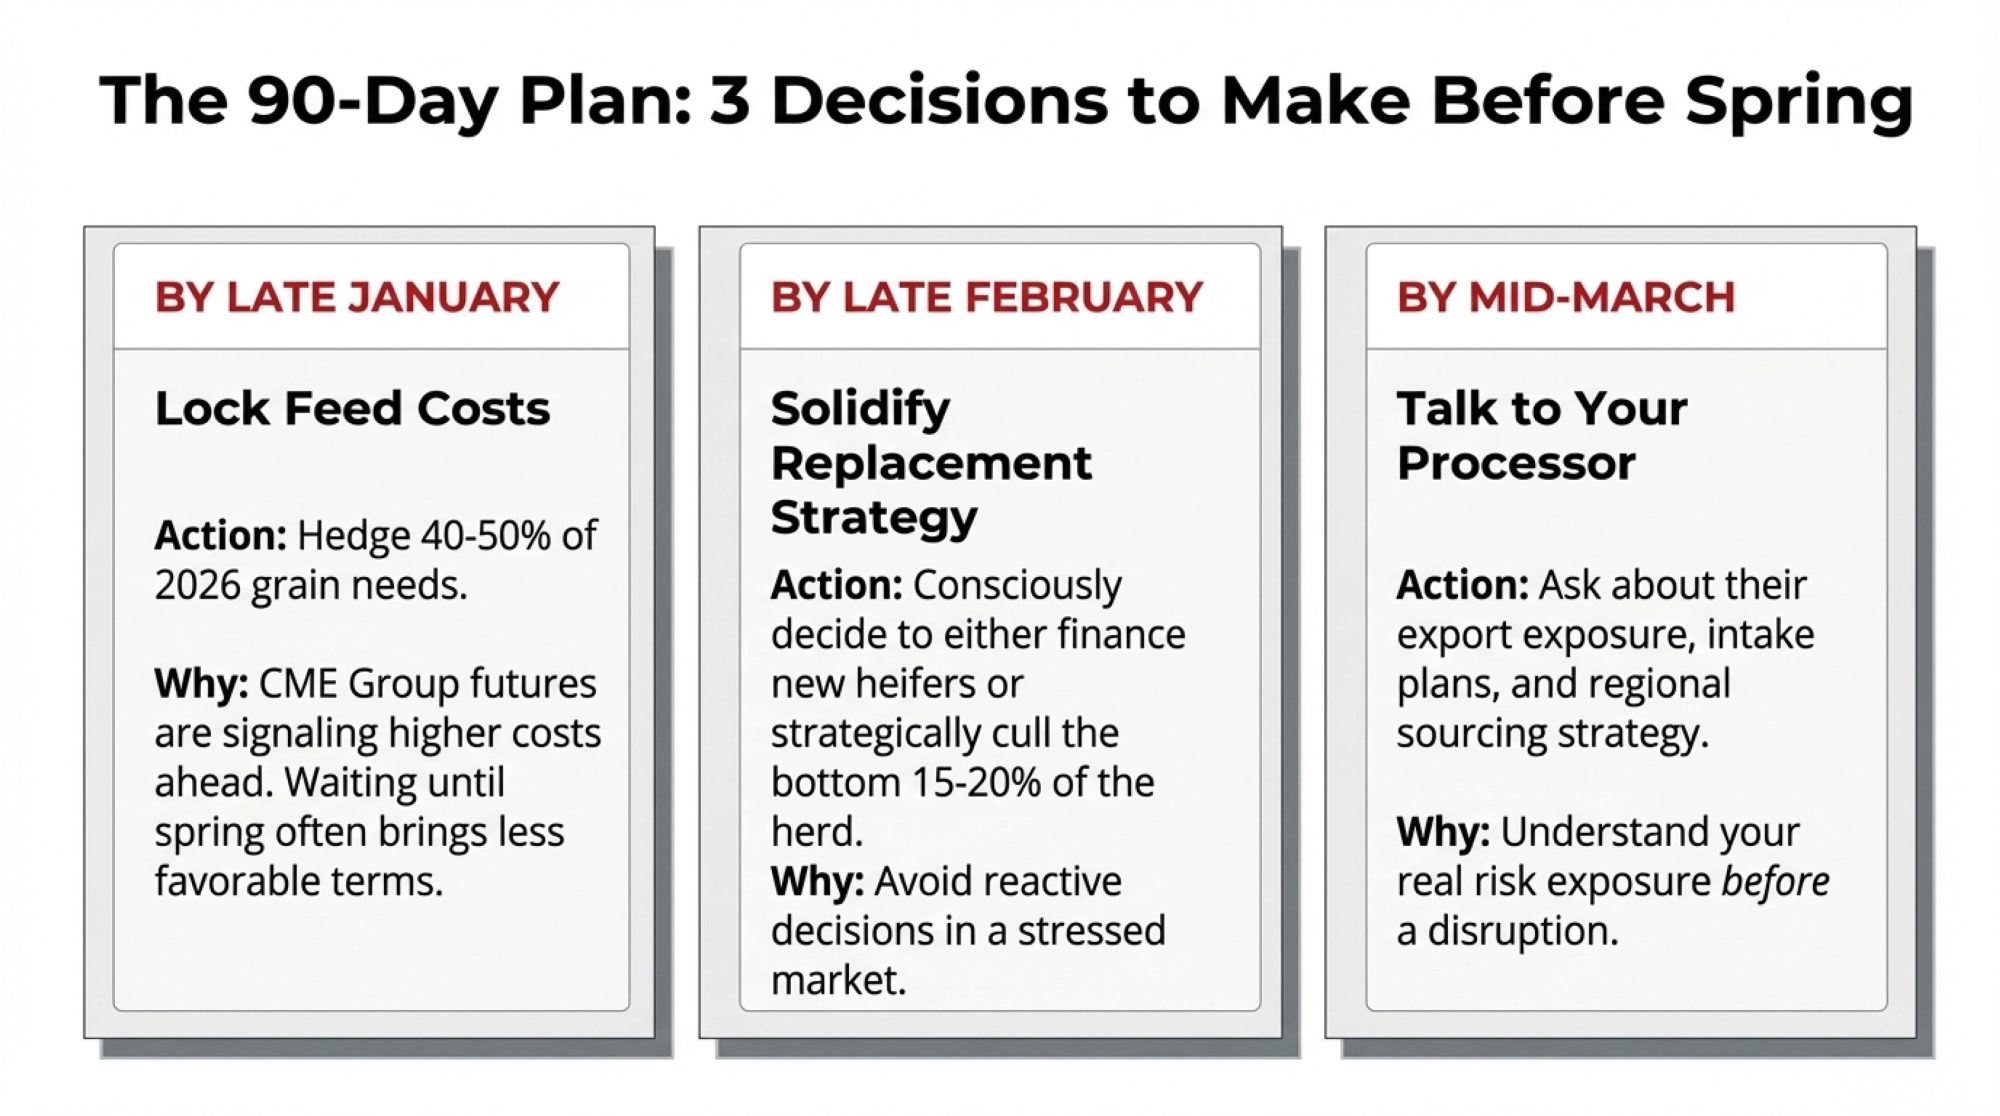
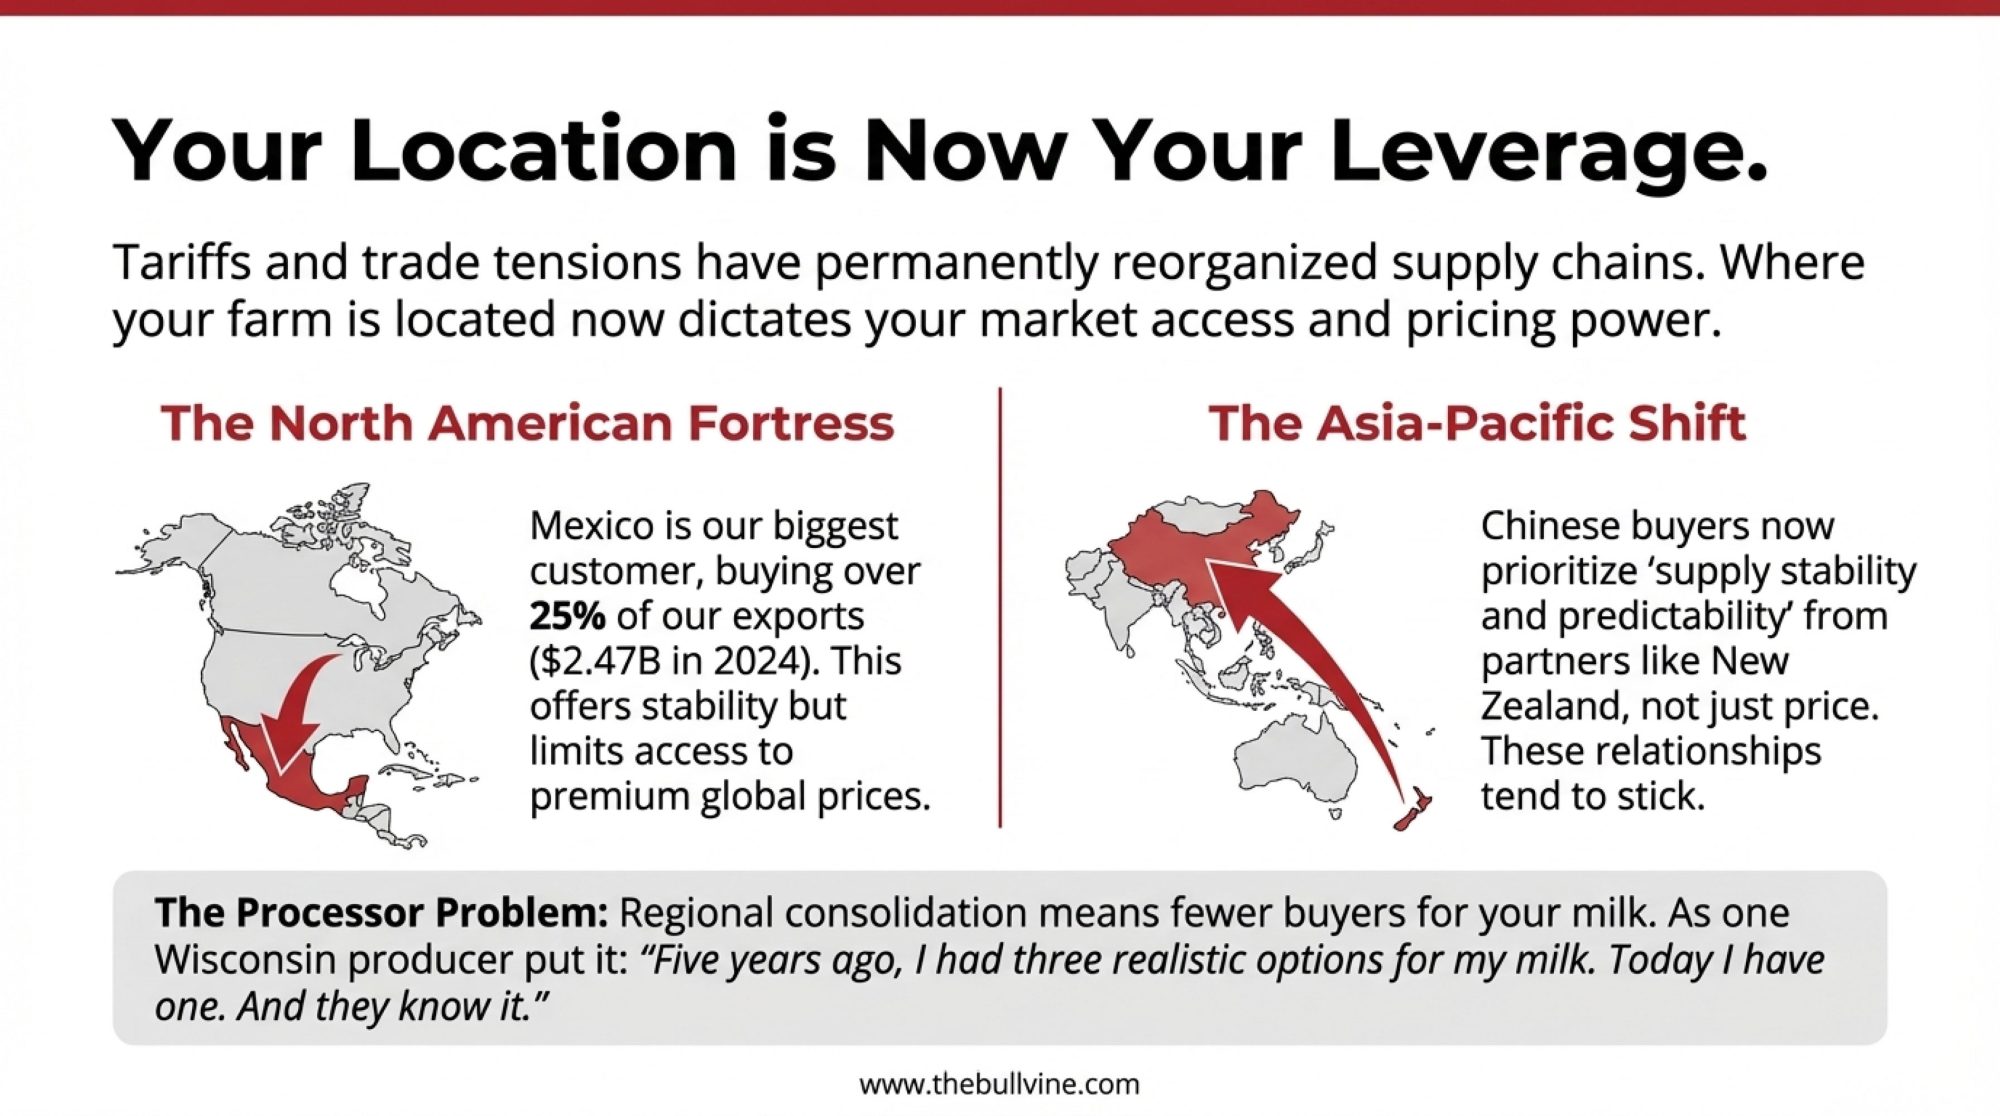
- If you’re in a deficit region, your leverage is real — but it has a shelf life. Processors in short areas are paying to secure a supply right now. That urgency fades as cooperatives formalize long-haul logistics and spring flush arrives in April–May. The most important move in the next 60 days isn’t a hedge — it’s getting written terms on component premiums, hauling, and volume commitments while plants still feel short. Twelve-to eighteen-month agreements balance security with flexibility. The trade-off: if spot premiums spike higher than your locked rate during peak shortage, you’ll watch neighbors on handshake deals get paid more. But you’ll also sleep through the months when premiums collapse post-flush.
- Watch NFDM stocks, not price. If manufacturer stocks hold above 210 million pounds through the March report while exports stay flat, that’s your signal to layer in Class IV put protection before spring flush. DRP Q2 2026 endorsements (April–June milk) are mostly written in the late-January to March window, outside of USDA report release days when sales are suspended. You want protection in place before April, not after.
- Run the heifer math before you bid. At $3,500/head (midpoint of the $3,010–$4,000 range CoBank reported) and current carrying costs — Penn State Extension’s most recent data puts total rearing costs at roughly $1.60–$2.82 per head per day depending on operation type and region — a heifer needs to enter your string within about 24 months to break even against buying a fresh cow. But retaining heifers ties up capital and bunk space for 22+ months before they generate a dollar of milk revenue. Buying springers costs more per head but puts milk in the tank within weeks. Your cash flow position — not just the per-head price — should drive this call.
- Check your Federal Order’s Class IV exposure. If you’re in Order 5 (Appalachian) running high Class I utilization, the differential increases from the June 2025 reforms may partially offset the make allowance pain — analysis found Orders 1, 5, 7, and 33 gained value under the new structure, while Order 30 (Upper Midwest) lost value. Run your margin-over-feed calculation against current component values to see where your breakeven actually sits under the new formulas.
| Federal Milk Marketing Order | Order # | Value Impact | Primary Driver |
|---|---|---|---|
| Northeast | 1 | Gained Value | Higher Class I differentials offset make allowance increases |
| Appalachian | 5 | Gained Value | High Class I utilization + differential increases |
| Southeast | 7 | Gained Value | Class I differential structure favorable |
| Upper Midwest | 30 | Lost Value | Heavy Class III/IV exposure + make allowance cuts hit hard |
| Mideast | 33 | Gained Value | Class I differential gains exceeded component losses |
Key Takeaways
- Cheese is running hot but roughly in balance thanks to record exports — November was the seventh straight month above 50,000 MT. The risk trigger: monthly exports below 45,000 MT for 2 consecutive months while new plants keep coming online.
- Butterfat is where the value gap is widest. CME butter at ~$1.71/lb vs. GDT AMF at ~$2.95/lb as of February 5, 2026, represents a $1.24/lb spread that FMMO pricing doesn’t capture for producers. Co-op members: ask what share, if any, flows back through patronage.
- NFDM sent the clearest warning in this report. Stocks up 5.6% while production fell 2.7%, and year-to-date powder exports to Southeast Asia were down 20% through November — that’s the pattern that precedes price weakness, not strength.
- The heifer shortage is real and has come at a bad time. It won’t choke production in 2026, but by 2027 — when new plants need to run full — the math stops working without more replacements than the pipeline can deliver.
- Check your DRP windows. Q2 2026 endorsements are mostly written in the late-January to March window. If NFDM stocks stay elevated and spring flush hits Class IV values, you want coverage locked before April.
The Bottom Line
The next two months aren’t about whether exports stay strong or heifers tick up another $200. They’re about whether you’ll have written terms — or still be on a handshake — when your plant decides who to lock in for the next cycle. And whether the terms you’re milking under today reflect even a fraction of what your components are actually worth on the global market.
Complete references and supporting documentation are available upon request by contacting the editorial team at editor@thebullvine.com.
Learn More
- Same Cows, $15,000 Apart: Class III Milk Price, DRP, and Your Spring 2026 Risk Plan – Arms you with a three-lane risk playbook to bridge five-figure margin gaps this spring. This guide delivers specific price triggers and DRP timing, ensuring you protect your revenue floor before the 2026 flush devalues your components.
- FMMO Reality Check: Why 2025’s $2.3 Billion Dairy Pricing Revolution Exposes the Fatal Flaw in American Milk Marketing – Exposes the structural wealth transfer built into the 2025 FMMO reforms, revealing why your pricing stays anchored while processors capture global margins. It breaks down regional arbitrage shifts, positioning you to navigate the next three years of marketing.
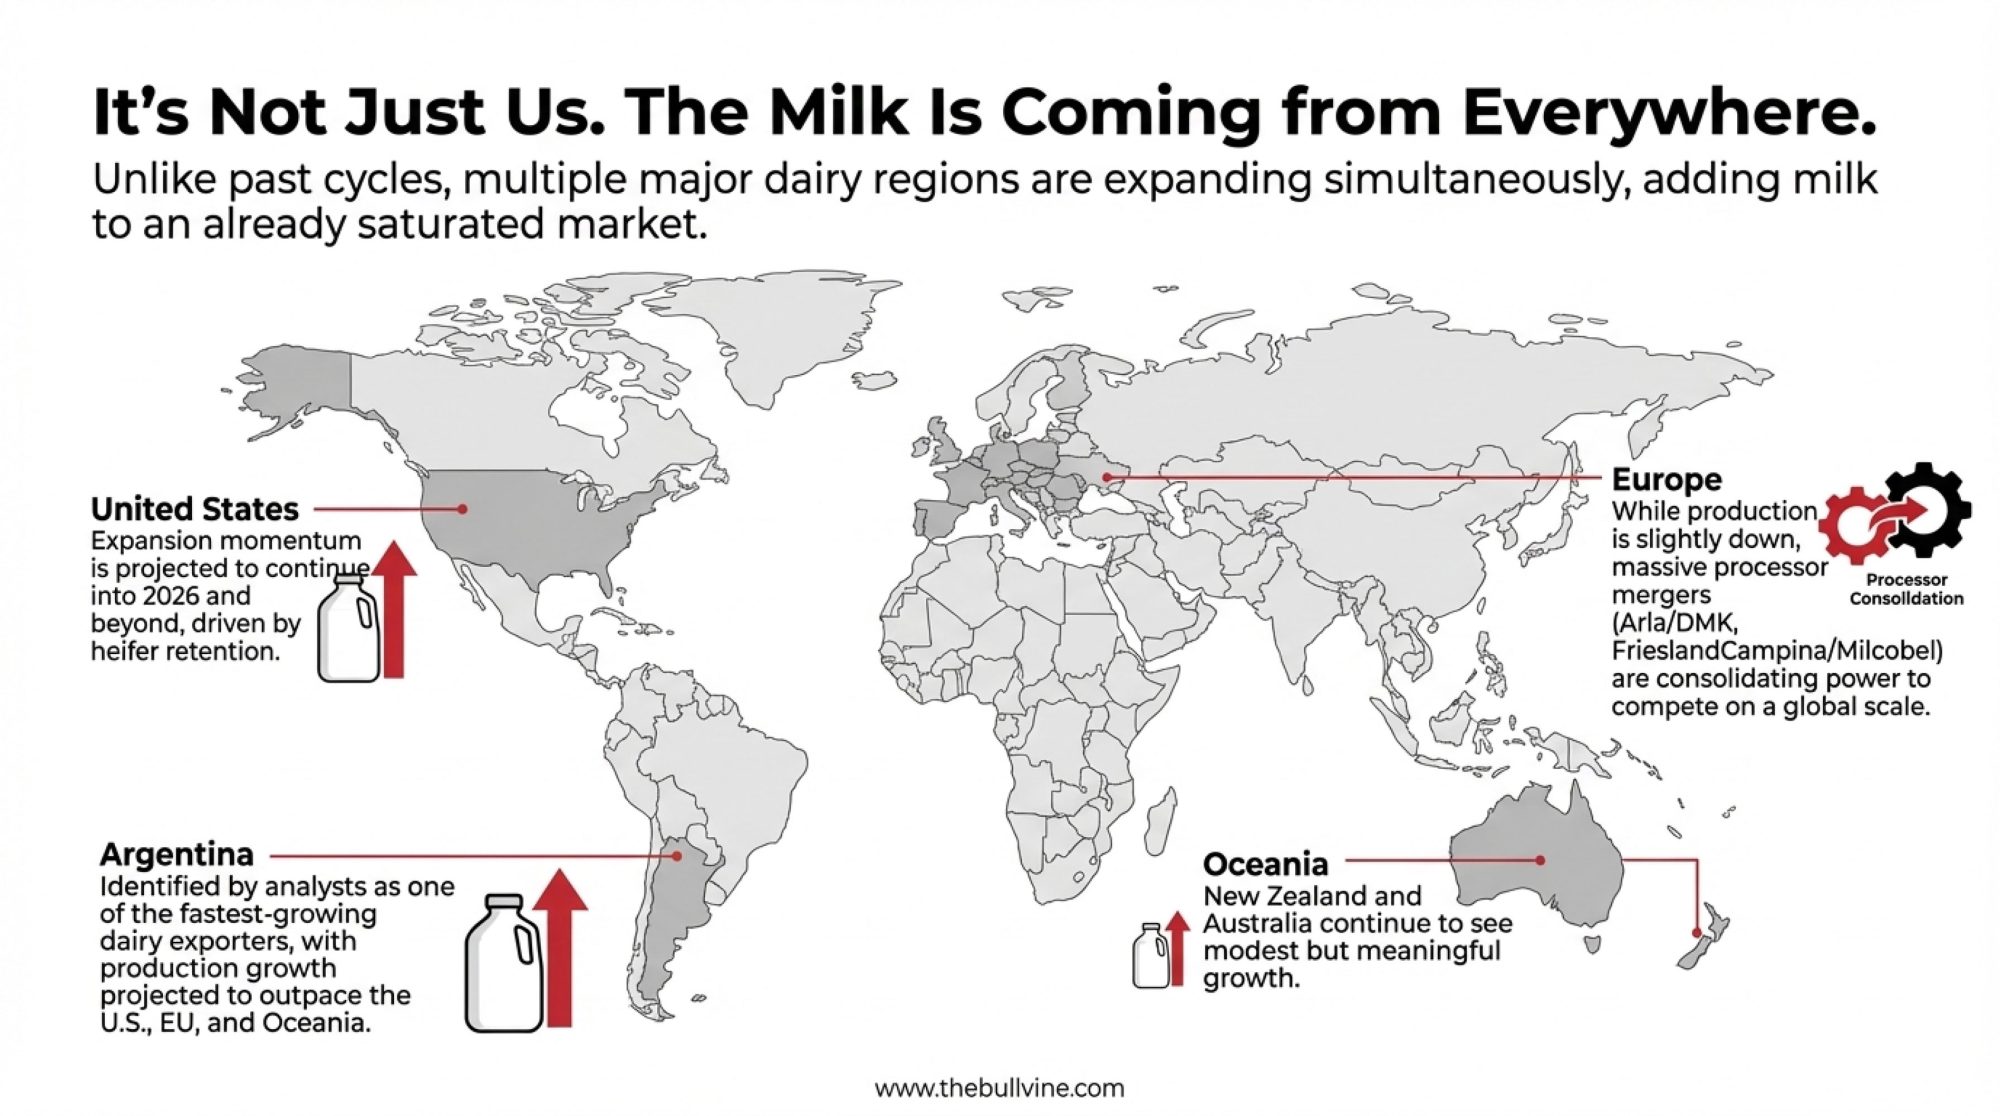
- Why Dairy Markets Can’t Self-Correct Anymore: The Hidden Forces Reshaping the Dairy Industry’s Future – Reveals why traditional market cycles are dead and how multi-revenue operations are rewriting the rules of survival. This analysis delivers the structural reset view you need to evaluate digesters and beef-on-dairy as permanent shields against commodity volatility.
 The Sunday Read Dairy Professionals Don’t Skip.
 The Sunday Read Dairy Professionals Don’t Skip.
Every week, thousands of producers, breeders, and industry insiders open Bullvine Weekly for genetics insights, market shifts, and profit strategies they won’t find anywhere else. One email. Five minutes. Smarter decisions all week.