Genomics-fueled butterfat surge crashes cream prices, sparks global dairy export gold rush. Can farmers adapt?
EXECUTIVE SUMMARY: Record U.S. butterfat production – driven by genetic breakthroughs and precision feeding – is flooding markets, slashing cream multiples to decade lows while creating unprecedented cheese/butter export opportunities. Despite milk volume growing just 0.9% in March 2025, butterfat output surged 3%, pressuring domestic prices but positioning U.S. products $1+/lb below global competitors. While exports hit 13-month highs, powder markets struggle amid trade wars and uncompetitive pricing. Farmers face tightening margins as component-focused breeding collides with volatile global demand, forcing strategic culling decisions amid record beef prices.
KEY TAKEAWAYS:
- Genetic goldmine becomes double-edged sword: 4.36% butterfat tests boost processor yields but create fat gluts, cratering cream multiples below 1.0 in key regions.
- Export lifeline emerges: U.S. cheese trades at 47¢/lb discount to global markets, butter exports hit 2014-level volumes as domestic surplus meets international shortages.
- Powder sector stumbles: NDM/SMP exports drop 20-28% as U.S. prices lag EU/Oceania, while China’s 84% whey tariffs cripple a critical market.
- Margin squeeze accelerates: IOFC margins projected below $12/cwt by summer 2025 despite $145/cwt cull cow payouts tempting herd reductions.

The U.S. dairy industry is witnessing a fundamental transformation in 2025, driven by a genomics-fueled component revolution flooding markets with butterfat while creating unprecedented export opportunities. Record-breaking 4.36% butterfat tests in March triggered a cascade effect – depressing domestic cream values while propelling American cheese and butter exports through newly competitive global pricing. This analysis explores how this component boom is reshaping market dynamics and what savvy producers should watch for in the months ahead.
THE COMPONENT REVOLUTION HITS OVERDRIVE
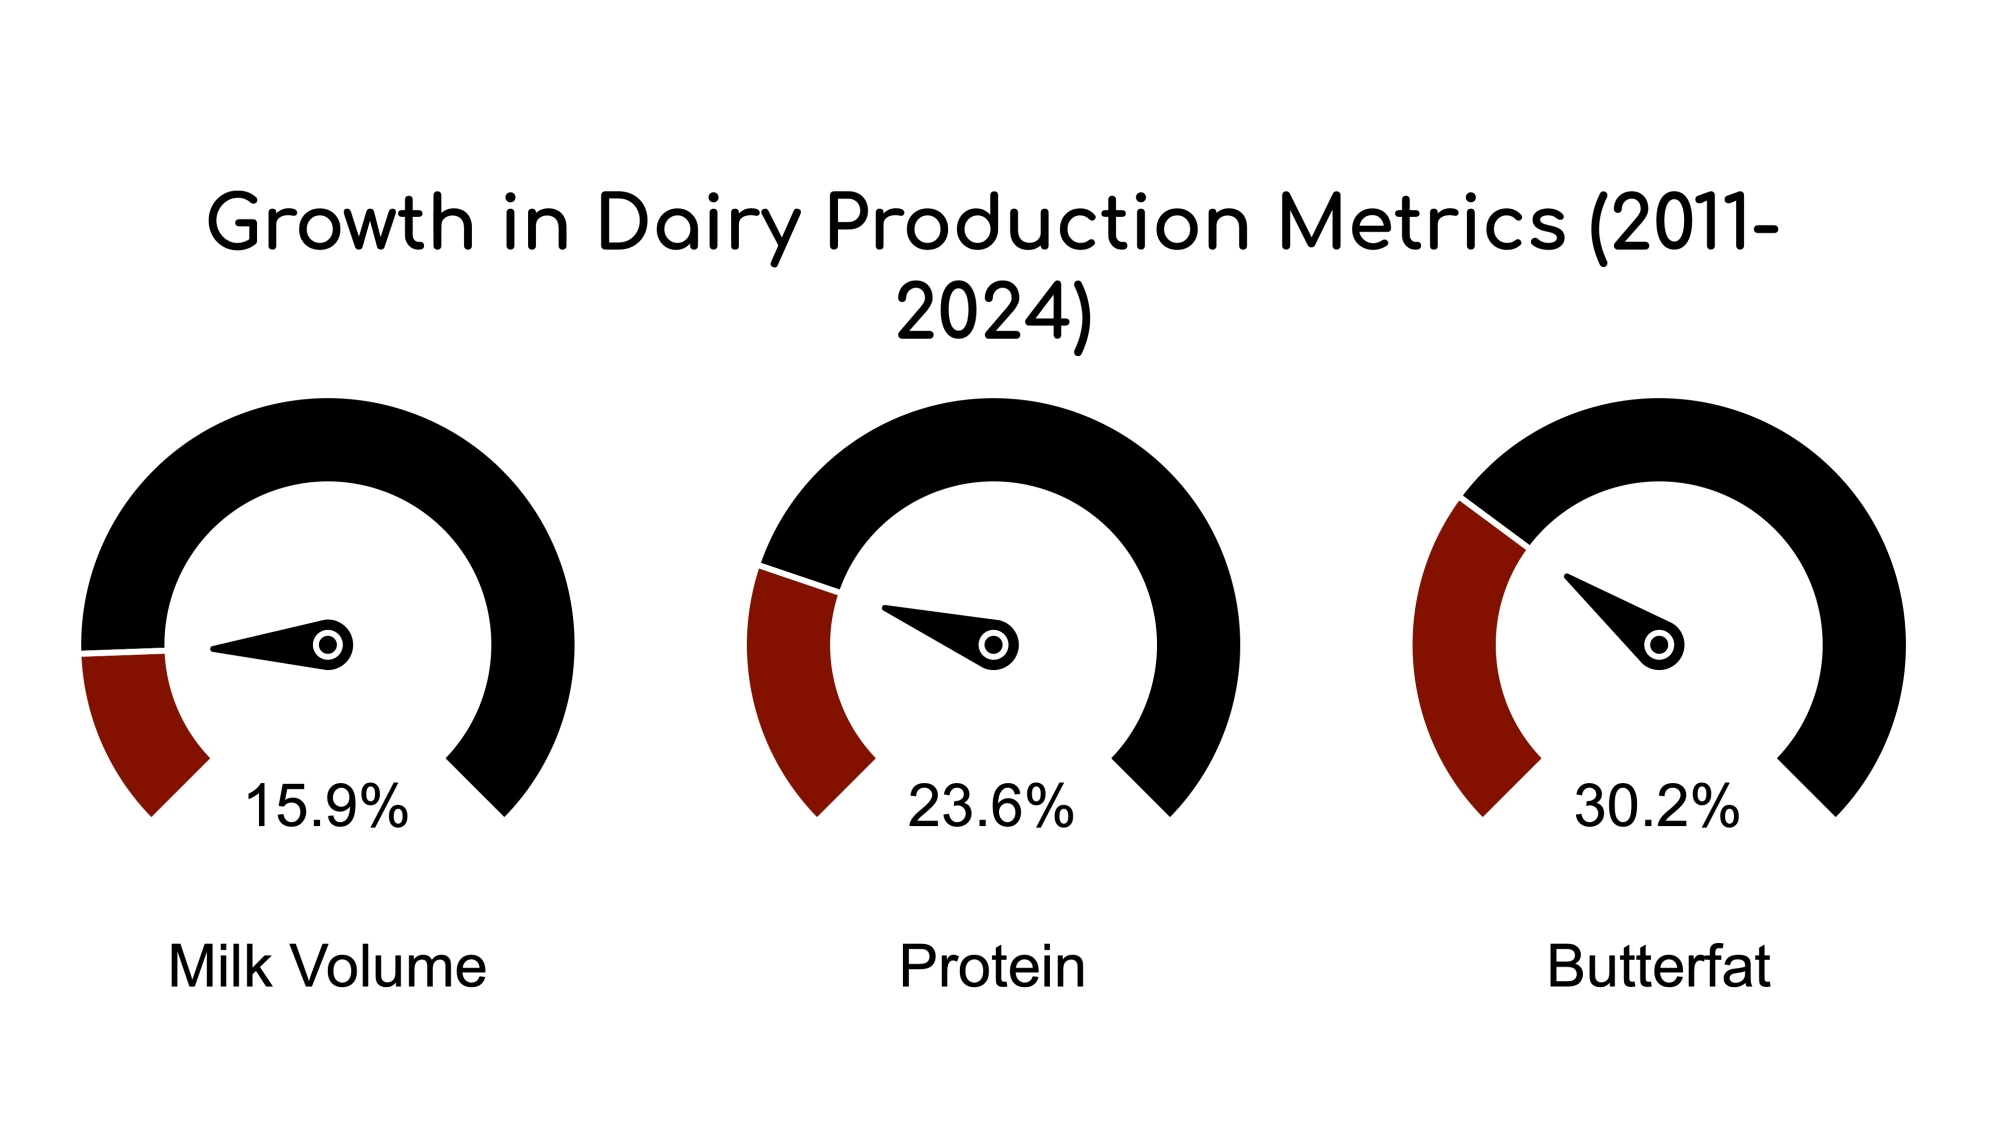
American dairy cows are becoming butterfat-producing powerhouses, shattering previous production records and fundamentally altering market dynamics. USDA’s Agricultural Prices report confirmed March’s average butterfat test hit an eye-popping 4.36% – yet another monthly record in what’s becoming a regular occurrence across U.S. dairy herds.
While overall milk volume grew a modest 0.9% year-over-year in March, total butterfat production surged by 3%, pumping an additional 25.25 million pounds of fat into the market compared to March 2024. This widening gap between volume and component growth is no accident – it’s the direct result of targeted breeding programs and precision feeding strategies paying off dramatically.
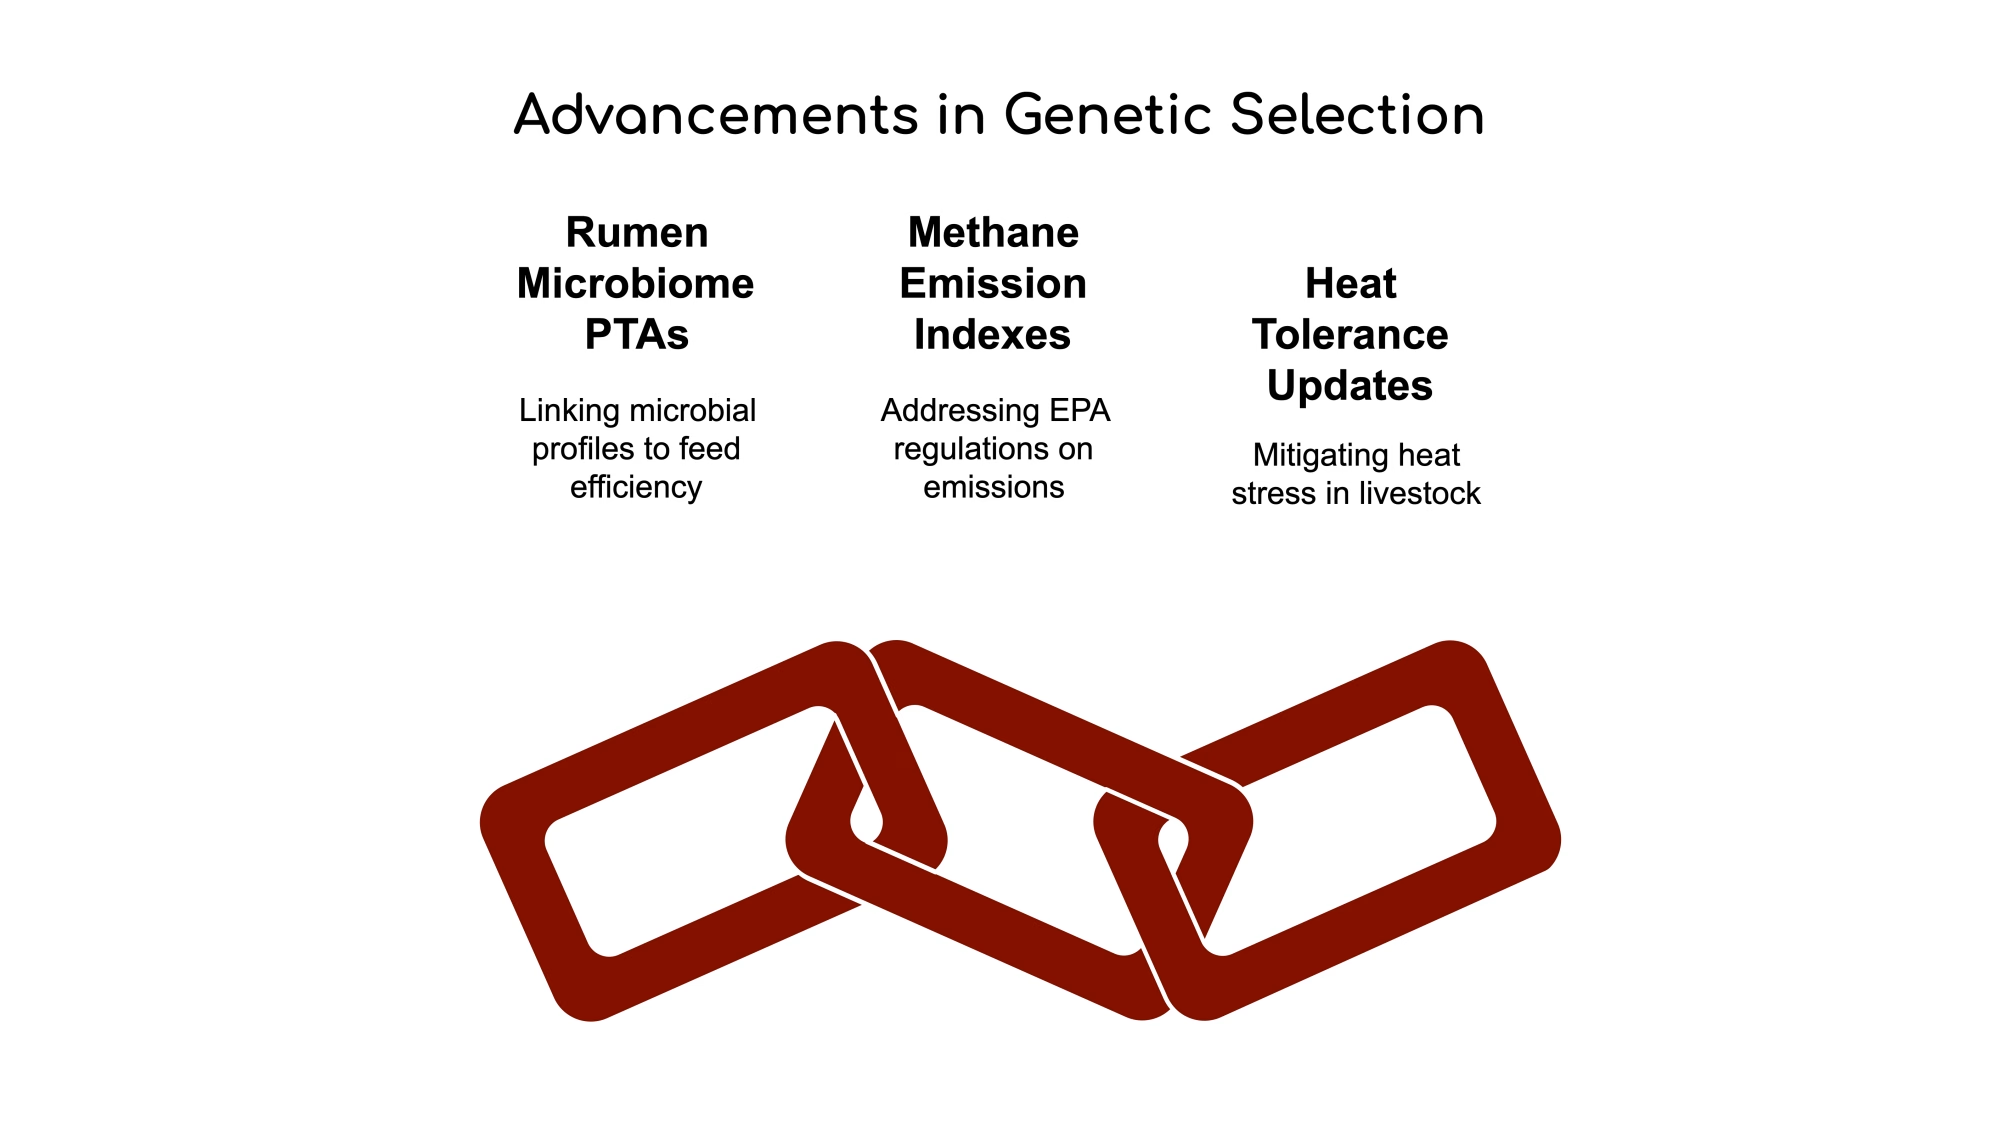
“This transformation is primarily driven by two interconnected factors: advanced genetic selection strategies and sophisticated feed management,” explains industry analysts monitoring the trend. Genomic testing allows producers to predict approximately 70% of a heifer calf’s genetic potential for traits like butterfat production before she matures, enabling highly targeted breeding decisions compounding with each generation.
The nutritional side can’t be overlooked either. Dairy nutritionists have fine-tuned rations to maximize component expression, focusing on effective fiber levels, non-fiber carbohydrate balance, and strategic fat supplementation that optimizes rumen function for butterfat synthesis.
CREAM MARKETS FEEL THE PRESSURE
The flood of additional butterfat has hit cream markets with force. Cream multiples – the ratio determining cream’s value relative to butter prices – have been trending downward since mid-February, with early May values sitting below five-year averages across all U.S. regions.
The regional breakdown tells the story:
- East: Multiples for All Classes ranged from 1.05 to 1.18
- Midwest: Multiples for All Classes ranged from 1.00 to 1.20
- West: Multiples for All Classes dipped as low as 0.85 and peaked at just 1.18
This decline reflects fundamental market looseness. USDA’s Dairy Market News has consistently reported cream as “available,” “plentiful,” or “more than sufficient” – particularly in the Upper Midwest and Western U.S. The situation became especially evident in March, when multiples dipped below the critical threshold of 1.00 in some regions, meaning cream traded at or below its intrinsic butterfat value.
Butter churns are running full tilt to absorb the available cream supply, while ice cream manufacturers haven’t ramped up seasonal production as quickly as anticipated. Even with these outlets operating, the market simply can’t absorb all the butterfat produced at prices that would maintain historical cream values.
MILK OVERSUPPLY BEYOND SEASONAL NORMS
The component surge isn’t happening in isolation – raw milk markets also show signs of significant oversupply beyond typical seasonal patterns. The Upper Midwest spot milk basis has crashed to $5 per hundredweight below Class III in Week 18, representing the lowest level for that week in at least a decade (outside the anomalous 2023).
“This Week 18 basis level was noted as the lowest for that specific week in at least a decade, excluding the outlier year of 2023,” market analysts reported. What’s particularly concerning is the deviation from normal seasonal patterns. While spot milk discounts typically begin narrowing by late April or early May, they’ve continued widening over four consecutive weeks this year.
The depth of discounts speaks volumes about market conditions, with spot milk sometimes trading as low as $7.00 under Class III in some transactions. March milk production across the 24 major dairy states totaled 19.0 billion pounds, up 1.0% from March 2024, continuing the production growth trend.
Despite these signs of oversupply, the USDA raised its 2025 milk production forecast by 0.7 billion pounds to 226.9 billion pounds in its April World Agricultural Supply and Demand Estimates (WASDE), projecting higher cow numbers and improved per-cow yield.
GLOBAL PRICE GAPS SPARK EXPORT BOOM
The silver lining in this cloud of domestic oversupply is the remarkable export opportunity created by the widening price gap between U.S. and global dairy prices. American cheese and butter are now priced at dramatic discounts to international competitors, turning export channels into crucial pressure-release valves for the industry.
Cheese’s Global Discount Drives Record Exports
U.S. cheddar blocks trading at $1.76 per pound on the CME spot market represent an astonishing bargain on the world stage. Compare that to:
- Global Dairy Trade (GDT) auction Cheddar: $2.23/lb (47¢ premium)
- European young Gouda: $2.325/lb (56¢ premium)
This price advantage has catapulted U.S. cheese exports to extraordinary heights. January-February 2025 cheese exports totaled 201.5 million pounds, jumping 12% compared to 2024, with export value surging even more dramatically – up 22% to $458.1 million.
“January 2025 set a monthly record for U.S. cheese export volume, continuing a trend of year-over-year growth that has persisted for over 13 consecutive months,” according to market reports. While Mexico remains the largest destination, absorbing 61.4 million pounds, the fastest growth is coming from diversified markets – South Korea (+40%), Japan (+10%), and Australia (+37%).
Butter’s Unexpected Export Renaissance
Even more dramatic is the transformation in butter markets. Historically not a major export player due to product specification differences, U.S. butter exports are soaring on the strength of an unprecedented price advantage:
- U.S. CME spot butter: $2.33/lb
- Oceania butter: $3.48/lb
- German butter: $3.70/lb
This $1.00+ per pound discount has overcome traditional barriers to U.S. butter exports. January-February 2025 butter exports reached 18.6 million pounds, an 84% increase over 2024 and the highest for that period since 2014. Total butterfat exports (including anhydrous milkfat) hit 7,101 metric tons in January alone – a 145% year-over-year surge and the largest monthly volume since 2014.
“The primary driver for this export boom is the price differential itself,” market analysts explain. “Ample domestic cream supplies resulting from high component milk production, coupled with strong butter production and inventories, have exerted downward pressure on U.S. butter prices.”
PRODUCTION STRATEGY: NAVIGATING THE COMPONENT ECONOMY
For dairy producers, the current market presents both challenges and opportunities. Strong margins at the end of 2024 encouraged production growth, but conditions are shifting rapidly as 2025 progresses.
The Income Over Feed Cost (IOFC) margin peaked above $15.00/cwt in September 2024 and has been steadily contracting, falling to $13.12/cwt in February 2025. USDA forecasts suggest further compression, with margins potentially dipping below $12.00/cwt through mid-2025. This tightening occurs despite relatively favorable feed costs compared to recent years.
Near-record high beef prices create another strategic consideration. Cull cow prices exceeding $145/cwt offer a potential cash flow opportunity or exit strategy for producers facing margin pressure. This dynamic, combined with tight replacement heifer inventories, is expected to moderate herd expansion despite favorable milk-to-feed ratios.
Producers must now weigh several key factors in their production strategies:
- Component optimization remains profitable even as fluid volume markets weaken
- Culling decisions take on greater importance with high beef values
- Herd expansion carries additional risk as global markets become more volatile
- Risk management tools become essential as margins tighten
MARKET OUTLOOK: EXPORTS TO DETERMINE PRICE DIRECTION
The U.S. dairy industry faces a pivotal moment where burgeoning domestic supply, particularly milk components, sits in tension with growing reliance on export markets. The component revolution continues flooding markets with valuable solids, creating opportunities for processors but pressuring cream and fat-based commodity prices.
The crucial question is whether robust export demand, fueled by America’s price advantage, can continue absorbing these growing surpluses. Several factors will determine the market path forward:
Positive Factors
- Significant new processing capacity (primarily cheese) coming online will create additional demand for components
- Price competitiveness in global markets should continue supporting exports to Mexico, Asia, and emerging destinations
- Domestic consumption remains relatively stable despite price pressures
Risk Factors
- Any loss of the current export price advantage could quickly reduce overseas sales
- Trade policy disruptions remain a constant threat, as evidenced by China’s tariffs on U.S. whey products
- Economic conditions could weaken consumer demand domestically or internationally
The verdict? Export strength in cheese and butter markets provides a reason for cautious optimism, but producers should maintain flexibility and firm risk management plans as component markets evolve. The growing integration of U.S. dairy into global markets brings opportunity and exposure to international price volatility that requires sharp business management.
The message for dairy farmers weathering these shifting markets is clear: the component revolution isn’t slowing down. Those who adapt to this new reality – optimizing genetics and nutrition for component production while managing costs and utilizing risk management tools – will be best positioned to thrive in the emerging global component economy.
The U.S. dairy industry is witnessing a fundamental transformation in 2025, driven by a genomics-fueled component revolution flooding markets with butterfat while creating unprecedented export opportunities. Record-breaking 4.36% butterfat tests in March triggered a cascade effect – depressing domestic cream values while propelling American cheese and butter exports through newly competitive global pricing. This analysis explores how this component boom is reshaping market dynamics and what savvy producers should watch for in the months ahead.
THE COMPONENT REVOLUTION HITS OVERDRIVE
American dairy cows are becoming butterfat-producing powerhouses, shattering previous production records and fundamentally altering market dynamics. USDA’s Agricultural Prices report confirmed March’s average butterfat test hit an eye-popping 4.36% – yet another monthly record in what’s becoming a regular occurrence across U.S. dairy herds.
While overall milk volume grew a modest 0.9% year-over-year in March, total butterfat production surged by 3%, pumping an additional 25.25 million pounds of fat into the market compared to March 2024. This widening gap between volume and component growth is no accident – it’s the direct result of targeted breeding programs and precision feeding strategies paying off dramatically.
“This transformation is primarily driven by two interconnected factors: advanced genetic selection strategies and sophisticated feed management,” explains industry analysts monitoring the trend. Genomic testing allows producers to predict approximately 70% of a heifer calf’s genetic potential for traits like butterfat production before she matures, enabling highly targeted breeding decisions compounding with each generation.
The nutritional side can’t be overlooked either. Dairy nutritionists have fine-tuned rations to maximize component expression, focusing on effective fiber levels, non-fiber carbohydrate balance, and strategic fat supplementation that optimizes rumen function for butterfat synthesis.
CREAM MARKETS FEEL THE PRESSURE
The flood of additional butterfat has hit cream markets with force. Cream multiples – the ratio determining cream’s value relative to butter prices – have been trending downward since mid-February, with early May values sitting below five-year averages across all U.S. regions.
The regional breakdown tells the story:
- East: Multiples for All Classes ranged from 1.05 to 1.18
- Midwest: Multiples for All Classes ranged from 1.00 to 1.20
- West: Multiples for All Classes dipped as low as 0.85 and peaked at just 1.18
This decline reflects fundamental market looseness. USDA’s Dairy Market News has consistently reported cream as “available,” “plentiful,” or “more than sufficient” – particularly in the Upper Midwest and Western U.S. The situation became especially evident in March, when multiples dipped below the critical threshold of 1.00 in some regions, meaning cream traded at or below its intrinsic butterfat value.
Butter churns are running full tilt to absorb the available cream supply, while ice cream manufacturers haven’t ramped up seasonal production as quickly as anticipated. Even with these outlets operating, the market simply can’t absorb all the butterfat produced at prices that would maintain historical cream values.
MILK OVERSUPPLY BEYOND SEASONAL NORMS
The component surge isn’t happening in isolation – raw milk markets also show signs of significant oversupply beyond typical seasonal patterns. The Upper Midwest spot milk basis has crashed to $5 per hundredweight below Class III in Week 18, representing the lowest level for that week in at least a decade (outside the anomalous 2023).
“This Week 18 basis level was noted as the lowest for that specific week in at least a decade, excluding the outlier year of 2023,” market analysts reported. What’s particularly concerning is the deviation from normal seasonal patterns. While spot milk discounts typically begin narrowing by late April or early May, they’ve continued widening over four consecutive weeks this year.
The depth of discounts speaks volumes about market conditions, with spot milk sometimes trading as low as $7.00 under Class III in some transactions. March milk production across the 24 major dairy states totaled 19.0 billion pounds, up 1.0% from March 2024, continuing the production growth trend.
Despite these signs of oversupply, the USDA raised its 2025 milk production forecast by 0.7 billion pounds to 226.9 billion pounds in its April World Agricultural Supply and Demand Estimates (WASDE), projecting higher cow numbers and improved per-cow yield.
GLOBAL PRICE GAPS SPARK EXPORT BOOM
The silver lining in this cloud of domestic oversupply is the remarkable export opportunity created by the widening price gap between U.S. and global dairy prices. American cheese and butter are now priced at dramatic discounts to international competitors, turning export channels into crucial pressure-release valves for the industry.
Cheese’s Global Discount Drives Record Exports
U.S. cheddar blocks trading at $1.76 per pound on the CME spot market represent an astonishing bargain on the world stage. Compare that to:
- Global Dairy Trade (GDT) auction Cheddar: $2.23/lb (47¢ premium)
- European young Gouda: $2.325/lb (56¢ premium)
This price advantage has catapulted U.S. cheese exports to extraordinary heights. January-February 2025 cheese exports totaled 201.5 million pounds, jumping 12% compared to 2024, with export value surging even more dramatically – up 22% to $458.1 million.
“January 2025 set a monthly record for U.S. cheese export volume, continuing a trend of year-over-year growth that has persisted for over 13 consecutive months,” according to market reports. While Mexico remains the largest destination, absorbing 61.4 million pounds, the fastest growth is coming from diversified markets – South Korea (+40%), Japan (+10%), and Australia (+37%).
Butter’s Unexpected Export Renaissance
Even more dramatic is the transformation in butter markets. Historically not a major export player due to product specification differences, U.S. butter exports are soaring on the strength of an unprecedented price advantage:
- U.S. CME spot butter: $2.33/lb
- Oceania butter: $3.48/lb
- German butter: $3.70/lb
This $1.00+ per pound discount has overcome traditional barriers to U.S. butter exports. January-February 2025 butter exports reached 18.6 million pounds, an 84% increase over 2024 and the highest for that period since 2014. Total butterfat exports (including anhydrous milkfat) hit 7,101 metric tons in January alone – a 145% year-over-year surge and the largest monthly volume since 2014.
“The primary driver for this export boom is the price differential itself,” market analysts explain. “Ample domestic cream supplies resulting from high component milk production, coupled with strong butter production and inventories, have exerted downward pressure on U.S. butter prices.”
PRODUCTION STRATEGY: NAVIGATING THE COMPONENT ECONOMY
For dairy producers, the current market presents both challenges and opportunities. Strong margins at the end of 2024 encouraged production growth, but conditions are shifting rapidly as 2025 progresses.
The Income Over Feed Cost (IOFC) margin peaked above $15.00/cwt in September 2024 and has been steadily contracting, falling to $13.12/cwt in February 2025. USDA forecasts suggest further compression, with margins potentially dipping below $12.00/cwt through mid-2025. This tightening occurs despite relatively favorable feed costs compared to recent years.
Near-record high beef prices create another strategic consideration. Cull cow prices exceeding $145/cwt offer a potential cash flow opportunity or exit strategy for producers facing margin pressure. This dynamic, combined with tight replacement heifer inventories, is expected to moderate herd expansion despite favorable milk-to-feed ratios.
Producers must now weigh several key factors in their production strategies:
- Component optimization remains profitable even as fluid volume markets weaken
- Culling decisions take on greater importance with high beef values
- Herd expansion carries additional risk as global markets become more volatile
- Risk management tools become essential as margins tighten
MARKET OUTLOOK: EXPORTS TO DETERMINE PRICE DIRECTION
The U.S. dairy industry faces a pivotal moment where burgeoning domestic supply, particularly milk components, sits in tension with growing reliance on export markets. The component revolution continues flooding markets with valuable solids, creating opportunities for processors but pressuring cream and fat-based commodity prices.
The crucial question is whether robust export demand, fueled by America’s price advantage, can continue absorbing these growing surpluses. Several factors will determine the market path forward:
Positive Factors
- Significant new processing capacity (primarily cheese) coming online will create additional demand for components
- Price competitiveness in global markets should continue supporting exports to Mexico, Asia, and emerging destinations
- Domestic consumption remains relatively stable despite price pressures
Risk Factors
- Any loss of the current export price advantage could quickly reduce overseas sales
- Trade policy disruptions remain a constant threat, as evidenced by China’s tariffs on U.S. whey products
- Economic conditions could weaken consumer demand domestically or internationally
The verdict? Export strength in cheese and butter markets provides a reason for cautious optimism, but producers should maintain flexibility and strong risk management plans as component markets evolve. The growing integration of U.S. dairy into global markets brings opportunity and exposure to international price volatility that requires sharp business management.
The message for dairy farmers weathering these shifting markets is clear: the component revolution isn’t slowing down. Those who adapt to this new reality – optimizing genetics and nutrition for component production while managing costs and utilizing risk management tools – will be best positioned to thrive in the emerging global component economy.
Learn more:
- Why Boosting Butterfat and Protein Is Key to Higher Profits
Explains actionable strategies for maximizing component premiums through feed, genetics, and herd management. - US Dairy Market in 2025: Butterfat Boom & Price Volatility
Analyzes how record 4.40% butterfat tests are reshaping risk management strategies amid crashing cream multiples. - Higher Butterfat and Protein Levels Propel U.S. Cheese Output
Details how component-driven cheese yield gains offset milk volume declines, reinforcing export competitiveness.
 Join the Revolution!
 Join the Revolution!
Join over 30,000 successful dairy professionals who rely on Bullvine Weekly for their competitive edge. Delivered directly to your inbox each week, our exclusive industry insights help you make smarter decisions while saving precious hours every week. Never miss critical updates on milk production trends, breakthrough technologies, and profit-boosting strategies that top producers are already implementing. Subscribe now to transform your dairy operation’s efficiency and profitability—your future success is just one click away.