


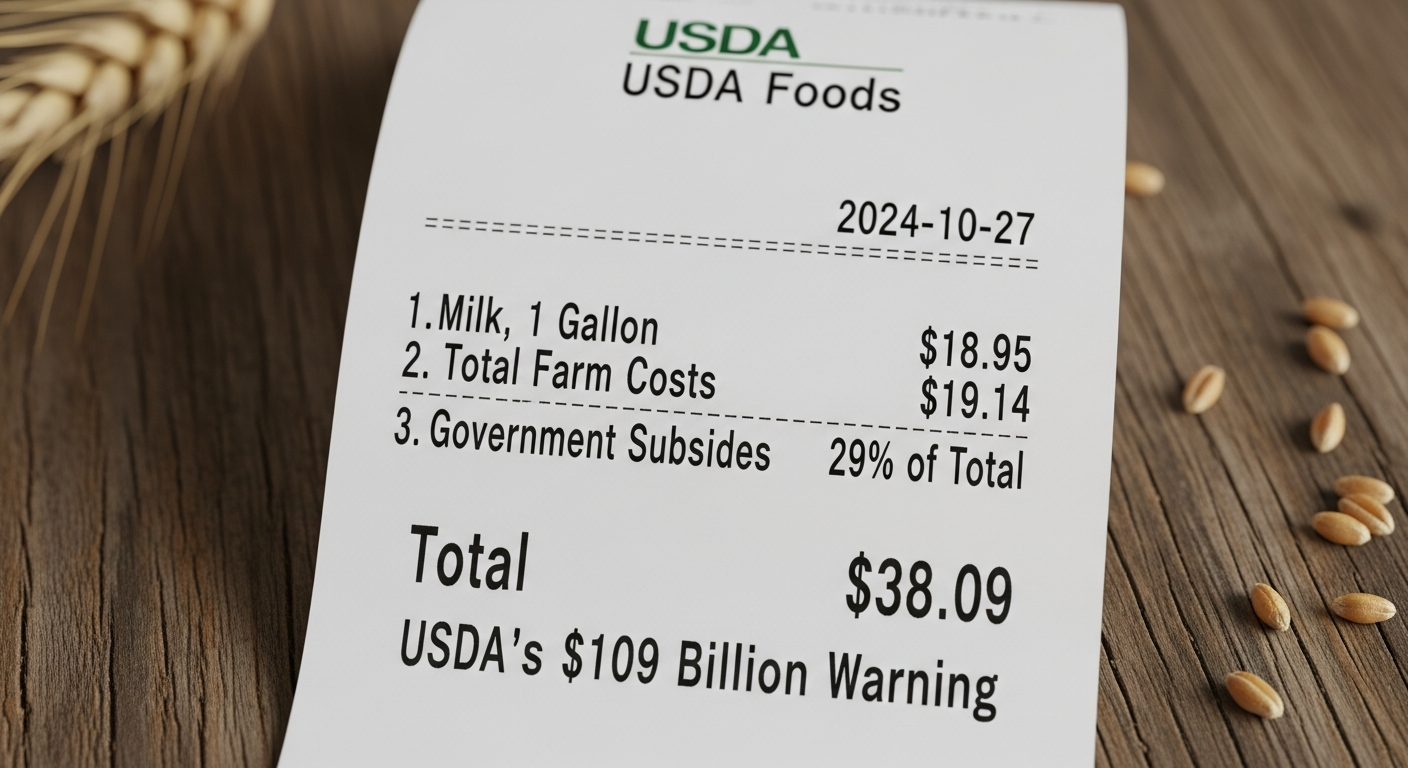
$18.95 milk, $19.14 costs, 29% of income from government checks. If any one of those moves against you, what happens to your dairy?
Executive Summary: USDA’s February outlook has 29% of U.S. net farm income coming from government checks in 2026, with $44.3 billion in payments propping up a farm economy that would otherwise drop to about $109 billion in net income. At the same time, the February WASDE raised the 2026 all‑milk price to $18.95/cwt, while USDA‑ERS cost‑of‑production data put average 2,000‑plus cow herds at $19.14/cwt and the smallest herds near $42.70/cwt. For a 300‑cow, 23,000‑lb herd, that price reset from $21.17 to $18.95 still means roughly $153,000 less gross milk revenue before you even count feed, labor, and debt. This article walks the math by herd size, then lays out four real levers you can pull — beef‑on‑dairy, component premiums, feed cost protection, and risk‑management tools like DMC — with the upsides and trade‑offs spelled out in plain language. It uses real operations and named analysts to show how those choices are playing out on the ground, from McCarty Family Farms’ genomic beef‑on‑dairy strategy to DFA’s $2.50–$3.00/cwt revenue bump and Ever.Ag’s “street fight” warning. It finishes with concrete thresholds and questions for sub‑200, 200–999, and 1,000‑plus cow herds so you can see whether you’re running a market‑based margin, a subsidy‑dependent margin, or whether it’s time to use today’s strong cattle markets to exit on your own terms.
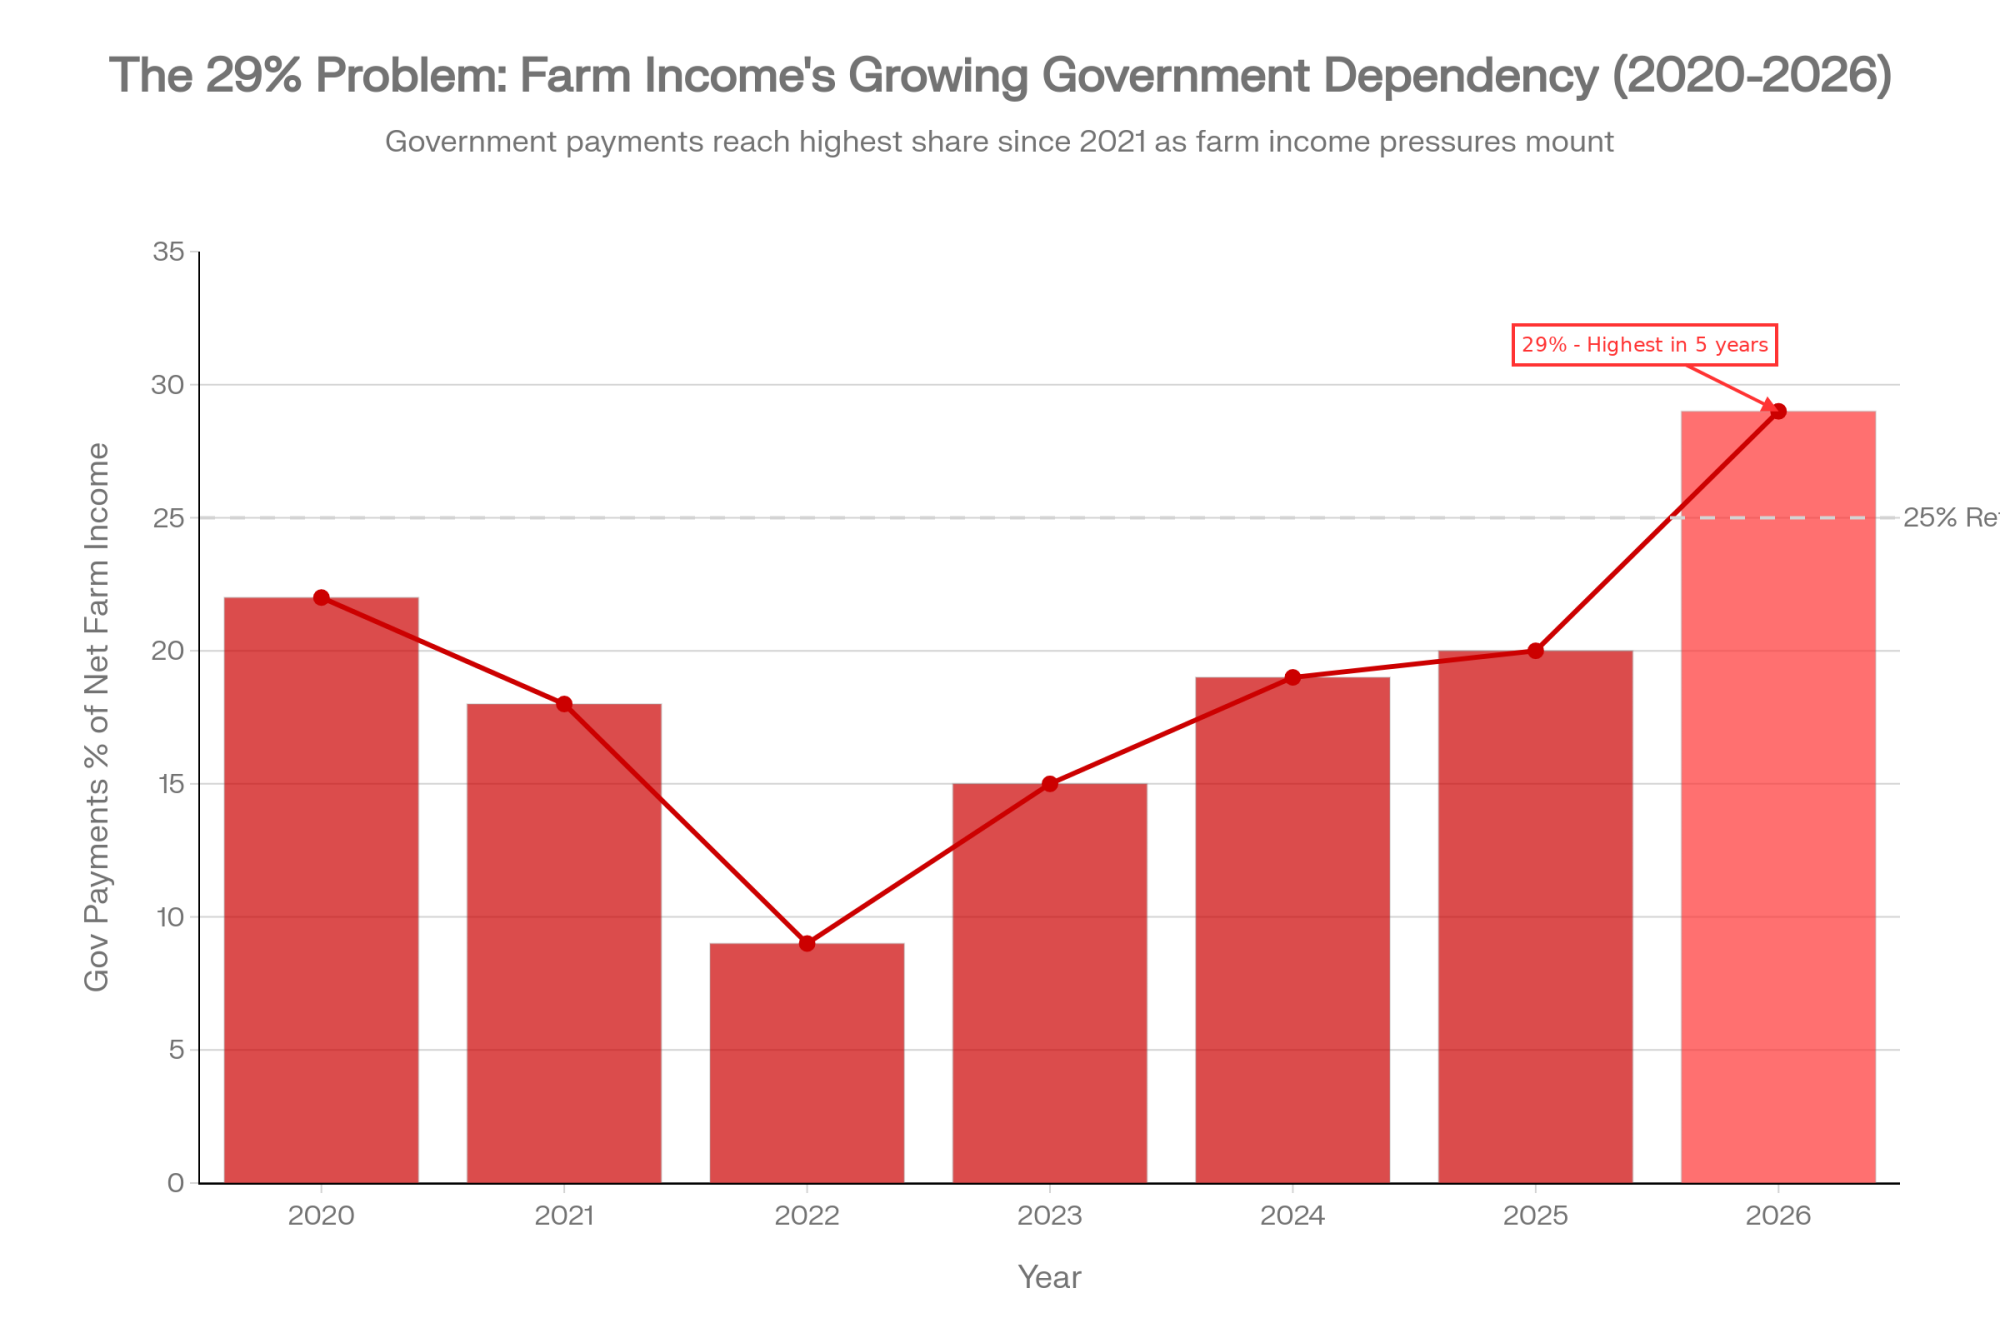
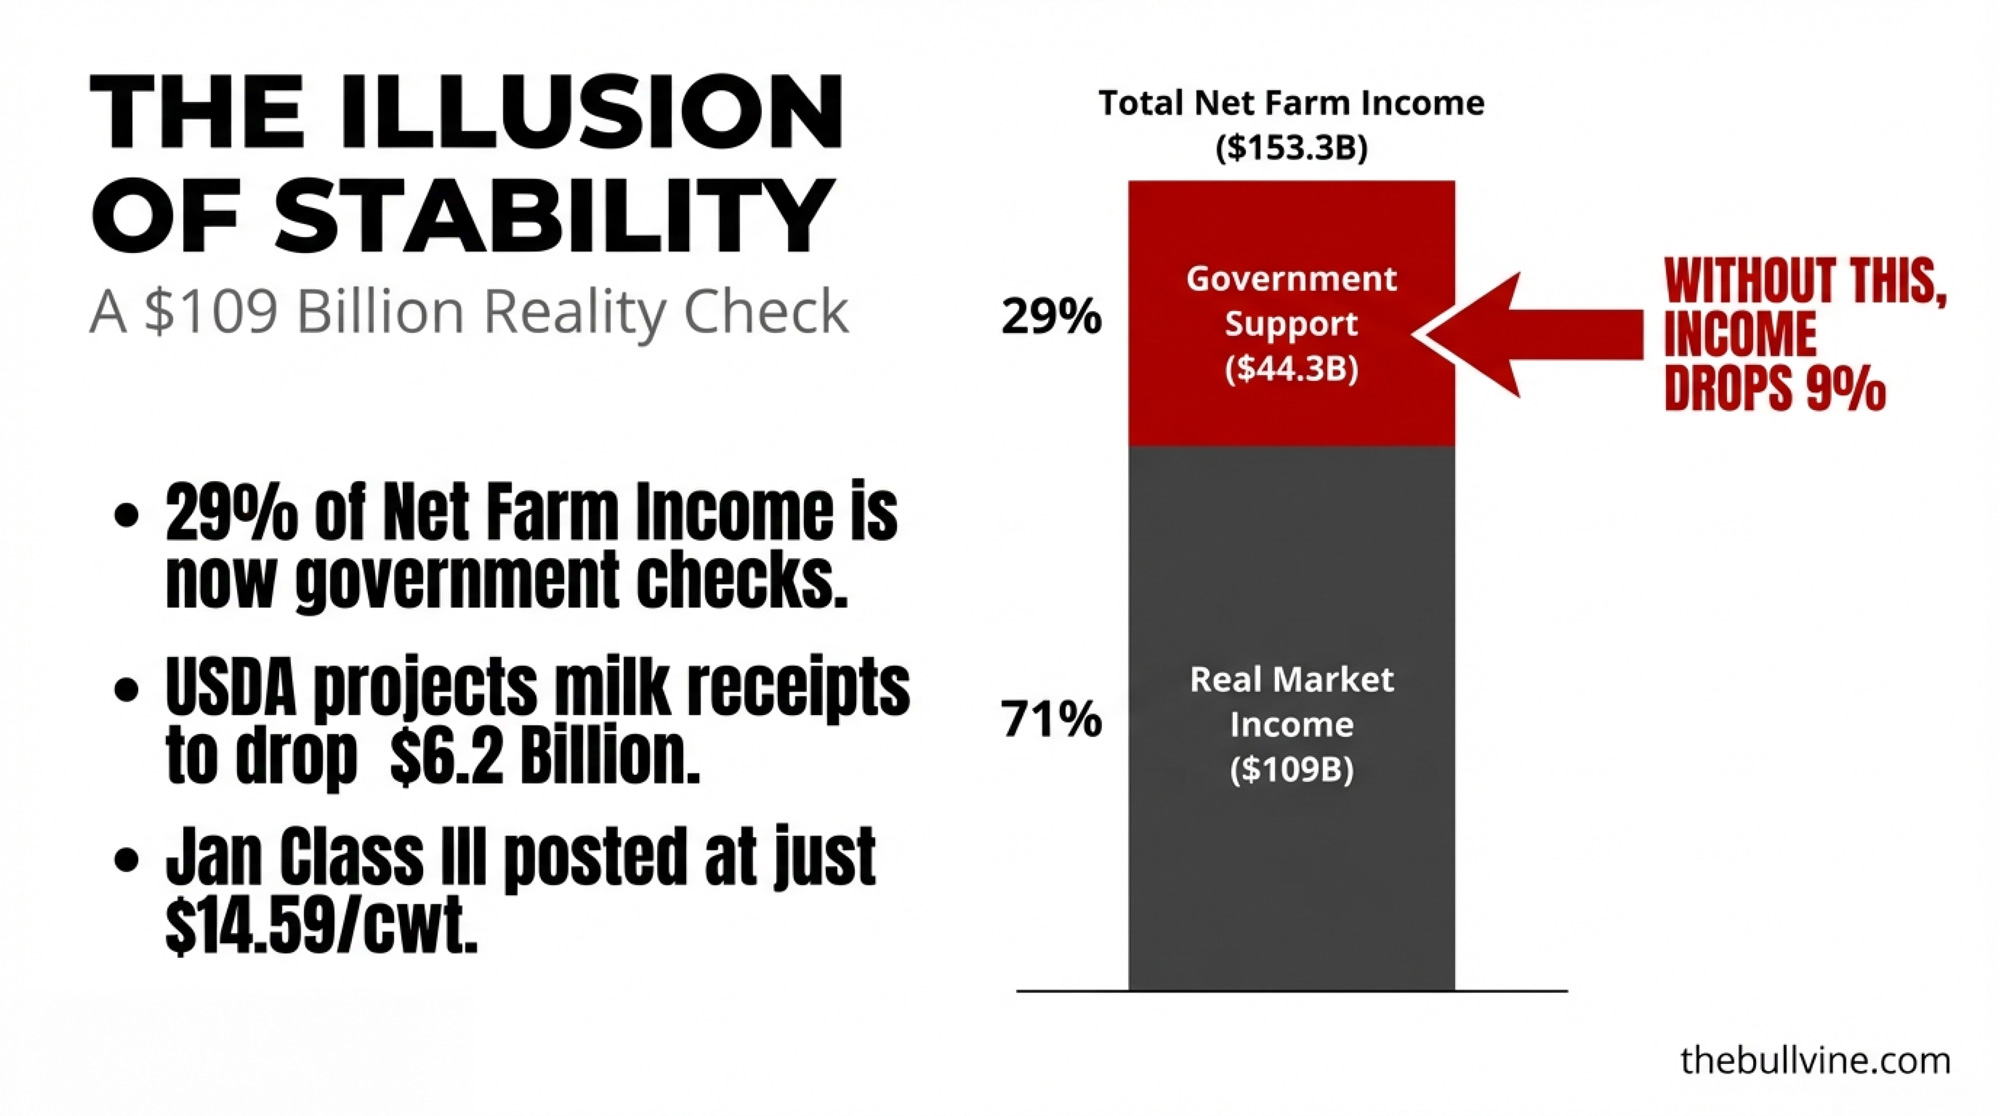
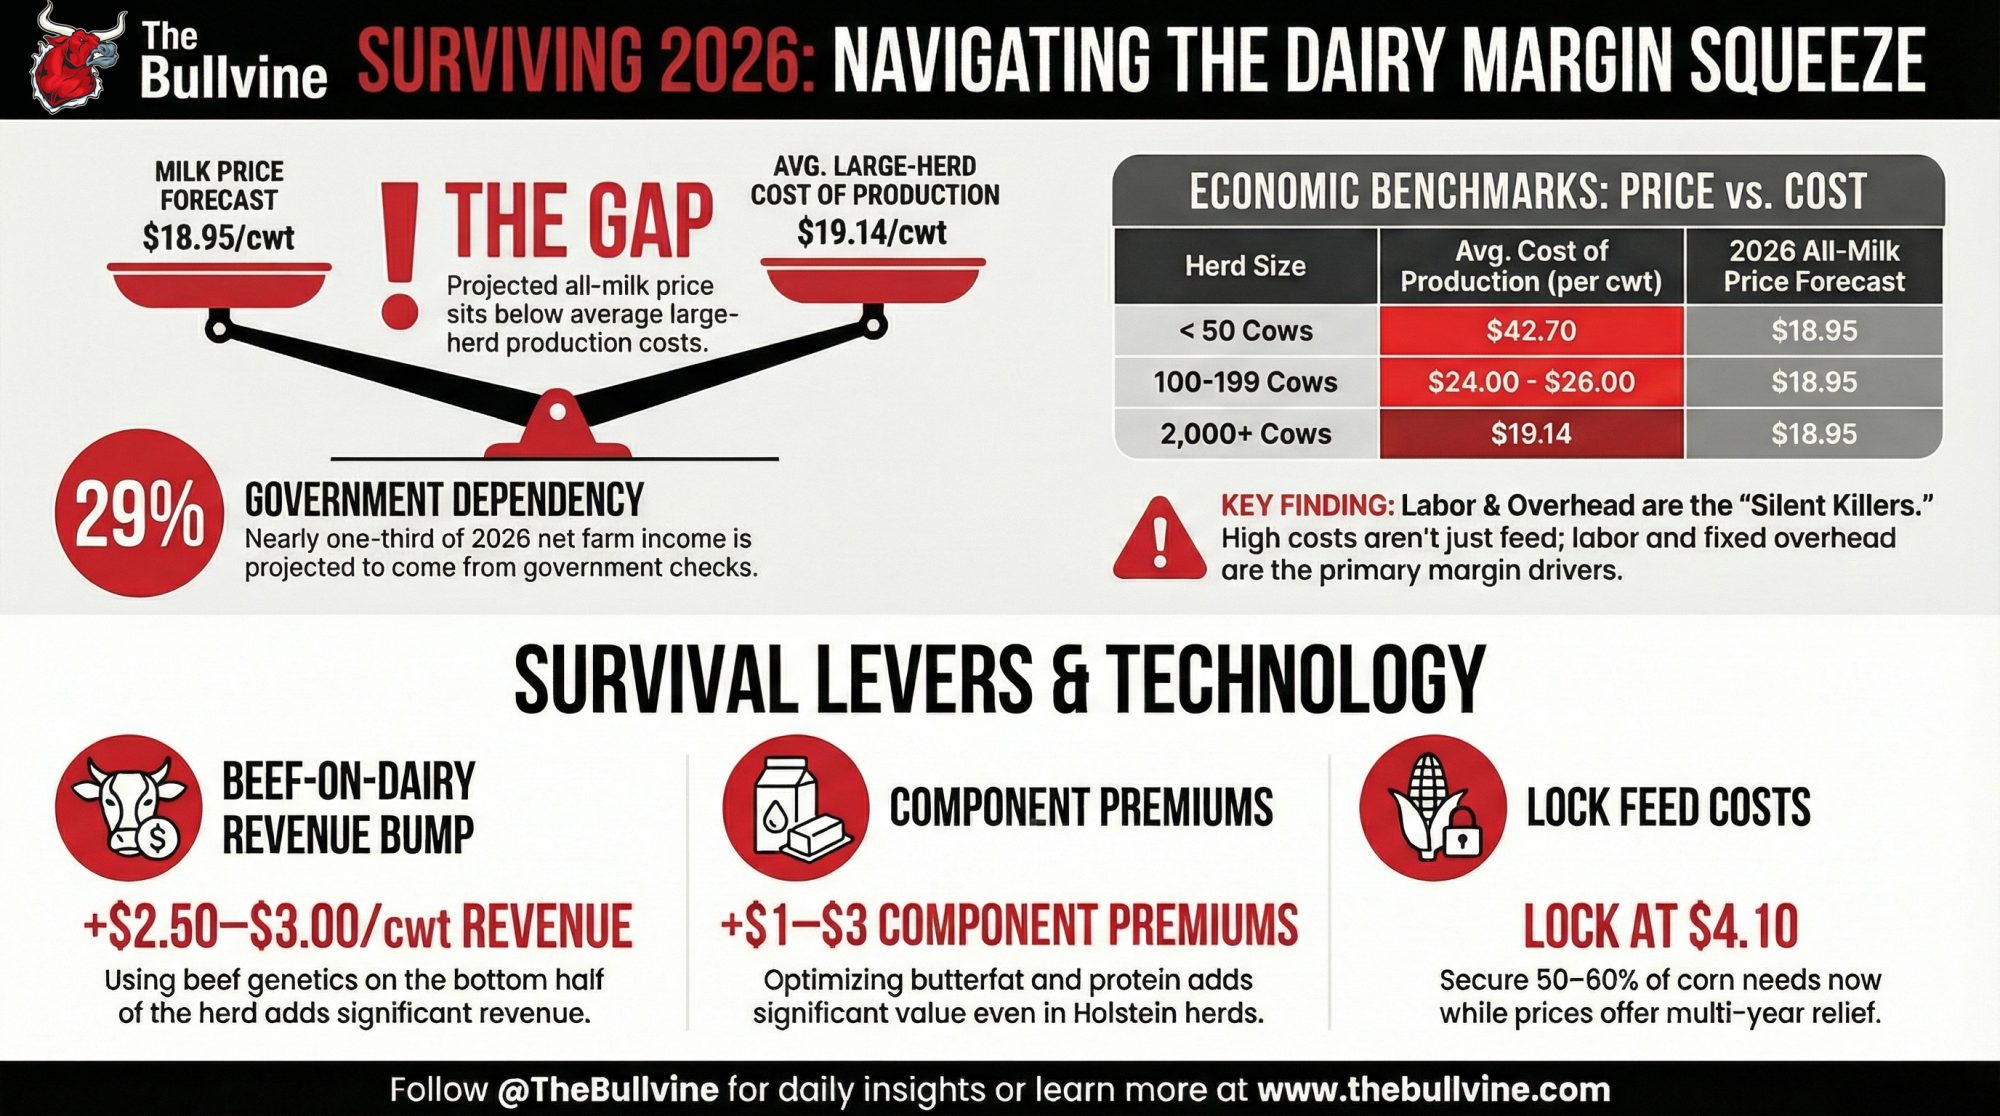
Twenty-nine cents of every dollar of U.S. net farm income now comes from government payments. For dairy, those numbers hit even harder. USDA’s February 4 forecast projects $44.3 billion in direct payments for 2026 — up 45% from roughly $30.5 billion in 2025, according to USDA-ERS data analyzed by the American Farm Bureau Federation. Strip those payments out, and net farm income drops to approximately $109 billion, representing a roughly 9% real decline from 2025’s non-government income, per Econbrowser’s analysis.
The headline — $158.5 billion in net cash farm income — looks stable. Almost comfortable. But USDA forecasts dairy milk receipts dropping $6.2 billion (12.8%) this year. And while today’s February WASDE raised the 2026 all-milk price to $18.95/cwt — up 70 cents from January’s projection — January’s actual Class III still posted at just $14.59/cwt. The forecast improved. The checks haven’t caught up yet.
The $25 Billion Revision Nobody Expected
Start with what happened to 2025. USDA cut last year’s net farm income estimate by $25 billion, from $179.8 billion projected in September, down to $154.6 billion. Production expenses got revised up to $473.1 billion. Government payments came in about $10 billion below earlier projections, at $30.5 billion versus a September estimate near $40.5 billion.
AFBF’s Danny Munch, co-author of the Farm Bureau’s Market Intel analysis, called this “a generational downturn rather than a temporary slowdown.” Total farm debt is projected at $624.7 billion for 2026, up $30.8 billion (5.2%), with the debt-to-asset ratio climbing from 13.49% to 13.75%.
Where are those aid dollars going? Purdue University’s Ag Economy Barometer found that a majority of farmers report using government payments primarily to pay down existing debt — not to reinvest.
Dairy’s Revenue Problem — Even After Today’s WASDE Bump
Today’s February WASDE brought some relief. USDA raised all 2026 dairy product price forecasts — cheese up 2 cents to $1.6050/lb, butter up 7 cents to $1.68/lb, NDM up 11 cents to $1.3150/lb, and whey up 2 cents to $0.69/lb. The result:
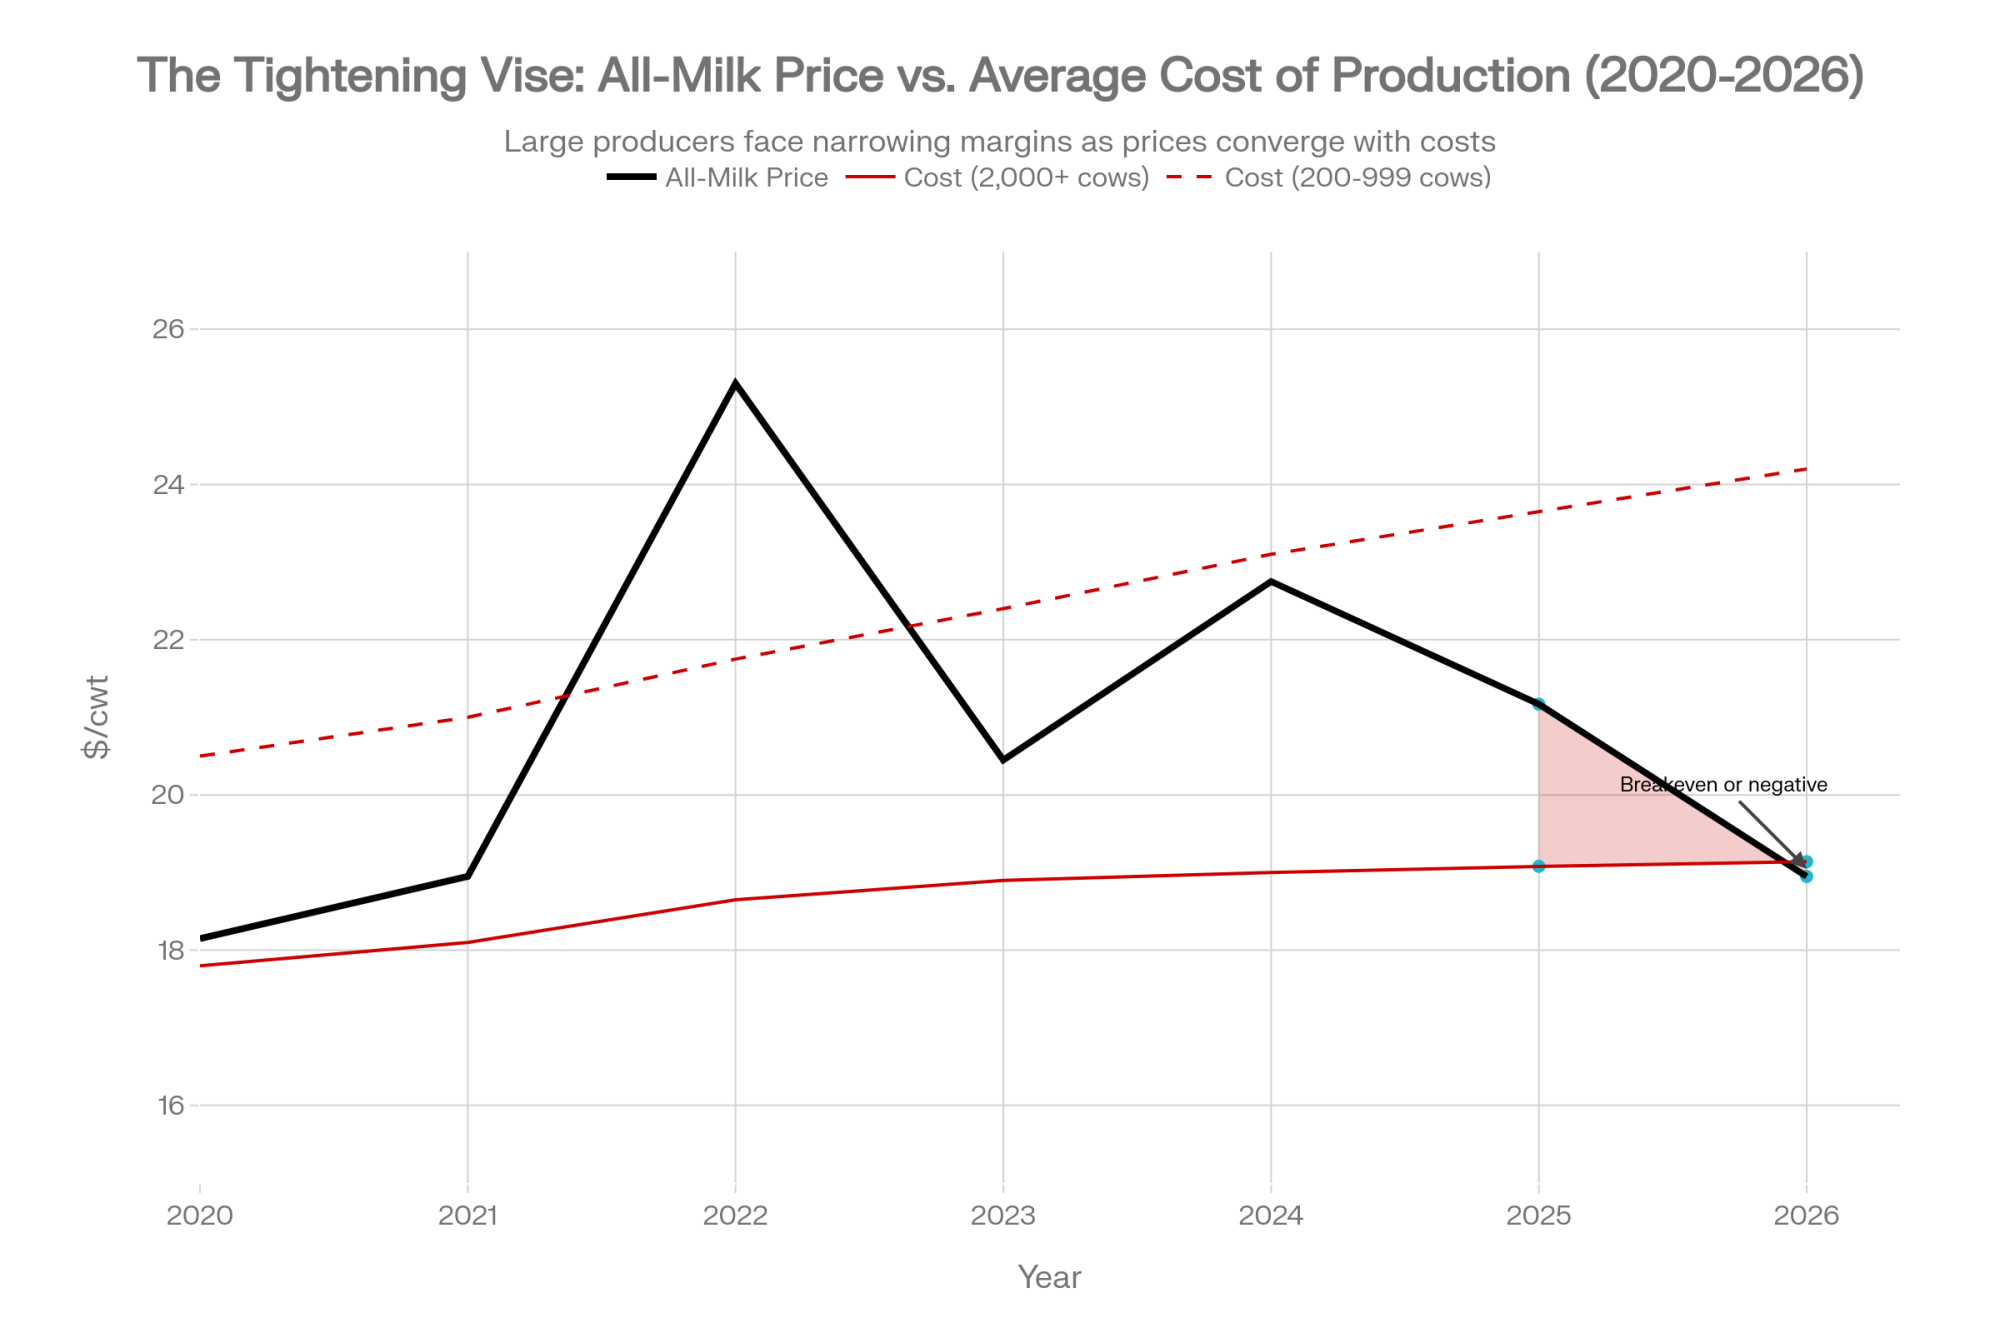
- All-milk price: Raised to $18.95/cwt for 2026, up 70 cents from January’s $18.25 projection. That’s still down $2.22/cwt from the revised 2025 average of $21.17. Better than last month. Still a significant revenue hit.
- Class III: Raised to $16.65/cwt, up 30 cents from $16.35. Class IV got the bigger bump — up $1.25 to $15.70/cwt — largely on stronger NDM and butter price assumptions. But January’s actual Class III of $14.59 and December’s $15.86 are both well below the new annual average, meaning the back half of 2026 needs to do a lot of heavy lifting for your budgets.
- Milk production: Raised to 234.5 billion pounds, up 200 million from January’s estimate. The national herd was up 202,000 head year over year in Q4 2025, with December production running 4.6% above the prior year. RFD-TV noted output “driven by the largest milk cow herd in decades and higher per-cow productivity.”
- DMC margins: January’s Dairy Margin Coverage margin is projected at $7.57/cwt — a full $1.93 below the $9.50 trigger. That’s the first meaningful DMC payout since December 2025 and signals the kind of margin compression producers should plan for, not just hope for.
| Month | All-Milk Price ($/cwt) | Feed Cost ($/cwt) | Actual Margin ($/cwt) | DMC Payout at $9.50 Coverage |
|---|---|---|---|---|
| Dec 2025 | $14.59 | $6.02 | $8.57 | $0.93 |
| Jan 2026 | $14.35 | $6.78 | $7.57 | $1.93 |
| Feb 2026 (proj) | $15.10 | $6.85 | $8.25 | $1.25 |
| Mar 2026 (proj) | $15.80 | $6.90 | $8.90 | $0.60 |
| Apr 2026 (proj) | $16.20 | $7.00 | $9.20 | $0.30 |
| May 2026 (proj) | $17.00 | $7.15 | $9.85 | $0.00 |
| Jun 2026 (proj) | $17.50 | $7.20 | $10.30 | $0.00 |
Munch told Brownfield Ag News the receipts decline “would put dairy down about 35% over five years.” CoBank’s Corey Geiger noted butterfat production was running 5–6% above year-ago levels heading into 2026, volume even strong demand can’t easily absorb. The February WASDE’s butter price raise to $1.68/lb signals USDA sees some floor forming, but that’s still well below 2024 peaks.
Mark Stephenson at UW-Madison put it plainly in an April 2025 Bullvine interview: “Operations with weaker financial positions or higher production costs could face heightened pressure, potentially leading to further consolidation within the sector.”
The $23.56 Cost-of-Production Gap — And Why Feed Isn’t the Problem
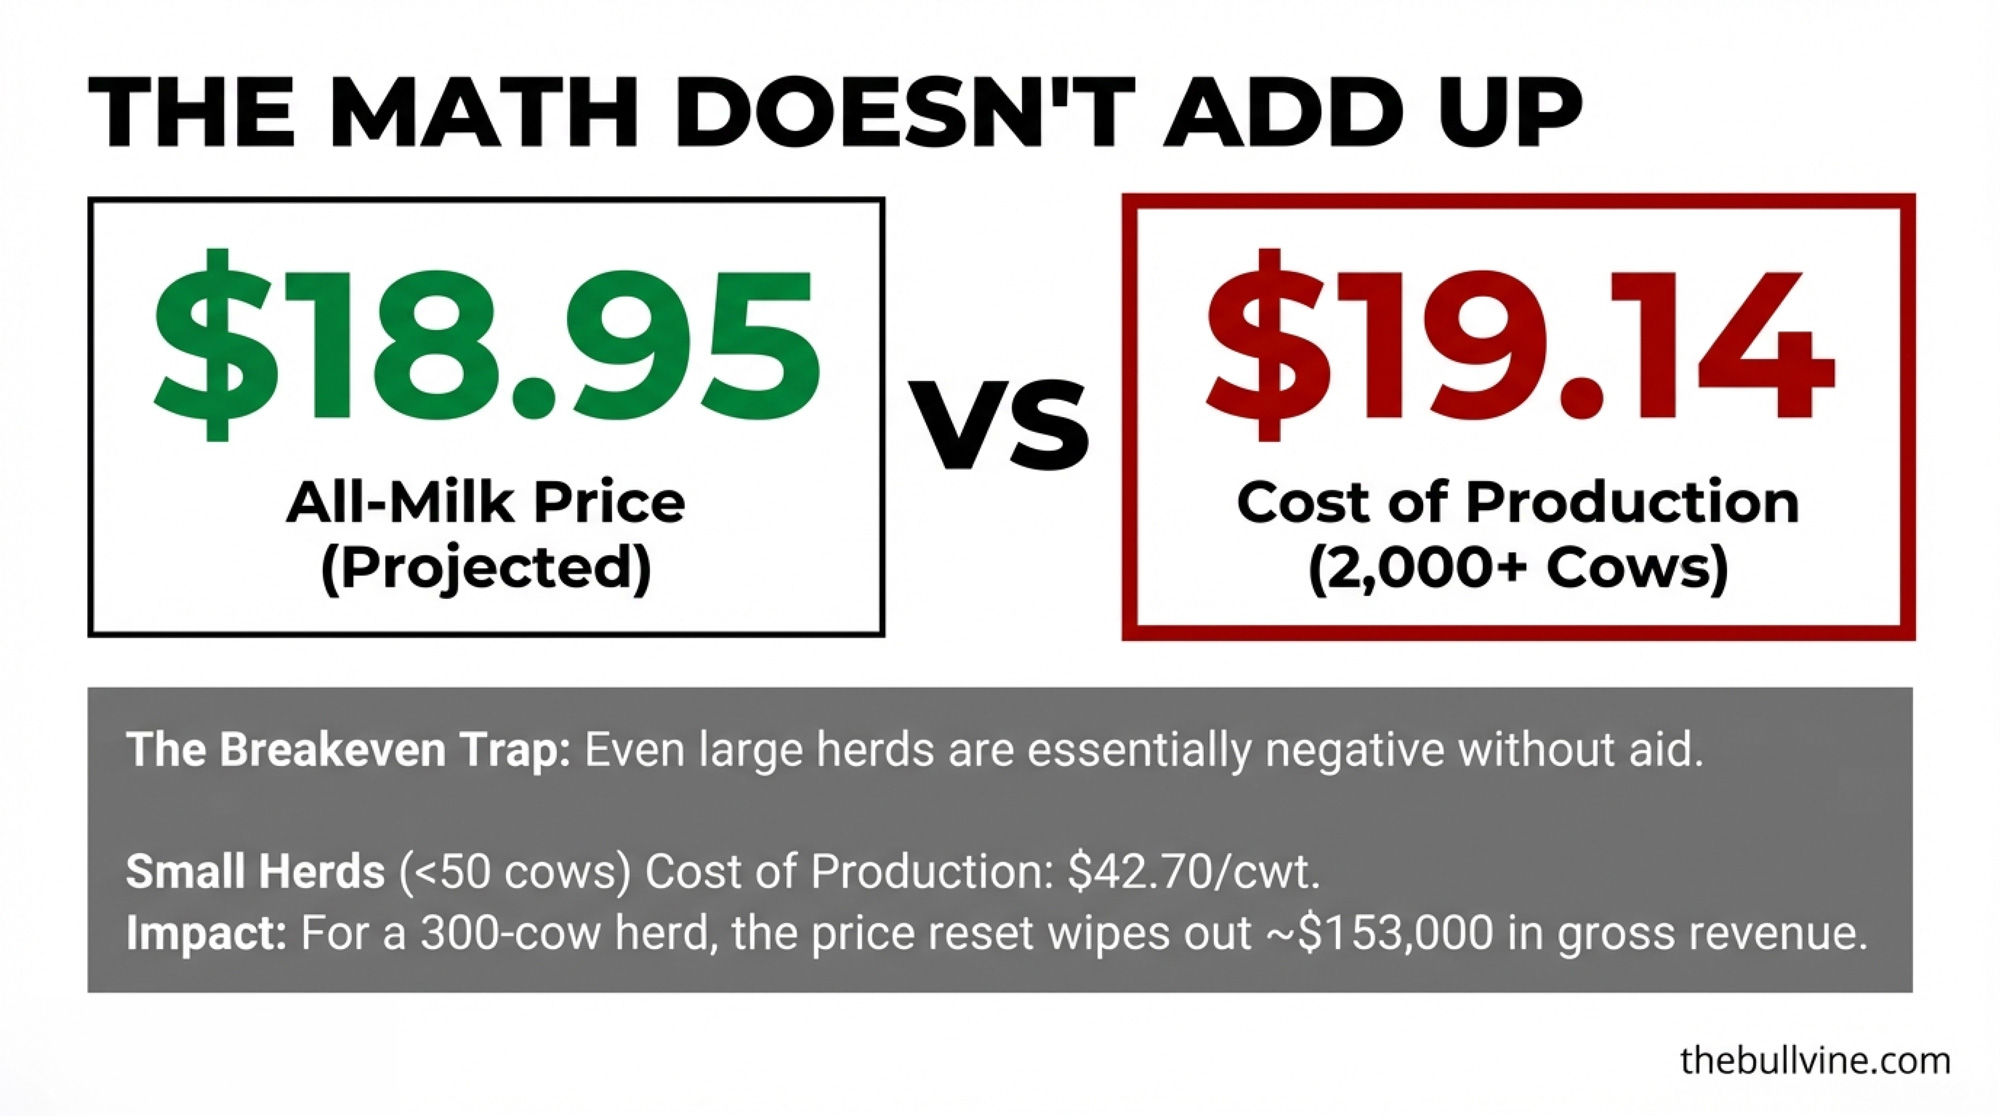
USDA’s Economic Research Service published updated cost-of-production estimates by herd size in August 2024, based on the 2021 ARMS dairy survey. The spread: $42.70/cwt for herds under 50 cows. $19.14/cwt for operations with 2,000 or more. A $23.56 gap. And at $18.95 all-milk, even the lowest-cost tier is essentially breakeven on a full economic basis.
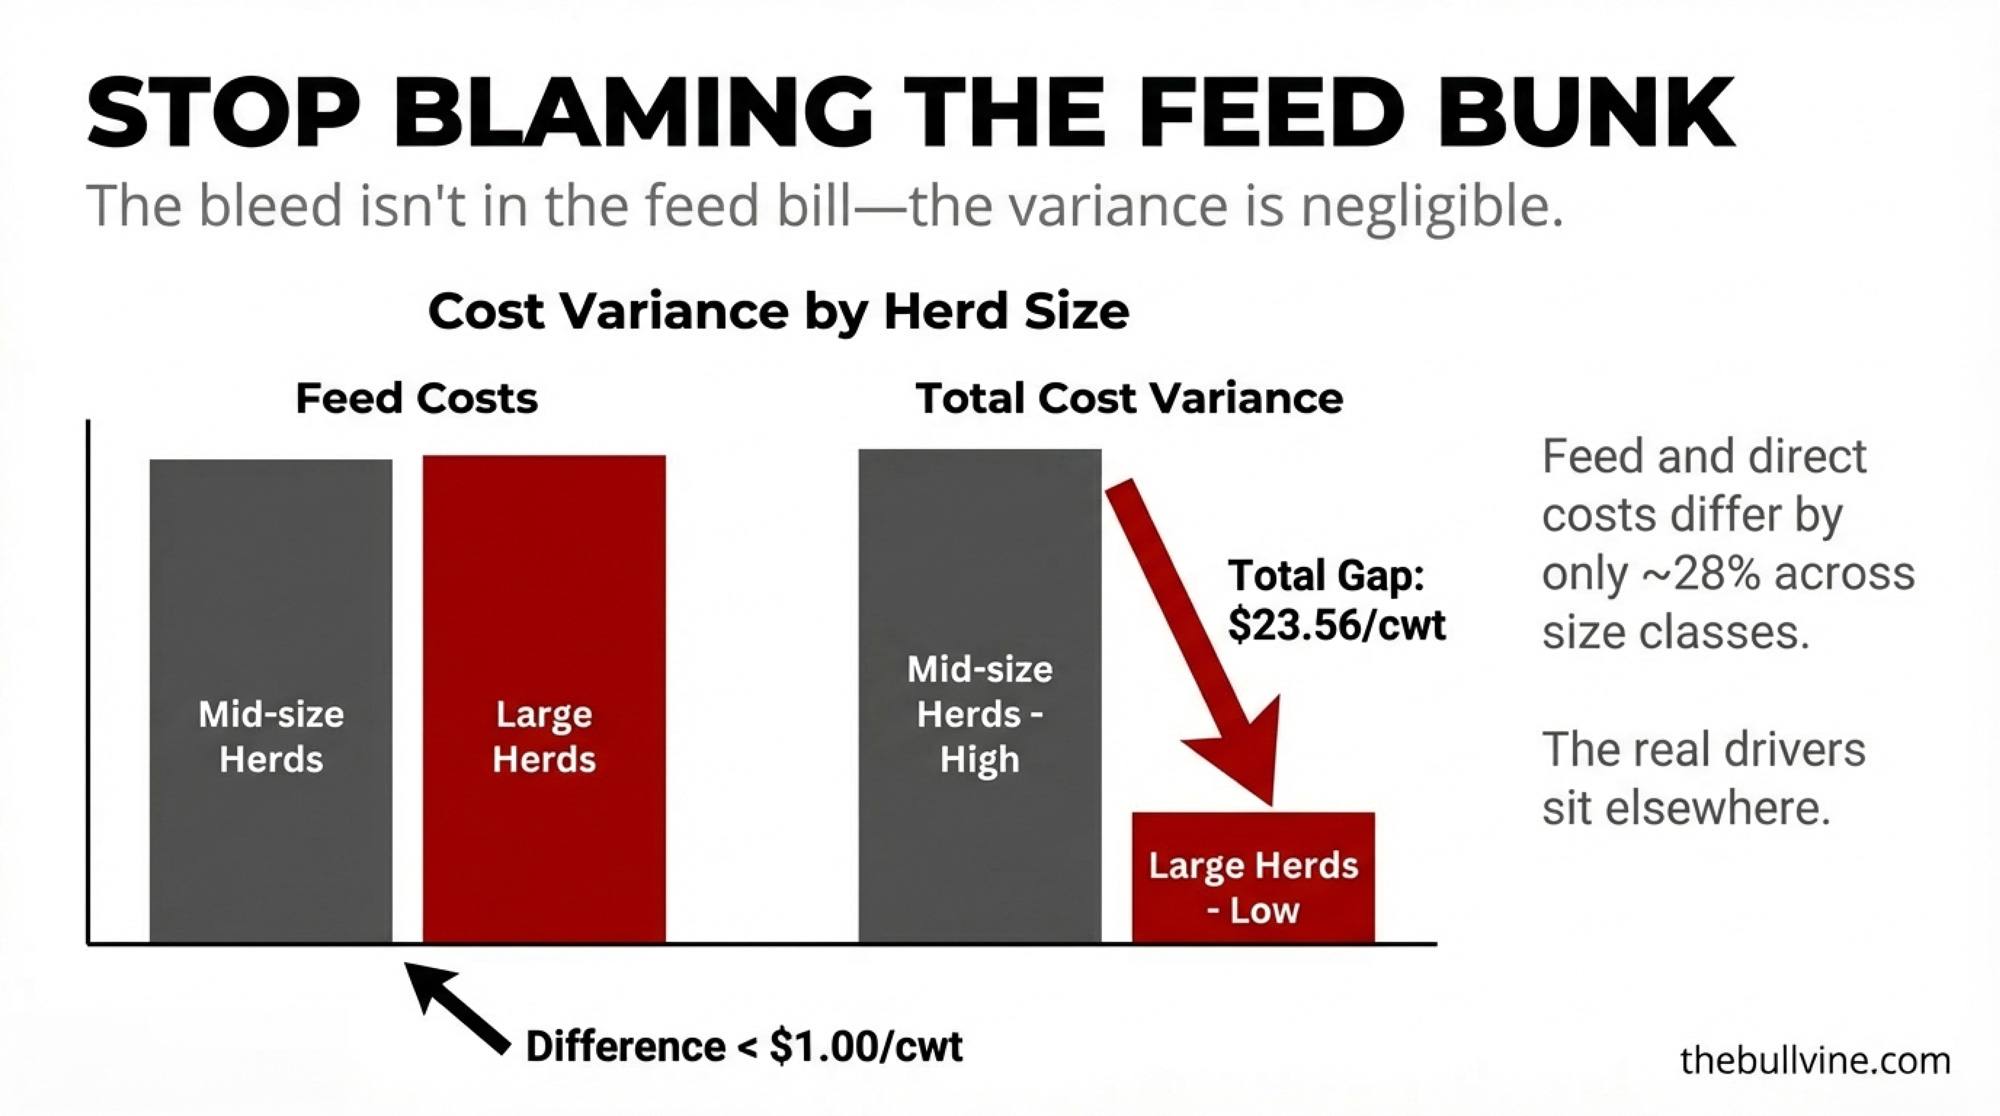
The instinct is to blame the feed. But feed costs account for a surprisingly small share—roughly $3/cwt or less. USDA’s own report to Congress showed feed differing by less than $1/cwt between mid-size and the largest herds. Agri-benchmark’s international analysis (using 2016 ARMS data, directionally consistent with the 2021 update) confirmed the pattern: feed and other direct costs differ by only about 28% across size classes. The real drivers sit elsewhere.
| Cost Category | <50 cows | 50-99 cows | 100-199 cows | 200-999 cows | 2,000+ cows |
|---|---|---|---|---|---|
| Labor | $12.00 | $8.50 | $5.20 | $3.10 | $2.20 |
| Feed | $3.50 | $3.40 | $3.20 | $3.00 | $2.90 |
| Overhead | $15.20 | $10.80 | $7.60 | $4.50 | $3.10 |
| Other Direct | $5.00 | $4.30 | $3.80 | $3.20 | $2.80 |
| Opportunity Cost (Land, Capital) | $7.00 | $5.50 | $4.20 | $3.10 | $2.44 |
| TOTAL ($/cwt) | $42.70 | $32.50 | $24.00 | $16.90 | $19.14 |
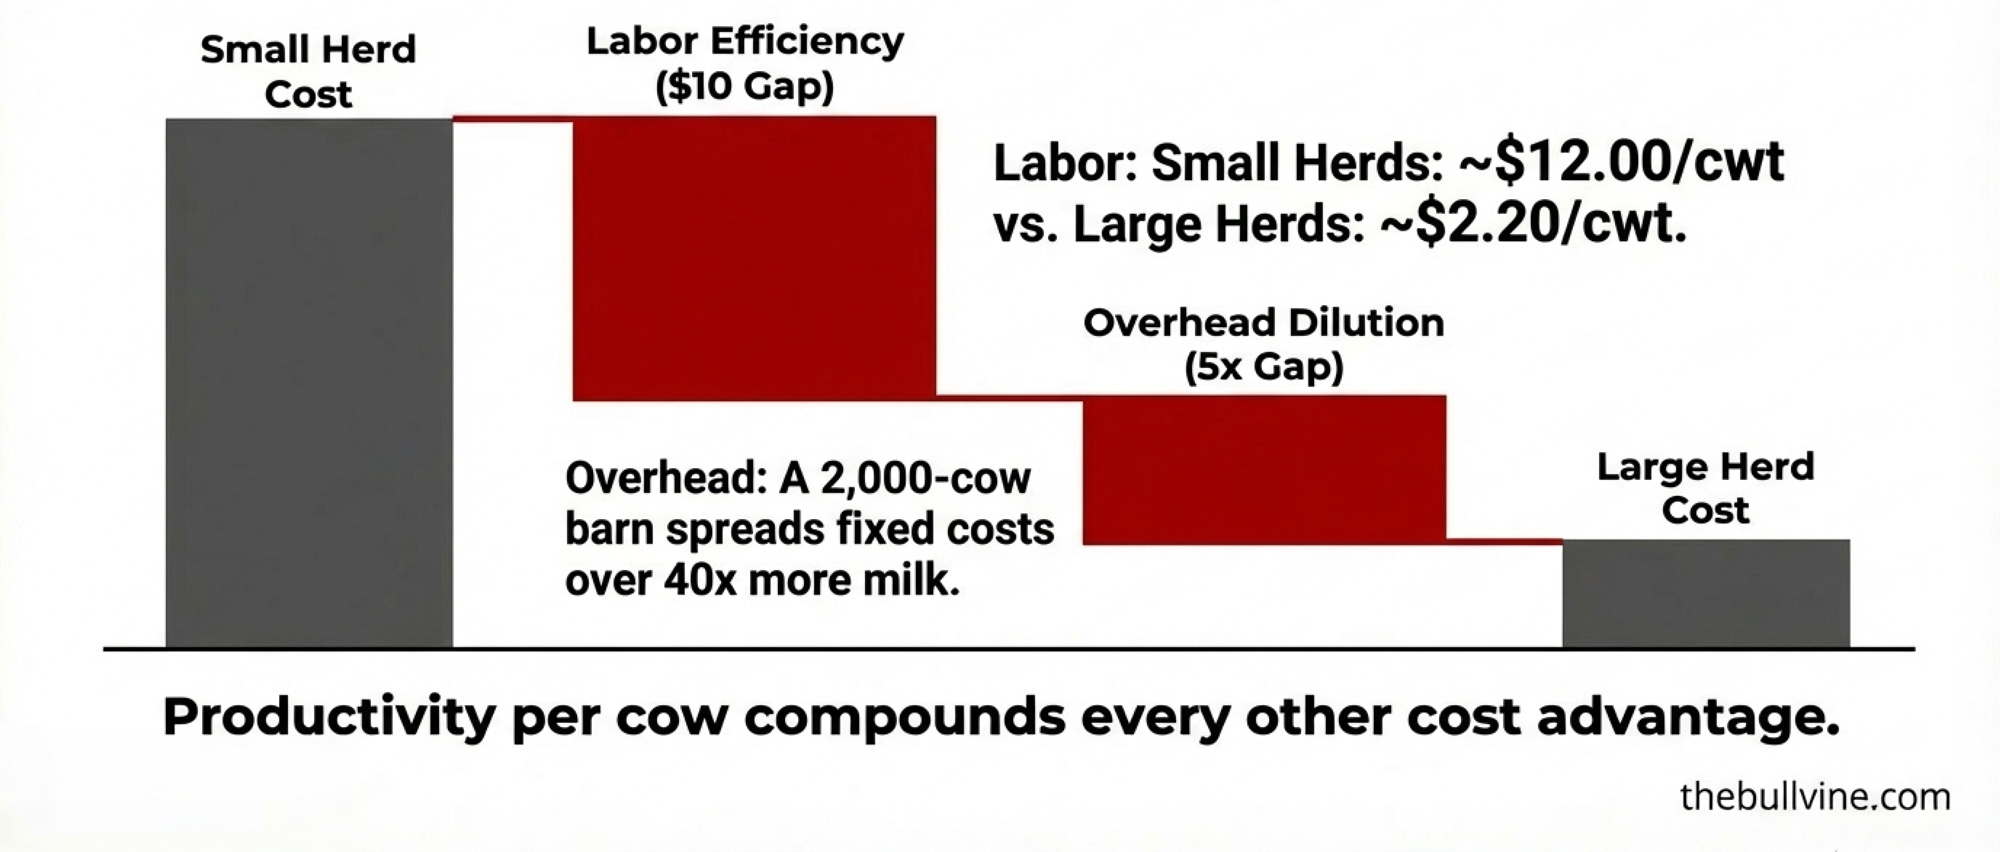
Labor eats the biggest piece. Small herds carry roughly $12/cwt in labor costs — mostly imputed value of unpaid family hours. Large operations run about $2.20/cwt. Nearly $10 of the gap is from one line item. And larger farms generally pay higher cash wages. NASS Farm Labor data shows livestock worker wages rising roughly 7% per year in both 2021 and 2022, reaching $16.52/hr by October 2022. The cost advantage comes from output per labor dollar—not lower pay.
Overhead is the silent killer. Barns, parlors, mixers, insurance — a 50-cow dairy needs roughly the same equipment categories as a 2,000-cow operation. But the big barn spreads those fixed costs across 40 times as much milk. Agri-benchmark found that overhead costs decrease approximately fivefold from the smallest to the largest herds.
Productivity per cow compounds everything. A 2,000-cow herd pushing 24,000–25,000 lbs/cow generates 30–40% more milk per stall, per parlor turn, per dollar of overhead than a 50-cow herd at 15,000–16,000 lbs. That compounds every other cost advantage.
These are national averages. Regional differences matter for a lot of herds: Western large-herd operations in Idaho, the Texas panhandle, or California’s Central Valley face different overhead structures — water, environmental compliance, land prices — than Upper Midwest grazing operations in Wisconsin or proximity-to-market herds in the Northeast. Top-quartile producers within each size class typically run $3–$5/cwt below these averages, per the ARMS data.
The Finding That Cuts Both Ways
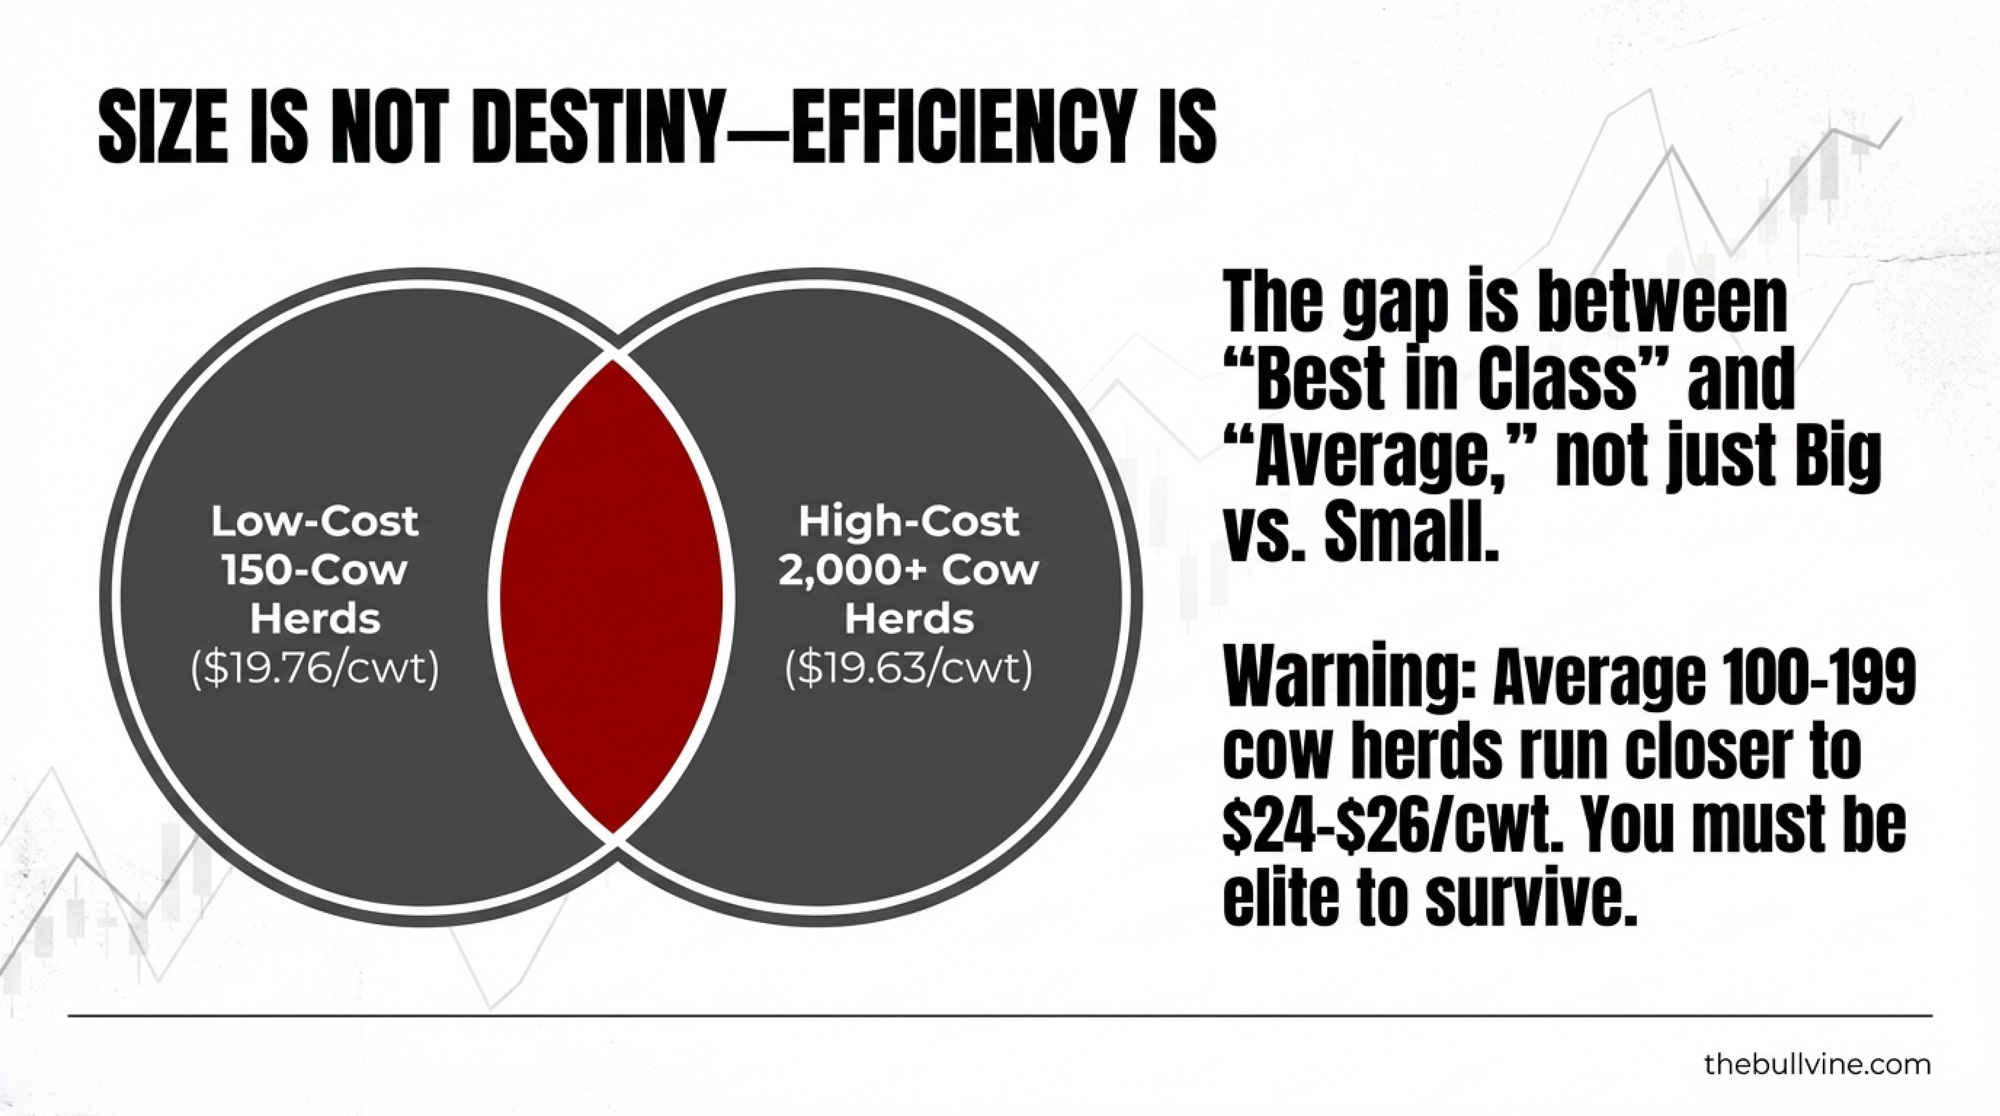
Here’s where the data gets genuinely interesting. Hoard’s Dairyman’s analysis of the 2021 ARMS data (Table 9) found that low-cost producers in the 100–199 cow range operate at $19.76/cwt. High-cost producers in the 2,000-plus range run $19.63/cwt. Essentially identical.
The best-managed 150-cow dairy can match the average cost structure of a 2,000-cow operation. So the question isn’t whether you’re big enough. It’s whether you’re sharp enough.
Ask a Wisconsin 150-cow operator who benchmarks through Farm Business Management whether size is destiny, and you’ll get a different answer than the national averages suggest. But flip it around: the average 100–199 cow herd runs closer to $24–$26/cwt. Even with today’s bump to $18.95 milk, the distance between “best in class” and “average” in that cohort is the difference between a thin margin and a steady cash drain. Bradley Zwilling at the University of Illinois Farm Business Farm Management Association confirmed this in January 2026: Illinois operations can “squeak out a profit margin” on a cash basis, he told Brownfield Ag News, but “from an economics standpoint, we’ve got lots of negative numbers.”
For many operations, that gap — between cash-basis survival and full economic viability — is a significant part of the 29% government payment dependency measured at the national level.
How One Kansas Operation Reads the Numbers
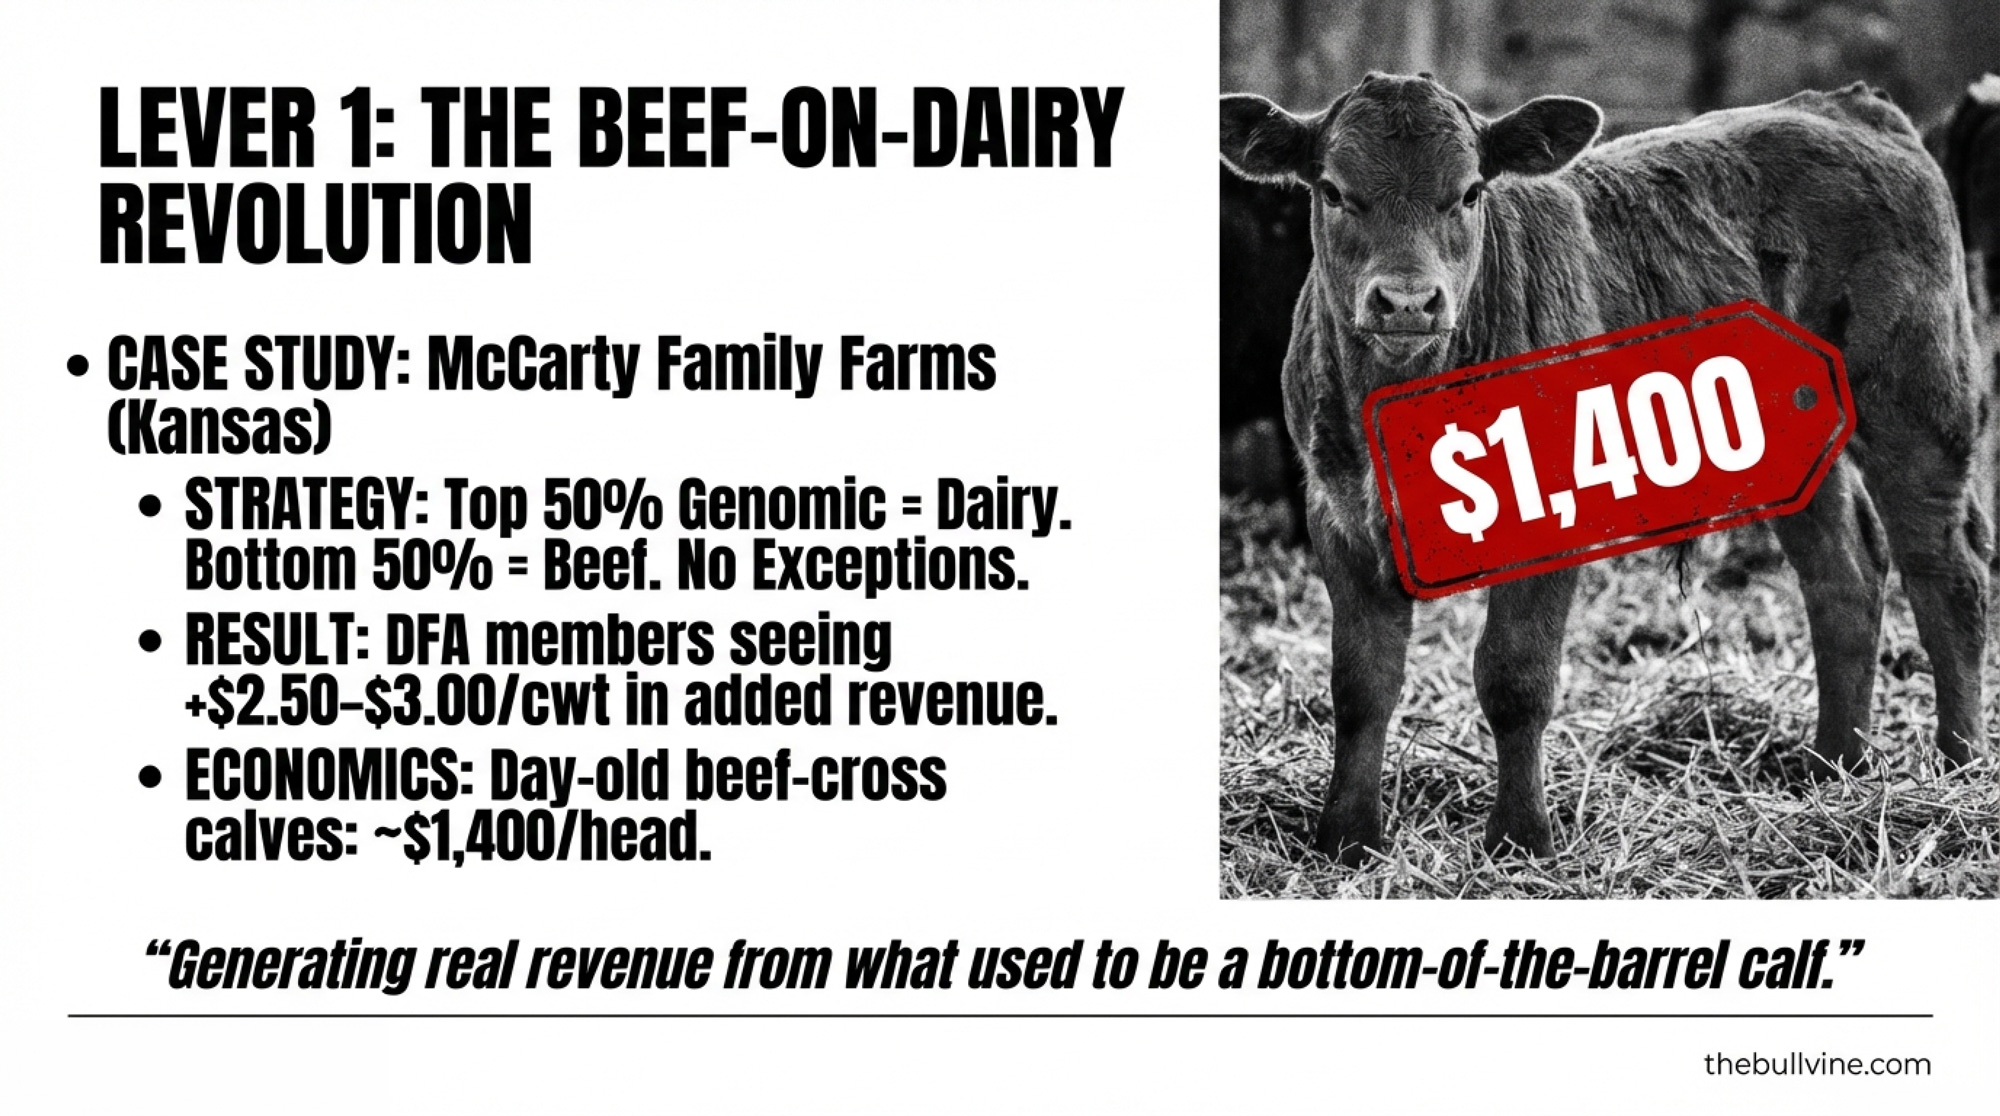
When Ken McCarty looked at the cost-of-production math, the direction was clear long before the latest USDA revision. McCarty Family Farms, a roughly 20,000-cow operation in Colby, Kansas, has genomically tested more than 75,000 females since 2018. Their rule is simple: the top half by genomic index gets dairy semen; the bottom half gets beef — no exceptions.
That discipline matters when you see the $2.50–$3.00/cwt in added non-milk revenue that DFA’s chief milk marketing officer Corey Gillins says beef-on-dairy is generating across about 70% of their membership. McCarty markets beef-cross calves as day-olds — eliminating the feed and labor burden rather than retaining ownership. According to Laurence Williams, Purina’s dairy-beef cross development lead, day-old beef-on-dairy calves now average roughly $1,400 per head, up from about $650 three years ago — and Hoard’s Dairyman confirmed in March 2025 that dairy-beef calf prices “continued to skyrocket, reaching historical highs” nationally.
“The value of genomic testing has evolved over time,” McCarty has said — a characteristically understated way of describing a system that generates real revenue from what used to be a bottom-of-the-barrel calf. Farm Journal named McCarty Family Farms the 2025 Leader in Technology for exactly this kind of integration.
Four Margin Levers — And What Each One Costs You
Beef-on-dairy. The McCarty model works, but it demands investment: genomic tests run about $40–$50 per calfthrough providers like Zoetis or Neogen for medium-density panels, per The Bullvine’s November 2025 analysis. Lower-density tests start as low as $15–$38, but commercial dairies optimizing beef-on-dairy splits typically need the fuller panels. The trade-off: overcommit to beef sires and you risk a replacement shortage — with dairy replacement heifers at $3,010 per head nationally as of July 2025 per USDA, that’s an expensive gamble. Wrong sire selection on calving ease creates problems that erase the revenue gain entirely.
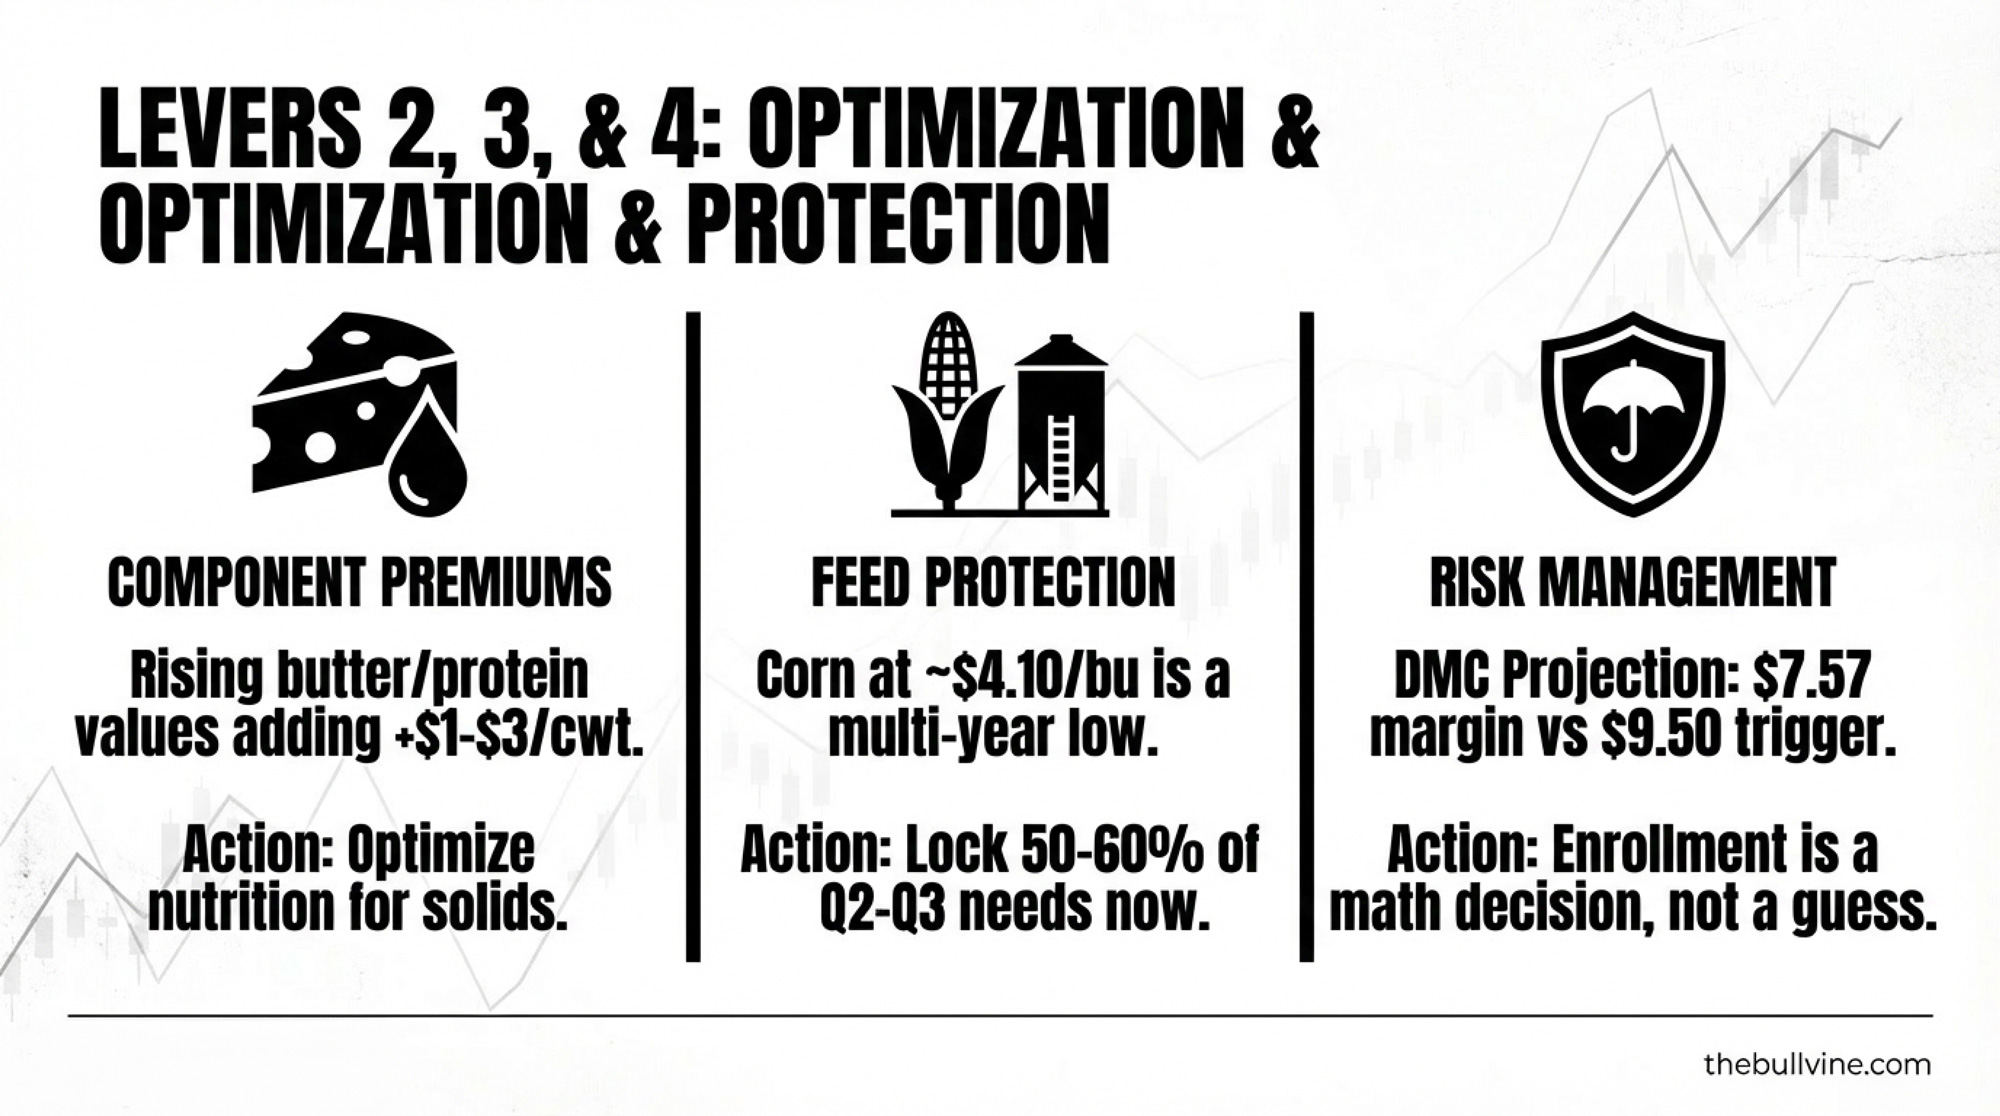
Component premiums. Gillins notes rising component values are adding $1–$3/cwt to milk checks, even in Holstein herds. Today’s WASDE bump in cheese (+2¢/lb), butter (+7¢/lb), and NDM (+11¢/lb) supports that thesis short-term. The trade-off: component improvement requires consistent nutrition programs and genetic changes that take 2–3 lactations to express. Medium-term play, not a quick fix.
Feed cost protection. Corn at $4.10/bushel (USDA’s January WASDE season-average farm price) remains genuine multi-year relief — and today’s February WASDE raised corn exports to a record 3.3 billion bushels without materially moving price forecasts. Locking 50–60% of Q2–Q3 needs now protects against upside risk. The trade-off: if grain falls further, you forgo additional savings. But at current levels, the floor matters more than the ceiling for cash flow.
Risk management enrollment. DMC enrollment for 2026 is open. With January’s margin projected at $7.57/cwt — $1.93 below the $9.50 trigger — the program is already paying. The February WASDE price bump may narrow DMC payouts in later months, but margins remain tight enough to justify coverage. The trade-off: premium costs are real, and DRP basis risk varies by plant and FMMO class.
The Consolidation Math Keeps Running
The 2022 Census of Agriculture recorded roughly 24,000 dairy operations — down 39% from 2017. DFA projects just 5,100 member farms by 2030. Cows from exiting operations are absorbed by expanding members in growth regions — Idaho, southwest Kansas, Michigan, and, increasingly, southern Georgia and northern Florida.
Ever.Ag Insights president Phil Plourd doesn’t sugarcoat what’s ahead. “It is a street fight, in terms of figuring out ways to stay relevant, to get more productive, to stay ahead of the curve, to manage risk better.” And the beef market adds a wild card: “Will high beef prices make producers stay — keep the quasi cow-calf thing going — or will they make them go, use high cattle prices to pave the exit ramp? There’s no way to know for sure.”
Hanging over everything: baseline projections from FAPRI at the University of Missouri show total government payments potentially falling from about $53 billion in FY25 to $32 billion by FY27 as temporary programs expire. FAPRI director Pat Westhoff confirmed in the institute’s April 2025 baseline that the longer-term outlook “shows a return to a downward trajectory in 2026,” and Terrain’s John Newton separately told Brownfield in May 2025 that 2025 incomes are “being propped up by over $30 billion dollars in government subsidies and disaster relief” with “no relief packages factored in the 2026 projections.”
CBO’s own February 2026 farm programs baseline shows dramatically higher near-term spending on crop programs — underscoring the cliff that forms when ad hoc payments expire. A $21 billion drop.
Signals to Watch This Quarter
- February WASDE follow-through — USDA raised all 2026 dairy prices today, with all-milk up 70 cents to $18.95. But January’s actual Class III of $14.59 and December’s $15.86 are both well below even the old annual forecast. The question for your budgets: can the second half of 2026 actually deliver the recovery USDA’s annual average implies?
- Spring Class III/IV divergence — Class IV got the biggest WASDE bump (+$1.25 to $15.70), while Class III moved only 30 cents to $16.65. Watch whether that spread continues widening, because it shifts risk for operations on Class III-heavy pay plans.
- NASS March Milk Production report — will confirm whether herd expansion is accelerating past 202,000 head or plateauing. USDA raised 2026 production to 234.5 billion pounds today. RFD-TV notes that higher slaughter rates suggest some adjustment has begun, but beef-on-dairy revenues are softening the immediate exit signal.
- DFA and regional co-op component premium announcements — any reductions signal processors repricing the butterfat surplus Geiger flagged.
What This Means for Your Operation
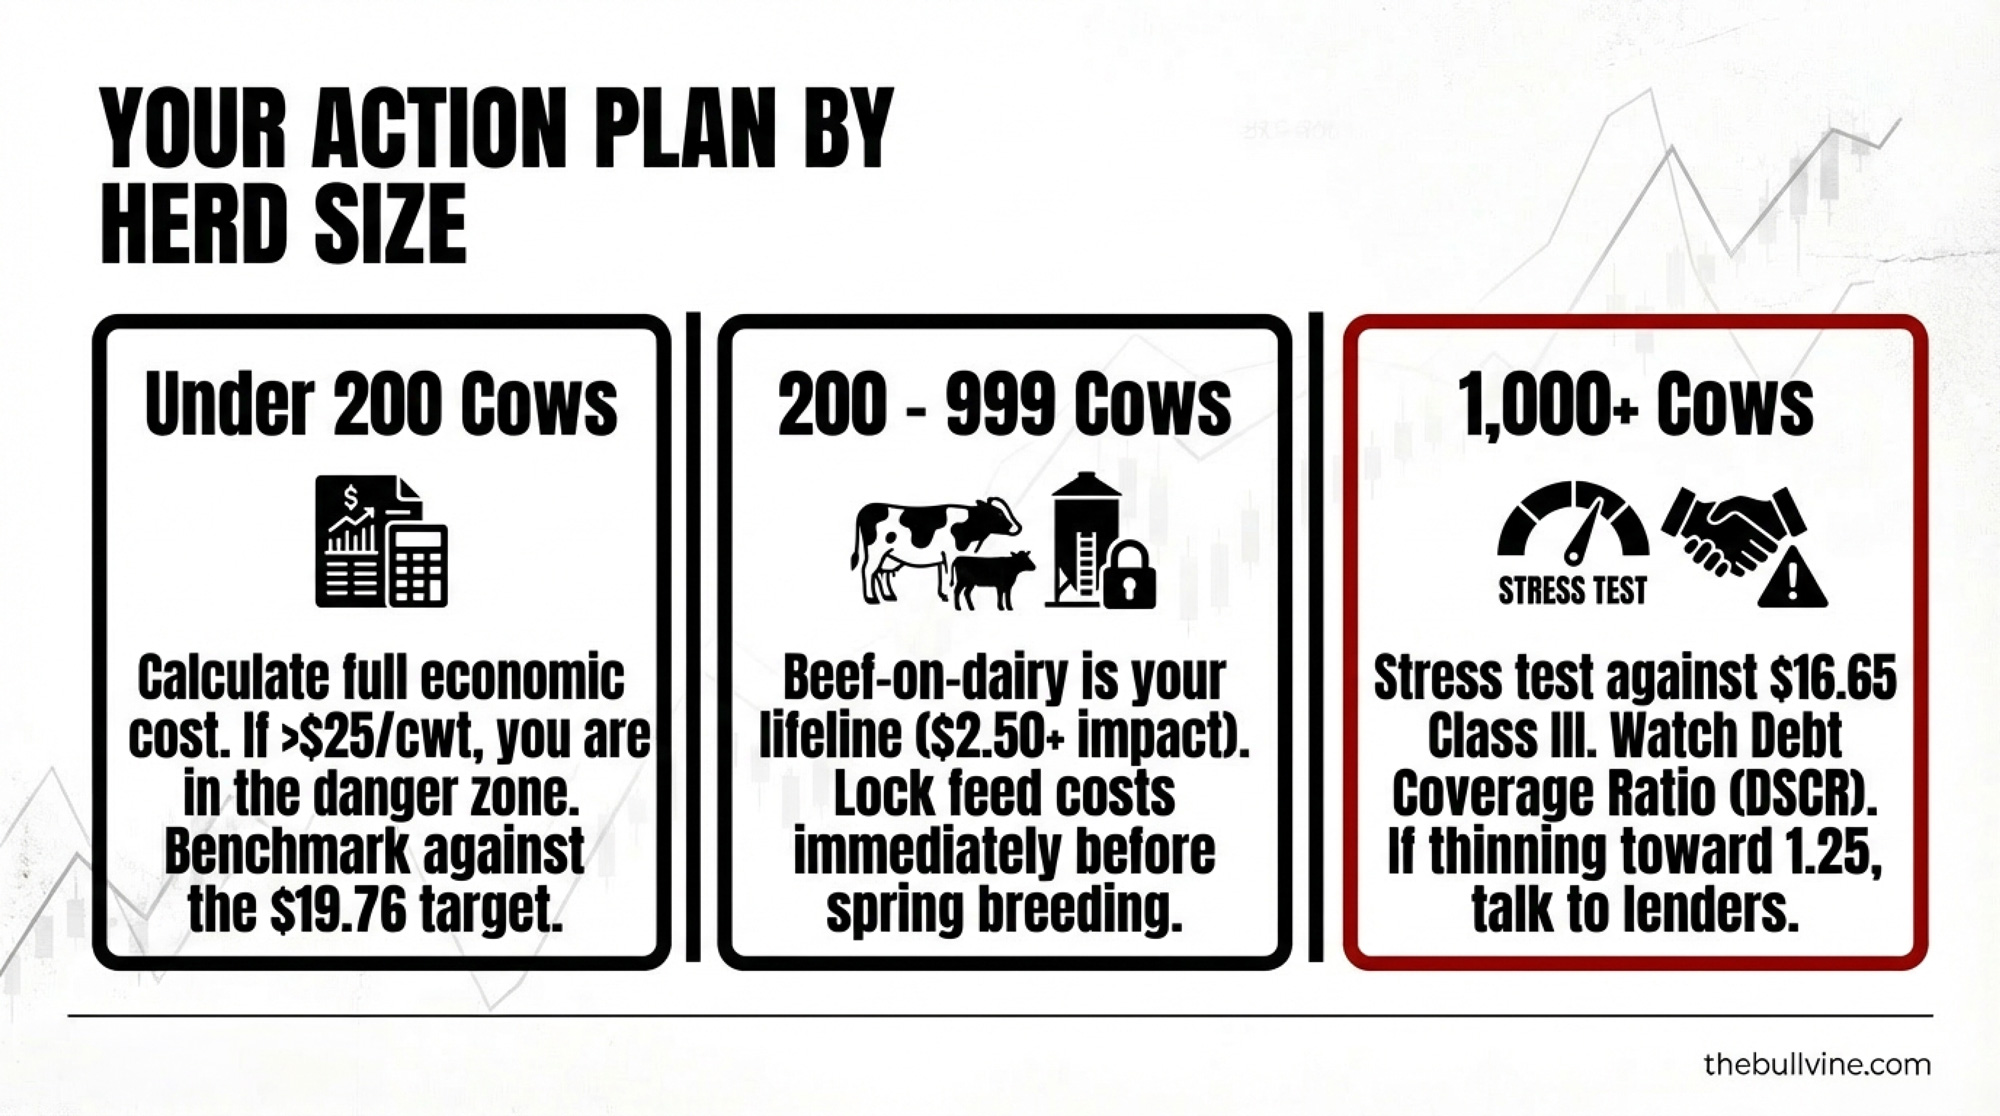
If you run fewer than 200 cows: Your most important number right now is full economic cost of production — including family labor, depreciation, and return on capital. Compare it to the USDA-ERS benchmarks from the 2021 ARMS. If you’re above $25/cwt, the gap to $18.95 milk is still over $6/cwt — roughly $140/cow annually on a 20,000-lb herd. Today’s WASDE bump helps at the margins, but it doesn’t close that gap. The Hoard’s data shows the best operators in your size class run below $20—where does yours sit? And if your dairy is part of a diversified operation, the COP threshold shifts — but the question of whether the dairy enterprise stands on its own economics still matters for long-term capital allocation.
If you run 200–999 cows: A 300-cow herd averaging 23,000 lbs/cow produces roughly 69,000 cwt annually. The updated all-milk price decline from $21.17 to $18.95 — a $2.22/cwt drop — means approximately $153,000 in gross lost milk revenue versus 2025. Component premiums and marketed volume adjustments may reduce the net hit to $100,000–$130,000 for many operations, but the math is still unforgiving. Beef-on-dairy, component optimization, and feed cost protection are your most accessible near-term levers. Run the numbers before spring breeding decisions lock in.
If you run 1,000-plus cows: Your cost structure likely generates some market-based margin at $18.95 milk — the 2,000+ average of $19.14 is now just 19 cents above the all-milk price. Razor-thin. Stress-test against $16.65 Class III— where the February WASDE now projects the 2026 average — and check your debt service coverage ratio at that level. If DSCR is thinning toward 1.25 or below, talk to your lender now, not after a bad quarter forces the conversation.
Key Takeaways
- Pull your full economic cost of production this month. Compare honestly to the $18.95 milk, the new February WASDE all-milk figure. That single comparison tells you whether your operation generates market-based margin or subsidy-dependent margin.
- Calculate your government payment share of the 2025 net income. If it’s approaching 25–30%, model what your books look like if payments fall by a third, which FAPRI baseline projections and CBO’s February 2026 farm programs baseline both suggest could happen as ad-hoc programs expire.
- Evaluate beef-on-dairy economics. At $2.50–$3.00/cwt added revenue across DFA’s membership, the entry cost ($40–$50/head genomic testing through Zoetis or Neogen, plus sexed semen) has a short payback — but only if you have the heifer pipeline to support it. With replacements at $3,010/head nationally as of July 2025, every breeding decision carries more weight than it used to.
- Lock feed costs while corn sits near $4.10. It won’t close a revenue gap alone, but it protects cash flow against the one input you can actually control right now.
- If your margin is structurally negative even at $18.95 milk and with feed relief, model exit timing now. Replacement heifers hit $3,010/head nationally in July 2025, up from $2,660 in January 2025 and $1,720 in April 2023, per USDA data. Strong cull cow prices mean a planned dispersal captures far more value than a forced one later. The risk: if you sell alongside a wave of other exits, buyer fatigue compresses values before you close. Planning beats reacting.
- Track USDA’s quarterly replacement heifer prices. If the national average drops back below $2,500, it’s a signal the exit window may be narrowing faster than it looks on paper.
| Asset/Income Source | Planned Exit (2026) | Forced Exit (2027-28 Scenario) | Value Difference |
|---|---|---|---|
| Replacement Heifer Price | $3,010/head | $2,200/head | -$810/head |
| Cull Cow Price | $140/cwt (1,300 lb) | $95/cwt (1,300 lb) | -$585/head |
| Dairy Equipment (% of replacement) | 75-85% | 45-60% | -25-30% |
| Herd Sale (300 cows) | ~$903,000 (replacements) | ~$660,000 (replacements) | -$243,000 |
| Cull Value (80 culls/yr) | ~$145,600 | ~$98,800 | -$46,800 |
| Land (if owned, $/acre premium) | Strong farmland demand | Softening as exits increase | -10-15% |
The Bottom Line
The 29% is a national average. Your number is the one that matters. Today’s WASDE brought the all-milk forecast up 70 cents — welcome news, but not a rescue. And if you haven’t compared your full economic COP to your neighbor’s in the last twelve months, spring 2026 — with DMC paying, feed at multi-year lows, and breeding decisions ahead — is the time to do it honestly.
Complete references and supporting documentation are available upon request by contacting the editorial team at editor@thebullvine.com.
Learn More
- Beyond the Milk Check: How Dairy Operations Are Building $300,000 in New Revenue Today – Stop the bleeding and start building a $300,000 revenue buffer. This operational breakdown delivers the exact tactics—from feed shrink management to strategic beef breeding—needed to stabilize your cash flow before market volatility erases your 2026 margins.
- Your Lender’s Already Doing the Math: The 45-Day Survival Guide for Mid-Sized Dairy Operations – Step into your banker’s office with the upper hand. This strategic guide exposes the structural reset facing mid-size dairies and arms you with a 45-day survival plan to secure favorable financing while others are forced into liquidation.
- Beef-on-Dairy’s $3,000 Trap: 800,000 Missing Heifers and Who Pays the Bill – Expose the hidden risks in the industry’s biggest shift. This deep dive reveals the 800,000-heifer shortage that’s redefining replacement economics, arming you with the data to navigate $3,000 price tags and out-maneuver competitors in a tightening market.
 Join the Revolution!
 Join the Revolution!
Join over 30,000 successful dairy professionals who rely on Bullvine Weekly for their competitive edge. Delivered directly to your inbox each week, our exclusive industry insights help you make smarter decisions while saving precious hours every week. Never miss critical updates on milk production trends, breakthrough technologies, and profit-boosting strategies that top producers are already implementing. Subscribe now to transform your dairy operation’s efficiency and profitability—your future success is just one click away.


