


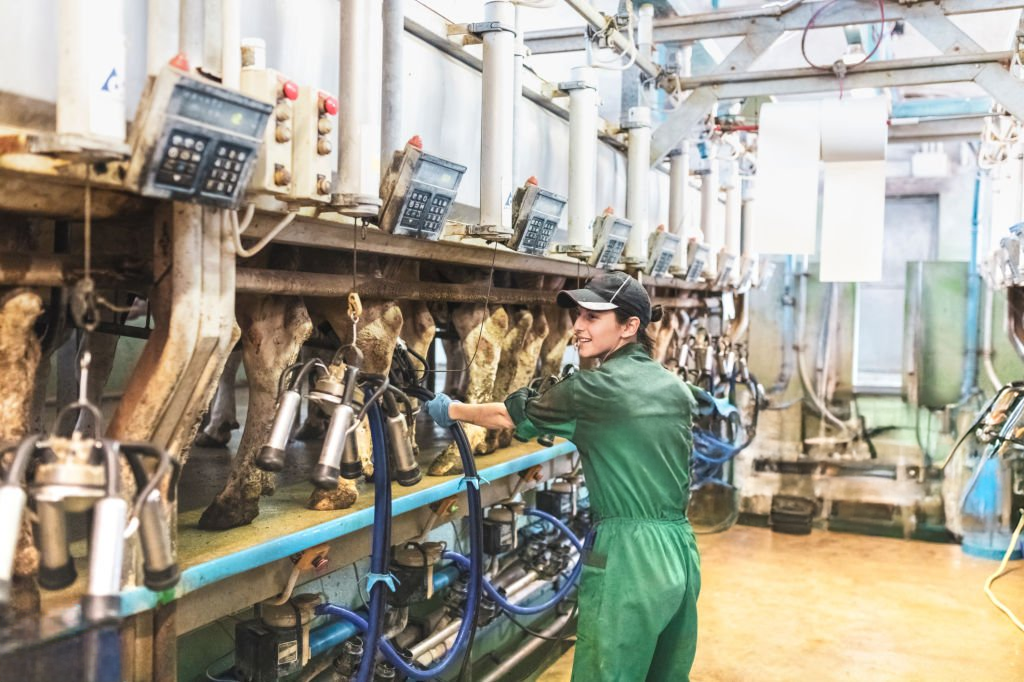
Your genetics are perfect for 2015’s market—but it’s 2025, and processors want different components
EXECUTIVE SUMMARY: What farmers are discovering across the country is that today’s unprecedented $2.47 per hundredweight spread between Class III and Class IV milk prices isn’t just another market cycle—it’s a structural shift that demands strategic action before spring 2026. The numbers tell a sobering story: a typical 500-cow dairy locked into Class IV pricing faces a $15,000 monthly disadvantage compared to neighbors shipping to cheese plants, according to October’s USDA pricing data and analysis from the University of Wisconsin’s dairy markets program. This spread, the widest we’ve sustained since 2011, stems from three converging factors that aren’t going away: our herds now average mid-four percent butterfat when processors desperately need protein, China’s dairy imports have declined significantly as they’ve built domestic capacity equivalent to Wisconsin’s entire annual production, and billions invested in cheese plants can’t process the butterfat surplus we’re creating. Research from Cornell’s dairy program and the Center for Farm Financial Management shows operations successfully navigating this transition fall into three clear paths—strategic expansion for those near cheese plants with strong succession plans, smart adaptation through component management and risk tools for those with moderate leverage, or planned exits that preserve 85-95% of asset value versus the 50-65% retained in forced sales. The window for action is narrowing, with historical consolidation patterns suggesting the best opportunities for expansion and the most favorable exit terms will close by spring 2026. Here’s what’s encouraging: producers who honestly assess their situation using clear decision frameworks and act decisively—regardless of which path they choose—consistently achieve better outcomes than those waiting for conditions to improve.
What farmers are discovering about today’s unprecedented Class III-IV differential—and how the smartest operations are turning crisis into opportunity while others prepare strategic exits
Tim Anderson was checking tank weights at 4:45 a.m. in his South Dakota parlor when the October milk statement arrived on his phone. The Federal Order changes that took effect in June had dropped his mailbox price again—another reminder that the reforms we’d hoped would help actually made things more challenging for many of us, particularly those shipping Class IV milk.
What struck me about Tim’s situation was this: while he was preparing to expand by acquiring a neighbor’s operation, a California producer I’d met at the Holstein convention was making equally prudent plans to exit the industry entirely. Same market conditions. Same unprecedented pricing spread between Class III and Class IV milk. Yet both were making the right decision for their particular circumstances.
TL;DR – THE 30-SECOND VERSION
- The Crisis: $2.47/cwt Class III-IV spread—widest since 2011
- The Impact: $15,000 monthly loss for 500-cow Class IV operations
- The Choice: Expand, adapt, or exit by spring 2026
BY THE NUMBERS: KEY FACTS AT A GLANCE
- $2.47/cwt – Current Class III-IV spread (October 2025)
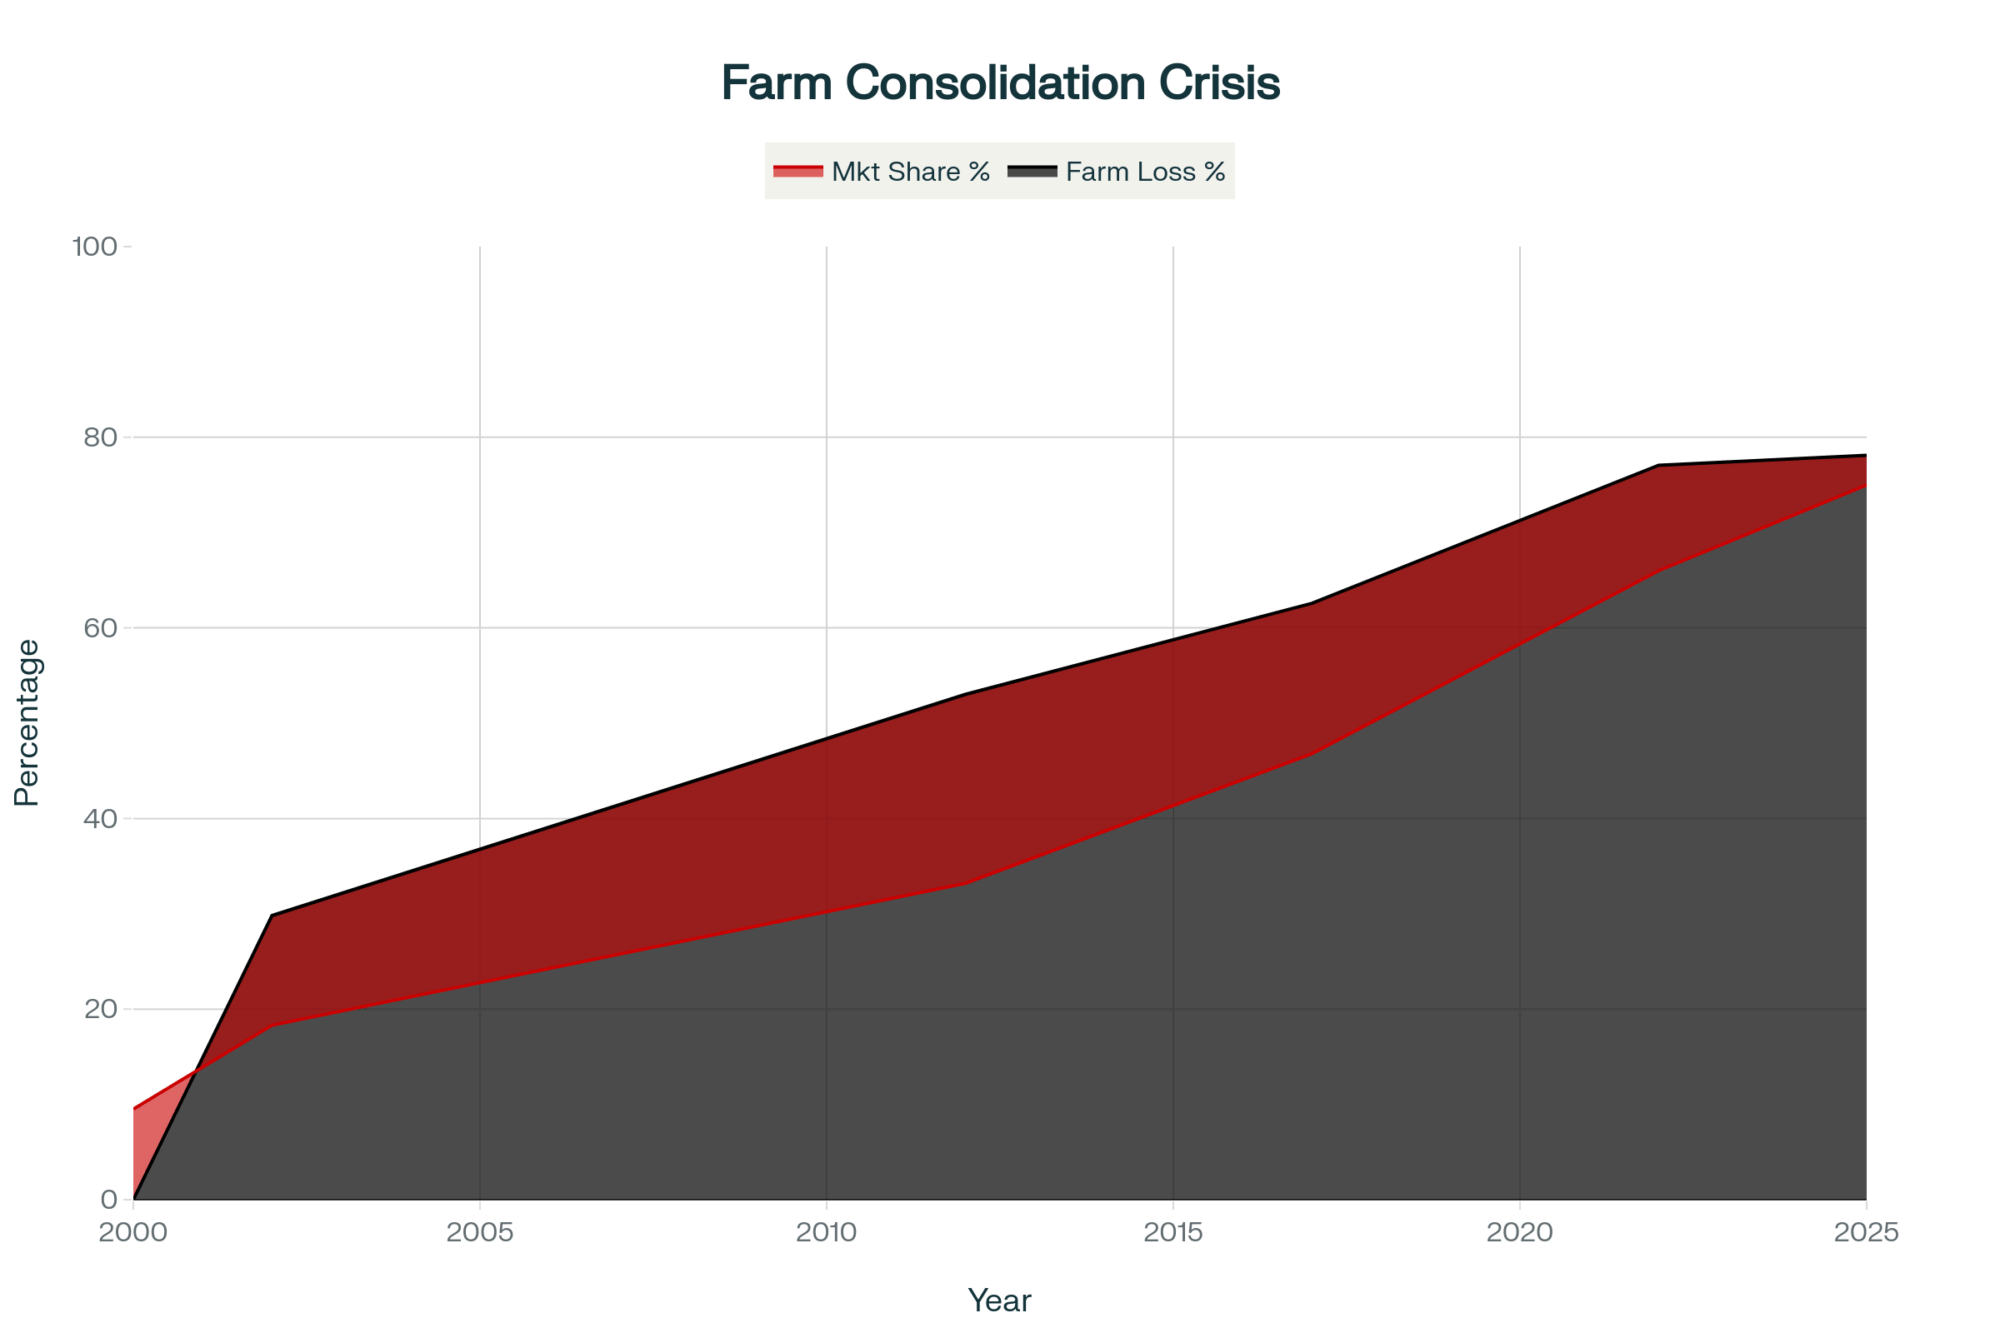
- 32,000 → 23,000 – Projected U.S. dairy farms by 2027
- $15,000/month – Income gap for 500-cow Class IV operations
- 85-95% – Asset value retained in planned exits vs. 50-65% in forced sales
- 14 months – Average technology payback period for smart investments
QUICK ACTION GUIDE: YOUR 90-DAY ROADMAP
| Your Situation | Your Path | First Step This Week |
| ✅ Under 45, near cheese plants, succession secured | EXPAND | Call the banker for acquisition credit |
| ⚖️ Moderate debt, some flexibility, 5-10 year horizon | ADAPT | Schedule a component optimization consult |
| 🔄 No succession, burning equity, geographic disadvantages | TRANSITION | Get a professional valuation |
Resources to get started:
- LGM-Dairy information: Your local FSA office or check the RMA website
- Component optimization: Talk to your nutritionist or extension dairy specialist
- Market analysis: University of Wisconsin’s Understanding Dairy Markets program
- Exit planning: The Center for Farm Financial Management has excellent resources
Understanding Today’s Market—It’s Different This Time
So you’ve probably noticed your milk check acting strange lately. If you’re fortunate enough to ship Class III milk for cheese production, October’s USDA pricing announcement puts you around seventeen dollars per hundredweight. But what about milk that goes to butter and powder production? You’re looking at about $14.50.
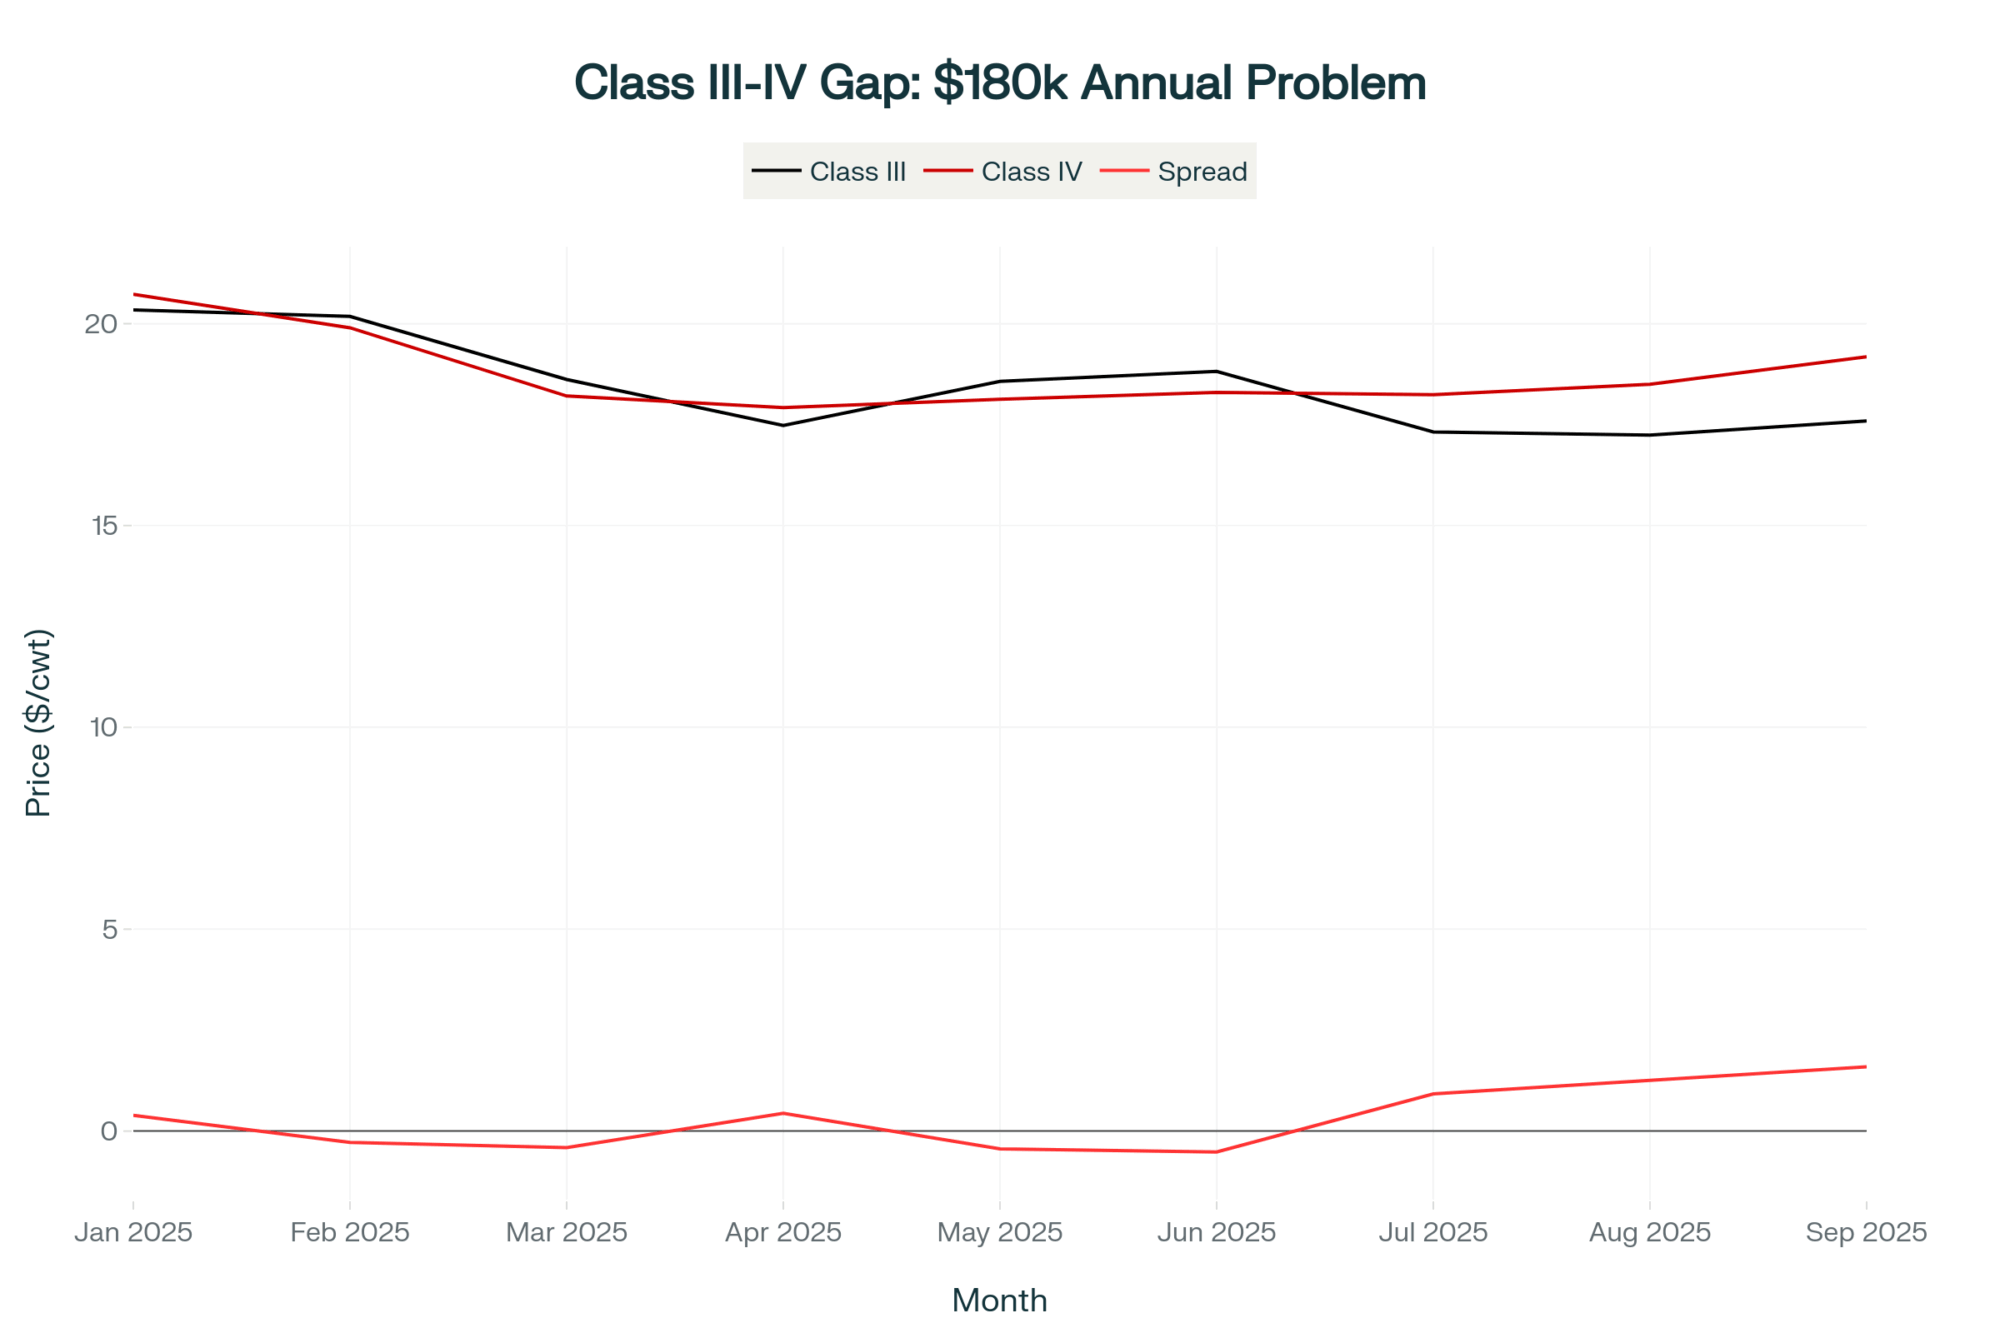
Now, here’s what’s interesting—this differential of roughly two dollars and forty-seven cents is something we haven’t seen sustained at this level since 2011. The folks at the University of Wisconsin’s dairy markets program have been tracking this, and historically, we’ve seen spreads average well below a dollar per hundredweight. When it gets this wide, it fundamentally changes the economics of dairy farming depending on what your milk is used for.
Why This Spread Hits Different
You know, I was reviewing the numbers last week, and for a typical 500-cow dairy, being locked into Class IV pricing versus Class III means you’re looking at roughly $15,000 less income every month. That’s real money—the difference between breaking even and burning equity.
Mark Stephenson, who runs UW-Madison’s dairy policy analysis program, made a point recently that really resonated with me. He’s saying this looks more like a structural market shift than the typical cycles we’re used to riding out. And I think he’s right.
What’s also worth noting is the international perspective here. A New Zealand producer I connected with online mentioned they’re dealing with similar component imbalances, though their cooperative structure handles it differently. Sometimes, examining how other countries address these challenges provides us with fresh insights.
The Component Balance Nobody Planned For
The dairy industry has made significant progress in genetic advancements over the past twenty years. Council on Dairy Cattle Breeding data shows most herds now average in the mid-four percent range for butterfat, while protein levels sit in the low threes. That’s remarkable progress, really.
But here’s the thing—I was at a Wisconsin Center for Dairy Research meeting last month, and John Lucey made this observation that stuck with me. He said we essentially optimized our genetics for a market that existed when China was buying everything we could produce. Those breeding decisions made sense at the time, but now…
A Wisconsin producer told me last week, “My DHI reports look fantastic—4.4% butterfat, 3.2% protein. Ten years ago, I’d be thrilled. Now my processor is penalizing me for excess butterfat.” And that’s the reality many of us are dealing with. Even if we completely changed our breeding strategy today—focused entirely on protein—we’re looking at five to seven years before those genetics fully express themselves in the milking herd.
The Export Picture Has Changed
What’s happened with exports is particularly sobering. USDA’s Foreign Agricultural Service has been tracking China’s dairy imports, and they’ve declined significantly from where they were just a few years back. The Chinese have made massive investments in domestic production—it’s a food security thing for them, and honestly, you can understand why.
I was speaking with a dairy economist from Cornell last month, who shared something that really puts this into perspective: China added more milk production capacity between 2020 and 2024 than Wisconsin produces in an entire year. That’s not a temporary blip—that’s a fundamental change in global dairy markets.
And Mexico—our biggest export market, taking about 30% of what we send overseas—they’re implementing their own expansion plans. The U.S. Dairy Export Council has been monitoring this closely, and it appears that our exports to this market could decline significantly over the next few years.
Down in the Southeast, producers are feeling this too. A Georgia dairyman I know said, “We used to count on steady growth in powder exports through Savannah. Now we’re planning for flat to declining volumes.”
Peter Vitaliano at National Milk made a point that I think deserves serious consideration. These aren’t the kind of temporary trade disputes that get resolved when administrations change. These are countries making long-term strategic decisions about food security.
Processing Capacity in the Wrong Places
Since 2020, the dairy industry has invested billions in new processing capacity—CoBank’s been documenting this, and it’s impressive. The problem is that we have a mismatch. Most of the investment went into cheese plants, but we’re producing more butterfat than those plants know what to do with.
A processing engineer explained it to me this way: “Converting a cheese plant to butter production would be like trying to turn a Toyota factory into a bakery. Everything about the process is different—the equipment, the workflows, everything.”
Making Sense of Your Options: A Framework
Through conversations with producers across the Midwest and lenders from various institutions, I’ve noticed successful operations tend to evaluate these factors honestly:
Eight Questions That Matter
| What to Consider | Good Position | Challenging Position |
| Cash Flow | Breaking even or better | Burning over $40K monthly |
| Succession | Kids are committed | No clear plan |
| Your Energy | Ready for big changes | Exhausted thinking about it |
| Location | Near cheese plants | Stuck with Class IV |
| Debt Level | Under 45% debt-to-asset | Over 60% debt-to-asset |
| Your Age | Under 45 | Over 58 |
| Other Options | Dairy’s your best bet | Better opportunities exist |
| Staying Power | Can handle 24 months | Less than 12 months of runway |
You know, if you’re scoring well on six or more of these, you might want to think about expansion or really pushing adaptation. If you’re only hitting a couple? Well, that’s a different conversation entirely.
There’s another factor worth considering—cooperative strategies. I’ve been hearing about groups of smaller producers pooling resources for shared technology investments or negotiating power. It’s not for everyone, but it’s an option some are exploring.
The Opportunities Hidden in This Market
Cornell’s dairy program has documented how consolidations like this historically create opportunities for those positioned to capture them. And we’re seeing that play out right now.
What’s Available If You’re Looking
The auction tracking services—Machinery Pete, Ritchie Brothers—they’re reporting some interesting numbers:
- Complete dairy operations going for $1,200-1,500 per cow (replacement cost is easily double that)
- Used equipment at 40-60% of new prices
- Dairy-suitable land down 20-30% from recent peaks
I talked with a South Dakota producer last week who just acquired a 400-cow operation for $1,350 per cow. “Five years ago,” he said, “this would’ve cost me three grand per cow minimum. The math is completely different at these prices.”
However, and this is crucial, you must plan the integration carefully. Another producer I know rushed an acquisition and told me, “I got a great price on the cows, but I totally underestimated integration costs. It took 18 months before we saw positive cash flow from that expansion.”
How Processor Relationships Are Changing
As neighbors exit and milk supplies tighten in certain regions, the producers who remain are finding themselves in a different negotiating position. I’ve been hearing about some interesting deals in Wisconsin and Minnesota:
- Protein premiums running $0.35-0.40/cwt
- Volume commitment bonuses of $0.25-0.30/cwt
- Quality bonuses for low somatic cells hitting $0.20-0.25/cwt
Add it all up, and some operations are getting close to a dollar per hundredweight above base prices. That’s significant money.
A procurement manager explained the processor’s perspective to me: “We’d rather pay premiums to secure a reliable supply than risk running our plant at 70% capacity. Empty vats don’t pay bills.”
The Economics of Exit—Let’s Be Honest About This
| How You Exit | What You Keep | Timeline | 500-Cow Example |
| 🟢 Planned Exit | 85-95% of value | You control it | $5.5M → $4.7-5.2M |
| 🔴 Forced Sale | 50-65% of value | Bank controls it | $5.5M → $2.8-3.6M |
| 🟡 Alternative Use | Sometimes, more than dairy value | 18-24 months | Varies widely |
These numbers come from the Center for Farm Financial Management’s analysis of recent dairy exits
When Getting Out Makes Sense
This is a difficult topic to discuss, but for some operations, planning an orderly exit can be the smartest business decision. I recently worked with a Pennsylvania producer who put it this way: “It wasn’t about giving up. It was recognizing I could preserve $3 million in equity by exiting now versus maybe $1 million if I waited until the bank forced it.”
Different Regions, Different Opportunities
In California’s Central Valley, water costs have reached $400-500 per acre-foot, according to the state’s water resources data. Combined with being locked into Class IV pricing, the math becomes challenging. Several producers I know are finding better returns with solar leases at $1,200-$ 1,500 per acre annually, or converting to almond production.
One California producer told me straight up: “Between water costs, regulations, and Class IV pricing, I’m basically paying for the privilege of milking cows. That’s not a business—that’s an expensive hobby.”
In the Northeast—specifically, Vermont, New York, and Pennsylvania—fluid premiums that used to be $0.35 are now under a dollar, according to Federal Order One data. But here’s the thing: development pressure means land values remain strong. A Vermont producer recently sold 200 acres for development at $18,000 per acre. “The irony,” he said, “is that the same development pressure that makes farming difficult also creates our exit opportunity.”
The Upper Midwest generally has more flexibility, though distance from cheese plants matters more than ever. Every ten miles from processing adds about ten cents per hundredweight in hauling costs. Beyond fifty miles? That becomes a real structural disadvantage.
Down South, the situation varies widely. A Tennessee producer shared, “We’re seeing opportunities in agritourism and direct sales that didn’t exist five years ago. Some of my neighbors are making more from farm tours than milk sales.”
There is a growing trend in North Carolina and Virginia, where producers are converting to grass-fed operations for premium markets. It’s not easy, but for some, it’s working.
Adaptation Strategies That Are Actually Working
For most of us—those neither expanding nor exiting—we need to make some significant adjustments. Here’s what I’m seeing work:
Getting Components Right
Mike Hutjens, the Illinois nutritionist many of you are likely familiar with, has been working with farms on this. In recent trials he supervised, producers saw:
- Protein boost of about 0.18% at twenty cents per cow daily
- Some fat reduction that actually saved money
- Net improvement of thirty to forty-five cents per hundredweight
“We’re not trying to eliminate butterfat,” Mike explains. “The genetics won’t let us. We’re optimizing the ratio to match what processors want.”
Risk Management That Makes Sense
I talked with a Wisconsin producer running 500 cows who shared his approach: “I cover 60% with LGM-Dairy—costs about forty cents per hundredweight after subsidies. Another 25% with Class III puts. Leave 15% open for upside. Total cost? About five grand monthly. But it guarantees I can pay bills regardless of what the market does.”
What’s changed is how lenders view this. “It used to be seen as speculation,” a Minnesota producer told me. “Now my banker basically requires it.”
Technology Investments That Pay
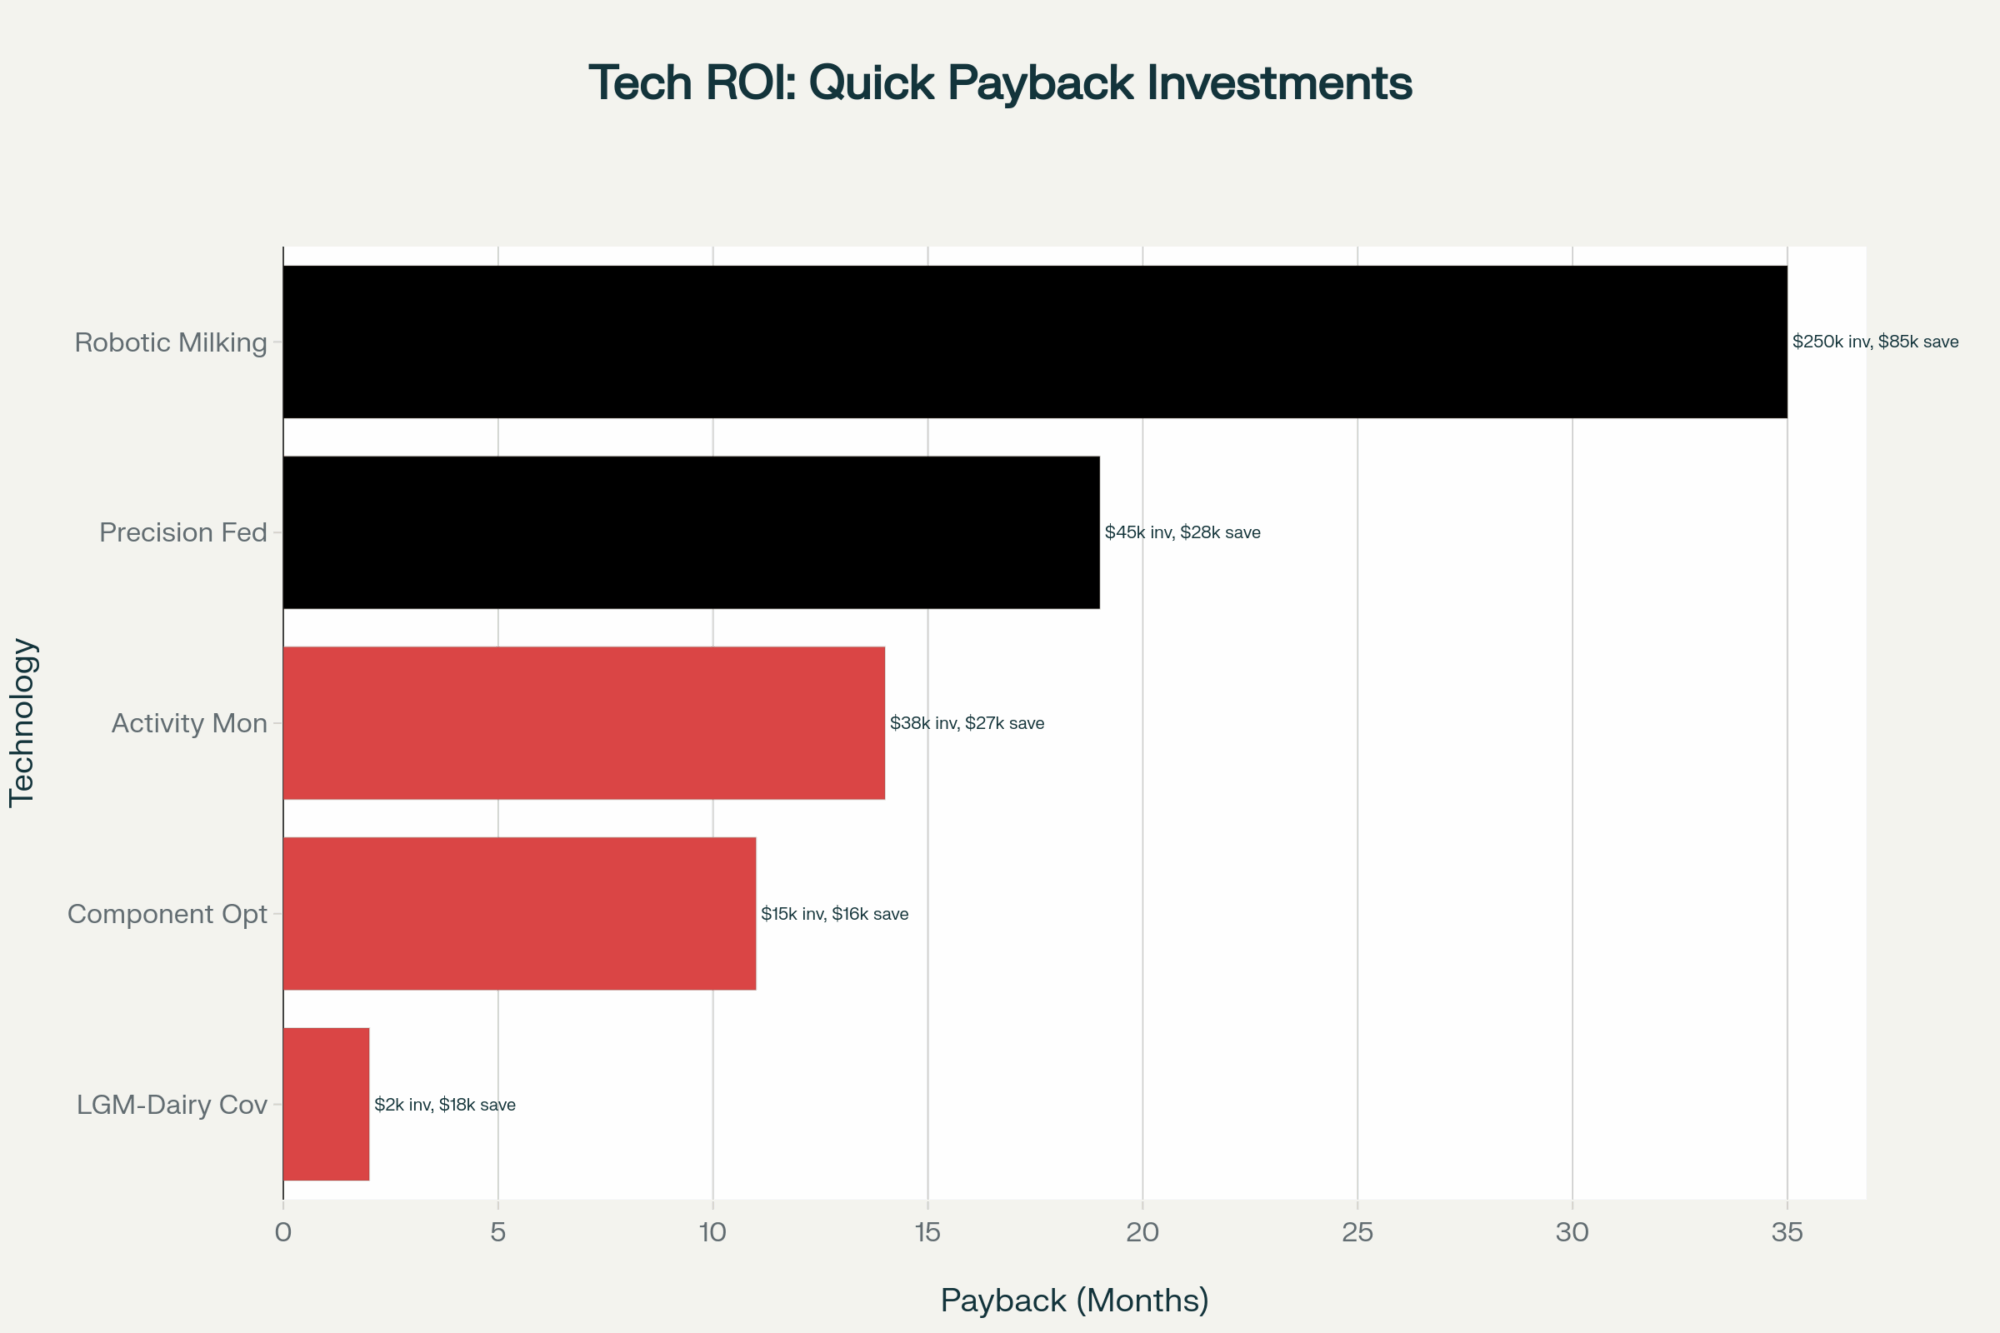
Not every technology makes sense, but some really do. A Minnesota dairy with 600 cows shared their results with activity monitors:
- Spent $38,000 on the system
- Pregnancy rate went from 18% to 24%
- Health treatment costs dropped $18 per cow annually
- Saved an hour and a half daily on heat detection
- Paid back in 14 months
“The key,” the owner said, “is choosing technology that solves a specific problem, not just buying the latest gadget.”
I’ve also seen good returns from robotic milking in certain situations. An Ohio producer with 180 cows installed robots last year: “It’s not just labor savings—our components improved, SCC dropped, and my knees don’t hurt anymore.”
However, there’s another aspect to consider—data management systems. A Michigan producer running 800 cows told me their investment in comprehensive herd management software paid back in eight months through better breeding decisions and health interventions alone.
How Federal Order Reform Actually Played Out
So the changes that took effect June 1st… they didn’t go quite as we’d hoped. USDA’s November announcement increased make allowances—what processors deduct for manufacturing costs—pretty substantially:
| Product | Old Rate | New Rate | Impact on Your Milk Check |
| Cheese | $0.20/lb | $0.25/lb | Down about $0.52/cwt |
| Butter | $0.17/lb | $0.23/lb | Down about $0.56/cwt |
| Powder | $0.17/lb | $0.24/lb | Down about $0.72/cwt |
The net effect? Most of us are down eighty-six to ninety-one cents per hundredweight through November. Component improvements are scheduled for December 1st, which should help—USDA estimates about fifty cents—but we’re still in the hole.
As Marin Bozic at the University of Minnesota put it, “Federal Order reform addressed how we calculate prices, but it can’t fix the fundamental supply-demand imbalance. We’re producing components the market doesn’t want at current levels.”
Looking Ahead—What This Industry Becomes
Based on what we’re seeing now and historical patterns from USDA’s Economic Research Service, if current trends continue—and that’s a big if—by 2027, we might see:
- Total operations dropping to maybe 23,000-24,000 from today’s 32,000
- Average herd size passing 500 cows nationally
- The biggest 2,000 operations controlling half of all production
- Smaller operations under 200 cows are becoming increasingly specialized or exiting
The growth appears to be occurring in areas such as South Dakota (three new cheese plants), Idaho (water and infrastructure), and the Texas Panhandle (feed availability and new processing facilities). Meanwhile, California, the Northeast, and remote areas of the Midwest are experiencing contraction.
What’s particularly interesting is how quickly certain things are becoming standard. A processor quality manager told me: “Five years ago, maybe 20% of our producers actively managed components. Now it’s 75% and growing. If you’re not adapting, you’re at a serious disadvantage.”
Looking internationally, the EU is facing similar consolidation pressures, although its subsidy structure creates different dynamics. Sometimes I think we focus so much on our own challenges that we miss that this is a global phenomenon.
Your Three Paths Forward
After looking at how different operations are navigating this, three strategies keep emerging:
Path 1: Strategic Expansion
If you’re under 45, near cheese plants, with succession secured
Your next 90 days:
- Weeks 1-2: Set up that acquisition credit line
- Weeks 3-4: Identify who might sell
- Month 2: Approach them privately
- Month 3: Do your homework thoroughly
A South Dakota producer who just expanded told me, “The cheap part was buying the cows. The expensive part was integrating them properly. Budget twice the time and money you think you’ll need.”
Path 2: Smart Adaptation
If you’ve got moderate debt, some flexibility, and 5-10 years left
Focus on these priorities:
- Get your nutritionist working on components immediately
- Set up LGM-Dairy coverage (seriously, do this)
- Talk to your processor about premium programs
- Only buy technology with a clear payback under 18 months
“The mistake I see,” a Wisconsin banker told me, “is producers trying to change everything at once. Pick two or three high-impact changes and execute them well.”
Path 3: Strategic Exit
If there’s no succession, you’re burning equity, or better opportunities exist
Protect what you’ve built:
- Get a professional valuation now
- Talk to your accountant about tax optimization
- Explore all options—whole farm, parcels, alternative uses
- Most importantly: control your timeline
A Pennsylvania dairyman who recently retired reflected: “I spent 40 years building this operation. Taking 18 months to exit properly preserved 40% more value than if I’d waited until the bank forced it.”
The Window Is Closing
Considering market dynamics and historical patterns, the window for capturing opportunities or avoiding worse outcomes likely extends through spring 2026. After that, options start getting limited.
What I’ve noticed is that producers who honestly assess their situation and act decisively—regardless of which path they choose—consistently outperform those who wait for conditions to improve.
As I finish writing this, I’m thinking about Tim Anderson in South Dakota, probably heading out for evening milking. And that California producer, maybe reviewing exit strategies with his accountant. Both are facing this with eyes wide open. Both are making the right call for their situation.
The dairy industry will get through this transition—it always does. The question is whether your operation will be part of what comes next, and if so, in what form.
Take the Next Step
The conversations I’ve had while researching this article convinced me of one thing: having a clear framework for decision-making is essential right now. That’s why we’ve been working on resources to help producers evaluate their situations objectively.
Here’s what can help:
- Connect with other producers facing similar decisions through The Bullvine’s online forums
- Access our collection of planning worksheets and calculators
- Read detailed regional market analyses updated weekly
- Join our monthly video discussions with industry experts
Have specific questions about your operation? Send them to us—we’re featuring reader questions in upcoming articles, and your situation might help others facing similar decisions.
Because in today’s dairy industry, none of us should have to figure this out alone.
KEY TAKEAWAYS
- The $180,000 annual impact is real and measurable: Operations shipping Class IV milk to butter/powder plants face a $2.47/cwt disadvantage that translates to $15,000 monthly losses for a 500-cow dairy—money that determines whether you’re building equity or burning through it while neighbors with identical herds but different processors thrive.
- Three proven paths emerged from producer experiences: Expand strategically if you’re under 45 with cheese plant access and can acquire operations at current valuations of $1,200-1,500 per cow (half of replacement cost), adapt through component optimization that delivers $0.30-0.45/cwt improvements and LGM-Dairy coverage costing $0.40/cwt after subsidies, or exit strategically while controlling timing to preserve 85-95% of asset value.
- Component management pays immediate dividends: Wisconsin and Minnesota producers working with nutritionists report achieving 0.18% protein increases at $0.20/cow daily cost while reducing expensive butterfat supplements, netting $0.30-0.45/cwt improvements—that’s $36-54 more per cow monthly without genetic changes that take five to seven years.
- Geography increasingly determines destiny: Every 10 miles from cheese processing adds $0.10/cwt in hauling costs, California’s Central Valley producers face $400-500/acre-foot water costs plus Class IV lock-in, while Northeast operations see fluid premiums drop from $3.50 to under $1.00/cwt—but development opportunities offer $15,000-25,000/acre exits.
- Technology investments with 14-18 month paybacks make sense now: Activity monitoring systems ($38,000 for 600 cows) boost pregnancy rates from 18% to 24% while cutting health costs $18/cow annually, and smart producers focus on solving specific problems—heat detection, health intervention, component optimization—not buying the latest gadgets.
Complete references and supporting documentation are available upon request by contacting the editorial team at editor@thebullvine.com.
Learn More:
- Pick Your Lane or Perish: The 18-Month Ultimatum Facing 800-1,500 Cow Dairies – Reveals specific strategies mid-size dairies are using to navigate the same $2.47 spread, with real examples of operations choosing commodity versus premium markets and the financial outcomes driving their decisions
- 1,810 Dairy Farms to 24: Inside North Dakota’s Collapse – and Why You’re Next – Demonstrates how consolidation creates both acquisition opportunities and exit pressures, providing critical insights into regional market dynamics and the timeline for strategic positioning before opportunities vanish
- The Smart Money Move Most Dairies Are Missing: Why Pair Housing Your Calves Just Makes Sense – Explores cost-effective technology and management innovations that deliver 14-18 month paybacks, showing how strategic investments in efficiency can offset Class IV pricing disadvantages without major capital requirements
 The Sunday Read Dairy Professionals Don’t Skip.
 The Sunday Read Dairy Professionals Don’t Skip.
Every week, thousands of producers, breeders, and industry insiders open Bullvine Weekly for genetics insights, market shifts, and profit strategies they won’t find anywhere else. One email. Five minutes. Smarter decisions all week.


