


Hilmar, Leprino, and Valley Queen are pulling milk toward new regions. For producers in traditional dairy states, the math has changed—and so have the breeding goals.
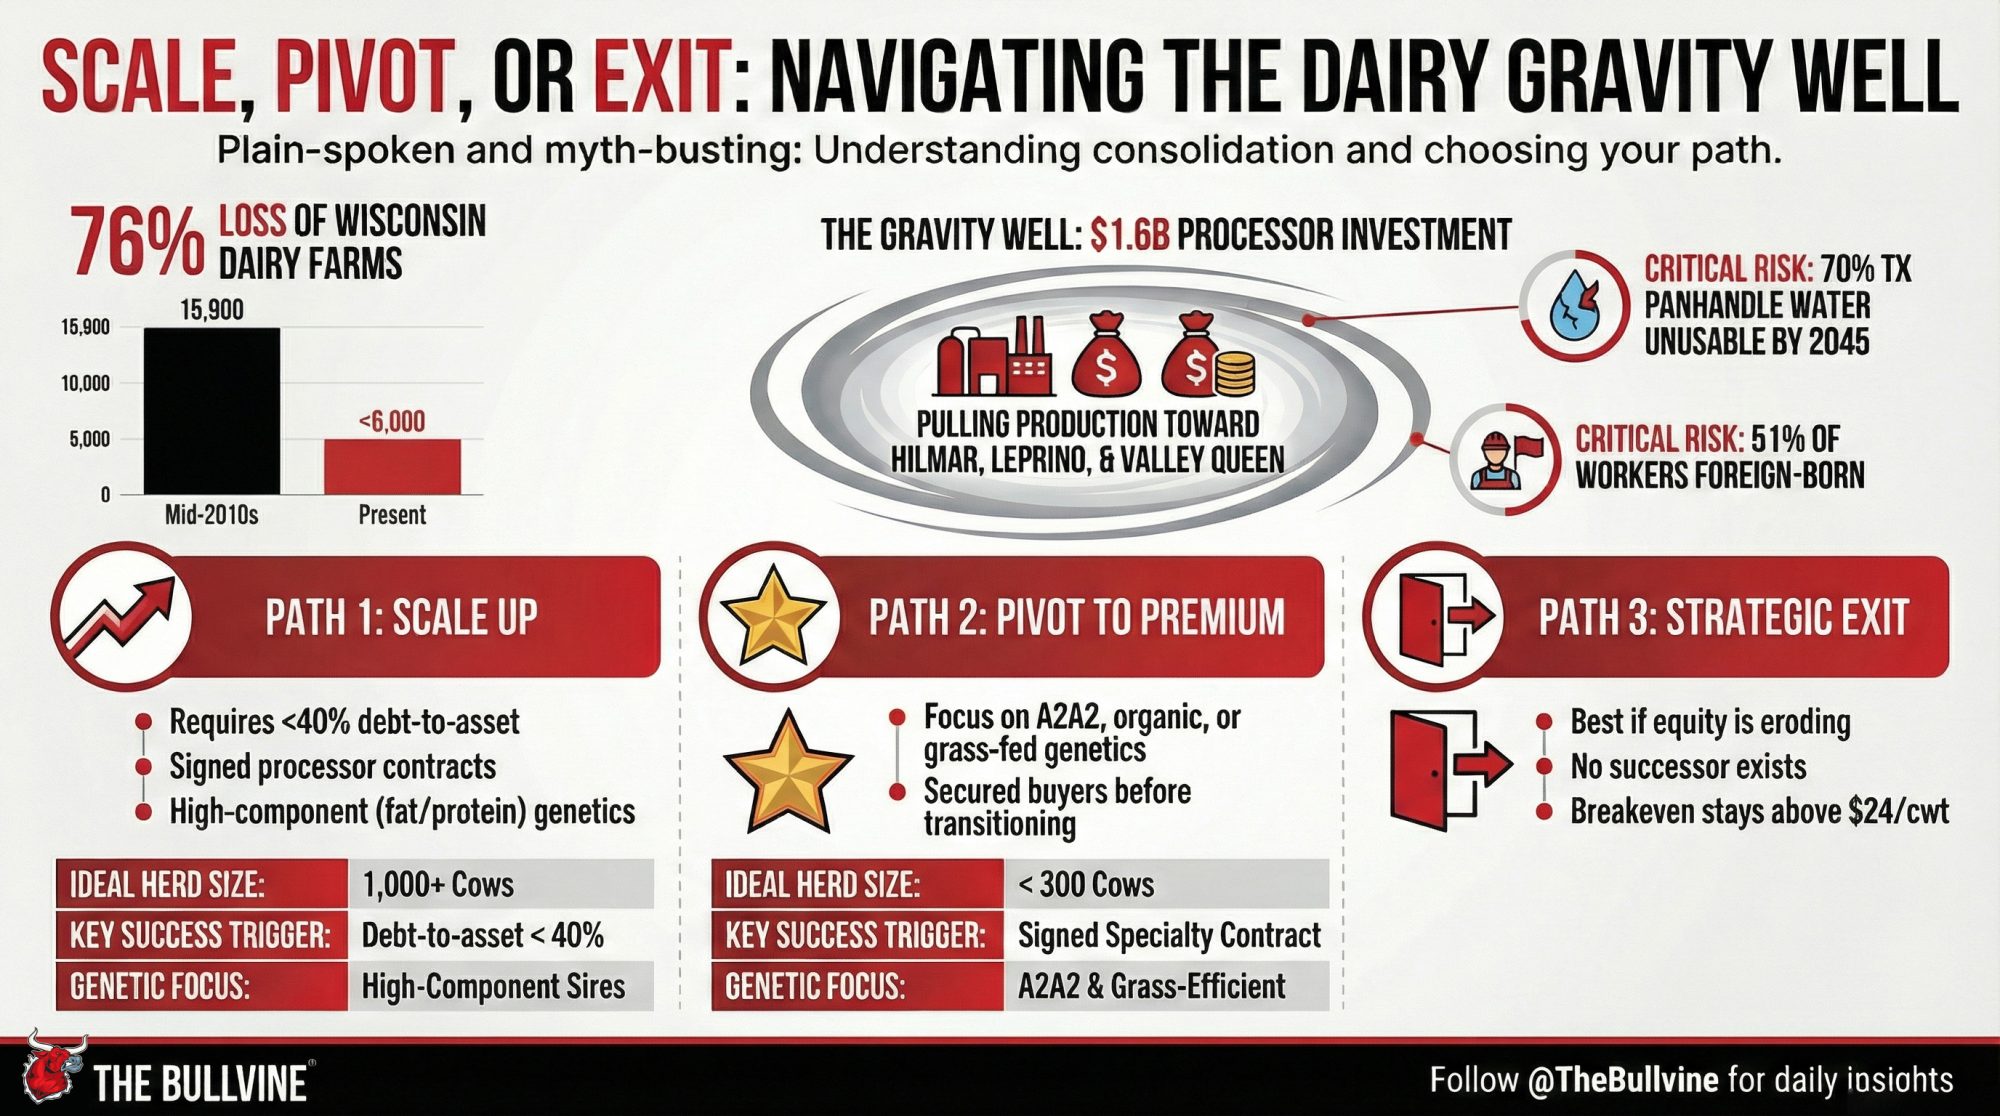
Executive Summary: Since 2020, Hilmar, Leprino, and Valley Queen have committed $1.6 billion to cheese plants in Texas, Kansas, and the I-29 corridor—not chasing existing milk, but creating the conditions that pull production toward them. Wisconsin has lost 76% of its dairy farms since the mid-2010s, from over 15,900 operations to fewer than 6,000. You now face a three-path decision: scale to 1,000+ cows with a processor contract and debt-to-asset below 40%; pivot to premium markets (A2A2, organic, grass-fed) at under 300 cows with a buyer secured before transition; or execute a strategic exit while equity holds. The structural risks driving this migration—70% of the Texas Panhandle’s Ogallala aquifer potentially unusable by 2045, 51% of U.S. dairy workers foreign-born—are risks processors can diversify away from but you cannot. As Rabobank analyst Ben Laine notes: “Everything we know about dairy consolidation says it hasn’t shown any signs of slowing down.” Your genetics program must match your market destination: component sires for cheese contracts, A2A2 and grazing genetics for premium paths.
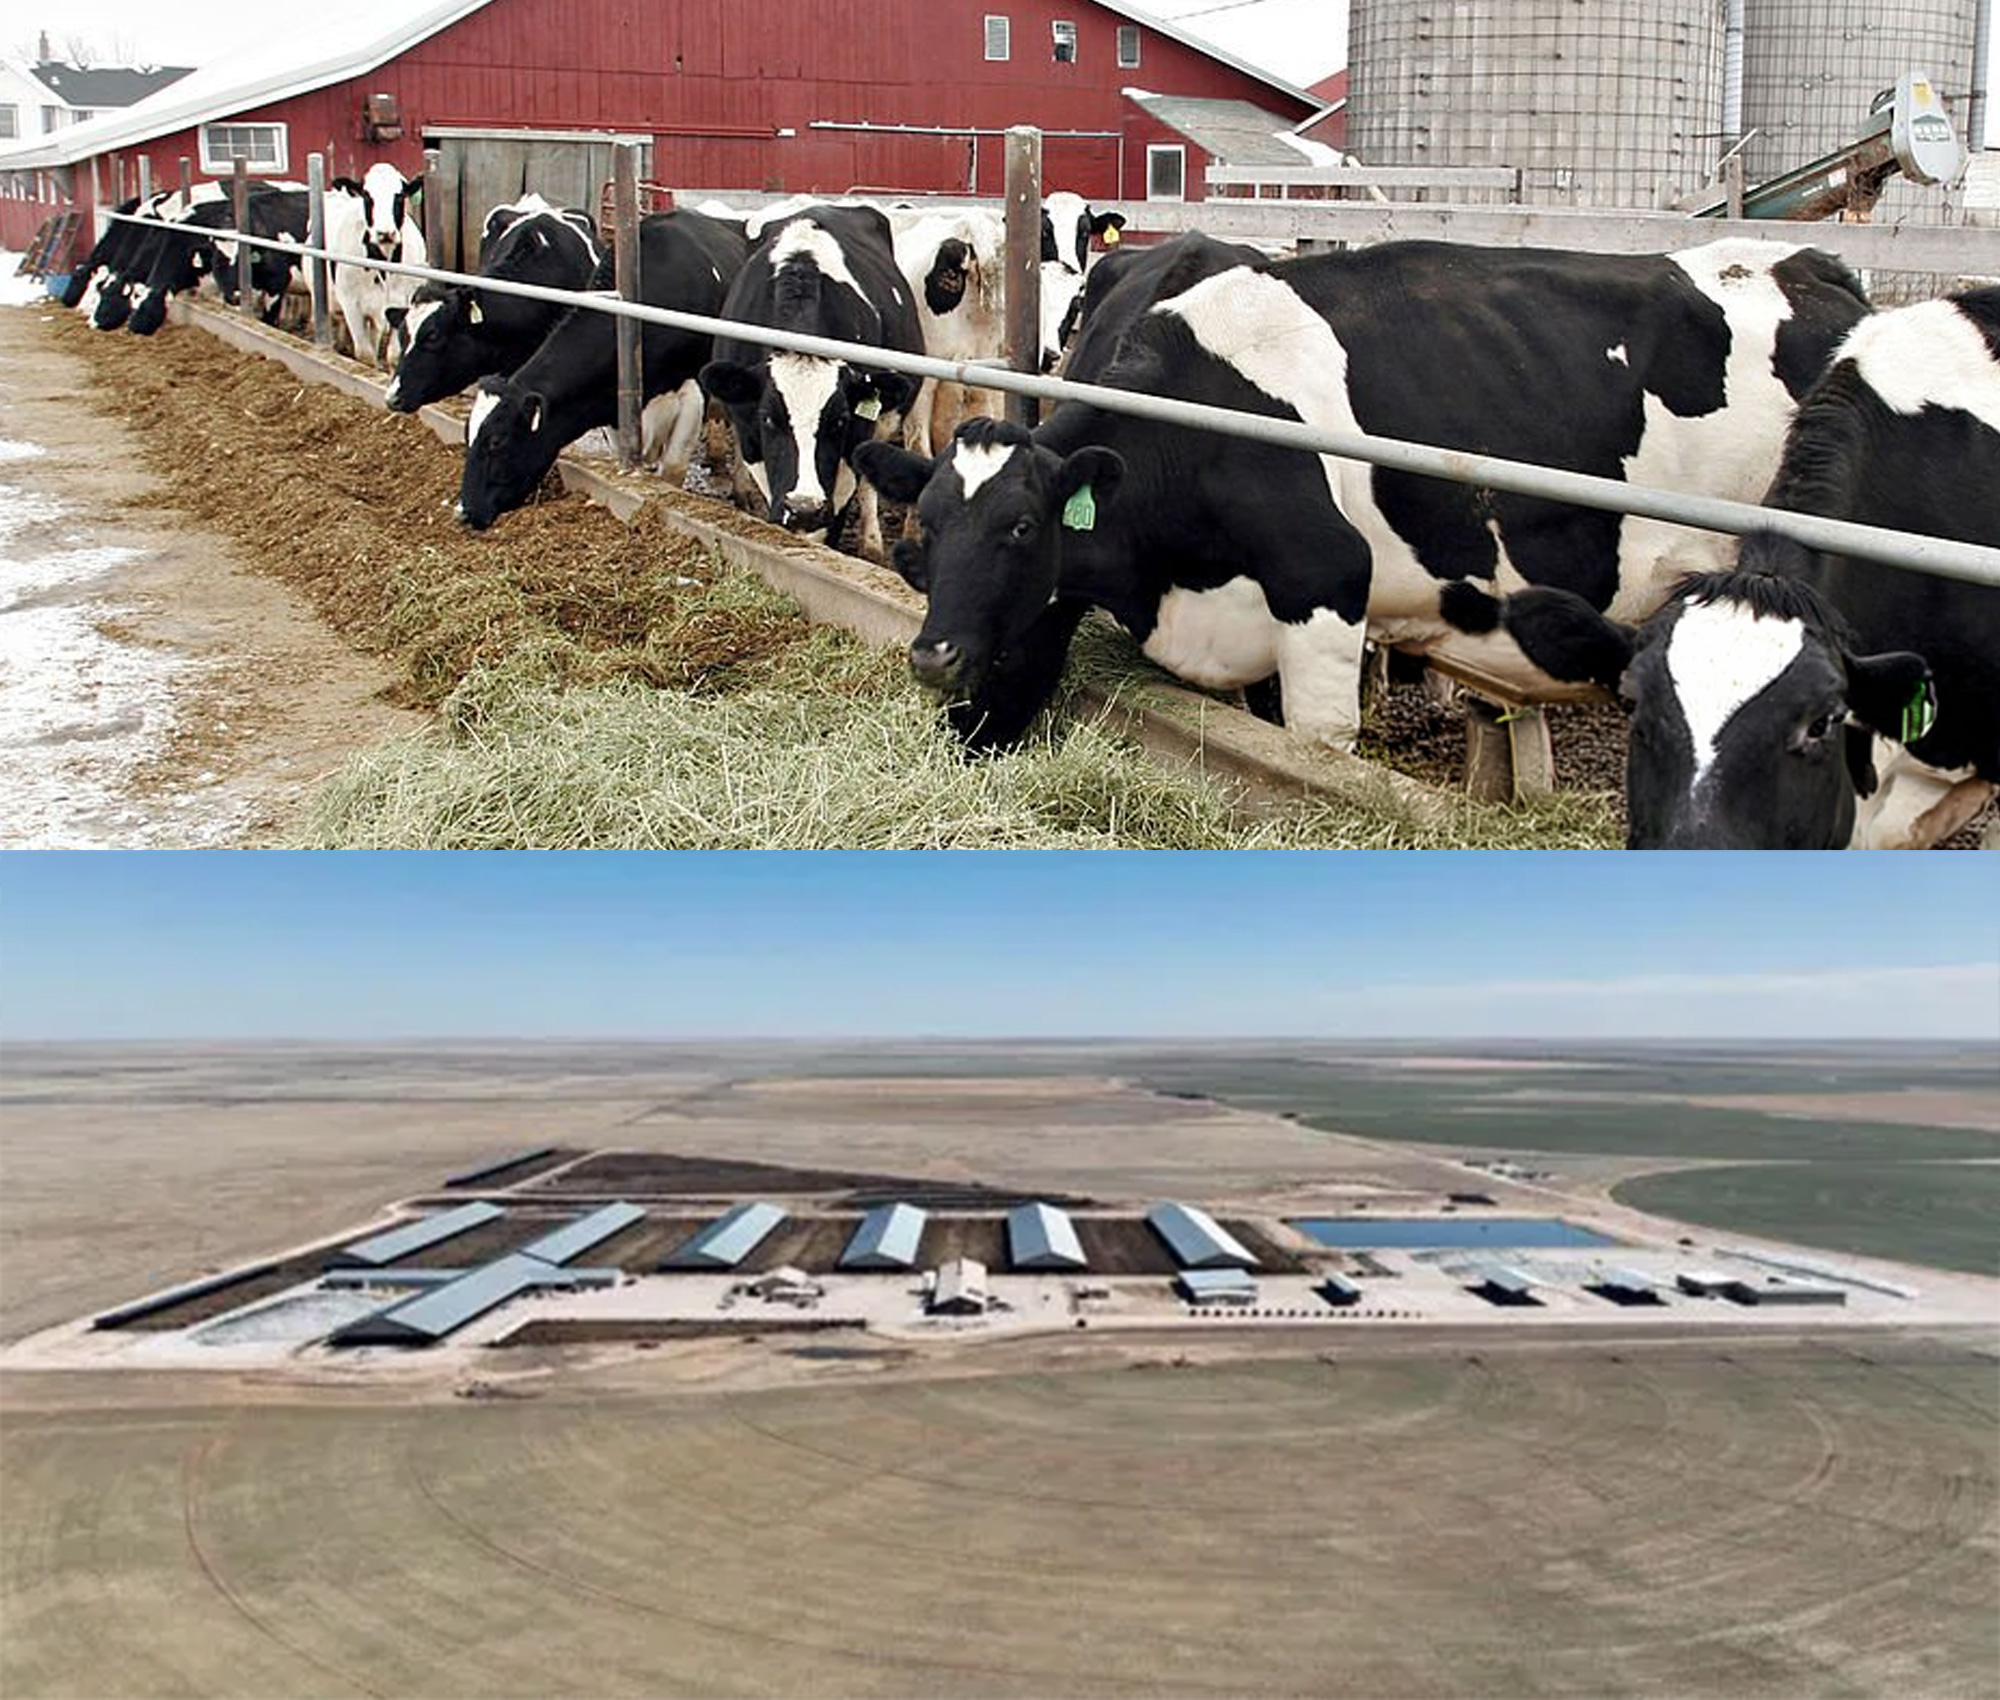
When Hilmar Cheese Company broke ground in Dalhart, Texas, in 2006, dairy consolidation was already reshaping American milk production. But nobody expected what came next. The surrounding region had a modest dairy presence. By 2014, the area’s herd had grown more than tenfold—not because producers chose Texas first, but because Hilmar created the conditions that pulled them in.
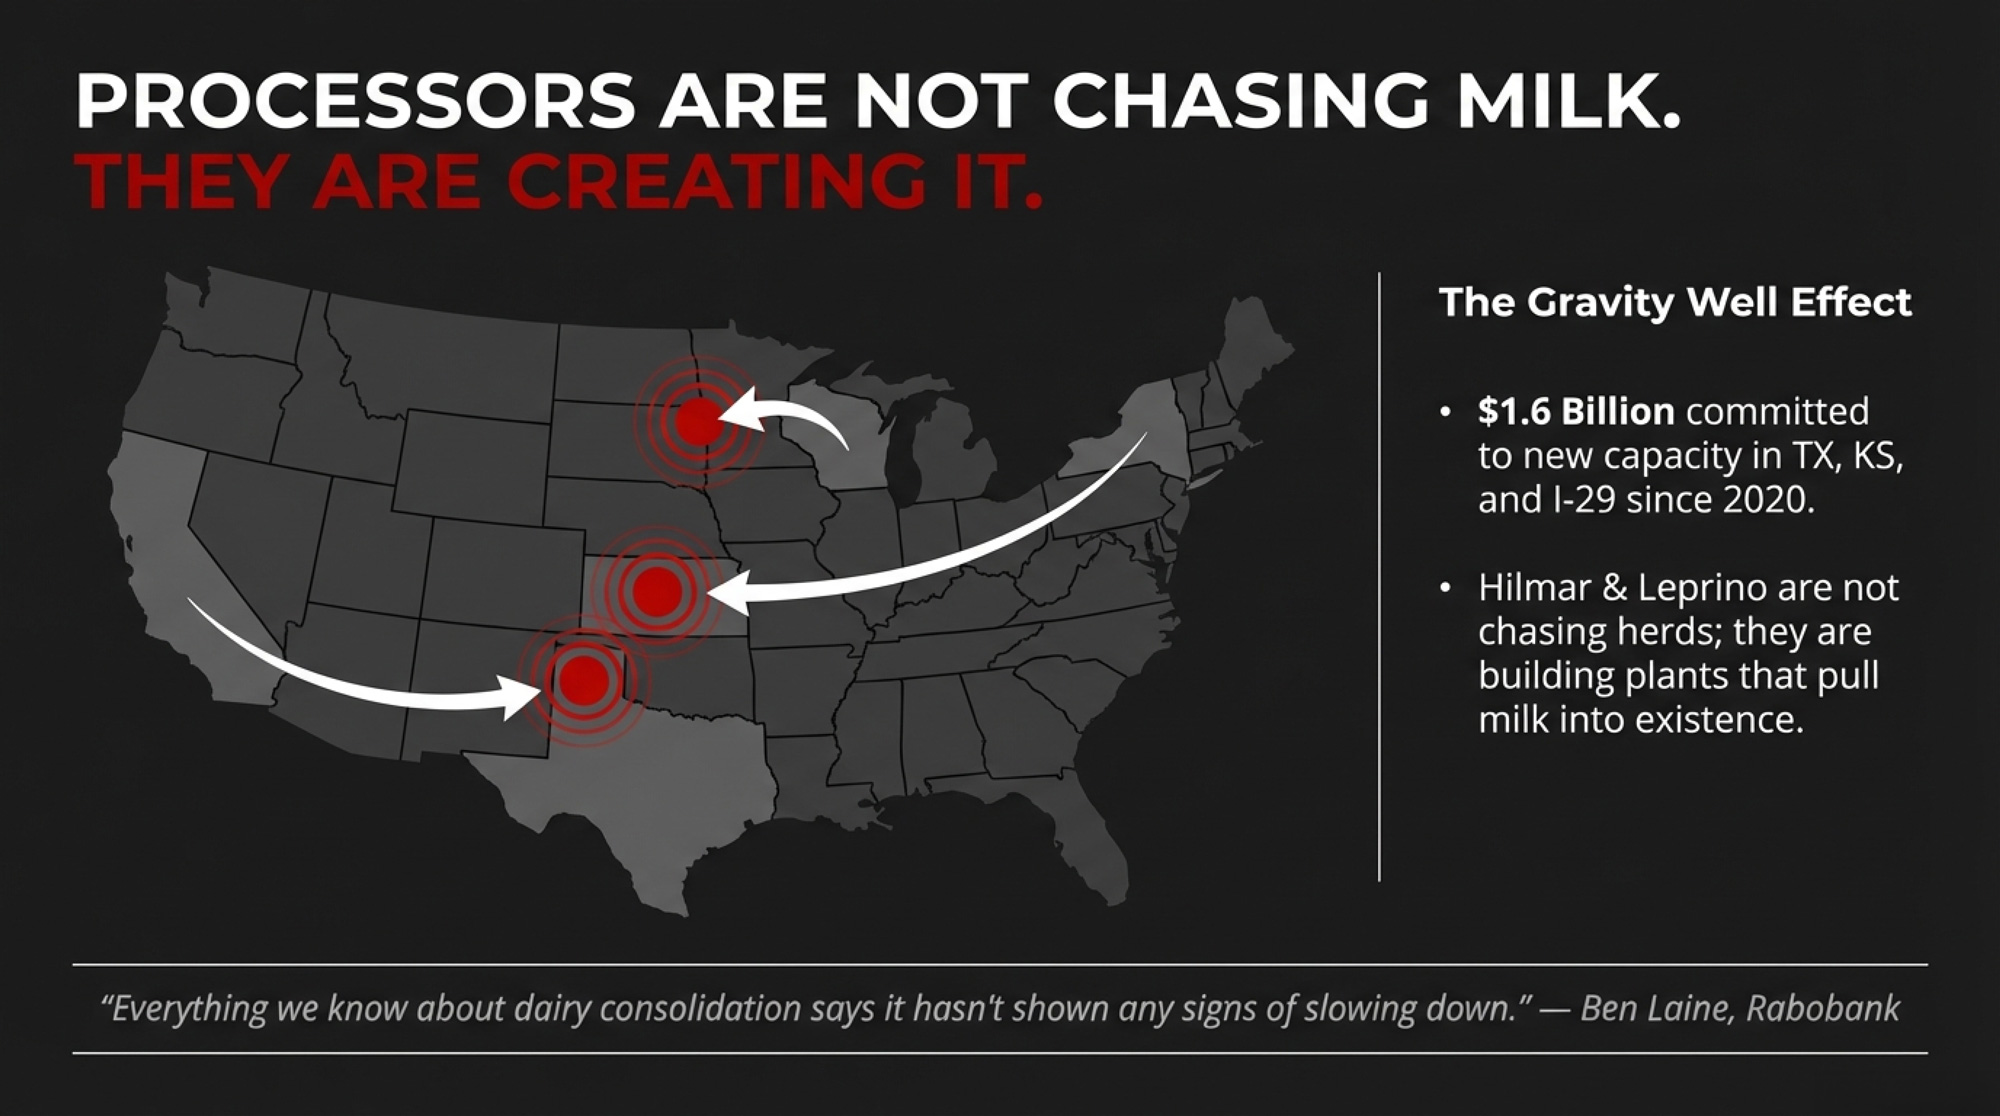
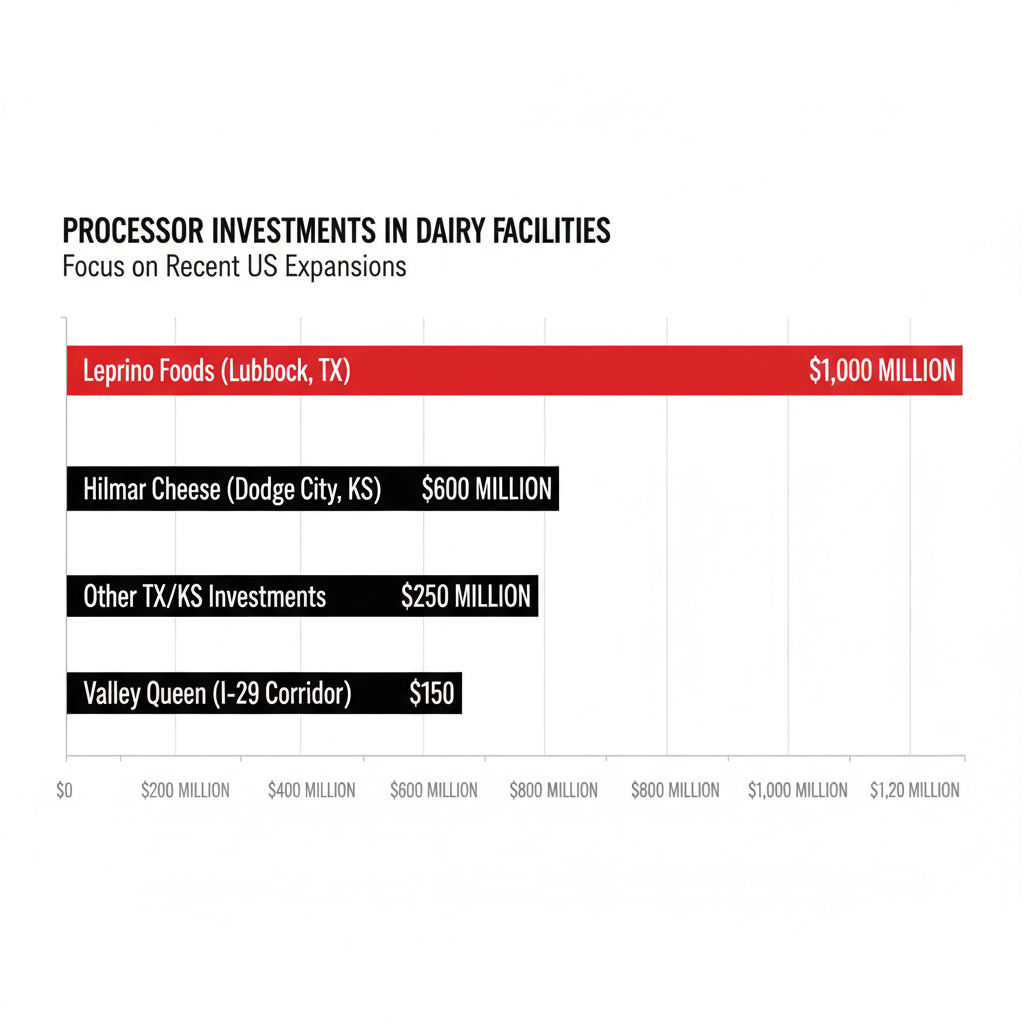
That pattern is repeating at scale. Since 2020, major processors have announced billions in new capacity across Texas, Kansas, and South Dakota—including Hilmar’s $600 million Dodge City facility and Leprino Foods’ $1 billion Lubbock complex.
If you’re weighing expansion in a growth state—or wondering how long to hold on where you are—the economics have shifted. Here’s the decision framework.
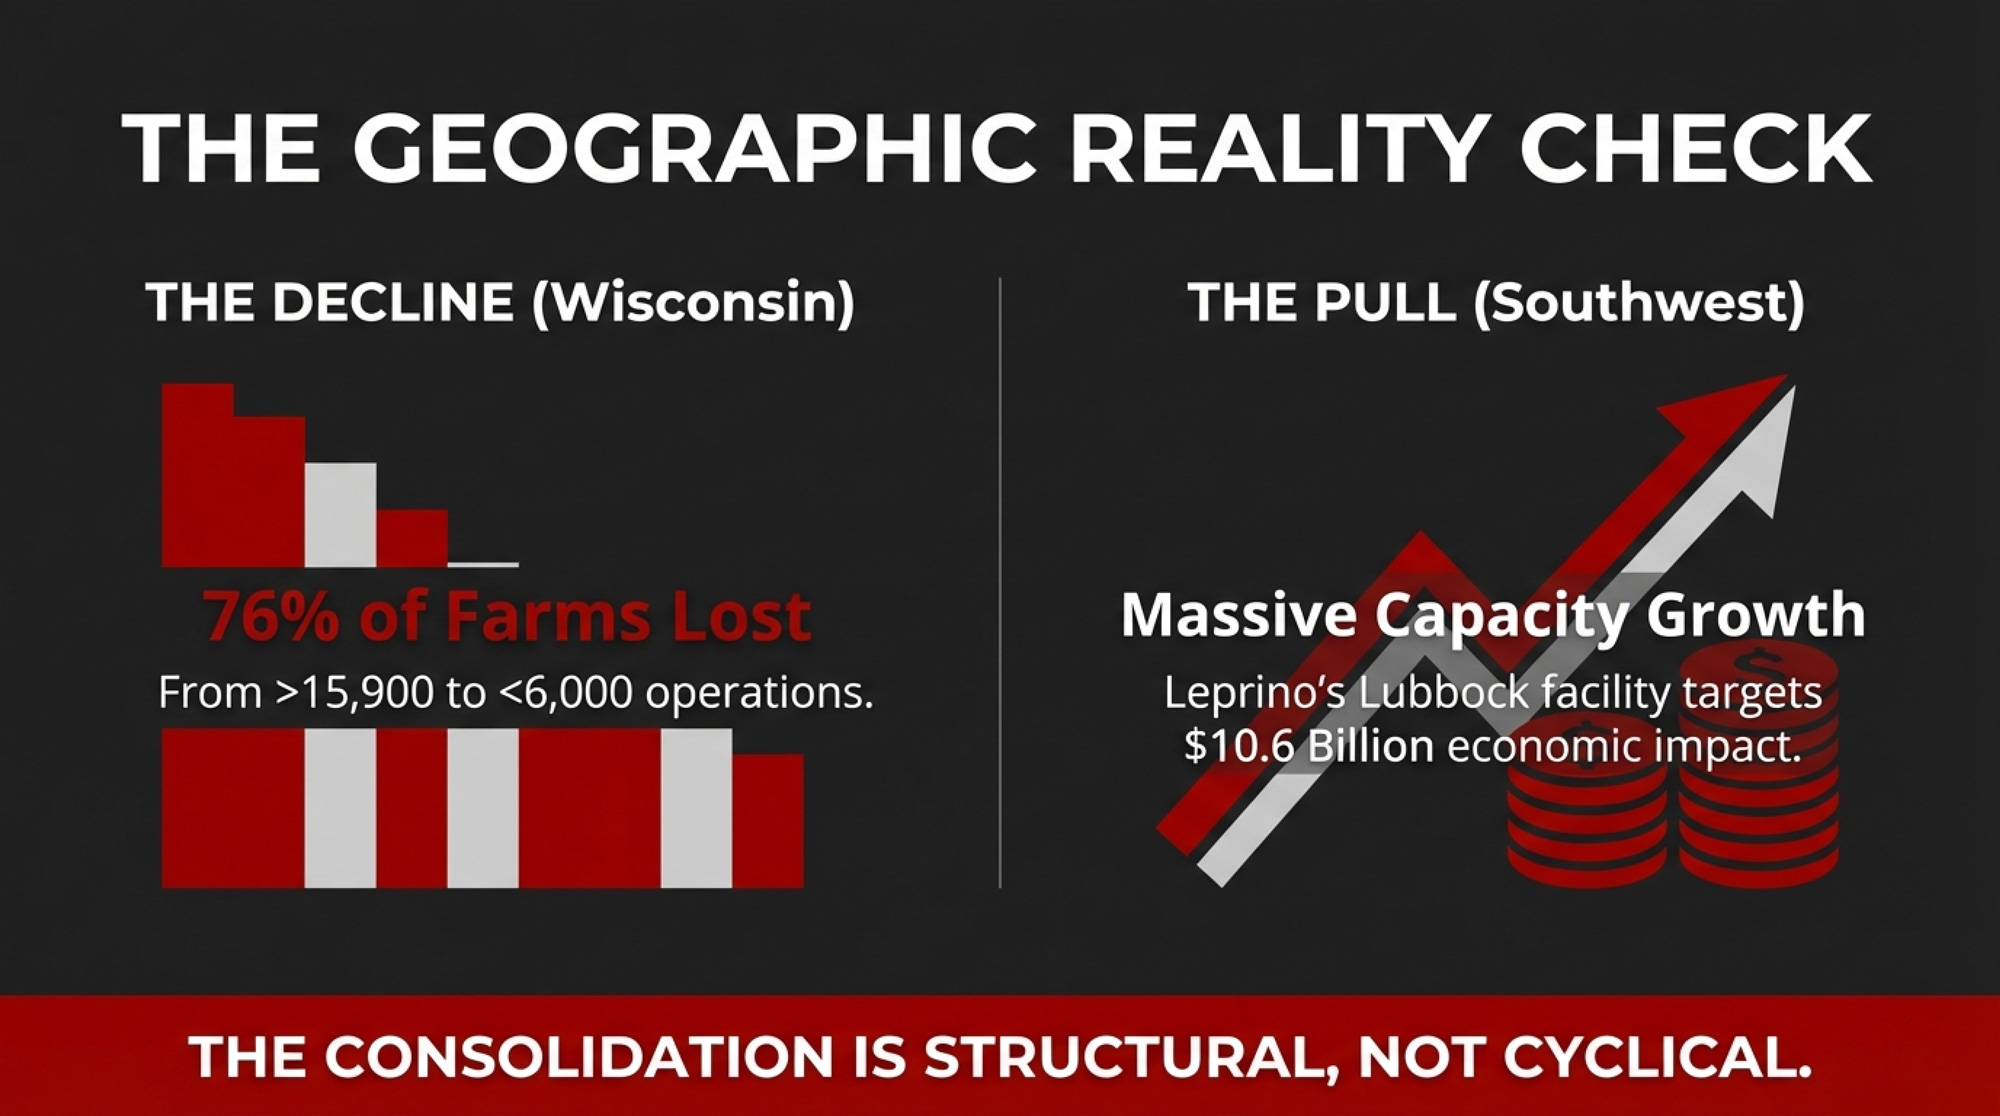
76% of Wisconsin’s dairy farms have disappeared since the mid-2010s—from over 15,900 operations to fewer than 6,000 today.
Processors Chose First. Producers Followed.
The conventional narrative frames this geographic shift as producer-driven: families chasing lower costs and friendlier regulations. The timeline tells a different story.
Hilmar’s CEO, John Jeter, explained the Dalhart decision by citing “a growing milk supply and a stable regulatory environment.” Note the word “growing”—not “large.” The company bet on the future supply it planned to create, betting that it would create the market for it.
When Hilmar announced the Dodge City plant in 2021, Kansas Dairy CEO Janet Bailey said it would “help the state’s industry expand” and “create incentives for producers to be innovative.” That’s future tense. The plant pulls production into existence rather than chasing milk that’s already there.
Leprino’s Lubbock facility follows the same script, with phases coming online through 2026. Industry analysts estimate the company targets $10.6 billion in economic impact for Texas over the next decade.
Processors aren’t following milk. They’re building gravity wells—and milk is flowing toward them.
The I-29 Corridor: A Third Path
Not all dairy expansion is heading to the Southwest. The I-29 corridor—running through South Dakota, Minnesota, and Iowa—has quietly become the fastest-growing dairy region in the country on a percentage basis.
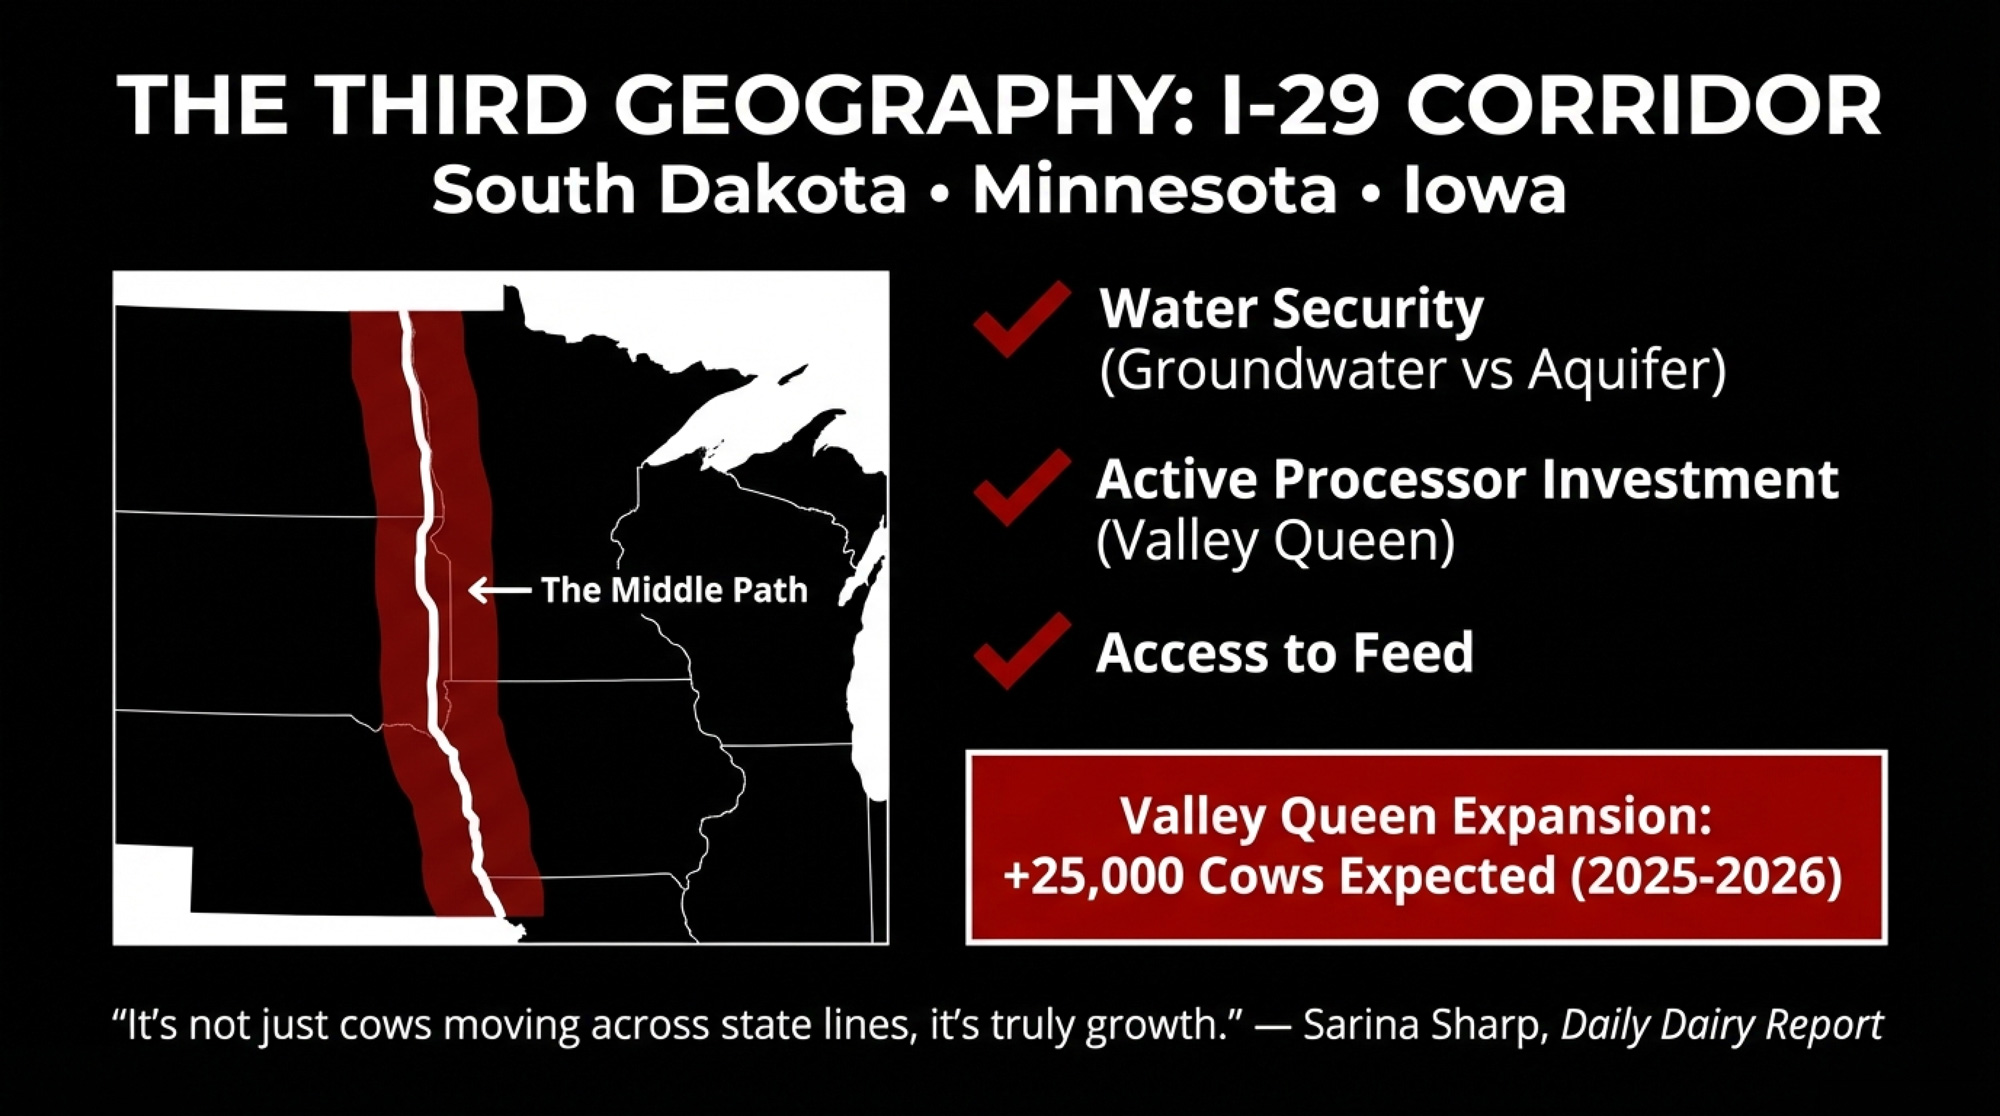
“So that is Iowa, South Dakota, and Minnesota—there they are growing milk production, and they are growing processing capacity,” notes Sarina Sharp in the Daily Dairy Report. “New dairies are coming in, and it’s not just cows moving across state lines, it’s truly growth.”
Valley Queen’s expansion project expects approximately 25,000 additional cows in 2025 and 2026 alone. Evan Grong, Valley Queen’s sales manager, identifies three key drivers: “We attribute the current and projected growth in the I-29 region primarily to access to feed production, abundant groundwater, and dairy processing investments.”
Unlike the Ogallala-dependent Panhandle, the I-29 corridor offers better long-term water security. Unlike Wisconsin, it has processor capacity actively seeking milk. It’s a middle path—if you can get in.
The Growth-State Assumption Is Cracking
Here’s the story everyone tells: growth states offer competitive advantages that traditional regions can’t match. Lower costs, friendlier regulations, room to expand.
Here’s the problem: the two pillars holding up that story—water and labor—are shakier than most people realize.
The water math is brutal. The Ogallala Aquifer underlies the Texas Panhandle and western Kansas dairy expansion zones. According to USGS and Texas Water Development Board data, Texas accounts for 62% of total Ogallala depletion despite covering a fraction of the aquifer’s footprint.
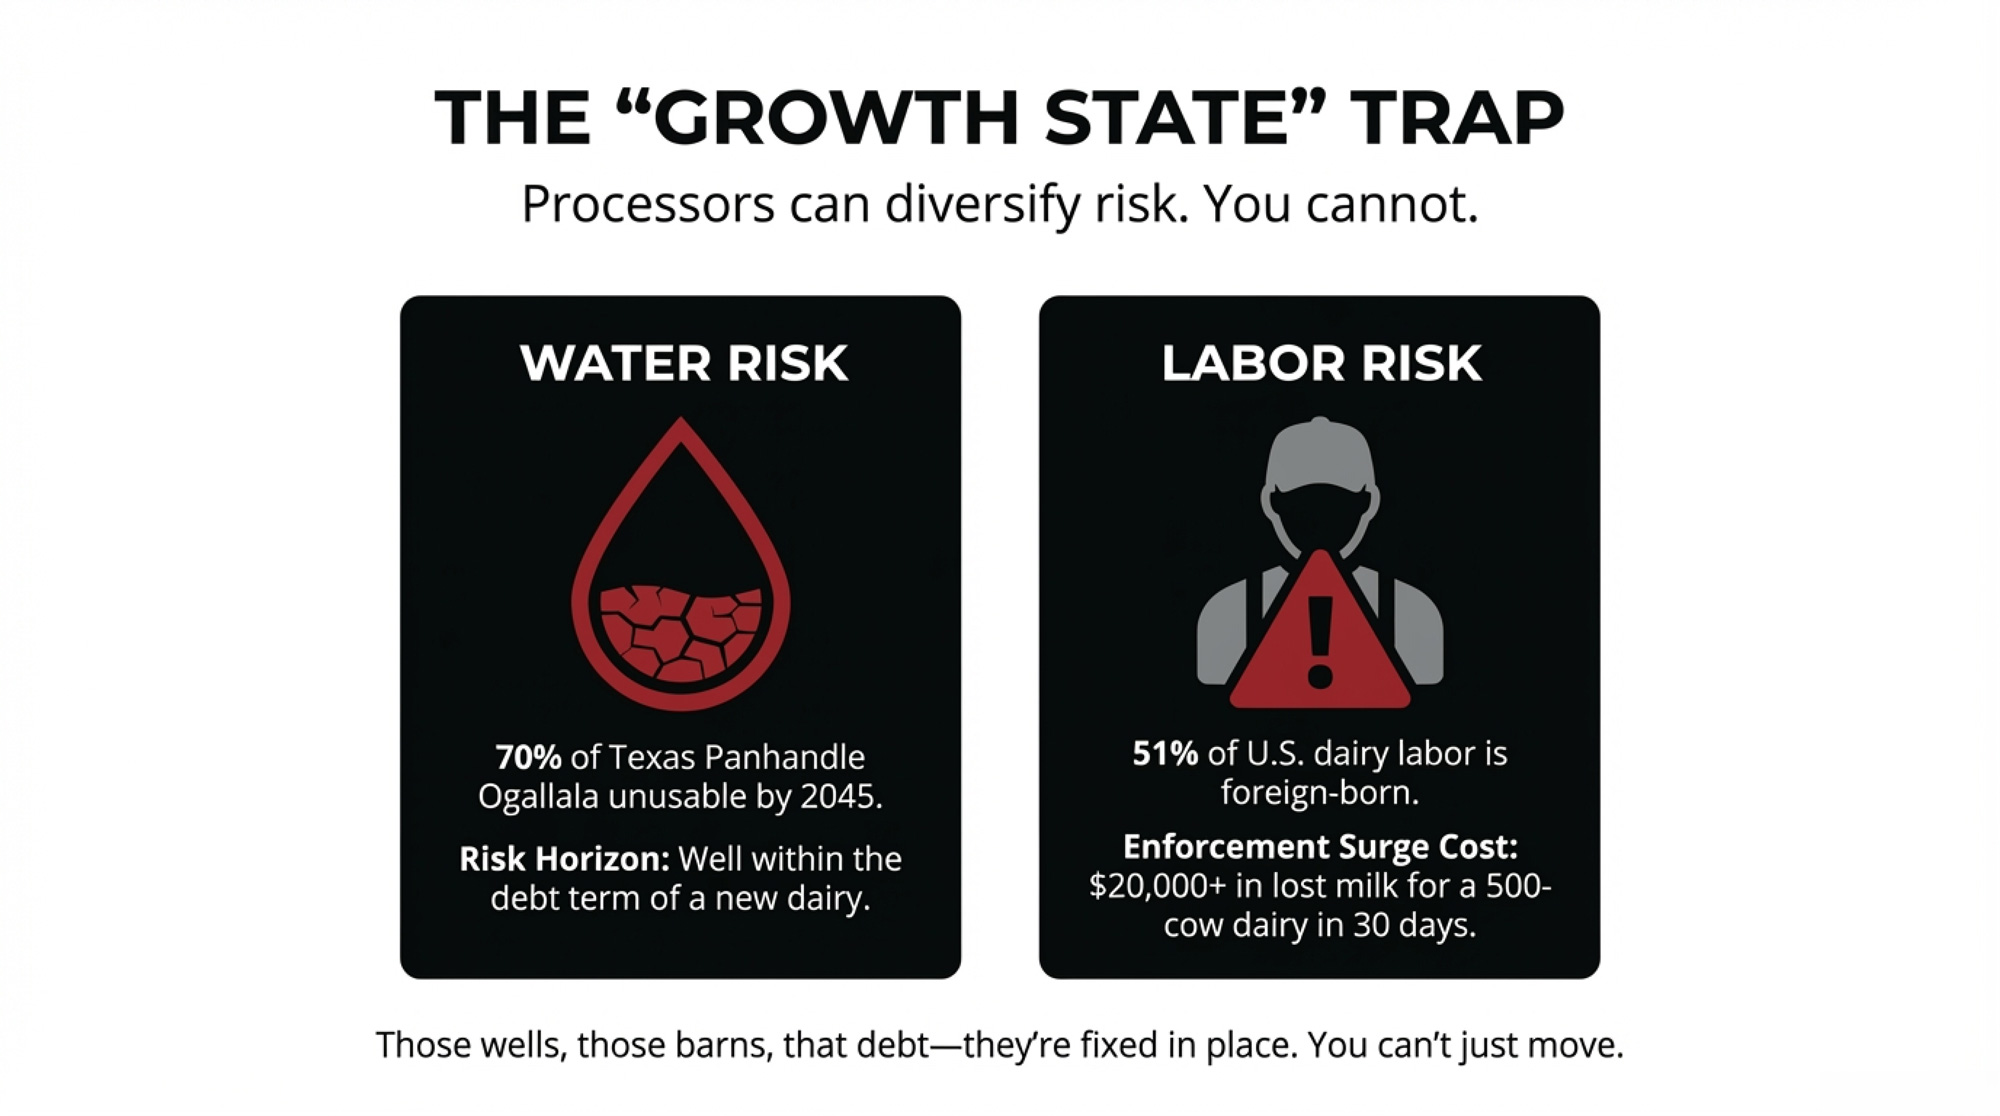
A University of Texas Bureau of Economic Geology projection suggests up to 70% of the Texas Panhandle’s section could become unusable within 20 years at current pumping rates. That’s potentially mid-2040s—well within the debt horizon of a dairy built today.
The labor math is worse. According to NMPF research:
- 51% of all hired U.S. dairy workers are immigrants
- Farms employing immigrant labor produce 79% of the national milk supply
- When NMPF surveyed 1,223 dairy farms, 80% reported “low or medium” confidence in employment documents
In Wisconsin alone, a UW-Madison School for Workers survey found more than 10,000 undocumented workers perform about 70% of the state’s dairy labor.
Wisconsin’s Governor Tony Evers put it plainly: “If suddenly those people disappear, I don’t know who the hell is going to milk the cows.”
The Risk Sits Differently for You Than for Them
Leprino runs facilities across Colorado, California, Michigan, New Mexico, and now Texas. Hilmar has operations in California and Texas, with Kansas coming online. If water constraints or labor enforcement hits one region hard, they can shift volume elsewhere or exit with a write-down that stings but doesn’t kill the company.
A 4,000-cow dairy built in the Panhandle to supply a processor contract? Those wells, those barns, that debt—they’re all fixed in place.
| Risk Factor | Texas Panhandle | Kansas (Western) | I-29 Corridor (SD/MN/IA) |
|---|---|---|---|
| Ogallala Depletion | 70% potentially unusable by 2045 (red) | Moderate-to-high stress, caps tightening (red) | Not Ogallala-dependent (better water security) |
| Labor Dependency | 51% immigrant workers nationally (red) | 51% immigrant workers nationally | 51% immigrant workers nationally |
| Processor Diversification | Hilmar (CA, TX, KS), Leprino (CO, CA, MI, NM, TX) | Hilmar, Leprino multi-state | Valley Queen, regional processors |
| Producer Risk Exit | Fixed assets, debt horizon 15-25 years | Fixed assets, debt horizon 15-25 years | Fixed assets, debt horizon 15-25 years |
NMPF modeling shows what a full labor disruption would mean nationally:
- Over 7,000 dairy farms closed
- 2.1 million cows culled
- 48.4 billion pounds of milk lost
- Retail prices are nearly doubling
For a 500-cow operation that loses 40% of its crew during a 30-day enforcement surge, the hit could run $20,000 or more in lost milk alone.
The Genetics Angle: Components Are King
Here’s what most geographic-shift analyses miss: where you farm increasingly determines what genetics you need.
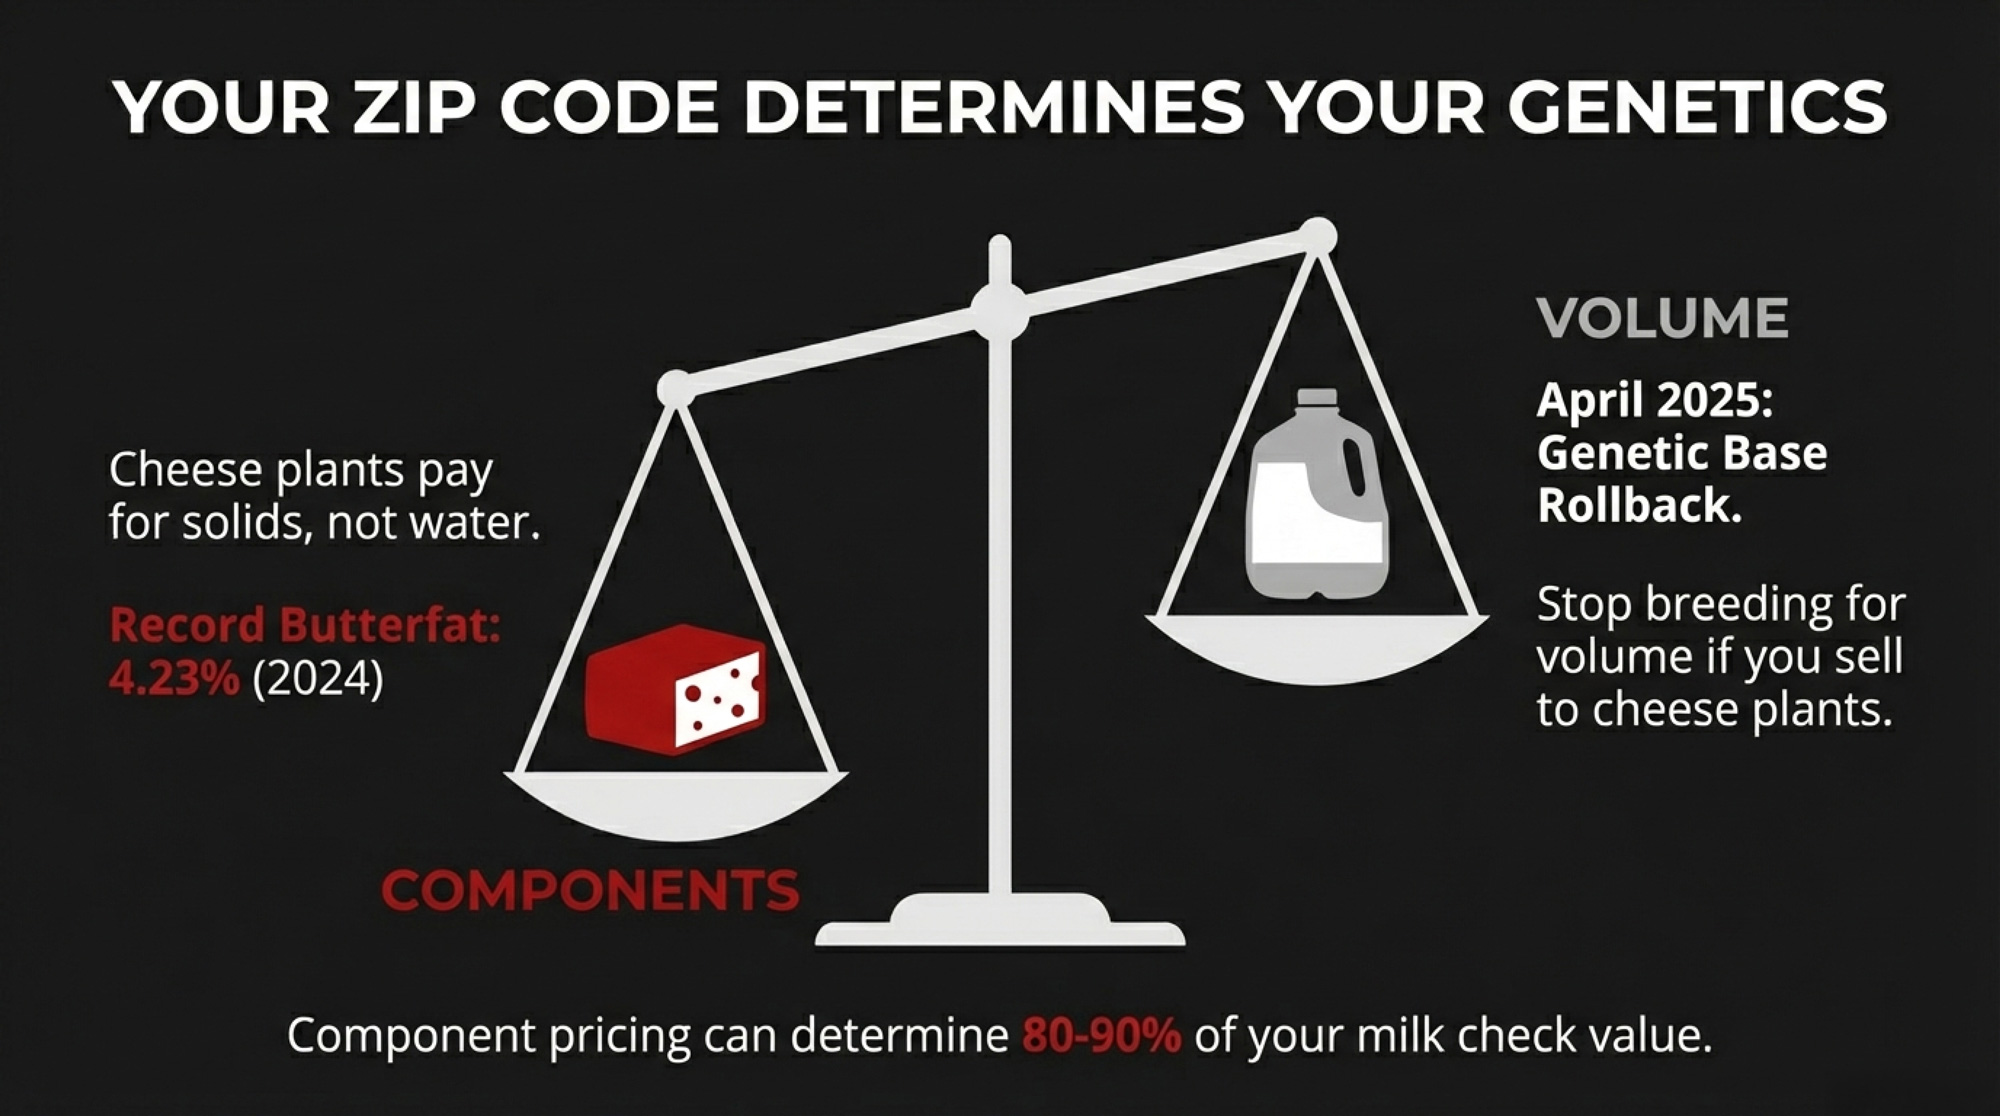
These “gravity well” dairies feeding Hilmar and Leprino cheese plants are breeding hard for components—not volume. According to a March 2025 CoBank report, U.S. butterfat reached a record 4.23% nationwide in 2024, while protein reached 3.29%.
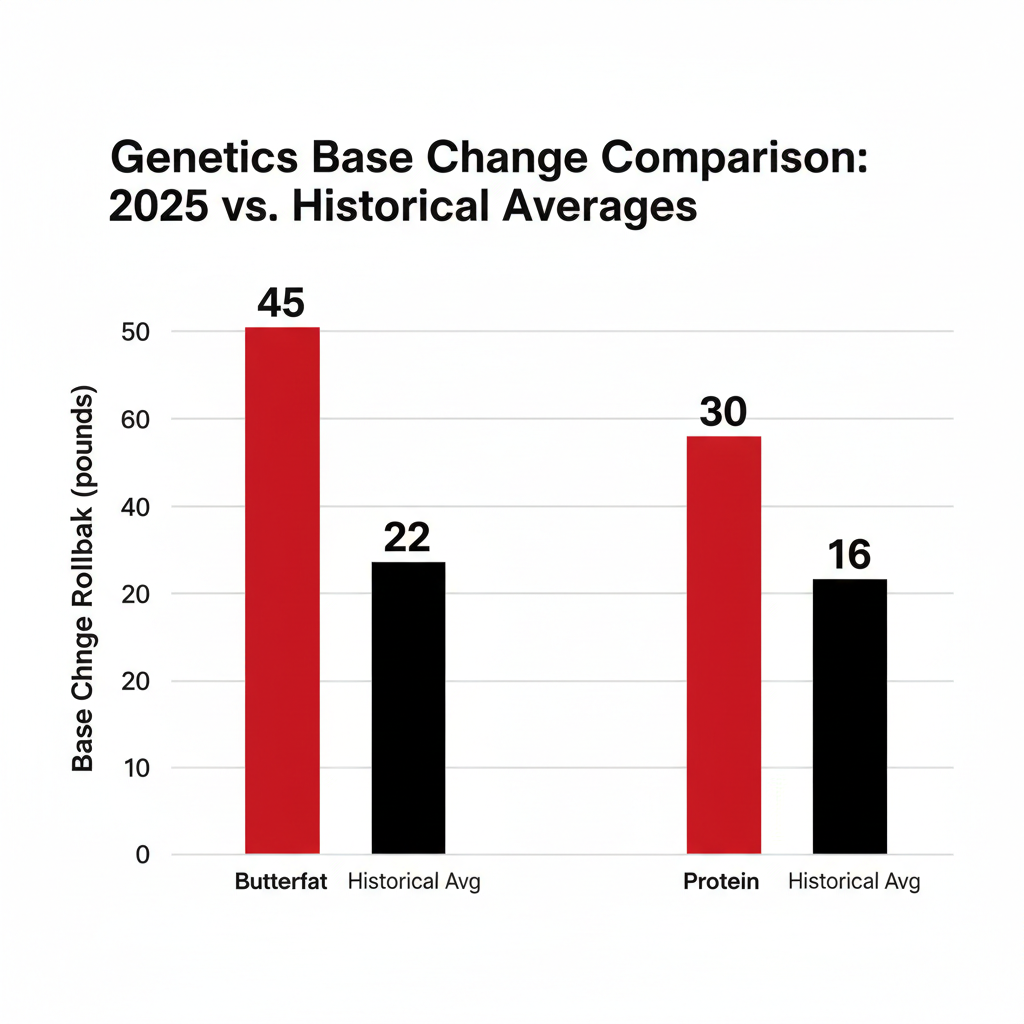
The April 2025 Holstein genetic evaluations saw the largest base change in history—a 45-pound rollback on butterfatand a 30-pound rollback on protein. Corey Geiger with CoBank explains: “That butterfat number’s almost double any number that’s taken place in the past.”
Why the shift? In cheese-focused markets, component pricing programs can place 80-90% of the milk check value on butterfat and protein—though this varies by Federal Order and utilization. Cheese plants pay for solids, not water.
For Wisconsin’s “premium path” operations, the genetics conversation looks different. A2A2 genetics, grass-fed programs, and high-type show cattle can command premiums in specialty markets. MilkHaus Dairy in Fennimore, Wisconsin, tests about 100 of their 360-head Holstein herd for A2 genetics, housing them separately to produce 12 cheese varieties sold nationwide.
The bottom line: Your sire selection should match your market destination.
Three Paths: Scale, Premium, or Exit
If you’re in a traditional region—or evaluating whether to build in a growth state—your decision comes down to three paths.
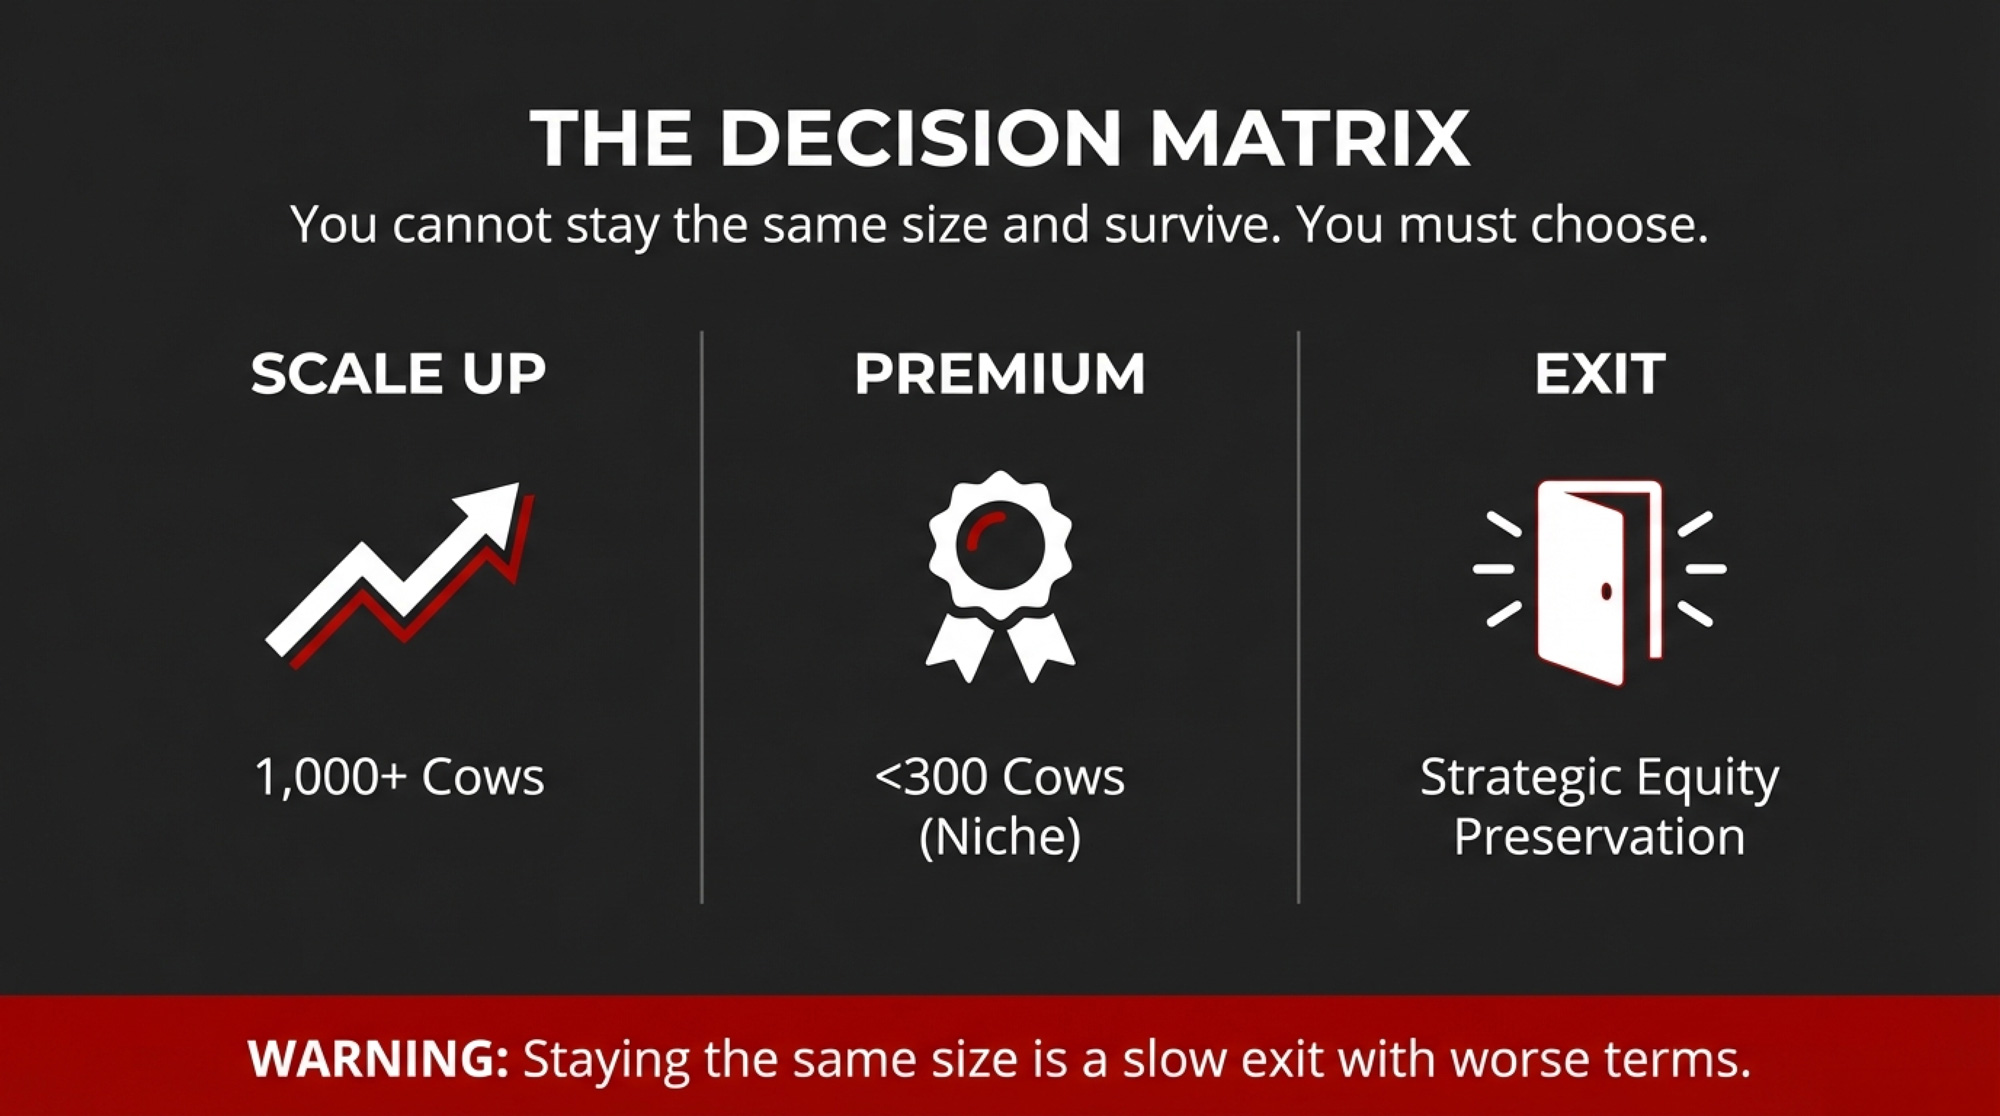
| Strategy | Best For | Key Trigger | Primary Risk |
| Scale Up | 1,000+ cow potential | Debt-to-asset < 40%, signed processor agreement | $24+ breakeven, no successor |
| Premium | < 300 cows | Signed specialty contract before transition | Limited market capacity |
| Strategic Exit | No successor | Equity eroding 3+ years | Forced liquidation timing |
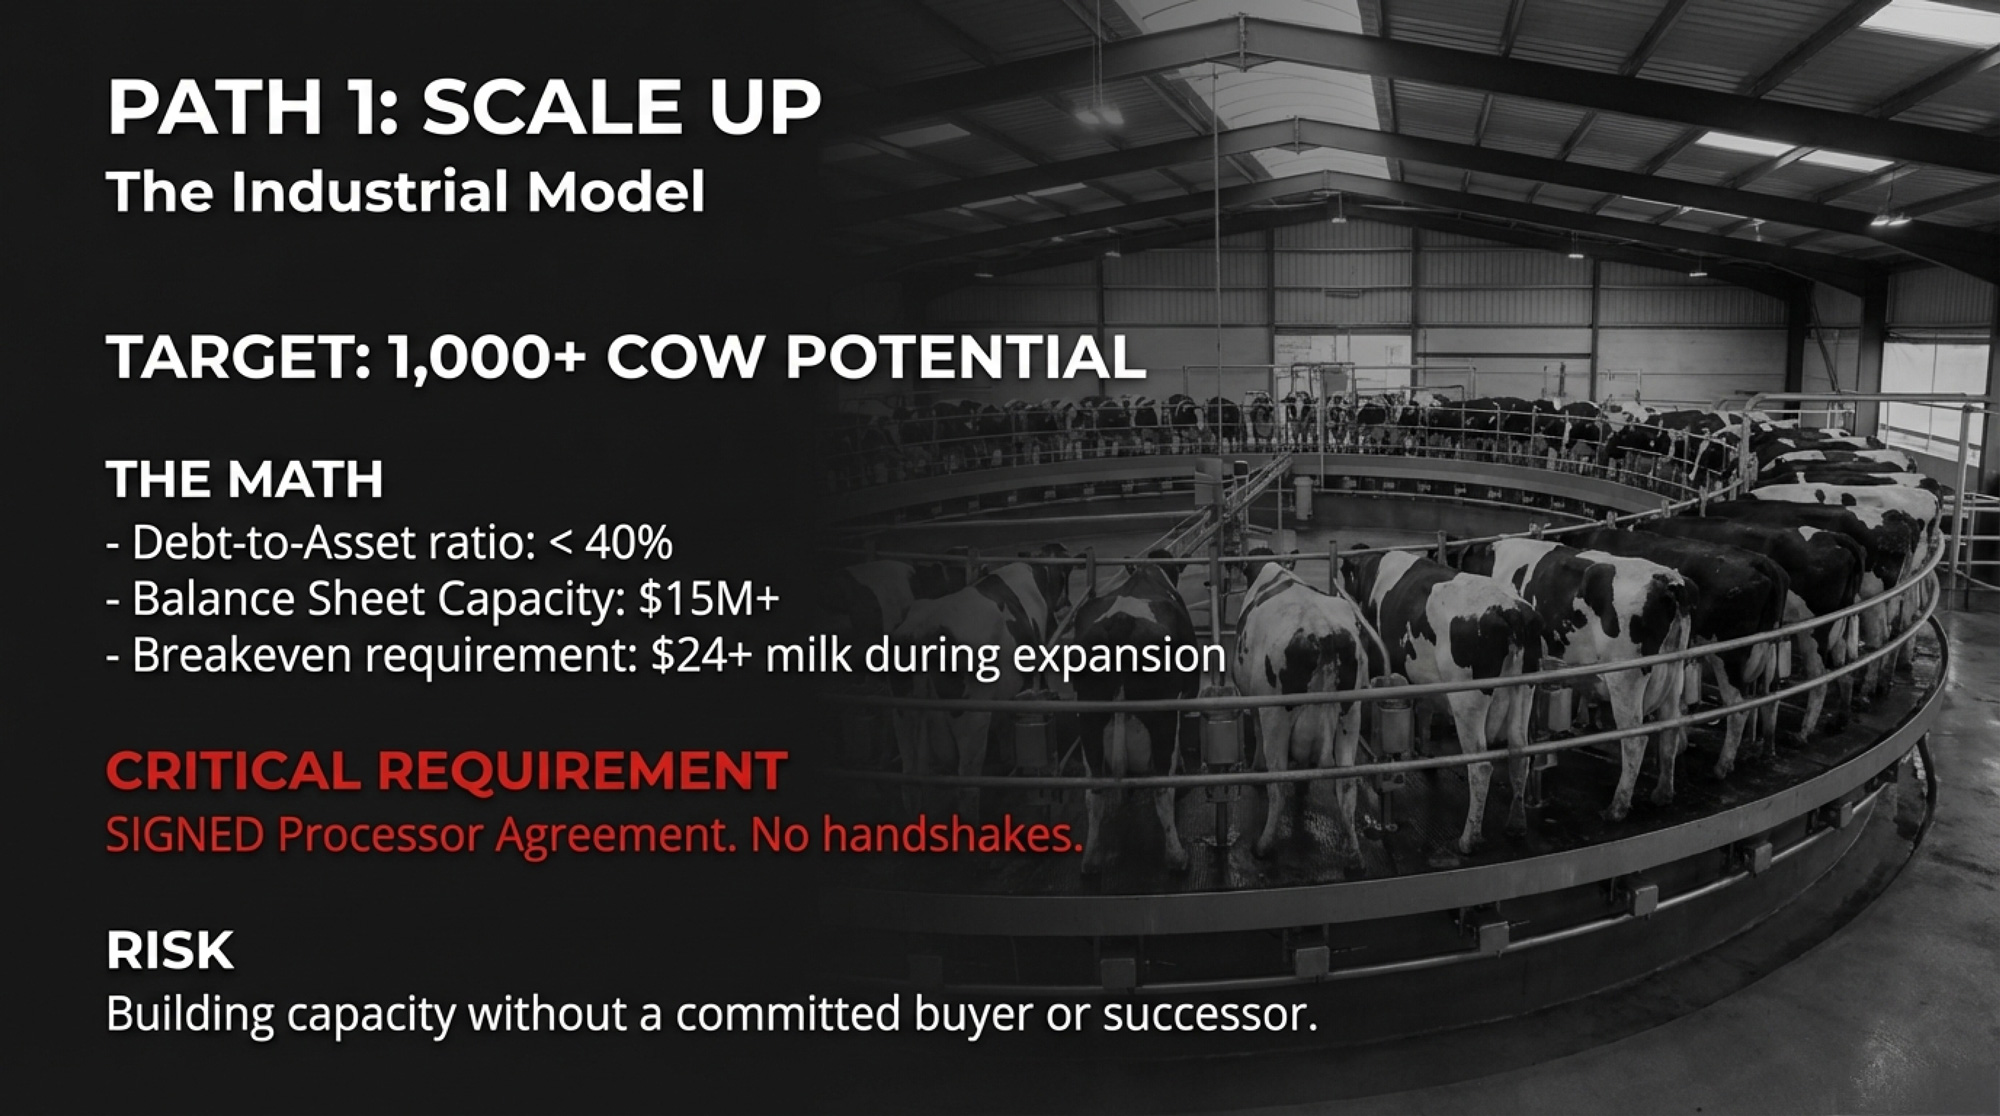
Path 1: Scale Up
Decision triggers:
- You’re at 500+ cows with a realistic path to 1,000+
- Debt-to-asset sits below 40%
- You’re under 55 with a committed successor
- You have a signed processor agreement—not a handshake
It requires significant balance-sheet capacity—often $15 million or more — for a 500-to-1,000-cow build-out. Plan for 24-36 months of tight margins during ramp-up.
Genetics focus: High-component sires. The cheese plants driving this expansion reward butterfat and protein, not volume. While butterfat has driven the recent surge, CoBank’s September 2025 report noted excessive butterfat levels can impact cheese quality – keep an eye on protein-focused sires as processors adjust.
Where it breaks: Your expansion needs $24+ milk to pencil out. You don’t have a written processor commitment. No one’s willing to run the expanded operation after you.
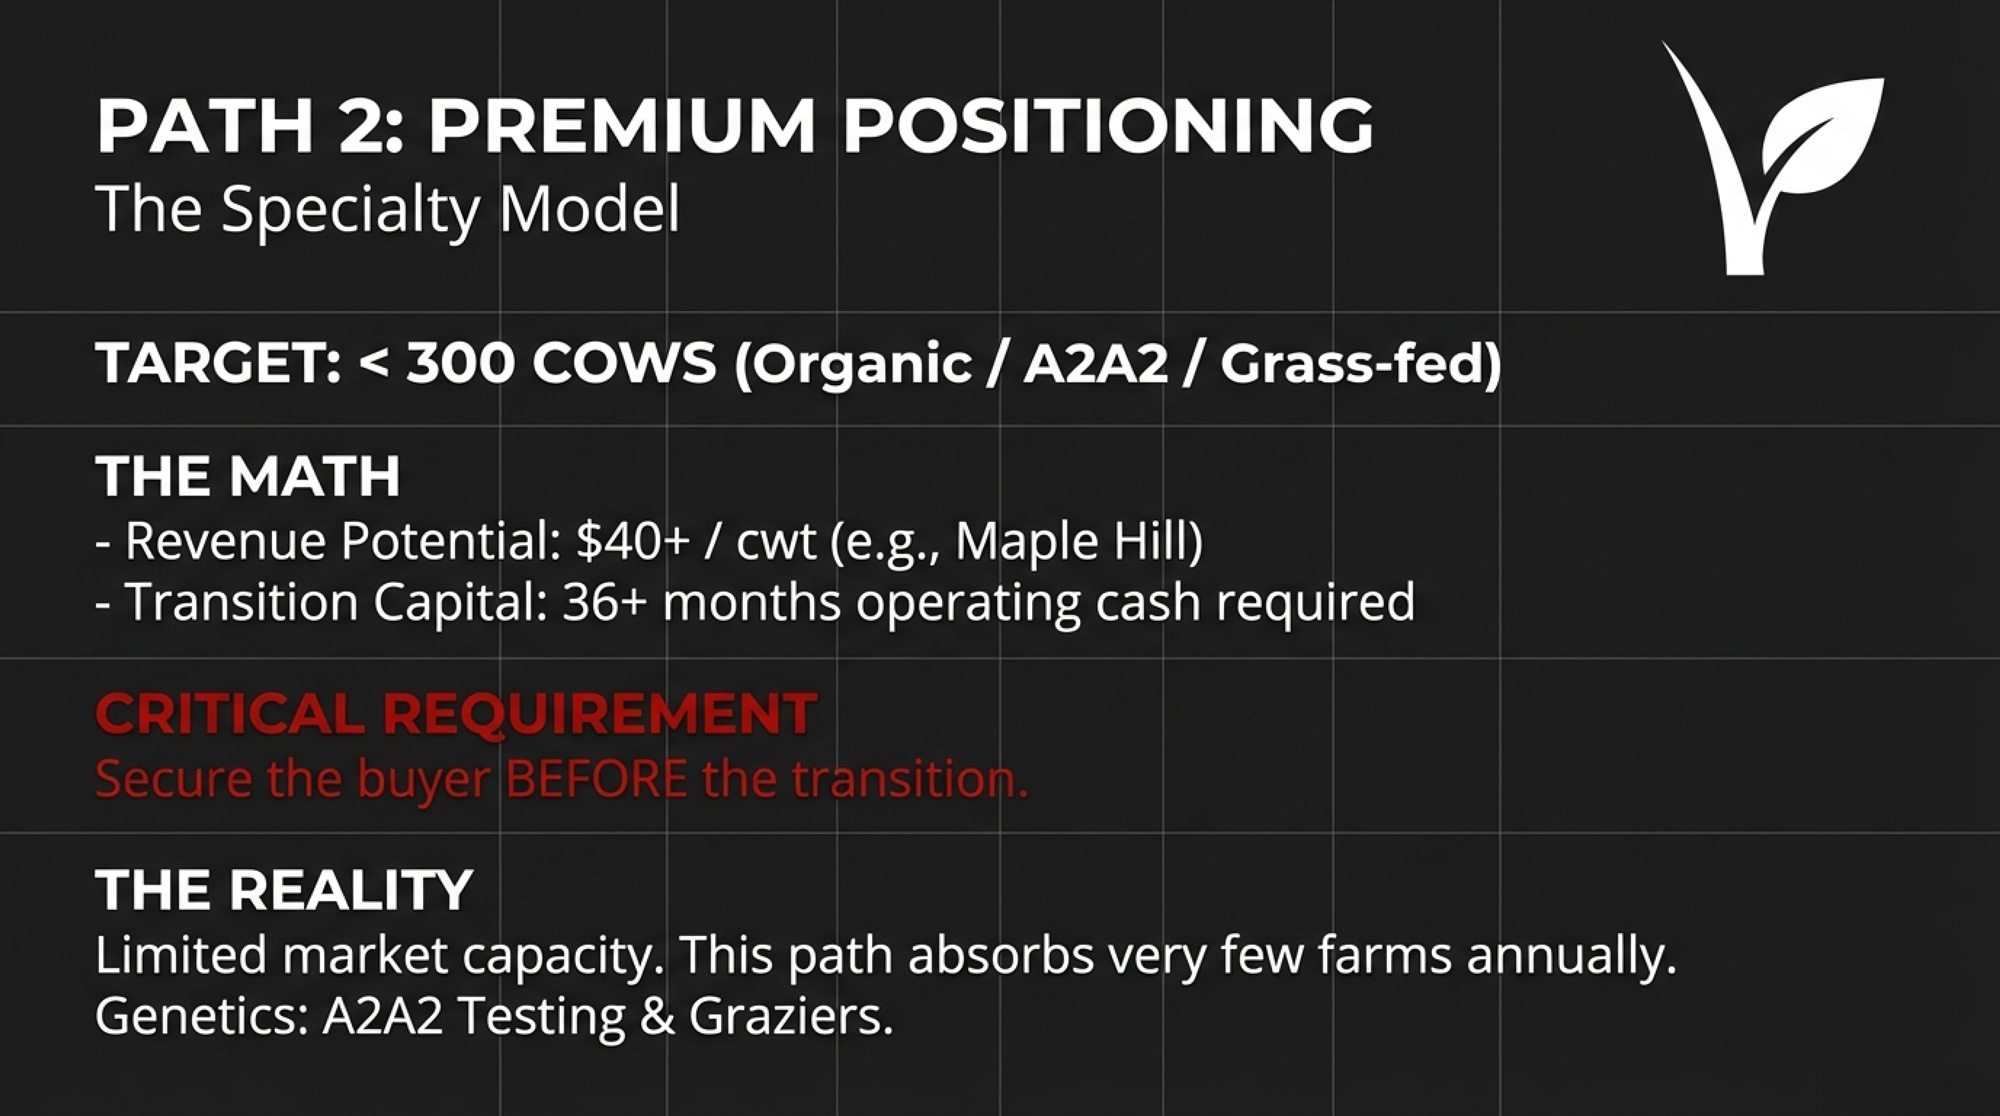
Path 2: Premium Positioning
Decision triggers:
- Your herd is under 300 cows—ideally under 200
- You’ve got pasture access at 2+ acres per cow
- You can secure a processor contract before starting the transition
- Someone in your operation wants to do the marketing work
It demands 36+ months of operating capital for organic transition. Maple Hill was moving to $40.86/cwt base by July 2025, with quality premiums pushing total pay toward $45/cwt for qualifying producers.
Genetics focus: A2A2 testing and segregation, Jerseys or crossbreeding for components, grass-efficient genetics. Most Holsteins run 50-60% A2 naturally—testing your herd first tells you how much work the transition requires.
Where it breaks: Premium markets absorb perhaps a few hundred operations annually at most. Wisconsin alone loses 400-500 farms per year, according to USDA data.
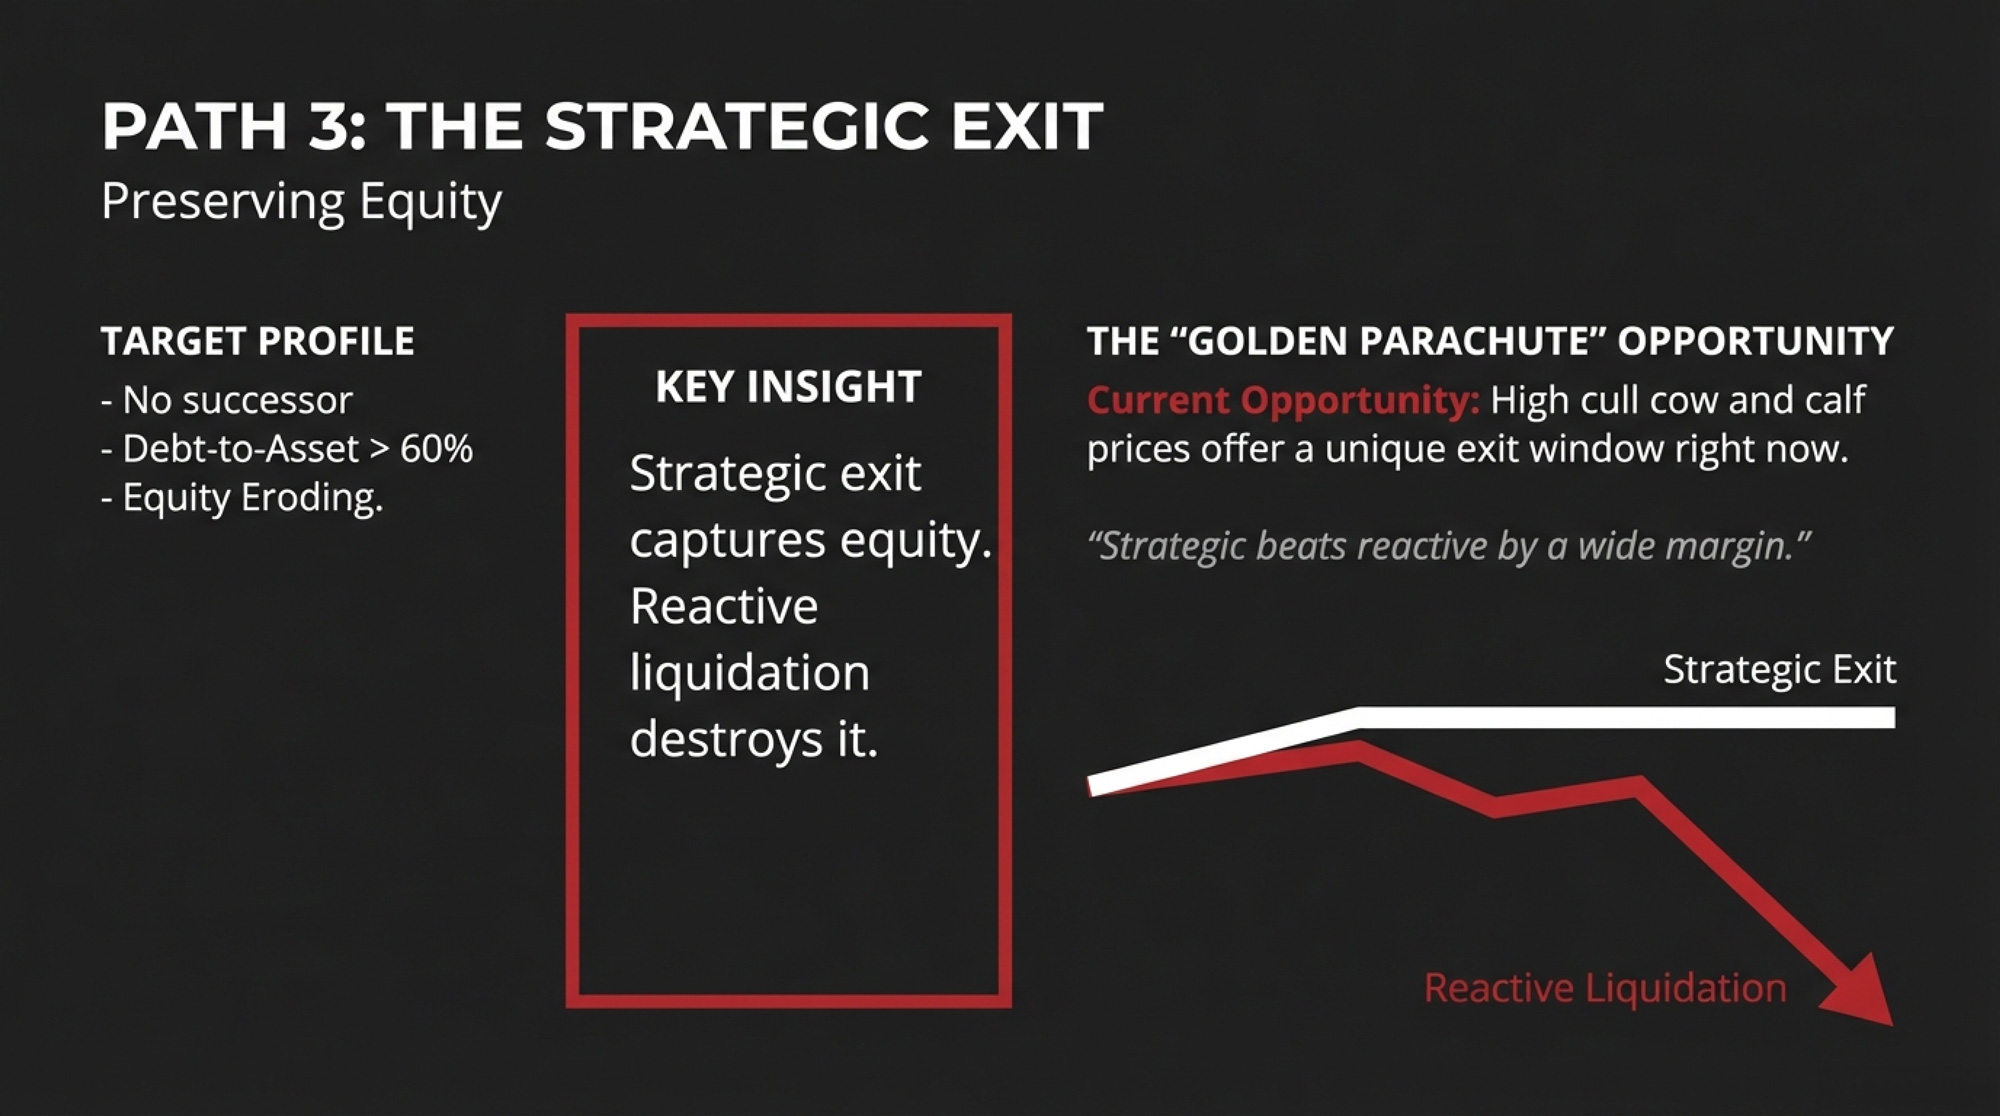
Path 3: Strategic Exit
Decision triggers:
- You’re past 55 with no committed successor
- Breakeven sits above $24/cwt with no clear path down
- Equity has eroded three years running
- Debt-to-asset has crossed 60% and keeps climbing
The gap between a well-planned exit and a forced sale can be substantial—potentially several hundred thousand dollars in recovered equity. Cull cow prices have been running strong in recent months.
One DFA executive put it this way: “For farms without succession plans, strong calf and cull prices offer a timely opportunity to exit the industry without incurring losses from prolonged milk prices.”
Signals Worth Watching
- Immigration reform is moving. The Farm Workforce Modernization Act was reintroduced in May 2025 with bipartisan support. Senate Ag Chair John Boozman recently said: “We said we could not do reform because the border was not secure… it is secure now, then through visa programs you control the flow, but it’s time to do that.” If year-round ag visas open up by 2027-2028, the labor advantage in growth states shrinks.
- Groundwater districts are tightening. Texas and Kansas conservation districts can implement pumping caps faster than the aquifer models update. Watch Dallam, Hartley, and Moore Counties in Texas, plus western Kansas districts.
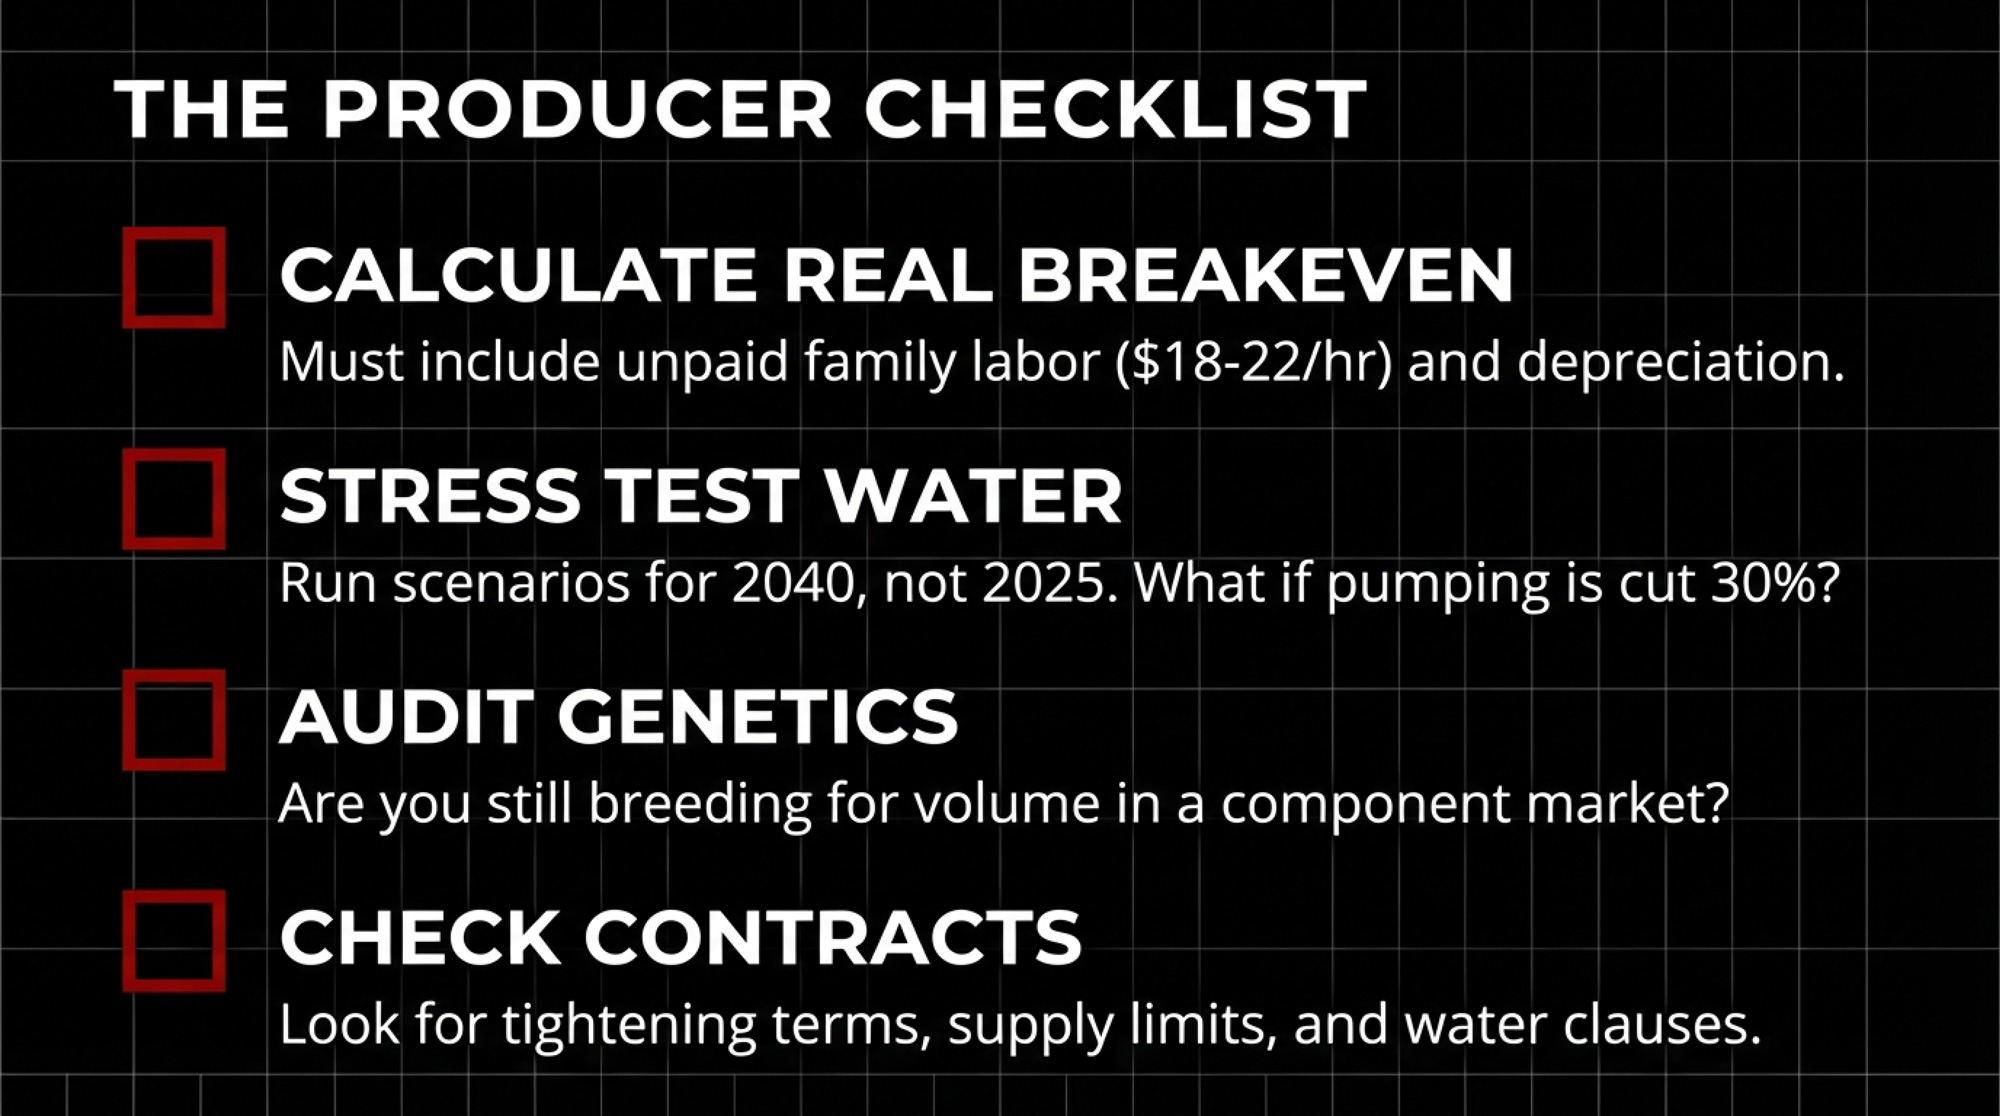
- Watch the processor contract terms. Are supply agreements getting shorter? Quality specs tightening? Water-efficiency clauses appearing? That tells you how processors are pricing in structural risk.
- Component premiums may shift. CoBank’s September 2025 report noted that butterfat growth has significantly outpaced protein growth and that excessive butterfat levels can impact cheese quality. Protein may command higher premiums than fat.
What This Means for Your Operation
- Know your real breakeven. Include unpaid family labor at $18-22/hour, depreciation at replacement cost, and management compensation. For most 300-500 cow herds, that number lands between $22-26/cwt.
- If you’re looking at growth states: Run your water scenario for 2040, not today. What happens if pumping gets cut by 30-40%? Consider the I-29 corridor as an alternative with better water security.
- If you’re eyeing premium markets, don’t start an organic transition without a signed contract. Test your herd’s A2A2 genetics first.
- Audit your genetics program. Are you still breeding for volume while processors pay for components? The April 2025 base change proves the industry has moved.
- If exit makes sense: Strategic beats reactive by a wide margin. That’s the difference between selling genetics as genetics versus a fire sale.
- Red flag: Your 18-month cash flow shows cumulative losses exceeding 15% of equity.
- Green light: You’re under 250 cows, have pasture, and a processor has put interest in writing at premium terms.
| Herd Size | Real Breakeven (incl. unpaid labor) | Current Milk Price Range | Decision Trigger |
|---|---|---|---|
| 100-200 cows | $25-28/cwt (red) | $20-22/cwt | Consider premium pivot or strategic exit (red) |
| 300-500 cows | $22-26/cwt (red) | $20-22/cwt | Marginal viability; efficiency gains or exit (red) |
| 500-1,000 cows | $20-23/cwt | $20-22/cwt | Viable if debt-to-asset < 50%; consider scale-up |
| 1,000+ cows | $18-21/cwt | $20-22/cwt | Profitable; focus on component optimization |
The Bottom Line
Processor confidence doesn’t validate producer expansion. Their bets pay off under scenarios where yours might not—they have optionality you don’t.
The three-path decision isn’t optional. Scale, premium, or exit. Staying the same size, doing the same things, hoping prices improve—that’s not a strategy. It’s a slow exit with worse terms.
Water, labor, and genetics are structural, not cyclical. These aren’t problems that fix themselves in the next price rally. Build them into your 10-year planning.
Chad Vincent of Dairy Farmers of Wisconsin captured the human weight of all this: “I think Wisconsin dairy is as strong today as it’s ever been, although it is sad to see the next generation not come back.”
Rabobank analyst Ben Laine summed up the trajectory: “Everything that we know about dairy consolidation says it hasn’t shown any signs of slowing down… I don’t see that changing.”
Wisconsin’s farm count peaked above 100,000 in the mid-20th century. Today, fewer than 6,000 remain—and production has nearly doubled. The milk keeps flowing. The communities that make it look nothing like they used to.
Where does your operation sit on that curve? And who’s making the call—you, or the next milk check?
Complete references and supporting documentation are available upon request by contacting the editorial team at editor@thebullvine.com.
Learn More
- Beyond the Milk Check: How Dairy Operations Are Building $300,000 in New Revenue Today – Stop bleeding cash by implementing a 90-day plan that recovers $45,000 in wasted feed and spoilage. This breakdown arms you with immediate revenue-building tactics beyond the milk check to bridge current margin gaps.
- The Bullvine Dairy Curve: 15,000 U.S. Farms by 2035 and Under 10,000 by 2050 – Who’s Still Milking? – Exposes the structural “Dairy Curve” that will shrink the U.S. industry to under 10,000 operations by 2050. Gain the foresight to choose your survival model before market forces and succession realities make the call for you.
- Genetic Revolution: How Record-Breaking Milk Components Are Reshaping Dairy’s Future – Reveals how the April 2025 genetic reset revalued every cow in your barn toward feed efficiency and fat density. This playbook unlocks the specific sire filters required to design a herd that thrives in a cheese-dominant market.
 Join the Revolution!
 Join the Revolution!
Join over 30,000 successful dairy professionals who rely on Bullvine Weekly for their competitive edge. Delivered directly to your inbox each week, our exclusive industry insights help you make smarter decisions while saving precious hours every week. Never miss critical updates on milk production trends, breakthrough technologies, and profit-boosting strategies that top producers are already implementing. Subscribe now to transform your dairy operation’s efficiency and profitability—your future success is just one click away.


