Archive for milk check revenue

Carbon Credits: $150,000 for Large Dairies, $3,000 for Family Farms – Here’s Why

Two dairies. Same carbon practices. One makes $150K, the other makes $3K. The difference isn’t what you think.

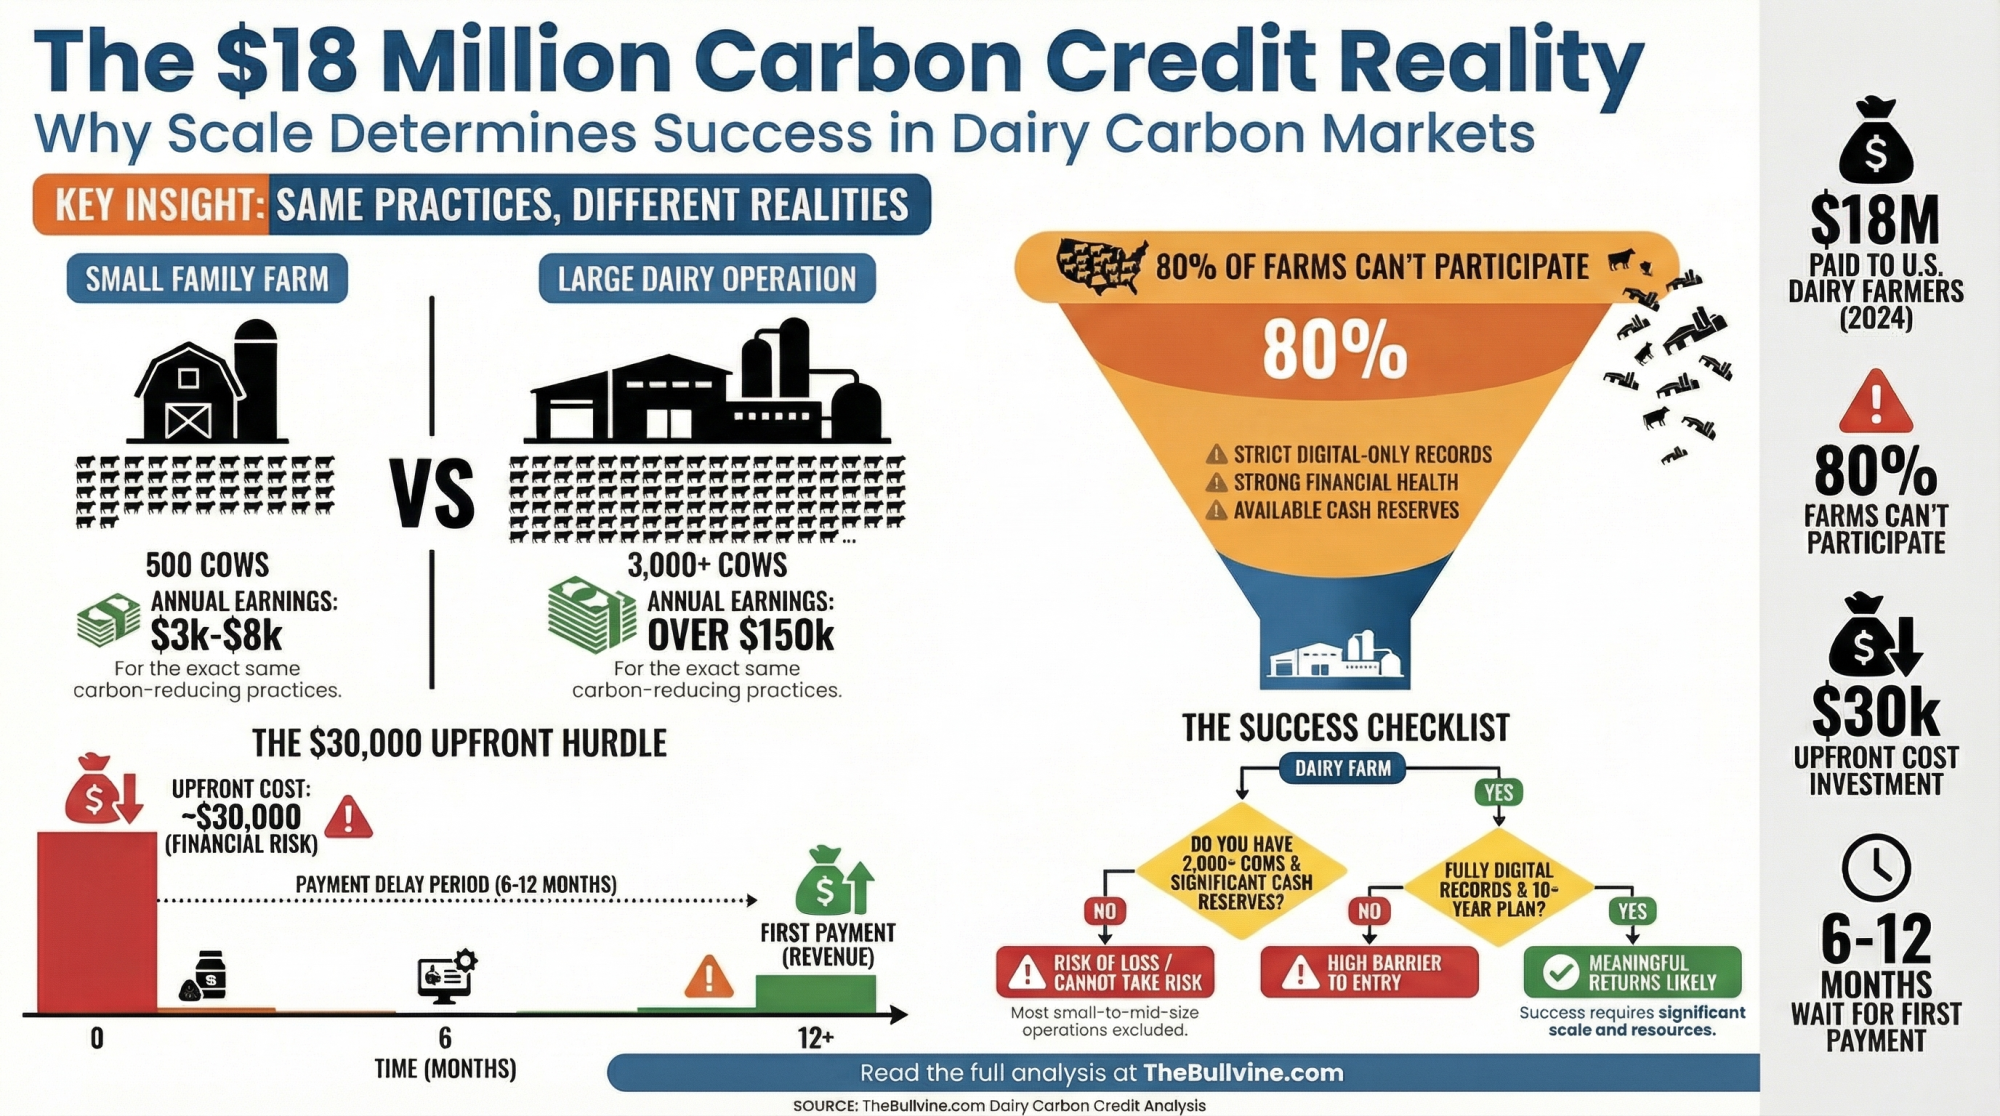
EXECUTIVE SUMMARY: Athian paid dairy farmers $18 million for carbon reductions in 2024, but the money isn’t flowing where you’d expect—large farms pocket $150,000 yearly while small operations get just $3,000 for identical practices. The math explains why: although per-cow profits are similar at $40-56, only operations with 2,000+ cows can justify the $28,000-37,000 upfront investment and 6-12 month payment delays. Add requirements for digital records and working capital above 1.25, and 80% of U.S. dairy farms simply can’t participate. Yet for qualified operations, carbon credits offer genuine value—transforming feed additives you’re already considering into profit centers. This article delivers real economics, explains why scale wins again, and provides a practical framework for determining whether carbon credits make sense for your specific operation.

So I was reviewing Athian’s latest announcement the other day, and here’s what caught my eye—they’ve actually distributed million to dairy farmers for emissions reductions since early 2024. Not promises, not projections. Real checks hitting real farm accounts. And what’s interesting is, these are for practices many of us have been considering anyway for operational efficiency. You know how it is—in our industry, sustainability initiatives usually mean spending more money for the privilege of doing the right thing. This development, though, it deserves our careful attention.

I’ve been talking with producers from Vermont to New Mexico who’ve navigated these dairy carbon credit programs, and I’ve noticed a fascinating pattern emerging. Success varies dramatically across operations, and here’s what might surprise you—it’s not about environmental commitment or willingness to adapt. What I’ve found is it’s primarily about operational scale, cash flow position, and whether you’ve already got your data management systems dialed in.

Understanding the Market Forces at Play

Let’s talk about what’s really driving these payments. As many of us have seen, major food companies—Nestlé and Mars among them—have committed to reducing supply chain emissions by 30% before 2030, according to their recent sustainability reports. And here’s the thing: since most of their carbon footprint originates at the farm level rather than in processing facilities, they’re actively seeking verified reductions from us dairy suppliers.

This has led to something called “insetting”—basically, these companies are investing in emissions reductions within their own supply chains rather than buying random offset credits from who knows where. DFA pioneered this approach in January 2024, becoming the first U.S. cooperative to purchase verified livestock emissions reductions through Athian’s platform. Their initial transaction involved a Texas dairy using Elanco’s Experior technology, and they documented 1,150 metric tons of CO2 equivalent reduction. That’s not theoretical—it’s verified, third-party audited through SustainCERT standards, and most importantly, paid for.

What distinguishes this from all those previous carbon initiatives we’ve seen come and go? The verification rigor. These dairy carbon credit programs require comprehensive documentation—you’re matching feed invoices with ration records, integrating milk production data, running everything through standardized calculation models, and having independent auditors verify it all. This level of verification means buyers can confidently report these reductions to their stakeholders.

Current Practices Generating Returns

Looking at current market activity, four practice categories are demonstrating consistent value for dairy farm profitability, and each has distinct operational requirements and economics worth understanding.

Feed additives for enteric methane reduction have really emerged as the primary pathway. Bovaer—that’s the 3-nitrooxypropanol compound from DSM-Firmenich—got regulatory approval in Canada and the UK in January, and the FDA completed their review in May. What’s encouraging is the research consistency: across 56 peer-reviewed studies, we’re seeing approximately a 30% reduction in enteric methane when administered at recommended doses. According to the Journal of Dairy Science’s comprehensive analysis, this translates to a 10-15% reduction in overall GHG intensity per unit of milk production.

Now, pricing varies considerably by region and purchase volume—you probably know this already. Industry data suggests Bovaer costs range from $0.30 to $0.50 per cow daily, while Rumensin (that’s monensin from Elanco) typically runs $0.13 to $0.15 per cow per day. Rumensin provides modest emission reductions, but it also delivers about a 3% improvement in feed efficiency, according to Elanco’s published data. That’s nothing to sneeze at when you’re looking at overall dairy milk check revenue.

Precision nutrition approaches, particularly those low-protein, amino acid-balanced rations, offer another pathway without requiring infrastructure investment. These strategies reduce nitrogen excretion and associated nitrous oxide emissions while potentially improving your feed cost efficiency. Ajinomoto’s AjiPro-L protocol, which Athian approved in April, exemplifies this approach. University of Wisconsin Extension trials indicate potential for both ration cost savings and carbon credit generation, though—as you’d expect—results vary by operation.

Anaerobic digester systems continue to provide opportunities for larger operations. You can stack RNG revenue, RIN credits, nutrient products, and now carbon insets. But let’s be realistic about the economics here—USDA NRCS data and Cornell’s agricultural economics research show you need at least $1,800 per cow in capital investment. Even with RCPP cost-share programs covering 50-75% of installation costs, that’s a serious commitment that really only pencils out at significant scale.

What I’m particularly interested in are these whole-farm carbon intensity protocols. Rather than requiring specific expensive interventions, they measure your overall emissions per unit of milk production. California’s CDFA has been developing this methodology, while the Innovation Center for U.S. Dairy has been creating parallel frameworks. If you’re already efficient—getting more milk from fewer cows with less waste through better genetics and reproduction—you should theoretically qualify even without fancy additives. And looking ahead, emerging technologies such as seaweed-based additives and genetic selection for lower-emission cows could further expand options, though they are still in development.

Economic Realities Across Different Scales

Here’s where things get really interesting for dairy farm profitability, and the implications vary dramatically by operation size. Let me share what I’ve learned from producers at different scales, including those Southeast operations dealing with heat stress and different housing systems.

A Wisconsin producer I know with 450 cows spent three months getting all his documentation together, and when the first payment came through, it was $4,200. As he told me, “It’s certainly welcome income, but when you consider the time investment and upfront costs, it doesn’t fundamentally change our operation.”

For a typical 500-cow dairy in Wisconsin or Pennsylvania—and I’ve run these numbers with several folks—participating in carbon credits for dairy farms looks something like this: Initial investment in feed additives runs $25,000 to $30,000 annually, assuming you’re using a combination of products. Data system upgrades, if you need them, add $2,000 to $5,000. Nutritionist consultation and protocol documentation typically cost another $1,000 to $2,000.

So you’re looking at a total upfront investment of $28,000 to $37,000.

And here’s the kicker—you pay these costs immediately, but receive carbon credit payments after 6 to 12 months of verification, per Athian’s current terms. That means you need that cash sitting available, not borrowed.

Current carbon pricing at $60 per ton represents a historical high—the Ecosystem Marketplace reports voluntary carbon markets averaged just $6.37 per ton in 2024. At these prices, a 500-cow operation might generate $5,000 to $8,000 in annual carbon revenue. Combined with potential feed efficiency gains of $15,000 to $20,000, net benefits could reach $20,000 to $28,000 annually. But that’s assuming stable carbon prices, smooth verification, and favorable baseline calculations…

The economics shift significantly at larger scales. An Idaho dairy manager I spoke with, who’s running 3,200 cows, explained: “We’re generating about $47 per cow from carbon credits, plus the feed efficiency improvements. At our scale, that translates to over $150,000 annually—meaningful revenue that justifies the administrative investment.”

This reveals something important for dairy milk check revenue: while per-cow returns are similar ($40-56 for smaller operations versus $43-57 for larger ones), the absolute dollar amounts make participation worthwhile for larger operations while remaining marginal for smaller ones.

Operations That Should Consider Alternatives

Based on extensive discussions with producers and financial advisors from Michigan to Arizona, certain operations face structural barriers that make successful participation in current dairy carbon credit programs challenging for overall dairy farm profitability.

If your working capital ratio is below 1.25, you don’t have the financial flexibility to manage that 6 to 12-month payment delay. The Farm Financial Standards Council identifies this as a critical threshold for operational stability, and I’ve seen this play out firsthand. One producer near Viroqua, Wisconsin, with 380 cows, carefully analyzed his situation. He told me, “Borrowing to cover upfront costs at 8% interest would essentially eliminate any carbon revenue benefit. The mathematics simply didn’t support participation.”

If you’re still using paper-based or basic spreadsheet record-keeping, the documentation burden will probably eat you alive. These carbon programs for dairy farms require integrating feed invoices, ration records, and milk production data in formats that support third-party verification. It’s not impossible with manual systems, but honestly, the administrative burden often becomes prohibitive.

“The transition from paper to carbon credits simply doesn’t occur—it’s from digital systems to carbon credits.”

Pasture-based operations encounter technical limitations with current protocols. Both Bovaer and Rumensin require consistent daily dosing through total mixed rations. DSM’s product development pipeline includes slow-release bolus systems for grazing operations, but they aren’t yet commercially available. These producers may find better opportunities in whole-farm intensity protocols that recognize the inherent efficiency of well-managed grazing systems. This is particularly relevant for Southeast producers, where year-round grazing is more common.

And if you’re approaching retirement within 5 to 7 years, you should carefully evaluate participation. These programs typically achieve optimal returns over 10 to 15-year horizons, allowing carbon revenues to compound and infrastructure investments to fully amortize.

Industry Structure Implications

Something we need to consider thoughtfully is how these programs might affect industry structure and long-term patterns of dairy farm profitability. Large-scale operations in Texas, Idaho, and California that implement comprehensive carbon programs might generate $200,000 or more annually. That creates meaningful cash flow advantages and balance sheet improvements that can influence expansion decisions and market dynamics.

Meanwhile, a 400-cow operation might generate $3,000 in carbon credits—barely covering administrative costs. When milk prices cycle from $20 to $16 per hundredweight, as they periodically do, operations with substantial carbon revenue cushions have clear advantages in weathering these downturns.

Current USDA Census of Agriculture data show we’re losing 2,100 to 2,800 dairy farms annually, with exits concentrated in the 150- to 1,500-cow range. While dairy carbon credit programs don’t cause this consolidation, they may influence its pace by providing additional advantages to operations already benefiting from economies of scale.

This raises important questions about program design and accessibility that we as an industry continue to grapple with.

Common Success Factors

Producers successfully participating in these programs—whether they’re in the Northeast, Midwest, or Western regions—share several characteristics worth noting for those seeking to enhance dairy milk check revenue.

Cooperative participation proves crucial. Working through established programs at DFA, Land O’Lakes, or similar organizations significantly reduces administrative complexity. The co-ops handle documentation aggregation, facilitate buyer connections, and provide technical support that individual producers would struggle to replicate on their own.

Financial strength matters—a lot. Successful participants typically maintain working capital ratios above 1.5, giving them the flexibility to manage payment timing without incurring debt. As one Wisconsin producer with 1,100 cows near Fond du Lac observed, “If carbon payments are necessary for cash flow, the operation probably isn’t ready for program participation.”

These successful producers view carbon credits as complementary to operational improvements rather than primary drivers of dairy farm profitability. A Pennsylvania dairyman with 750 cows explained their perspective: “We were evaluating Rumensin for efficiency gains regardless. The carbon credits transformed a good decision into an obvious one.”

And digital infrastructure proves essential. Not necessarily sophisticated systems, but at least DHIA participation, computerized ration management, and organized record-keeping. The transition from paper to carbon credits simply doesn’t occur—it’s from digital systems to carbon credits.

Verification Processes and Practical Considerations

Understanding verification helps set realistic expectations for dairy carbon credit programs. Programs begin by establishing baseline emissions using models with acknowledged uncertainty ranges of 15-25%, in accordance with IPCC methodology and UC Davis CLEAR Center analysis. Your baseline could vary substantially in either direction—something to keep in mind.

Implementation requires comprehensive documentation—feed invoices, ration formulations, production records, and health events. Verification bodies, including SustainCERT and other ISO 14064-accredited auditors working with Athian, review this documentation through varying combinations of remote review and farm visits.

One Wisconsin producer with 650 cows near Bloomer experienced the complexity of verification firsthand. Initial approval was questioned 6 months later when butterfat levels changed, potentially indicating variation in the feed additive. Three additional months of documentation were required to verify consistent feeding practices. The final payment arrived 11 months late, rather than the anticipated 6.

Credit registration on Athian’s blockchain ledger prevents double-selling within their system. But as the Institute for Agriculture and Trade Policy noted in their recent analysis of insetting risks, enforcement mechanisms across different platforms remain underdeveloped. Something to be aware of.

Looking Ahead: Realistic Expectations for 2030

If current trajectories continue, what might we reasonably expect for dairy farm profitability by decade’s end?

Industry-wide emissions intensity could decrease 20 to 30% through combined adoption of feed additives, ration optimization, and efficiency improvements. California Air Resources Board data already show a 20% reduction in methane intensity from early adopter programs, suggesting this target is achievable.

Mid-size farm participation could expand through cooperative-led programs that aggregate verification costs and streamline administration. Replicating DFA’s model across major cooperatives could make participation as routine as DHIA testing for appropriately positioned operations.

Carbon price stabilization through corporate commitments seems plausible. Companies might guarantee minimum prices of $40 to $50 per ton for verified reductions from their supply chains, providing investment confidence for participating producers.

Policy mechanisms could amplify market-based approaches. Implementation of the 45Z tax credit under the Inflation Reduction Act could establish price floors. State programs, like California’s $25 million methane-reduction initiative through its Climate Smart Agriculture program, demonstrate potential for complementary support.

Realistically, I anticipate 2,000 to 3,000 larger farms generating $150 to $300 million in cumulative payments by 2030—meaningful for those operations but unlikely to transform industry-wide economics or substantially alter consolidation patterns affecting dairy milk check revenue across all farm sizes.

A Practical Decision Framework

For producers considering participation to enhance dairy farm profitability, here’s a systematic evaluation approach based on actual participant experiences:

Step 1: Assess your working capital ratio. Below 1.25 indicates you need operational stabilization before adding program complexity.

Step 2: Calculate your true break-even costs, including all expenses. If you’re exceeding $20 per hundredweight in current markets, carbon credits won’t address fundamental profitability challenges.

Step 3: Evaluate available cash reserves. Can you deploy $25,000 to $35,000 for 6 to 12 months without borrowing? Interest costs often eliminate carbon revenue benefits.

Step 4: Engage your cooperative. Established programs with clear protocols and payment histories indicate readiness. “Exploring options” suggests patience might be warranted.

Step 5: Review your documentation capabilities. Digital ration management, DHIA participation, and nutritionist relationships all contribute to readiness.

Step 6: Consider your time horizon. Ten-plus year operational plans align well with program economics. Five-year exit strategies likely don’t.

This framework probably excludes 70 to 80% of U.S. dairy farms, which itself reveals important characteristics about current market design and its impact on dairy farm profitability.

Broader Industry Implications

The emergence of functional dairy carbon markets represents genuine progress. It demonstrates corporate willingness to invest in verified emissions reductions, validates market mechanisms for environmental progress, and rewards efficiency improvements that many of us pursue regardless.

Yet it also illuminates the limitations of the agricultural market. These mechanisms naturally favor scale, sophistication, and capital access—characteristics already driving industry evolution. Programs generating $150,000 annually for large operations while offering $3,000 to smaller farms reflect market dynamics rather than program design flaws.

This isn’t attributable to any particular organization or conspiracy. It’s simply how markets function when transaction costs are substantial and economies of scale are significant. The relevant question isn’t fairness but rather our collective comfort with carbon markets as another factor influencing industry structure and dairy milk check revenue distribution.

My assessment? These represent useful tools rather than transformative solutions for dairy farm profitability. Well-capitalized operations already pursuing efficiency improvements will find carbon revenues provide a welcome acceleration. Marginal operations won’t find salvation here. For the broader industry, it’s another advantage accruing to scale in an already scale-advantaged system.

Evaluate these opportunities based on your specific situation. But maintain realistic expectations about carbon credits as supplemental revenue rather than foundational income, especially given agriculture’s historical pattern of commodity price volatility.

Athian’s $18 million in payments is real. The practices deliver results. The verification systems function. But whether this matters for your particular operation depends entirely on where you sit within dairy’s increasingly differentiated structure. And that’s the conversation we need to continue having—not just whether carbon markets work, but how they work within our evolving industry landscape and their real impact on dairy farm profitability.

Editor’s Note: Producer experiences shared in this article are based on interviews conducted in November 2025.

KEY TAKEAWAYS

  • The $18M reality: Carbon credits paid dairy farmers real money in 2024, but large operations (3,000+ cows) capture $150,000 annually while family farms (500 cows) get just $3,000-8,000 for identical practices
  • Why scale always wins: Per-cow profits are virtually the same at $40-56, but you need 2,000+ cows to cover the $30,000 upfront investment and 6-12 month cash flow gap
  • Your qualification checklist: Must have a working capital ratio >1.25, digital record systems already running, and participate through established co-op programs—miss any one and you should pass
  • Bottom line decision: Carbon credits work for well-capitalized operations planning 10+ year horizons, but won’t save struggling farms—they amplify existing advantages rather than leveling playing fields

Complete references and supporting documentation are available upon request by contacting the editorial team at editor@thebullvine.com.

Learn More:

Join the Revolution!

Join over 30,000 successful dairy professionals who rely on Bullvine Weekly for their competitive edge. Delivered directly to your inbox each week, our exclusive industry insights help you make smarter decisions while saving precious hours every week. Never miss critical updates on milk production trends, breakthrough technologies, and profit-boosting strategies that top producers are already implementing. Subscribe now to transform your dairy operation’s efficiency and profitability—your future success is just one click away.

NewsSubscribe
First
Last
Consent

Whole Milk Returns to Schools After $4.3B Loss – But Only Mega-Dairies Can Capture the Win

We predicted it. Lost $4.3B fighting it. 11,000 farms died waiting. Whole milk’s finally back—but the industry that won isn’t the one that warned.

EXECUTIVE SUMMARY: Whole milk returns to schools after a 13-year ban that cost dairy $4.3 billion and killed 11,000 farms—but the survivors who’ll benefit aren’t the ones who warned Congress this would happen. University of Toronto research confirmed what producers always knew: whole milk reduces childhood obesity by 40% compared to skim milk, completely debunking the policy’s premise. However, consolidation during the fight means only mega-dairies (1,500+ cows) can access school contracts worth $40-80K annually, while 97% of remaining farms are effectively locked out. The window for action is narrow: producers must contact their cooperatives NOW to position for RFPs releasing January 2026, with contracts locking by July. Small operations should forget institutional milk and leverage whole milk’s vindication for premium direct sales, while mid-sized farms face a brutal choice between fighting for scraps or pivoting to specialty markets. The lesson is unforgiving: in agricultural policy, being right means nothing if you don’t survive long enough to collect.

You know, looking at what happened in the Senate last Tuesday—unanimous passage of the Whole Milk for Healthy Kids Act—you’d think we’d all be celebrating. And yeah, it’s definitely a victory. After watching kids dump skim milk down cafeteria drains for 13 years while our neighbors went under, whole milk’s finally coming back to schools.

But here’s what’s been keeping me up at night, and I’ve been hearing the same thing from producers all over. The dairy industry that gets to capture this opportunity? It looks nothing like the industry that warned Congress this would happen back in 2012. We’ve lost 11,000 farms during this fight. The survivors are entirely different breeds—either massive operations with 2,500-plus cows or specialty producers who found their niche. That 300-cow family dairy that needed this policy most? Most of ’em are gone.

Herd Size2012 Farms2025 FarmsChange %Milk Share 2025 %
Under 100 cows2814116334-427
100-499 cows88685889-3415
500-999 cows15801025-3510
1,000-2,499 cows1000900-1022
2,500+ cows7148341746

What I’m finding as I talk to folks trying to figure out what this means for their operations is that winning the policy battle doesn’t reverse the structural war we’ve already lost. So let me walk you through what actually happened, what it cost us, and—here’s the important part—what you can actually do about it in the next six months.

The Scale of What We Lost: More Than Just Milk Sales

YearPer Capita (lbs/year)School Policy PhaseAnnual Decline Rate %
2009190Pre-Ban0.75
2012185Ban Implemented2.6
2015172Ban Effect2.6
2018155Accelerated Decline2.6
2021141Continued Fall2.6
2023130Record Low1.5
2025128First Increase Signal-0.8

I’ve been going through the numbers with economists at Cornell and Wisconsin, and it’s worse than most of us realize. When the National Milk Producers Federation testified to the USDA back in April 2011 that restricting schools to skim and 1% milk would hurt consumption, they actually underestimated what would happen. You can look it up in their comments if you’re curious—docket USDA-FNS-2011-0019.

School milk represents about 7 to 8 percent of total U.S. fluid milk demand, according to the USDA’s Economic Research Service—we’re talking roughly a billion dollars annually. Sounds manageable, right? But here’s what nobody calculated: when you tell 30 million kids for 13 years that whole milk is unhealthy, you don’t just lose school sales. You lose a generation.

Before 2012’s restrictions kicked in, fluid milk consumption was declining at about 3/4 of 1 percent per year—concerning but manageable, according to the International Dairy Foods Association’s market reports. After? That rate exploded to 2.6 percent annually. That’s not evolution; that’s acceleration.

A Wisconsin producer I know who runs about 450 cows put it best: “We watched our school contracts evaporate overnight. But worse was watching those kids grow up thinking milk was bad for them. Now they’re adults buying oat milk.”

The direct hit to producer revenue over 13 years? Based on Federal Milk Marketing Order pricing data, it’s about $1.38 billion. But that’s just the beginning. When Class I utilization drops in the federal orders, it drags down the blend price every producer receives—University of Missouri’s policy research folks calculated another $182 million spread across all farms.

Then you’ve got the supply chain multiplier effect. USDA’s Economic Research Service uses standard agricultural multipliers of around 1.8 times for dairy. So that lost producer revenue of $1.38 billion means a total supply chain impact of around $2.49 billion. Haulers, feed suppliers, equipment dealers—everybody took a hit.

Add in competitive losses to plant-based alternatives—Euromonitor International’s dairy alternatives tracking pegged it at about $650 million in institutional market share—plus the waste. And the waste is mind-boggling. The Center for Science in the Public Interest estimates that about 45 million gallons annually that kids refused to drink, worth nearly a billion dollars at Class I pricing.

CategoryAmount ($ Billions)Percentage
Direct Producer Revenue Loss1.3832.1
Blend Price Impact (All Farms)0.1824.2
Supply Chain Multiplier Effect1.11225.9
Competitive Losses to Alternatives0.6515.1
School Milk Waste0.97622.7

When you combine all these factors—the direct losses, blend price impacts, supply chain effects using those standard multipliers, competitive losses, and waste values—you’re looking at a total economic impact approaching $4.3 billion. Though I should note that nobody’s done a comprehensive study pulling all these pieces together. We’re aggregating from multiple sources here.

“That’s not just a policy mistake, folks. That’s a generational disaster.”

What Science Now Shows: We Had It Backwards All Along

MetricWhole MilkSkim/Low-Fat Milk
Childhood Obesity Odds40% LOWERBaseline
Overweight Risk Reduction40% lower oddsNo reduction found
Added Sugar Content0g (natural)8-12g (added)
Satiety FactorHigh (natural fats)Lower
Fat-Soluble Vitamin DeliverySuperior (vitamins A,D,E,K)Reduced effectiveness
Studies Supporting18 of 28 studies0 of 28 studies

This is the part that really gets me—and I’m hearing the same frustration everywhere I go. The whole scientific foundation for banning whole milk? It’s completely collapsed.

Dr. Jonathon Maguire, up at the University of Toronto, published this meta-analysis in the American Journal of Clinical Nutrition back in December 2020—looked at 28 studies with 21,000 children. The finding? Kids drinking whole milk had 40 percent lower odds of being overweight or obese compared to those drinking reduced-fat milk. Not one study—not a single one—showed skim milk reducing obesity risk.

As Maguire wrote in the journal, children who followed the current recommendation to switch to reduced-fat milk at age two weren’t any leaner than those who consumed whole milk.

What’s interesting here—and this is what really burns me—is what schools actually did to make fat-free milk palatable. They added sugar. Lots of it. The Center for Science in the Public Interest did an analysis showing that fat-free chocolate milk in schools contains up to 12 grams of added sugar per carton. That’s nearly half what the American Academy of Pediatrics says kids should have in a whole day, based on their 2019 policy statement.

Think about that for a minute. We removed natural milk fat, which provides satiety and fat-soluble vitamins, and replaced it with processed sugar. A dietitian I know at Penn State Extension—she’s been doing this for 30 years—called it the most backwards nutritional policy she’d ever seen.

How Dairy Finally Won: The Coalition Nobody Expected

I’ve been covering dairy politics for two decades, and what happened this year was unlike anything I’ve seen. After failed attempts in 2016, 2019, and that unanimous consent block by Senator Stabenow last December, how’d we suddenly get unanimous passage?

The breakthrough came from the most unlikely place: the Physicians Committee for Responsible Medicine. Now, this group has historically opposed dairy consumption, right? But Senator Welch’s team made a strategic calculation—they added language guaranteeing schools could serve, and I quote, “nutritionally equivalent nondairy beverages that meet USDA standards.”

A Senate Agriculture Committee staffer familiar with the negotiations told me, “We realized we couldn’t win by fighting everyone. So we found ways to give opposition groups something they wanted while still achieving our core goal.”

The senator pairing was brilliant, too. Peter Welch from Vermont brought the economic urgency—his state’s lost more than 500 dairy farms since 2012, according to the Vermont Agency of Agriculture’s latest data through 2024, a crushing 55 percent decline. Roger Marshall from Kansas, an OB-GYN with 25 years of practice before Congress, provided medical credibility that transcended typical ag lobbying. When you’ve got a physician-senator arguing for whole milk’s nutritional benefits, it carries a different weight than dairy executives making the same case.

But the real game-changer came from school food service directors testifying about operational reality. One Pennsylvania director told legislators that the amount of waste they were throwing away each day was disheartening—kids just wouldn’t drink the skim milk.

That operational reality, from public sector administrators rather than industry advocates, changed the conversation entirely.

And then there’s the RFK Jr. factor. When the incoming HHS Secretary calls whole milk restrictions “nutrition guidance based on dogma, not evidence” in public statements, dairy’s position suddenly aligns with a broader health reform movement. FDA Commissioner nominee Dr. Martin Makary went even further at his confirmation hearing, saying we’re ending the 50-year war on natural saturated fat.

The Harsh Reality: Small Farms Can’t Access This Opportunity

Now here’s where I need to level with you about what this actually means for different operations. I’ve been talking to procurement specialists at DFA, Land O’Lakes, and regional cooperatives across the midwest, and the reality’s tough for smaller farms.

For Large Operations (1,500+ cows)

If you’re milking 1,500-plus head, this is a genuine opportunity. Based on current Class I differentials from the November federal order announcement and institutional pricing models, you could see $40,000 to $80,000 in additional annual revenue. These operations typically have what schools need—cooperative relationships for procurement access, daily volume to meet district minimums (usually 2,000-plus pounds), and standardized equipment to hit that 3.25 percent butterfat spec.

A large-herd operator in Wisconsin told me that his co-op has been preparing bid packages since October. “We’ve got the volume, the testing protocols, everything schools require,” he said.

For Mid-Size Operations (500-1,000 cows)

The opportunity exists, but it’s complicated. You might see $15,000 to $30,000 annually—helpful but not transformational. The challenge? You’re competing with larger operations for cooperative priority.

One Central Valley producer milking 650 told me, “I could supply our local district easily. But our co-op prioritizes the 5,000-cow operations because the logistics are simpler. One truck stop instead of eight.”

Down in Texas, the situation’s even tougher. A producer with 725 Holsteins outside Stephenville explained they’re 45 minutes from the nearest processor. “School contracts require daily delivery. The math just doesn’t work unless you’re right next to a bottling plant or have 2,000-plus cows to justify dedicated hauling.”

In Nebraska—right in Senator Marshall’s backyard—the consolidation’s been particularly stark. A producer near Grand Island, milking 550 cows, explained that their cooperative had merged with two others in the past five years. “We used to have direct say in school milk contracts. Now we’re competing with operations five times our size for the same procurement slots.”

For Small Operations (Under 300 cows)

I hate to say this, but institutional whole milk offers almost no direct opportunity for operations under 300 cows. School procurement requires minimums you can’t meet independently—typically 500 gallons per day, based on what I’ve seen in Michigan and Iowa district RFPs.

The path forward is different. A Vermont producer milking 180 Jerseys told me they’re focusing on farmers markets and local retail. “Whole milk’s vindication helps our direct marketing—we can tell customers the government was wrong, and they believe us now.”

In Georgia, small producers are finding similar alternatives. One producer with 220 cows near Quitman explained they can’t compete for Atlanta school contracts. “But we’re selling to three local private schools at $4.50 a gallon. They want local, and whole milk’s return legitimizes premium pricing.”

Farm SizeAnnual Revenue PotentialMarket AccessNumber of FarmsAccess Probability %
2,500+ cows$60-80KDirect/Priority83495
1,500-2,499 cows$40-60KDirect/Competitive90075
500-999 cows$15-30KLimited/Co-op Only102530
300-499 cows$5-10KMinimal32005
Under 300 cows$0-2KNone181092

The Seven-Month Sprint: Your Action Timeline

DateActionProducer ActionCritical Level
Nov 2025Senate passes bill unanimouslyContact co-op NOWHIGH
Jan 2026School RFPs releasedReview district opportunitiesHIGH
Feb-Mar 2026Producer positioning windowSubmit commitmentsCRITICAL
Apr-May 2026Bids due to districtsFinalize agreementsFINAL DEADLINE
Jul 1 2026New contracts beginBegin deliveriesGO-LIVE
Aug 2026+Market locked (incumbents only)Wait 1-3 years for next cycleLOCKED OUT

What’s catching producers off-guard is how fast this moves. We’re operating on school procurement timelines, not legislative calendars.

📅 The Critical Dates You Can’t Miss:

➤ January–March 2026: School districts release RFPs
➤ April–May 2026: Bids are due (If you aren’t positioned, you’re out)
➤ July 1, 2026: New contracts begin

After July 2026, breaking into the school supply means displacing an incumbent. Good luck with that—I’ve seen it happen maybe twice in 20 years covering dairy markets.

☎️ Your Homework: Call Your Milk Handler TODAY

Don’t wait until next week. Pick up the phone and ask these exact questions:

1. “Are you bidding on school whole milk contracts for 2026-27?”

2. “What commitments do you need from member farms?”

3. “What’s our current butterfat running?” (National average hit 4.23% in October per USDA)

4. “Can you standardize our 4.2% fat down to 3.25%?”

5. “What’s the premium for institutional Class I vs. our current blend?”

6. “Which school districts can we realistically reach?”

A procurement director at one of the midwest regional cooperatives told me they’re getting 50 calls a day about this. The producers who commit early get priority when bid packages go out.

The Genetics Question: Don’t Panic About Your Breeding Program

I’m getting panicked calls from producers worried their genetics are wrong for whole milk. Here’s what Dr. Kent Weigel, who chairs dairy science at UW-Madison, explains: You don’t need to change your genetics. You need standardization capability.

Current U.S. herds are averaging 4.23 percent butterfat according to USDA’s October milk production reports—a record high driven by cheese market premiums. School whole milk needs exactly 3.25 percent. That seems like a problem, but it’s actually an opportunity.

Patricia Stroup, who’s COO at Horizon Organic, explained to me that they standardize all their institutional milk. “Higher butterfat means more cream to separate and sell at premium prices. It’s additional revenue, not a problem.”

Your 4.2 percent milk becomes 3.25 percent whole milk. The separated cream? That’s going into premium butter—CME spot prices have been running around $3.20 a pound lately. You’re not losing value; you’re creating two revenue streams.

Butterfat has a heritability of 0.40 to 0.50 according to USDA’s genetic evaluation summaries—high enough to adjust if truly needed. But genetic changes take 3 to 5 years, depending on generation intervals. This opportunity window might shift again before your genetics catch up.

Dr. Chad Dechow, who does dairy cattle genetics at Penn State, advises keeping your breeding focused on components. “The cheese market isn’t going away, and standardization solves the institutional specifications,” he told me.

Market Outlook: What Economists See Coming

[CHART: Fluid milk consumption trends 2010-2025 with projections]

Looking beyond just the school opportunity, the broader market dynamics matter for positioning. Dr. Marin Bozic, the dairy economist at the University of Minnesota, sees structural shifts ahead.

“We’re entering a period where fluid milk might stabilize at 140 to 150 pounds per capita,” Bozic explained when we talked. “That’s not growth, but it ends the bleeding. For producers, predictable Class I demand at 22 to 23 percent of total utilization beats continued decline to 18 to 20 percent.”

The generational damage is real, though. Kids who drank skim milk in schools from 2012 through 2025 are adults now. They’re not suddenly switching to whole milk because policy changed. But their kids might—if whole milk’s available when they enter school.

IDFA reported in their August 2025 dairy market update that producers sold 0.8 percent more fluid milk than in 2023—the first increase since 2009. Whole milk specifically showed real strength. Conventional whole milk’s up 1.3 percent year-over-year according to IRI’s retail tracking data. Organic whole milk’s up 6.2 percent based on SPINS organic market reports. Flavored whole milk’s up 20 percent in peak months per Nielsen beverage category data.

Whole milk now represents 42 percent of retail sales—the highest since 2001.

The Consolidation Truth: Understanding Today’s Industry

This is the hardest conversation I have had with producers, but we need to face reality. Between 2012 and 2025, based on the USDA’s Census of Agriculture data and structural analyses, the changes are stark.

Farms under 100 cows are down 42 percent, from 28,141 to 16,334. The 100 to 499 cow operations dropped 34 percent. Mid-sized farms with 500 to 999 cows fell 35 percent. But farms with 2,500-plus cows? They’re up 17 percent.

The only category growing is mega-dairies. They now produce 46 percent of U.S. milk while representing just 3 percent of farms, according to USDA-NASS farm structure data.

A former Ohio dairyman who sold 350 cows during the 2015 price crash told me, “The whole milk policy would’ve saved our farm in 2015. But it’s too late now. We’re out, and the neighbor who bought our cows is milking 3,000.”

Wisconsin’s story is particularly telling. They’ve been losing 8 to 10 dairy farms per week from 2014 to 2024, according to data from the Wisconsin Agricultural Statistics Service. The survivors? Either massive operations with economies of scale or boutique producers selling $8 a gallon milk at farmers markets.

Vermont’s even starker. Of their remaining 480 farms—down from 973 in 2012, per the Vermont Agency of Agriculture—73 percent have fewer than 200 cows, accounting for 30 percent of production. Meanwhile, 9 percent are over 700 cows, producing 40 percent of milk.

The mid-sized farms that whole milk could’ve helped? They’re mostly gone.

What This Victory Actually Means

Let me be straight with you about what this moment represents, because false hope doesn’t help anybody make good decisions.

Yes, the science vindicated us—whole milk is better for kids than skim. The University of Toronto research is bulletproof. Yes, we built a coalition that achieved unanimous Senate passage. That’s remarkable in today’s politics. And yes, there’s real money here for farms positioned to capture it.

But let’s acknowledge what this victory can’t do. It can’t bring back the 11,000 farms we lost. It can’t reverse the consolidation that accelerated while we fought this policy. And it can’t transform the fundamental economics pushing dairy toward fewer, larger operations.

A Wisconsin farmer who sold his 450-cow operation in 2018 reflected, “This would’ve been transformational in 2012. Now it’s a nice win for the big guys who survived.”

What strikes me most is the gap between being right and having it matter. The dairy industry accurately predicted everything—consumption collapse, waste, and pressure to consolidate. NMPF’s 2011 testimony to USDA reads like prophecy now. But being right didn’t change the timeline.

“Policy moves on political schedules, not farm survival schedules.”

Your Strategic Choices for the Next Six Months

Based on conversations with successful operators across different scales, here’s what’s actually working.

If You’re Large (1,500+ cows)

Move aggressively on institutional contracts. You’ve got the scale schools need. Lock in that volume before competitors organize. One 5,000-cow operator in Idaho told me they’re dedicating a full-time person just to manage school RFPs through spring 2026.

If You’re Mid-Sized (500-1,000 cows)

You’re in the squeeze zone. Evaluate carefully whether institutional margins justify participation rather than premium-market opportunities. A 750-cow producer in Michigan shared their analysis: “School milk at $22 a hundredweight beats our current blend by $1.50. That’s $40,000 annually—worth pursuing but not transformational.”

Don’t sacrifice premium positioning for commodity institutional volume. If you’re already selling to local cheese plants at premiums, keep that relationship.

If You’re Small (Under 300 cows)

Institutional whole milk isn’t your play. But use the narrative shift. “Whole milk is healthy again” is powerful marketing for farmstead products. One 200-cow Vermont farm just raised its farm-store milk price by 50 cents per gallon, explicitly citing the Senate vote in its newsletter.

Focus on what you can control: direct sales, agritourism, and value-added products. Let the big operations fight over school contracts while you capture consumers wanting “real milk from local farms.”

Looking Forward: The Next Policy Battle

What worries me—and what should worry every producer—is how this pattern might repeat. Some policies constrain the industry; farms adjust or die. Then the policy reverses after structural damage.

The next fight’s already visible: methane regulations, water usage restrictions, carbon credit requirements. Each sounds reasonable in isolation. But we’ve learned what happens when agriculture loses narrative control to health or environmental advocates.

Dr. Kathleen Merrigan, who was USDA Deputy Secretary from 2009 to 2013 and now runs the Swette Center at Arizona State, advises starting to build coalitions now, before you need them. “Dairy can’t win these fights alone anymore,” she told me.

The producers surviving another decade won’t just be efficient operators. They’ll be politically savvy, coalition-aware, and positioned for multiple market channels. School whole milk is one opportunity, but it’s not salvation.

The Essential Reality

After covering this industry through 2009’s depression, 2014’s price spike, the 2015-16 collapse, and COVID’s chaos, here’s what I know: The farms still standing have survived things that should’ve killed them. They’re tougher, smarter, and more adaptable than any generation before.

Whole milk returning to schools is vindication that we were right all along. But it’s arriving to an industry that’s fundamentally restructured from the one that needed it most. The 300-cow farms that testified in 2012 about survival needs? Most are gone. The 3,000-cow operations capturing school contracts in 2026? They would’ve survived anyway.

Understanding that gap—between policy victory and structural reality—that’s what helps you make clear-eyed decisions about your operation’s future. Position for opportunities that match your scale. Build coalitions before you desperately need them. And remember that being right about policy doesn’t guarantee policy changes in time to matter.

The next six months determine who captures the institutional whole milk opportunity. But the next six years determine who’s still farming when the next policy crisis hits.

Plan accordingly, folks.

KEY TAKEAWAYS

  • Action TODAY: Call your milk handler immediately with six specific questions (provided in article)—cooperatives report 50 calls/day with early callers getting priority for $40-80K contracts
  • Size determines strategy: 1,500+ cows = pursue schools aggressively | 500-1,000 cows = evaluate if $1.50/cwt premium justifies effort | <300 cows = forget institutions, leverage whole milk vindication for premium direct sales
  • Critical 6-month window: School RFPs release January 2026 → Bids due April → Contracts lock July 1. After July, breaking in requires displacing incumbents (nearly impossible)
  • Harsh economics: The same consolidation that killed 11,000 farms now blocks 97% of survivors from accessing institutional opportunities—whole milk’s return helps those who survived despite the policy, not because of it

Complete references and supporting documentation are available upon request by contacting the editorial team at editor@thebullvine.com.

Learn More:

Join the Revolution!

Join over 30,000 successful dairy professionals who rely on Bullvine Weekly for their competitive edge. Delivered directly to your inbox each week, our exclusive industry insights help you make smarter decisions while saving precious hours every week. Never miss critical updates on milk production trends, breakthrough technologies, and profit-boosting strategies that top producers are already implementing. Subscribe now to transform your dairy operation’s efficiency and profitability—your future success is just one click away.

NewsSubscribe
First
Last
Consent
Send this to a friend