


I’ve tracked dairy markets for 30 years. Today scared me. Not because prices fell—because buyers completely disappeared.
EXECUTIVE SUMMARY: Seven sellers, zero buyers—this morning’s milk powder market freeze signals something unprecedented: not a cycle, but permanent structural change. Every major dairy region is expanding while demand evaporates, heifer shortages lock in oversupply for three years, and processors just invested $11 billion betting on a future without most current farms. Your debt-to-asset ratio determines survival: under 45% should acquire distressed neighbors; 45-60% must cut costs by 15% and find partners; and over 60% need to exit now while equity remains. The window is 90 days, not the year most assume. This isn’t temporary pain—it’s the largest dairy restructuring in modern history, and your response today determines whether you exist in 2030.

You know, I’ve been watching dairy markets for a long time, and what happened on the Chicago Mercantile Exchange this morning still has me shaking my head. Seven sellers showed up with nonfat dry milk priced at $1.14 per pound. Not a single buyer stepped forward.
Not one.
Here’s what’s interesting—in thirty years of tracking these markets, I’ve never seen anything quite like it. This isn’t just about powder prices being weak, which we’ve all lived through before. What we’re looking at is something deeper. For an industry built on the assumption that markets always clear, we just watched a market refuse to function. And if you’re milking cows anywhere in North America right now, that silence from the trading floor should be telling you something important about what’s coming.
Mark Stephenson, at the University of Wisconsin’s Center for Dairy Profitability, has been modeling these markets since the 1980s. When we talked yesterday, he said something that really stuck with me: “This is more like a structural market shift than the typical cycles we’re used to riding out.” Coming from someone who’s advised USDA on pricing policy for decades, that’s… well, that’s worth paying attention to.
Four Forces Creating Something We Haven’t Seen Before
Let me walk you through what’s actually happening out there. It’s the combination that’s unprecedented, not any single factor.
Everyone’s Making More Milk at the Same Time

So the latest USDA National Agricultural Statistics Service report shows U.S. milk production jumped 3.3% year-over-year in August—we’re talking 18.8 billion pounds across the 24 major states. We’ve added 172,000 cows to the national herd. Production per cow averaged 2,068 pounds, which is 28 pounds above last August.
Now, normally, when we expand, somebody else contracts. That’s been the pattern, right? But here’s what caught my attention: New Zealand’s September milk collection hit 2.67 million tonnes, up 2.5%, with milk solids jumping 3.4% year-over-year. The Dairy Companies Association of New Zealand tracks all this. Argentina’s production? Their Ministry of Agriculture reports it rose 9.9% in September. The Netherlands is up 6.7% according to ZuivelNL. Europe’s August production across major exporters increased by 3.1%, according to the European Milk Board.
RaboBank’s latest global dairy quarterly—and they’ve been tracking this for decades—points out something we haven’t seen before: synchronized global expansion. In past cycles, when the U.S. expanded, Europe generally contracted. When New Zealand surged, Argentina pulled back. That regional offset gave us a natural market balance. But everyone is expanding together? That’s new territory.
And it’s not just weather luck either. Ireland’s dealing with one of their wettest autumns in years, according to Met Éireann, yet they’re still producing above year-ago levels. Australia’s coming off drought, expecting La Niña rains, and they’re expanding. Even producers in the Southeast U.S.—where heat stress usually limits summer production—are reporting gains. Everyone’s betting on the same hand, which… well, you know how that usually works out.
The Heifer Problem Nobody Wants to Talk About
According to the USDA’s January 2025 Cattle inventory report, we’re sitting at 3.914 million dairy heifers—that’s 500 pounds and over, ready to enter the milking string. Lowest since 1978.
Let that sink in for a minute.
What’s fascinating is how we got here. The National Association of Animal Breeders’ data shows beef semen sales to dairy farms reached 7.9 million units in 2023—that’s 31% of all semen sales to dairy farmers. CattleFax, which tracks these crossbred markets pretty closely, estimates we went from just 50,000 beef-dairy crossbred calves in 2014 to 3.22 million in 2024.
I get it—when Holstein bull calves are bringing $50 to $150 at local auctions and crossbreds are fetching $800 to $1,000, the math’s pretty simple. But here’s the kicker: even if milk hits $25 per hundredweight tomorrow, University of Wisconsin dairy management specialists show meaningful herd expansion now takes a minimum of three years. The old supply response mechanism that we all grew up with? It’s broken.
What I’ve found, talking to producers across Wisconsin and the Pacific Northwest, is that they’ve been breeding for beef for three, four years now. Even if they wanted to expand, where are the heifers coming from? And at what price? Local sale barns that used to have dozens of springing heifers might have three or four. Maybe.
Processors Are Betting Big While Farmers Bleed

This one really gets me. While we’re looking at Class IV at $13.75, against production costs, 2025 benchmarking data for Northeastern operations puts around $14.50 per hundredweight. The International Dairy Foods Association announced more than $11 billion flowing into 53 new or expanded dairy processing facilities across 19 states through 2028.
Michael Dykes, IDFA’s President and CEO, isn’t shy about it: “Investment follows demand. The scale of what’s happening is phenomenal.” Joe Doud, who was USDA’s Chief Economist under Secretary Perdue, goes even further—he calls this $10 billion investment surge unprecedented in U.S. agricultural history.
What’s happening here? These processors aren’t looking at October 2025 CME spot prices. They’re positioning for 2030 and beyond, based on the Food and Agriculture Organization’s 2024 Agricultural Outlook, which projects 1.8% annual global protein demand growth through 2034. Meanwhile, we’re trying to figure out how to make November’s feed payment.
You’ve got fairlife building a $650 million facility near Rochester, New York. Leprino Foods is constructing a $1 billion plant in Lubbock, Texas. They’re not stupid—they see something from their boardrooms that maybe we’re missing from the milk house.
China Changed the Game and Nobody Noticed
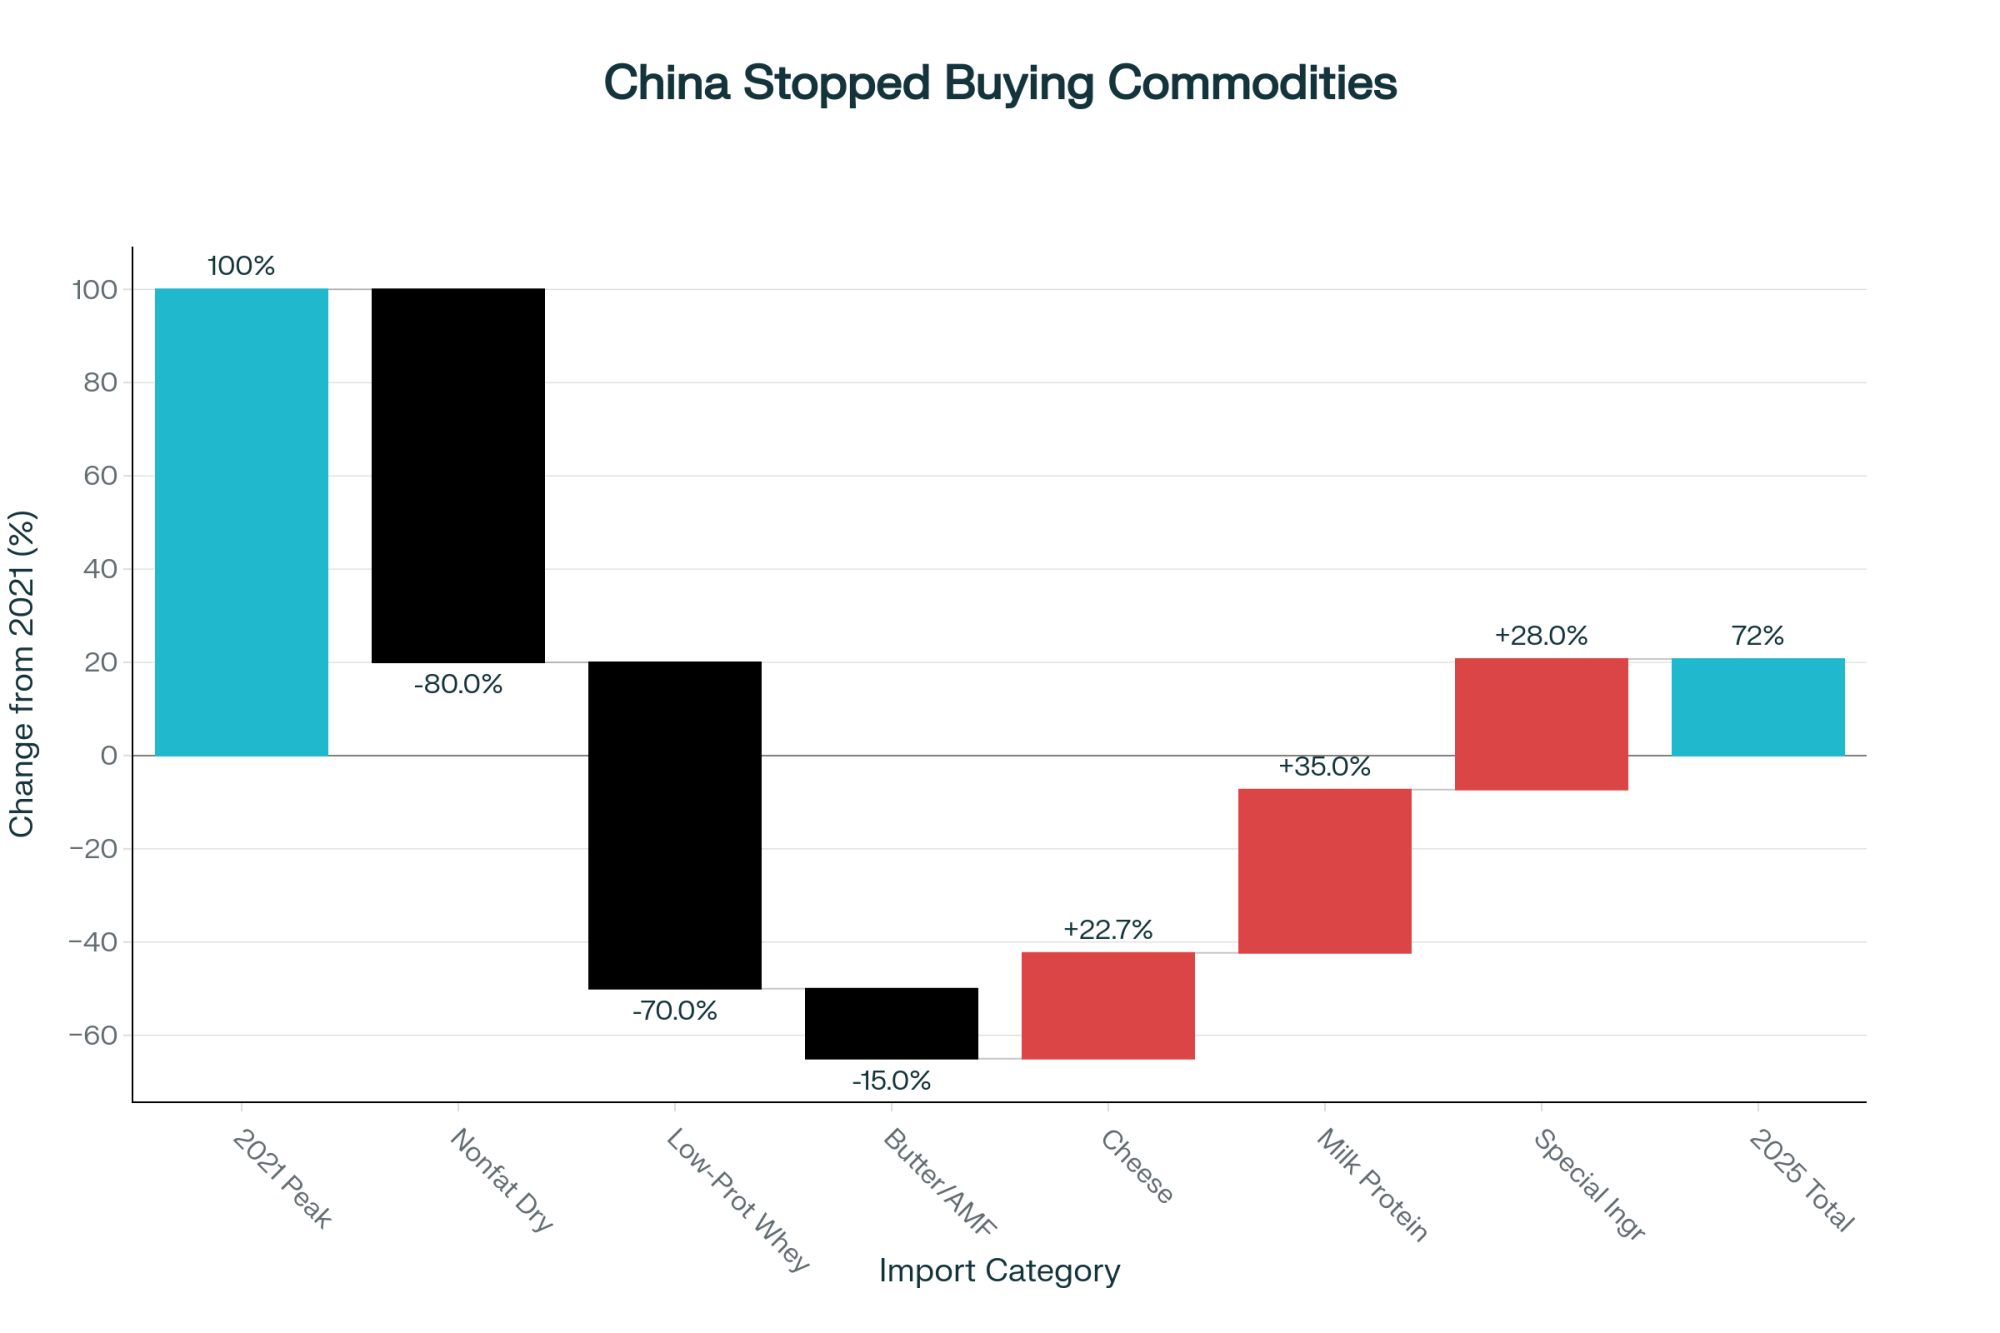
U.S. Dairy Export Council data from May 2025 shows our nonfat dry milk exports to China are down nearly 80%. Low-protein whey? Down 70%. Through July, China’s General Administration of Customs reports total dairy imports reached 1.77 million tonnes—up 6% year-over-year but still 28% below the 2021 peak.
But here’s what I find really interesting when you dig into the trade data: they’re buying cheese—up 22.7%—and specialized ingredients like milk protein isolates while avoiding commodity powders. China’s shifting from volume to value, and we built all this powder capacity for demand that’s evaporating.
Texas A&M’s Agricultural Economics Department has been tracking this shift. Their analysis suggests that China’s building domestic capacity for elemental powders but is importing sophisticated products that its plants can’t make efficiently. It’s looking like a permanent shift, not a temporary one.
Understanding Your Real Options
| Debt-to-Asset Ratio | Your Reality | Action Required | Revenue Opportunities | Timeline | Equity at Stake | Monthly Impact (per 100 cows) |
| Under 45% | Well-Capitalized | Strategic Expansion | Forward contracts: $1.00-1.50/cwt premium Acquire neighbors at 20-30% discount | 90-120 days to lock contracts | Expansion at favorable terms | +$2,400 with premium contracts |
| 45-60% | Mid-Tier Squeeze | Cost Reduction + Partners | Dairy Revenue Protection 15% cost cuts required | 60 days to implement cuts | Survival: maintain current equity | -$750 current bleeding |
| Over 60% | Distressed | Strategic Exit NOW | Exit while preserving equity | 30-60 days before options vanish | Proactive: 60-75% preserved Forced: 40-45% preserved | -$1,500+ and accelerating |
After talking with extension specialists and lenders across the country this week, what’s becoming clear is that waiting for “normal” isn’t a strategy anymore. The math doesn’t support it, and neither does the calendar.
Path 1: Strategic Expansion
For operations with debt-to-asset ratios below 45% and strong cash flow, this downturn presents acquisition opportunities. Farm Credit Services analysis shows distressed sales starting at 20-30% below replacement cost. But—and this is important—these deals require creativity.
What’s working, based on case studies from the University of Wisconsin’s Center for Dairy Profitability and Cornell’s PRO-DAIRY program, is seller-financed arrangements that preserve more equity for the seller than foreclosure would. You might offer 20% below market value, but with financing at reasonable rates over seven years, maybe include a management position. The seller preserves dignity and more equity, and you gain capacity at favorable terms.
This only works if you’ve got the balance sheet for it. Operations in this category can also negotiate forward supply commitments with processors building new capacity. We’re seeing premiums of $1.00 to $1.50 per hundredweight for multi-year contracts in some regions.
I’ve noticed that Southeast operations are particularly successful with this approach. One producer milking about 1,200 cows in Georgia just locked in a seven-year contract with a new processor at $1.35 over Class III. “Yeah, we might miss some price spikes,” they mentioned, “but I can budget, I can sleep at night, and I know I’ll still be here in 2030.”
Path 2: Find Your Niche
Penn State Extension has documented several successful transitions to organic production with on-farm processing. The numbers are tough initially—certification costs, learning curves, building customer bases. But producers who’ve made it through report premiums of $20 or more per hundredweight over conventional milk.
The catch? You need capital. Penn State’s business planning specialists say successful transitions require an upfront investment of $150,000 to $200,000 and 18 to 24 months to achieve positive cash flow. Plus, you need to be within a reasonable distance of affluent consumers.
Some Texas operations have gone a different route—100% grass-fed, certified by the American Grassfed Association, and selling direct to restaurants and farmers’ markets. It might be 40% of the previous volume, but at significantly higher prices. Feed bills drop dramatically—just hay in drought months.
In Minnesota, some mid-sized operations—we’re talking 400 to 500 cows—have locked in contracts with local cheese plants specializing in European-style aged cheeses. These plants need consistent butterfat over 4.0%, which Jersey and crossbred herds can deliver. The premium’s worth it.
What’s encouraging is that robotic milking systems are becoming viable for these mid-tier operations too. Michigan State University research shows that operations with 180-240 cows can justify two robots, especially when labor’s tight. The capital cost hurts—$150,000 to $200,000 per robot—but some producers are finding it lets them stay competitive without massive expansion.
Path 3: Strategic Exit
This is the hardest conversation, but it needs to be had. Farm Credit specialists and agricultural finance research consistently indicates that proactive sales generally preserve 60-75% of equity compared to 40-45% in forced liquidation scenarios.
What’s encouraging is that some larger neighbors need experienced managers and are offering employment as part of acquisition deals. You might sell your operation but stay on at $65,000 to $75,000 plus housing for two years. It’s not ideal, but it beats losing everything.
There’s also the generational transfer angle nobody likes discussing. If the next generation isn’t interested or capable, forcing succession can destroy both farm equity and family relationships. Sometimes the strategic exit is selling to a neighbor while you can still set terms, rather than leaving an impossible burden for your kids.
How Cooperatives Navigate Conflicting Interests
One thing that’s really striking me lately is how cooperative dynamics change during consolidation. That traditional one-member, one-vote structure assumes everyone’s interests align. But what happens when they don’t?
Most folks don’t realize how co-op equity actually works. Those capital retains—CoBank’s Knowledge Exchange program analysis puts them at $0.20 to $0.40 per hundredweight, typically—accumulate over decades. But here’s what nobody tells you: redemption timelines are stretching to 15-25 years as co-ops prioritize expansion over paying out equity.
Run the math with me. A 500-cow operation producing 11,000 pounds per cow monthly contributes roughly $118,800 annually in retained patronage at $0.30 per hundredweight average. Over 20 years, that’s $2.4 million accumulated. But with 2.5% annual inflation per Federal Reserve data, the real purchasing power of that equity drops nearly 40% over a 20-year redemption period.
Co-op board dynamics are shifting, too. The new plants being built require 4 million pounds per day. A 300-cow operation produces maybe 20,000 pounds. Operations with 5,000 cows? They’re producing 325,000. The voting structure might be democratic, but economic realities create different levels of influence.
Regional Realities: Where This Hits Hardest
Looking at how this plays out across different dairy regions, the impacts vary dramatically based on existing farm structure and local economics.
Wisconsin’s Challenge
Based on historical consolidation patterns analyzed by the University of Wisconsin-Madison’s Program on Agricultural Technology Studies, Wisconsin could see closure rates potentially affecting 30-40% of remaining operations over the next five years if current trends continue.
Wisconsin Agricultural Statistics Service data shows the average Wisconsin farm has 234 cows producing 24,883 pounds annually. They’re not inefficient—they’re just caught in scale economics that no longer work. Every service business in these rural towns depends on dairy. Lose the farms, and you lose the schools, the equipment dealers, the feed mills… everything that makes these communities work.
California’s Water-Driven Consolidation
Tulare County’s average herd size is already around 1,840 cows, according to California Department of Food and Agriculture data. Even here, consolidation continues. But it’s different—it’s about water more than milk prices.
Dr. Jennifer Heguy, who’s the UC Cooperative Extension Dairy Advisor for Merced, Stanislaus, and San Joaquin counties, points out that water rights are becoming more valuable than the dairy infrastructure itself. The implementation of the Sustainable Groundwater Management Act means that operations without secure water face impossible decisions. Farms are merging primarily to secure water portfolios—one farm with senior water rights can support three without.
Pennsylvania’s Plain Community Crisis
This situation is particularly complex. Lancaster County has about 1,480 dairy farms, averaging 65 cows each, most run by Amish and Mennonite families. Penn State Extension research indicates these smaller operations face severe economic pressure at current milk prices.
For Plain communities, the implications go way beyond economics. Farming isn’t just an occupation—it’s integral to their way of life and faith practice. When families can’t farm, they often have to relocate to areas with available land, which can mean leaving established communities entirely.
What Successful Producers Are Doing Right Now
| Category | Value ($/cwt or as noted) | Implementation Timeline | Difficulty Level |
| Class IV Milk Price (Oct 2025) | $13.75 | Current market | Given |
| Production Cost (Northeastern avg) | $14.50 | Fixed cost | Given |
| Current Loss per cwt | ($0.75) | Immediate issue | Crisis |
| REVENUE OPPORTUNITIES: | |||
| Forward Contract Premium | +$1.00 to $1.50 | 90-120 days to lock | Medium – negotiation required |
| Carbon Credits (per cow/year) | $400-450 total | 6-12 months to implement | High – capital intensive |
| Component Premium (>3.3% protein) | +$0.30 to $0.50 | 30-60 days to optimize | Low – nutritionist consult |
| Dairy Margin Coverage ($9.50) | Coverage varies | Immediate enrollment | Low – paperwork only |
| POTENTIAL MONTHLY IMPACT (300 cows): | |||
| Base milk revenue (20,000 lbs/cow) | $82,500 | Baseline calculation | |
| Forward contract bonus | $6,000 | If contracted by Jan 31 | |
| Carbon credits (monthly) | $1,125 | Annual avg, 6mo lag | |
| Component premiums | $1,800 | Ration adjustment 60 days | |
| DMC protection value | $1,200 | Policy dependent | |
| Total potential monthly revenue | $92,625 | With all strategies | |
| Current monthly cost | $87,000 | 300 cow baseline | |
| Net monthly margin (best case) | $5,625 | All strategies deployed | |
| Net monthly margin (current) | ($4,500) | No action taken |
Here’s what’s actually working for farmers navigating this successfully—and I mean actually working, not theoretical strategies.
Financial scenario planning has become essential. Running spreadsheets with milk at $12, $14, $16 for the next 24 months shows you exactly when you hit critical triggers. As many producers are learning, hope isn’t a business plan.
The smart ones are approaching lenders proactively. If you know Class III staying below $16 through March means you’ll need to restructure, start that conversation now when you still have options. Waiting until February when you’re forced into it? That’s a different conversation entirely.
Carbon credits are becoming real money, too. Programs like those from Indigo Agriculture, implementing cover crops and manure management changes, can generate $400 to $450 per cow annually once fully implemented. On 600 cows, that’s $250,000—potentially the difference between surviving and not.
Don’t forget about Dairy Margin Coverage either. The program’s been recalibrated, and at current feed costs versus milk prices, even the $9.50 coverage level can provide meaningful protection. It’s not a complete solution, but combined with Dairy Revenue Protection for Class IV producers, it’s essential risk management.
Feed procurement matters enormously right now. With December corn at $4.28 per bushel on the Chicago Board of Trade, locking in winter needs makes sense. Nutritionists working with Pennsylvania dairies report clients who contracted 70% of their corn silage needs back in August are paying $10 to $12 less per ton than those buying now.
Component premiums deserve attention, too. At 3.3% protein or higher, most processors pay premiums of $0.30 to $0.50 per hundredweight, according to Federal Milk Market Administrator reports. Dr. Mike Hutjens, professor emeritus at the University of Illinois, has shown that reformulating rations to push protein might cost an extra $0.75 per cow per day but return $1.20 in premiums. That’s $165 net per cow annually.

Key Takeaways for Different Operations
Let me break this down by where you’re sitting financially, because your situation really does determine your options.
If you’re well-capitalized with a debt-to-asset ratio under 45%:
Now’s the time to move strategically. Forward contract with processors building new capacity. Those $1.00 to $1.50 per hundredweight premiums for five-year commitments can make a huge difference on cash flow. Consider geographic expansion across multiple sites rather than building massive single locations. Environmental permits, community relations, and disease risk all favor distributed operations under single management.
If you’re mid-tier with debt-to-asset between 45-60%:
You need immediate cost reduction—we’re talking 10-15%—to weather what’s coming. Dairy Revenue Protection isn’t optional anymore for Class IV producers. That coverage might cost $0.48 per hundredweight, but when you’re already losing $0.75, it’s survival insurance. Strategic partnerships might preserve independence better than going alone. Three 400-cow dairies sharing equipment, buying feed together, and negotiating milk premiums collectively have more leverage than individually.
If you’re stressed with a debt-to-asset ratio over 60%:
The hard truth? Make the difficult calls this week, not next month. Every week you wait, your equity erodes and options narrow. Agricultural financial counselors through Extension services or organizations like Farm Aid can help navigate this.
Looking Ahead: What This Industry Becomes
The seven NDM sellers facing zero buyers this morning wasn’t just a market anomaly. It was a signal that fundamental assumptions about dairy economics have shifted.
What’s becoming clear is that the industry emerging from this won’t look like the one we entered. It’ll be more concentrated, more integrated, more capital-intensive. That’s not a judgment—it’s just what the economics are driving toward.
Based on current trends and academic projections, we could see the U.S. dairy farm count drop significantly by 2030. The survivors won’t necessarily be the best farmers—they’ll be the ones who recognized structural change early and positioned accordingly. Some by expanding strategically, others by finding profitable niches, and yes, some by exiting while they still had equity to preserve.
I’ve been through several market cycles—’99, ’09, ’15. This feels different. Those were painful but temporary. This is structural—fundamental changes in how the industry organizes itself.
Your window for strategic decision-making? Based on what lenders are saying, it’s probably 90 to 120 days, not the year or more, most folks assume. Once you hit certain financial triggers—debt service coverage below 1.1, current ratio under 1.0—decisions start getting made for you rather than by you.
Understanding these dynamics—and more importantly, acting on them—will determine who’s still milking cows in 2030. We started today with seven sellers and zero buyers. That’s not the market failing. That’s the market telling us something important.
Question is, are we listening?
KEY TAKEAWAYS:
- Market Breaking Point: October 31’s seven sellers/zero buyers at $1.14/lb wasn’t a bad day—it was the market refusing to function, signaling permanent structural change, not temporary correction
- Your 90-Day Action Plan by Debt Level:
- Under 45%: Acquire distressed neighbors at a 20-30% discount with seller financing
- 45-60%: Cut costs 15%, add Dairy Revenue Protection, form strategic partnerships
- Over 60%: Exit now, preserving 60-75% equity (vs 40% in forced liquidation)
- Why This Time Is Different: Heifer inventory at 1978 lows means supply can’t adjust for 3+ years, while every major region expanded simultaneously—breaking the historic balance mechanism
- Survival Revenue Streams: Forward contracts with new processors ($1.00-1.50/cwt premium), carbon credits ($400-450/cow/year), protein premiums ($165/cow/year), Dairy Margin Coverage at $9.50
- The Bottom Line: This isn’t a cycle—it’s the largest restructuring in modern dairy history. Decisions you make by January 31, 2026, determine if you exist in 2030.
Complete references and supporting documentation are available upon request by contacting the editorial team at editor@thebullvine.com.
Learn More:
- Global Dairy Market Trends 2025: European Decline, US Expansion Reshaping Industry Landscape – While the main article reveals the market’s breaking point, this strategic analysis provides the global context. It details the opposing forces of EU contraction and US expansion, giving producers critical insight into future global trade flows and price pressures.
- Robotic Milking Revolution: Why Modern Dairy Farms Are Choosing Automation in 2025 – For producers considering the “Find Your Niche” path, this piece offers a tactical deep-dive. It breaks down the ROI on automation, providing hard data on labor reduction, production gains, and health monitoring benefits that justify the high capital cost.
- The Future of Dairy Farming: Embracing Automation, AI, and Sustainability in 2025 – This article looks at the next wave of innovation beyond the immediate crisis. It explores emerging solutions like whole-life monitoring and AI-driven management, providing a forward-looking perspective for operations planning their long-term competitive strategy and technological evolution.
 Join the Revolution!
 Join the Revolution!
Join over 30,000 successful dairy professionals who rely on Bullvine Weekly for their competitive edge. Delivered directly to your inbox each week, our exclusive industry insights help you make smarter decisions while saving precious hours every week. Never miss critical updates on milk production trends, breakthrough technologies, and profit-boosting strategies that top producers are already implementing. Subscribe now to transform your dairy operation’s efficiency and profitability—your future success is just one click away.


