Archive for FMMO modernization

GT Thompson’s 2026 Farm Bill Math: DMC Pays Your 200‑Cow Dairy $1,800, Make Allowances Cut $42,240 – a 23 to 1 Hit

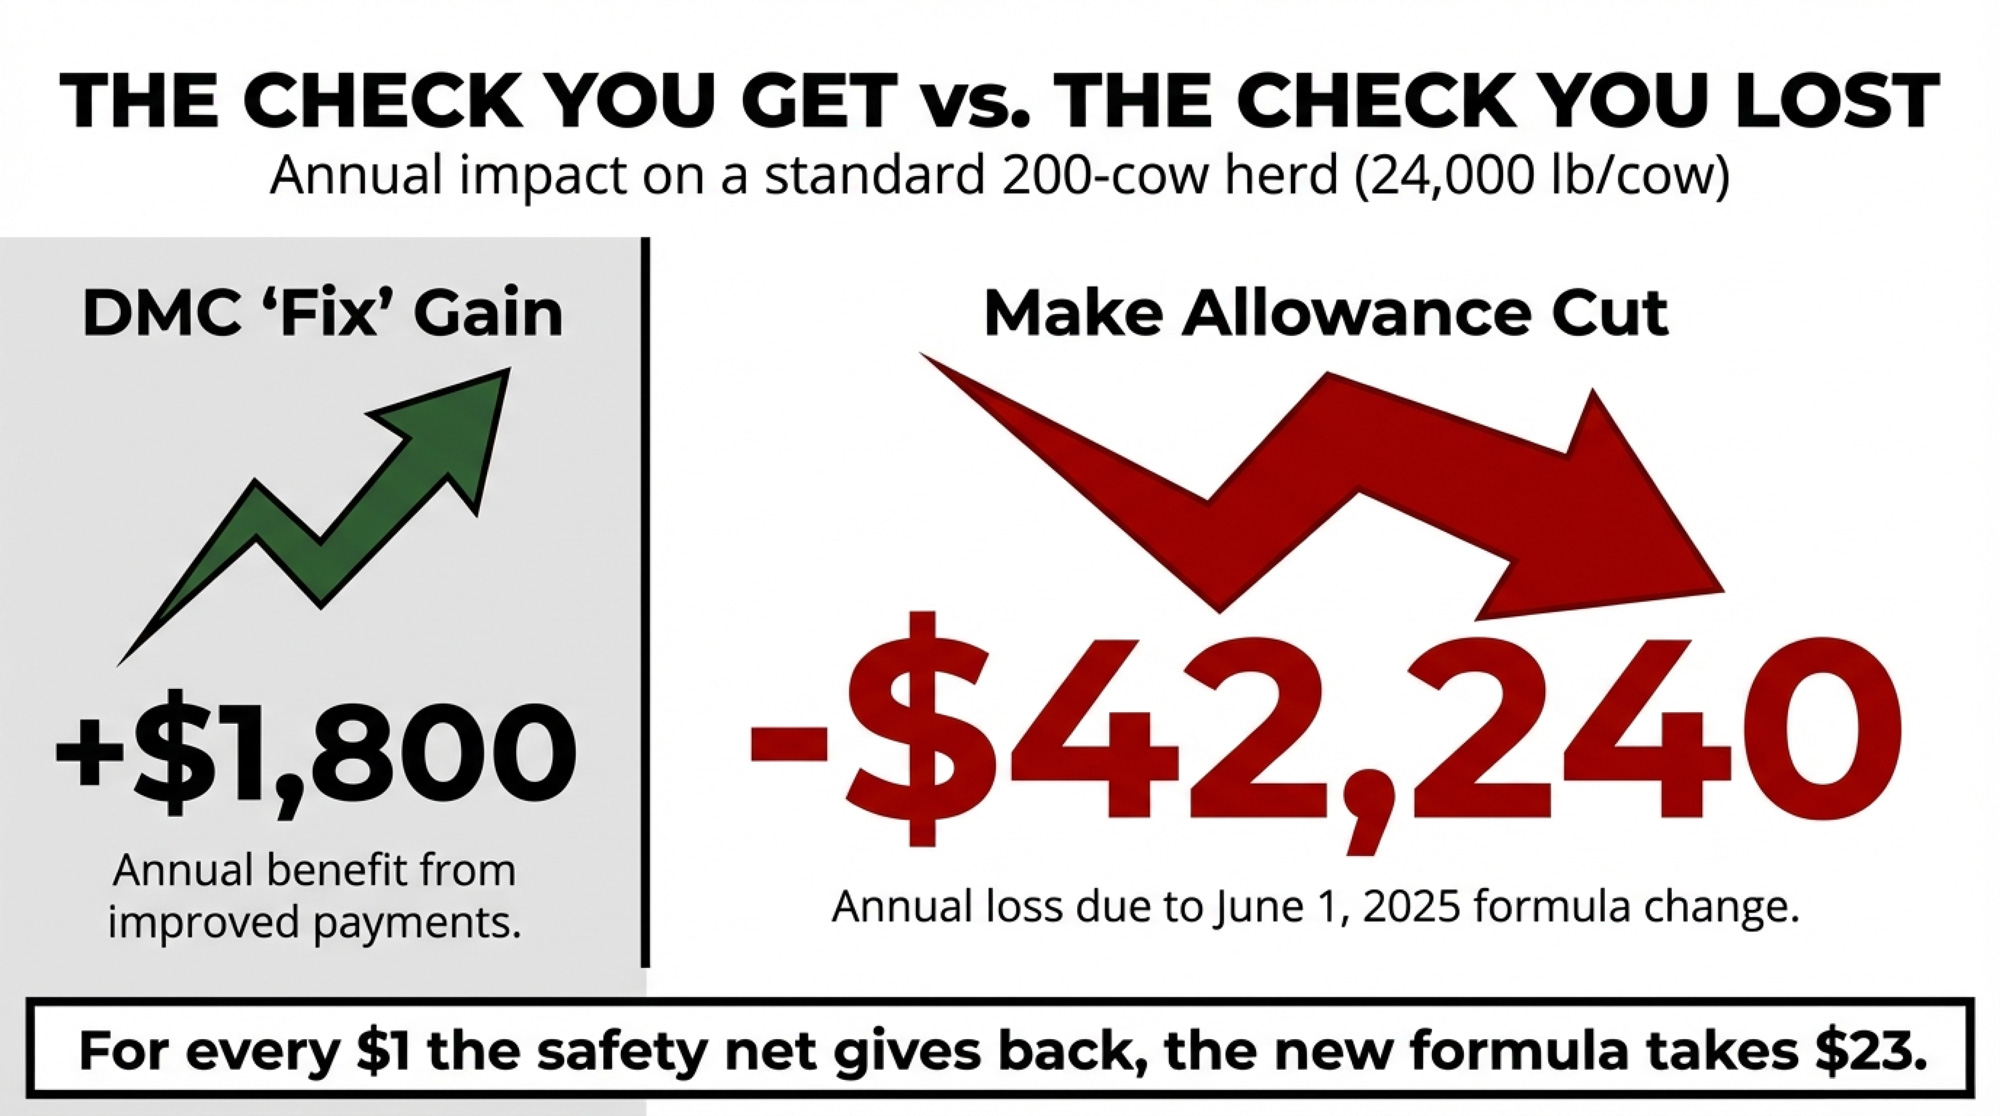
Your 200-cow dairy gets $1,800 from the 2026 Farm Bill — and loses $42,240 to make allowances. Ready to see the 23‑to‑1 hit hiding in your milk check?

Executive Summary: The House Agriculture Committee’s 2026 Farm Bill draft — released February 13 by Chairman GT Thompson — gives a 200-cow dairy roughly $1,800 a year in improved DMC payments. Make allowance increases that took effect on June 1, 2025, have already cost that same herd $42,240 annually. That’s a 23-to-1 gap, and AFBF economist Danny Munch has tracked $337 million in pool losses from the formula change alone in its first 90 days. The bill’s sharpest tool is Section 1006: permanent mandatory processor cost surveys — the only mechanism that could eventually push make allowances back down. But the FMMO hearing process has never reduced make allowances, and Munch’s own timeline puts the earliest possible relief at 2028, with a more realistic read closer to 2031. Markup starts on February 23, DMC enrollment closes on February 26, and Lolly Lesher at Way-Har Farms in Pennsylvania — who testified before the committee — is one of the producers watching to see whether Section 1006 gets real teeth or stays symbolic. Two deadlines, one structural gap, and a formula that’s never been adjusted in the farmer’s direction.

2026 Farm Bill math

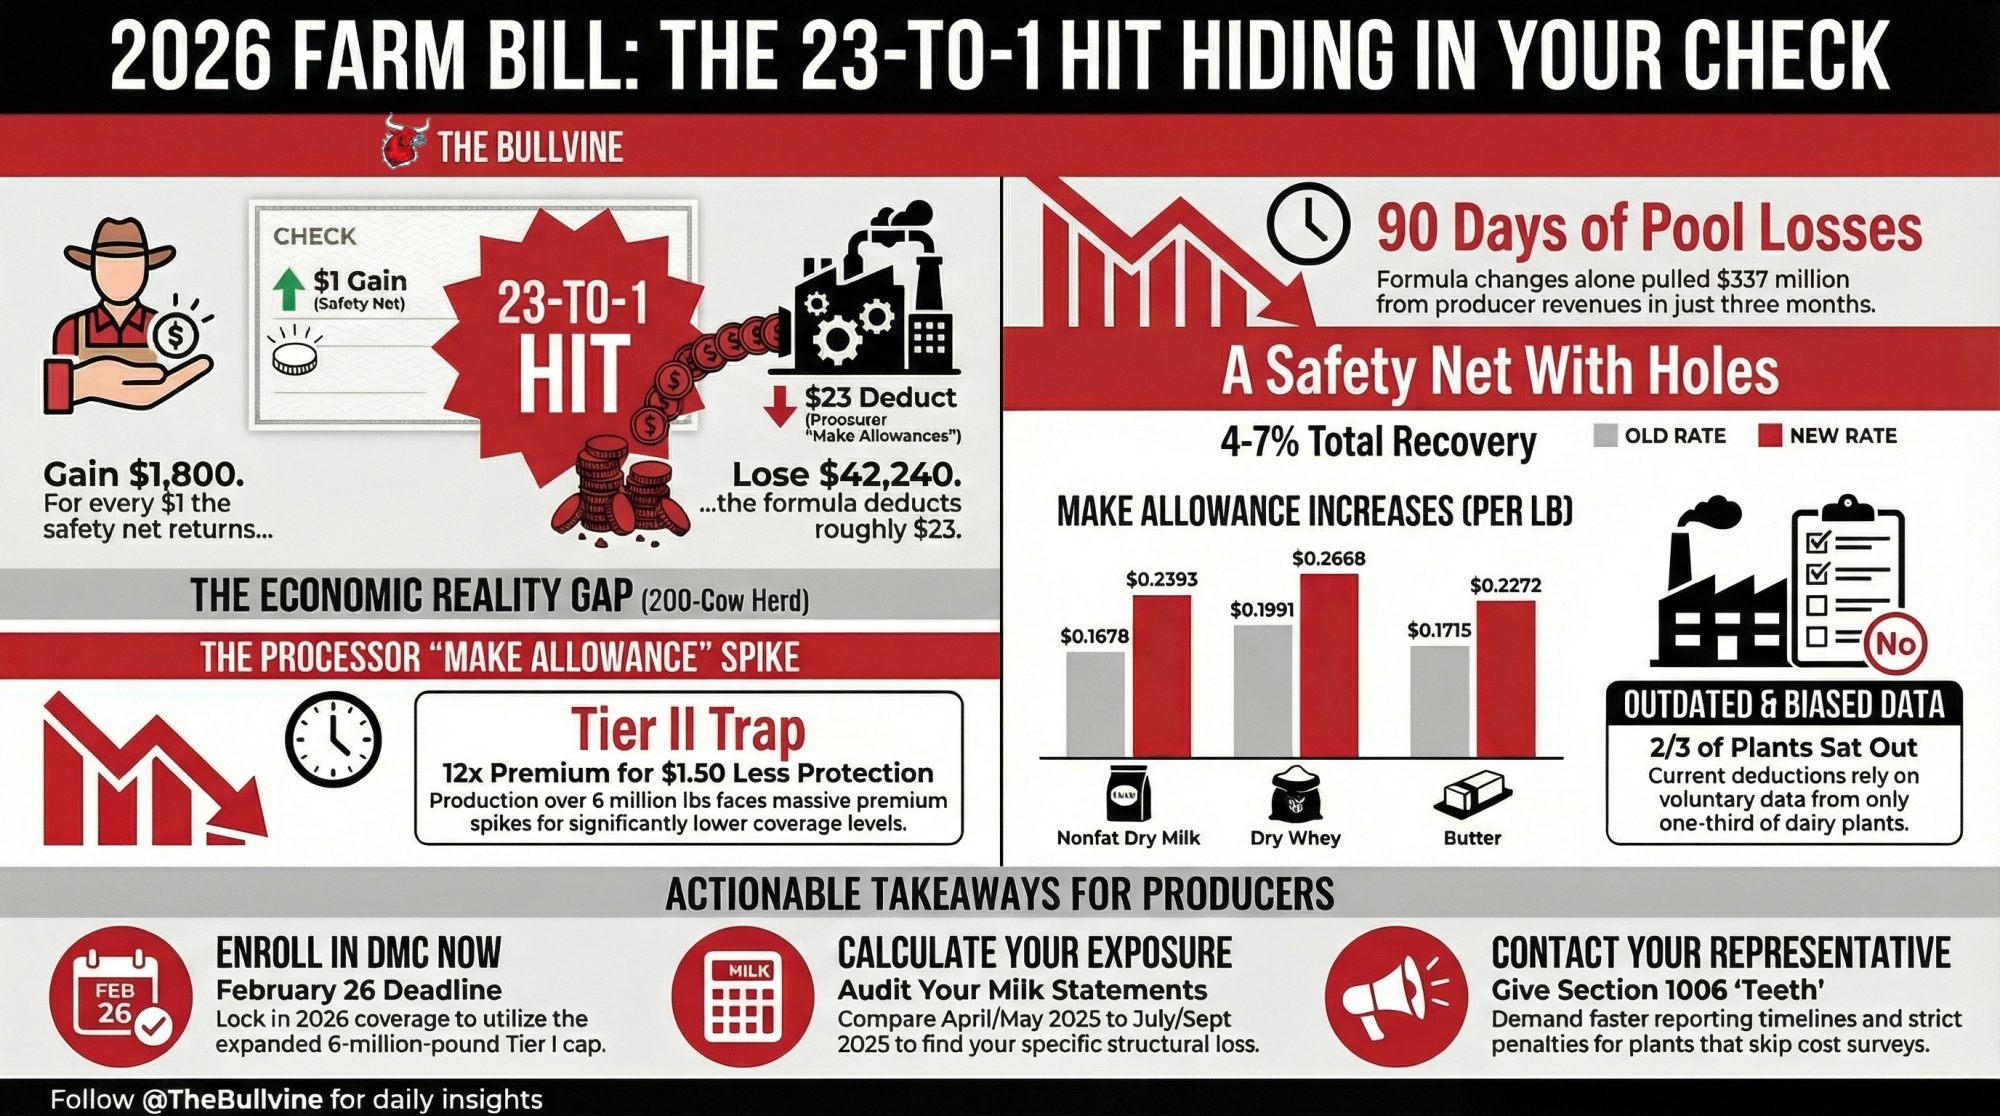
The House Agriculture Committee’s 2026 Farm Bill draft improves your Dairy Margin Coverage payment by roughly $1,800 a year on a 200-cow herd. The make allowance increases that took effect June 1, 2025, have already cost that same herd about $42,240 a year. That’s a 23-to-1 gap. For every dollar the safety net gives back, the formula takes twenty-three.

Those make allowance increases pulled $337 million out of producer pool revenues in their first 90 days, per AFBF’s September 2025 Market Intel analysis — not from a market crash, but from the formula change alone. It hit every FMMO-pooled dairy in America the same month Lolly Lesher at Way-Har Farms in Bernville, Pennsylvania, was bottling milk and scooping 90 flavors of ice cream alongside her milking herd of about 260 cows.

Pennsylvania dairy farmer Lolly Lesher (right), owner of the 300-cow Way-Har Farms in Berks County, testified before the House Agriculture Committee on behalf of NMPF and Dairy Farmers of America on June 22, 2022 — urging Congress to update DMC production history limits and fix the Class I mover formula she said cost producers over $750 million. Beside her (left to right): University of Minnesota ag economist Marin Bozic, Organic Valley VP of Membership Travis Forgues, and Leprino Foods CEO Mike Durkin. Photo: House Agriculture Committee / Flickr

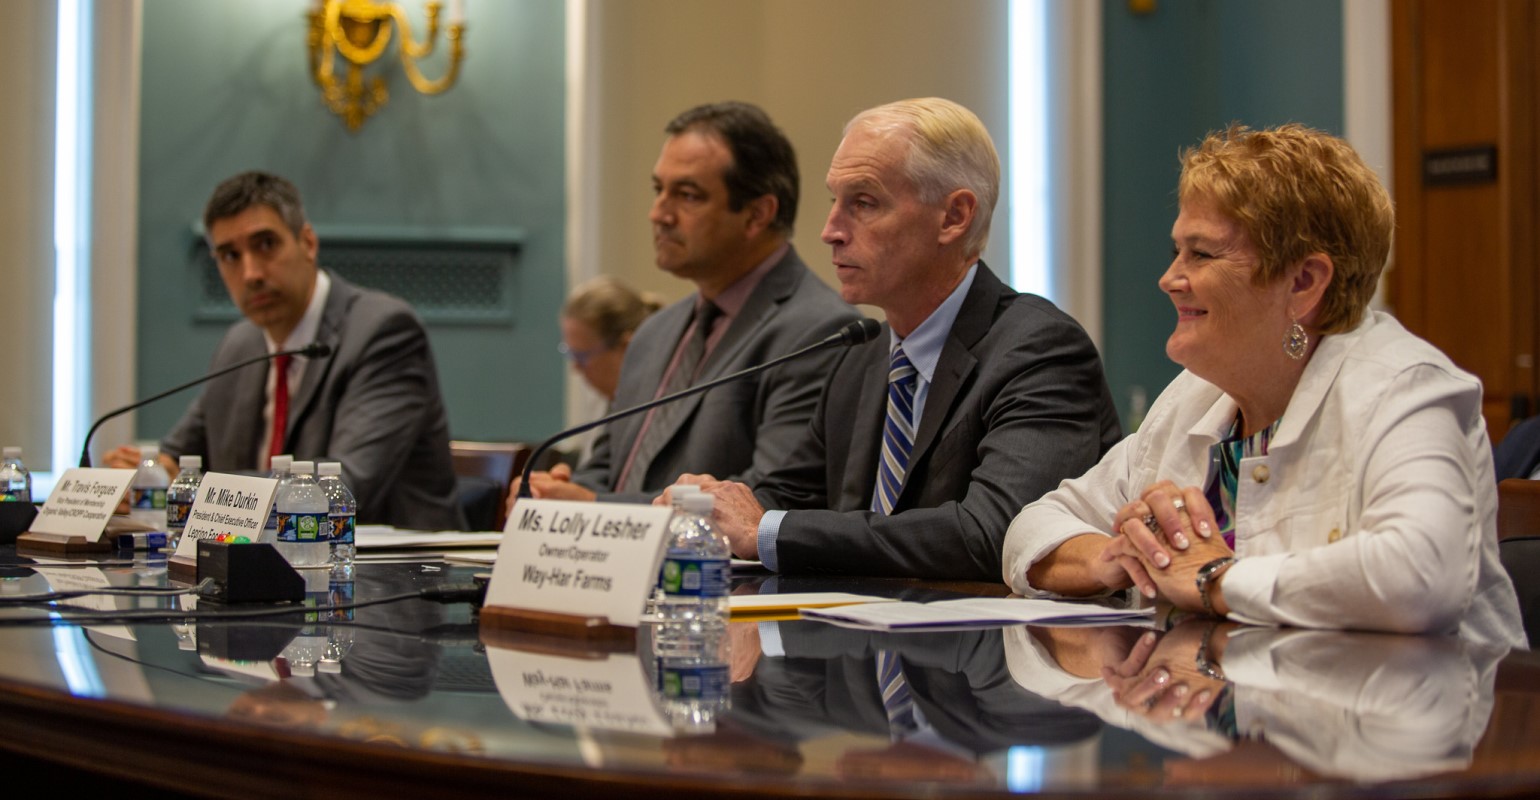
Lesher has talked publicly about what pricing instability means for multi-generational dairy families. She and her family expanded from 80 cows to over 200 when her daughter returned to the operation — because, as Lesher has discussed on the Lancaster Farming FarmHouse podcast, the economics of an 80-cow operation couldn’t stretch to support multiple family members coming back to the farm. “When milk prices flip-flop up and down so much,” she told the podcast, “you need to be well-versed in planning and how to handle the debt and the payments.” That planning just got harder. And the bill that’s supposed to help? It recovers somewhere between 4 and 7 cents of every dollar the formula already took.

Where Did $337 Million Go?

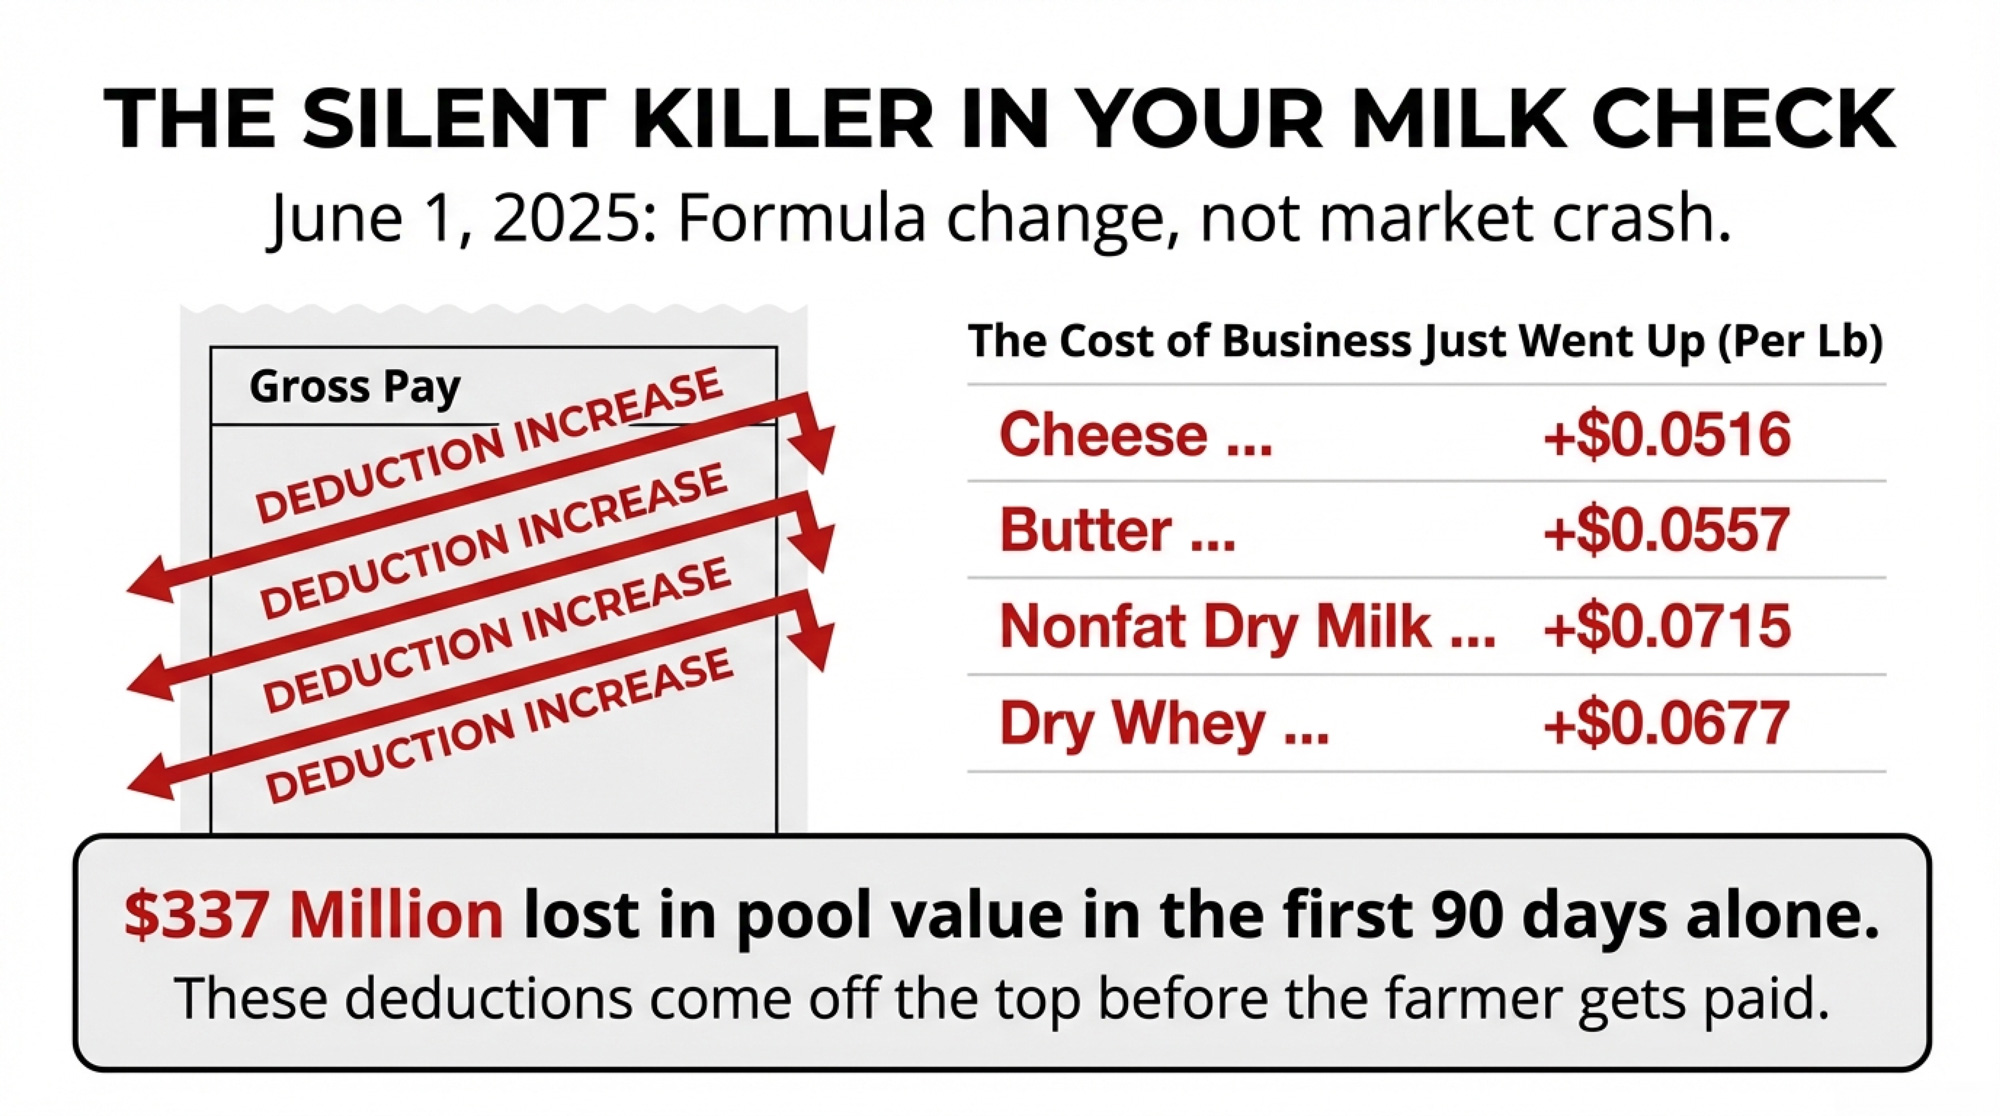
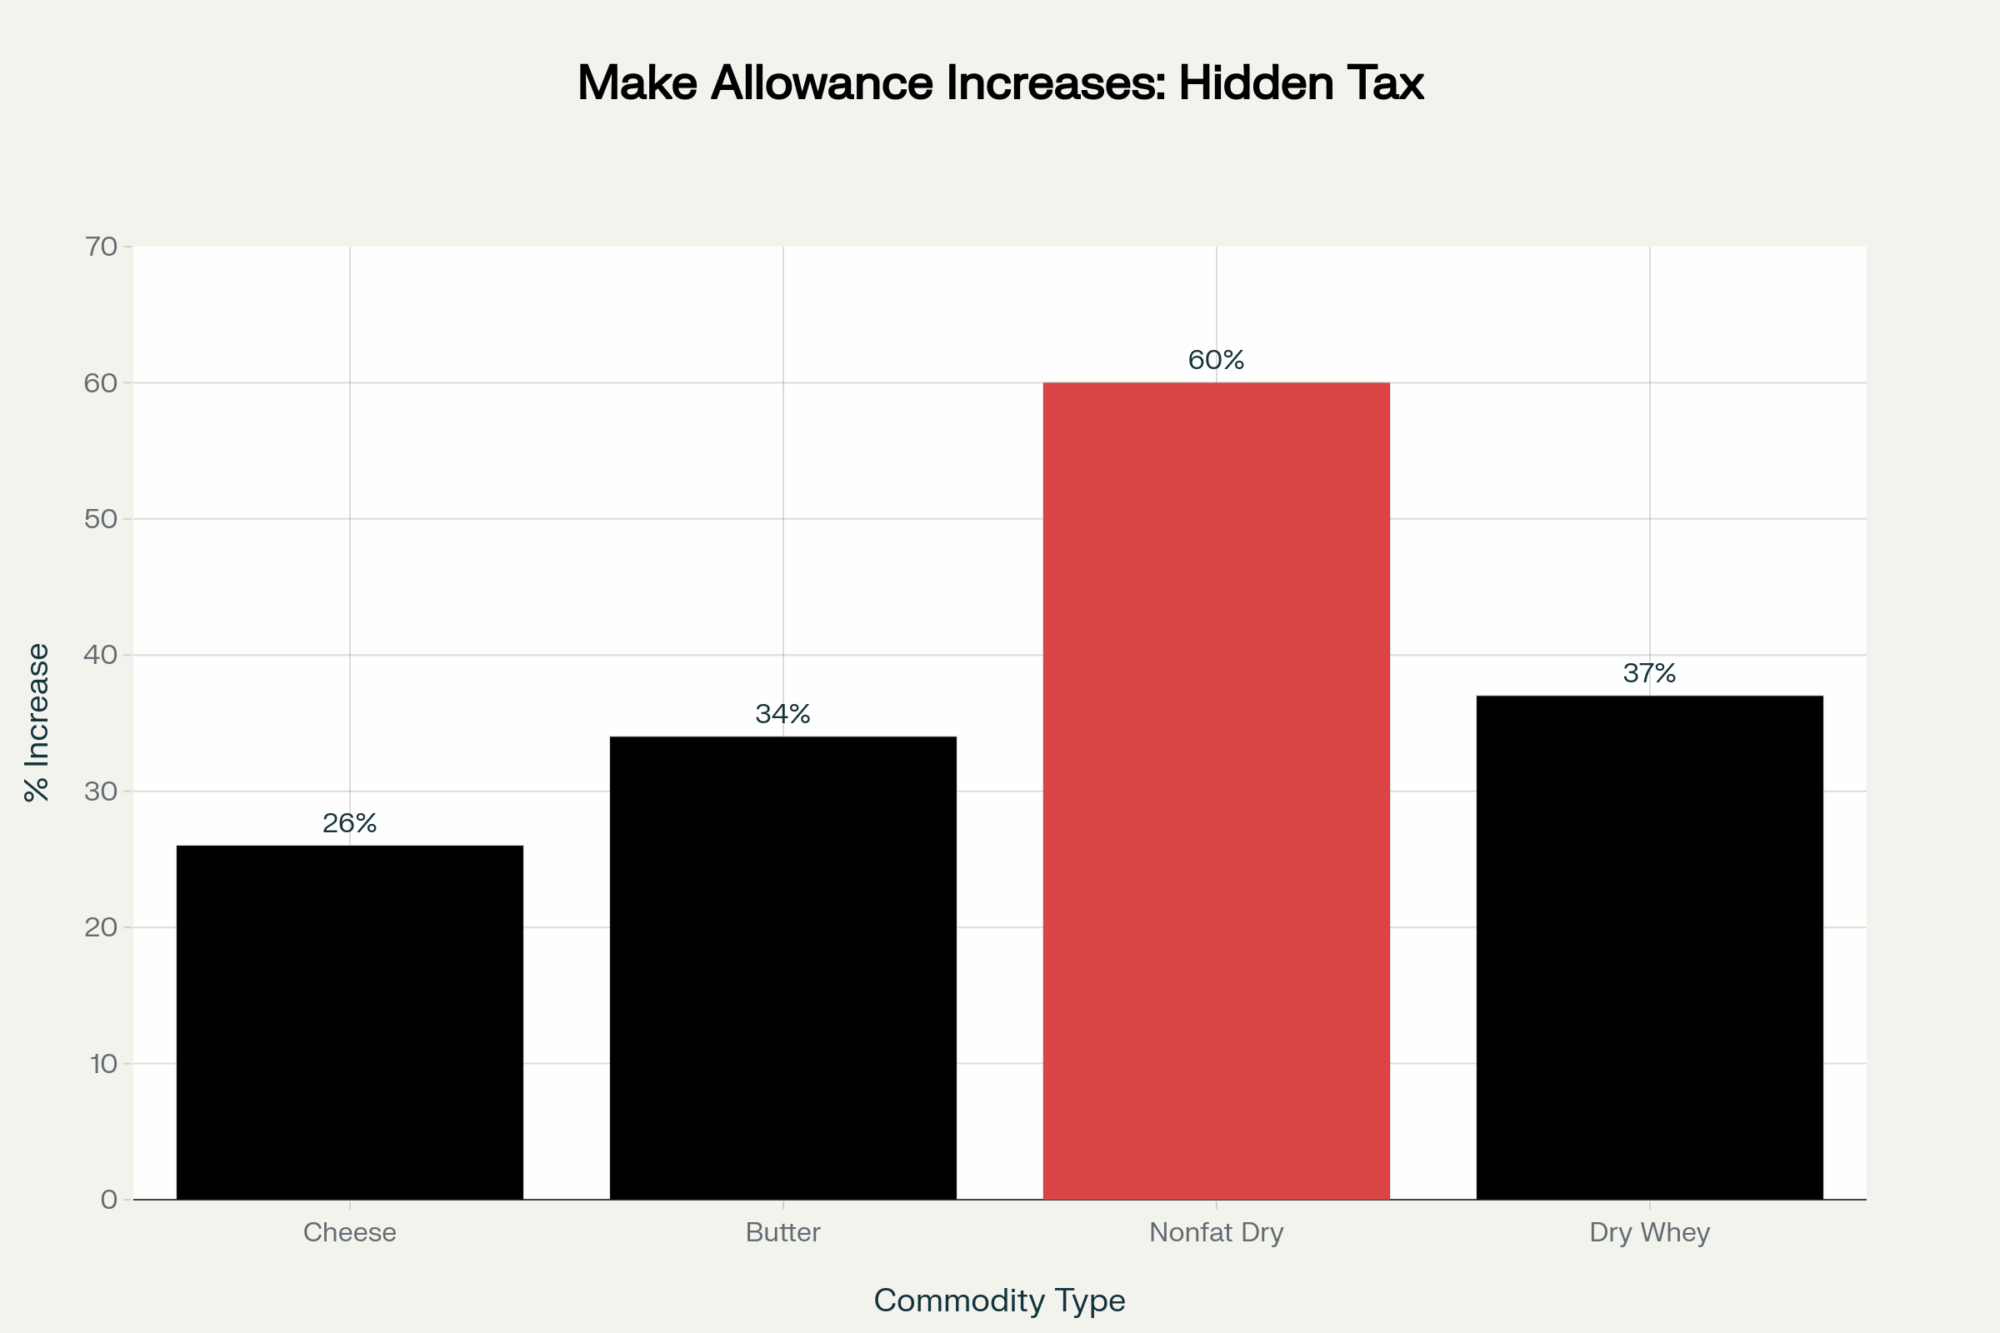
The make allowance increases weren’t part of this Farm Bill. They came through USDA’s FMMO modernization package, finalized in November 2024, approved by producer referendum in all 11 orders, and implemented on June 1, 2025. Make allowances — the per-pound deductions covering processor manufacturing costs, subtracted before farmers get paid — jumped across all four product categories:

ProductOld Rate ($/lb)New Rate ($/lb)Increase ($/lb)% Change
Cheese$0.2003$0.2519+$0.0516+25.8%
Butter$0.1715$0.2272+$0.0557+32.5%
Nonfat dry milk$0.1678$0.2393+$0.0715+42.6%
Dry whey$0.1991$0.2668+$0.0677+34.0%

AFBF economist Danny Munch tracked what those increases did to pool values. Average Class I prices dropped $0.89/cwt. Class II fell $0.85. Class III lost $0.92. Class IV, $0.85 — a 4 to 5% cut across the board attributable solely to higher make allowances. The Upper Midwest order alone lost $64 million in pool value over those first three months. The Northeast lost $62 million. California, $55 million.

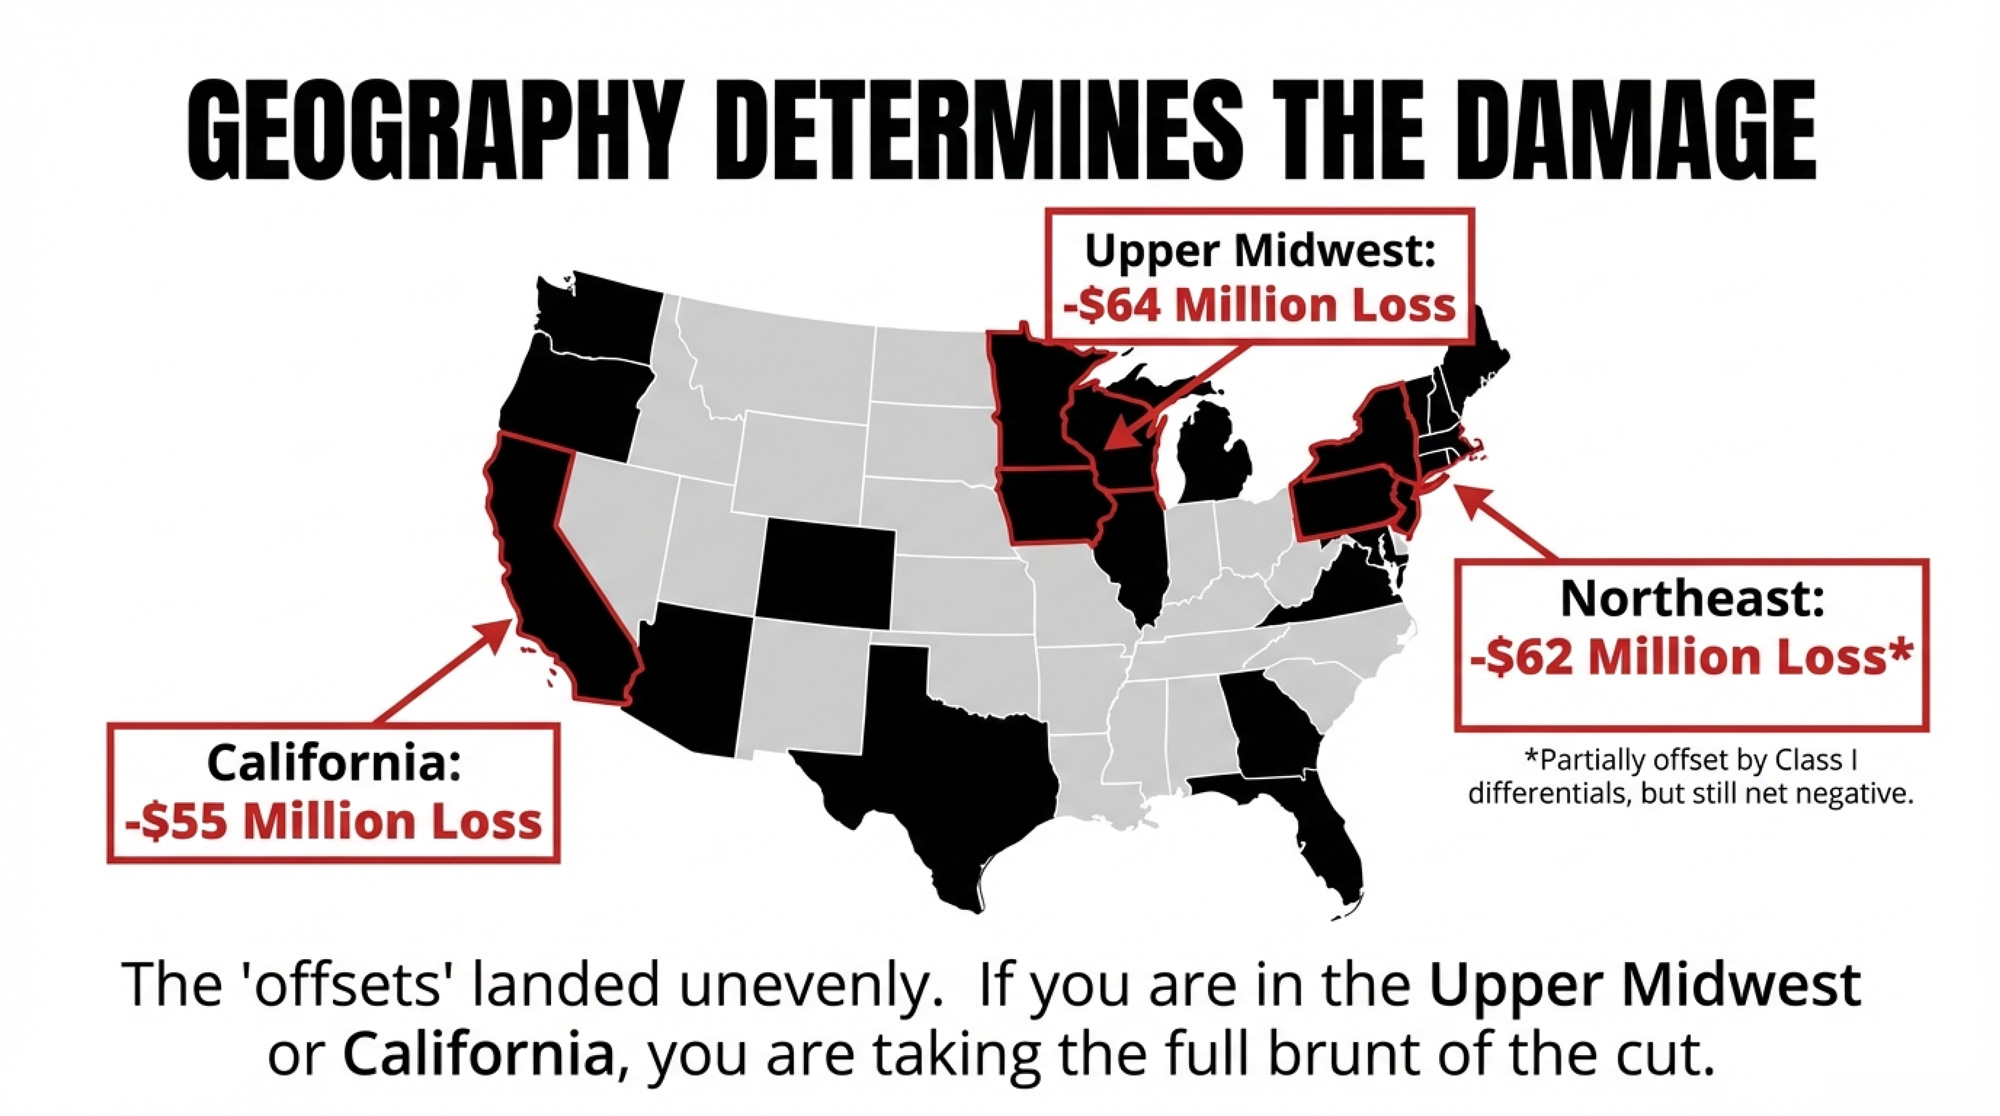
The FMMO amendments weren’t all one-directional, though. Higher Class I differentials — also part of the modernization package — added an estimated $137 million back to pool values in the same period, led by the Northeast (+$34 million) and Mideast (+$30 million), per the same AFBF analysis. The net total pool revenue decline from all FMMO amendments combined was roughly $232 million. But the offsets landed unevenly: California and the Upper Midwest — the two hardest-hit orders from make allowances — gained only $6 to $8 million each from higher differentials. If you’re pooled in the Upper Midwest, the differential cushion barely registers.

Processors had their own math. Christian Edmiston, VP of Procurement at Land O’Lakes, testified at the 2023 FMMO hearing that make allowances hadn’t been updated since 2008 and that manufacturing costs at LOL’s plants had risen substantially. He acknowledged the proposed increases “would not fully offset the increases in manufacturing costs” since 2008, but argued they “offer a balance between the producer price impact from raising make allowances and the processor cost impact.”

University of Minnesota dairy economist Marin Bozic told Brownfield in January 2025 that he expects higher allowances will eventually pull more milk back into pools: “As make allowances increase, that means that the processors have stronger incentives to bring that milk to the pool to try to get a piece of the producer price differential and forward that to their patrons.”

The short version of Bozic’s argument: when regulated minimum prices don’t reflect real processor economics, processors pull their milk out of the pool. Under the old make allowances, the regulated Class III price didn’t reflect where the market actually was, as Bozic put it — the gap between minimum regulated prices and processors’ real-world economics was wide enough to distort pooling behavior. That squeezed processor margins within the pool and pushed them to de-pool. Bozic told Brownfield the old system “manifested as a declining and then disappearing premium and more and more milk being depooled.” With higher make allowances, regulated minimums drop closer to market reality, reducing the misalignment that triggers de-pooling. More pooled milk means more revenue stays in the pool — and Bozic expects over-order premiums to return as a result. But “eventually” doesn’t help the check that’s already been issued.

[Read more: We mapped where those pool dollars went, region by region]

How Does the 2026 Farm Bill Change Your DMC Payment?

The barn math on the make allowance side is straightforward. Take a 200-cow Holstein herd producing 24,000 pounds per cow annually:

  • 200 cows × 24,000 lb = 4,800,000 lb/year = 48,000 cwt
  • AFBF’s class price reductions range from $0.85 to $0.92/cwt, depending on class utilization
  • Using $0.88 as an approximate midpoint: 48,000 × $0.88 = $42,240 per year

Scale it up. At 500 cows: $105,600. At 1,000 cows: $211,200. Your actual number depends on your order’s class utilization — a herd pooled mostly in Class III (Upper Midwest) takes a hit closer to $0.92/cwt, while heavier Class I utilization lands nearer $0.89. And if you’re in an order with strong differential gains (Northeast, Mideast), part of that loss is offset by higher Class I values — pull your actual milk statements to see the net.

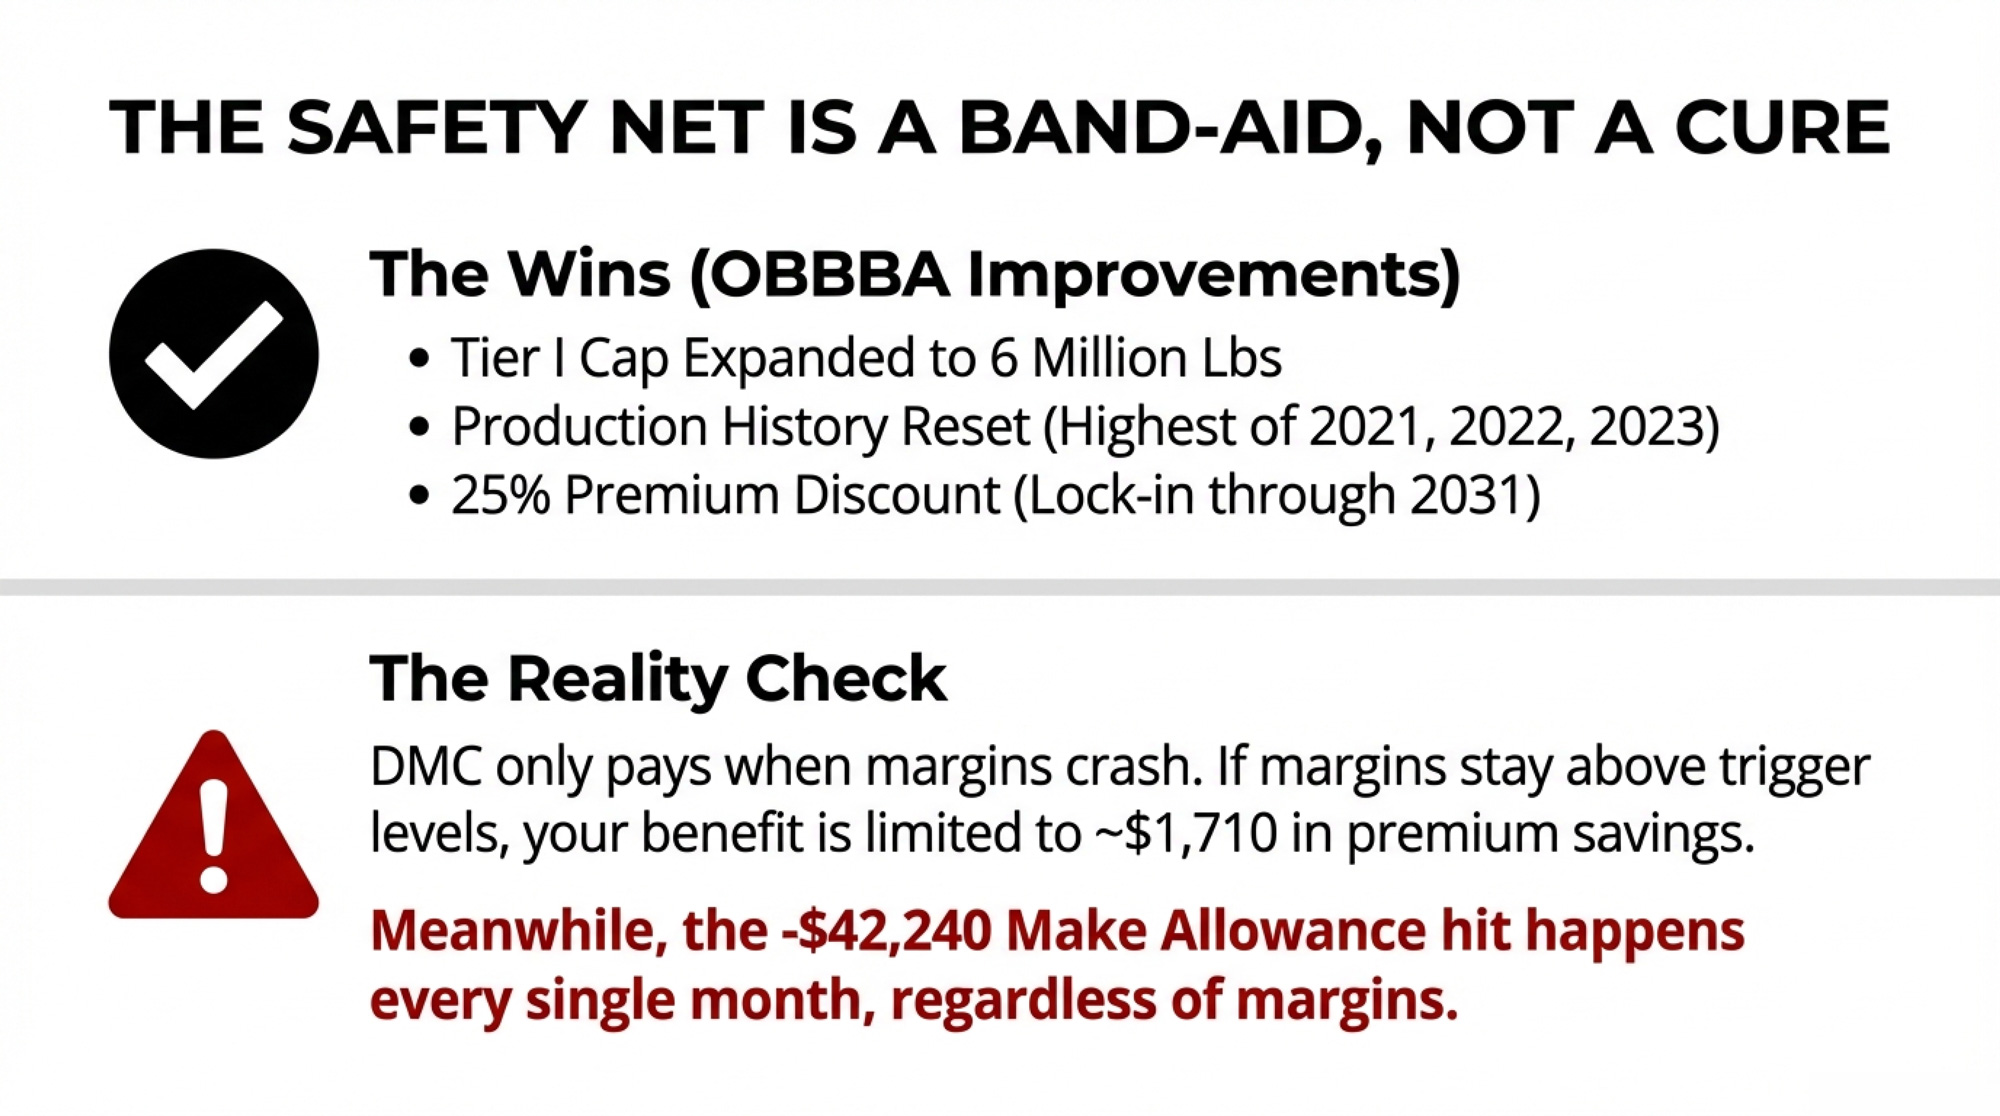
Now the safety-net side. The One Big Beautiful Bill Act (OBBBA) — the 2025 budget reconciliation package signed into law July 4, 2025 — delivered genuine DMC improvements: Tier I expanded from 5 million to 6 million pounds, production history resets to the highest of 2021, 2022, or 2023 marketings, and a 25% premium discount kicks in for producers who lock coverage through 2031. Premium rates under both Tier I and Tier II are unchanged from the 2018 Farm Bill structure.

Run it for the same 200-cow herd at $9.50 Tier I coverage, 95% enrollment:

  • 4,800,000 lb × 0.95 = 4,560,000 lb covered = 45,600 cwt
  • Premium at $0.15/cwt = $6,840/year at full rate
  • With 25% lock-in discount: $5,130/year — saving roughly $1,710 annually
  • In a year where DMC triggers for three to six months, additional indemnity payments could add $600 to $1,600

Total realistic DMC benefit in a tight-margin year: approximately $1,800 to $3,000. Against $42,240 in structural pool losses, that recovers between 4 and 7 cents per dollar.

The Quick Math for a 200-Cow Herd:

  • Loss (Make Allowances): −$42,240/year
  • Gain (DMC Fixes): +$1,800 to $3,000/year
  • Net Structural Gap: −$39,240 to −$40,440

The 500-Cow Tier II Trap

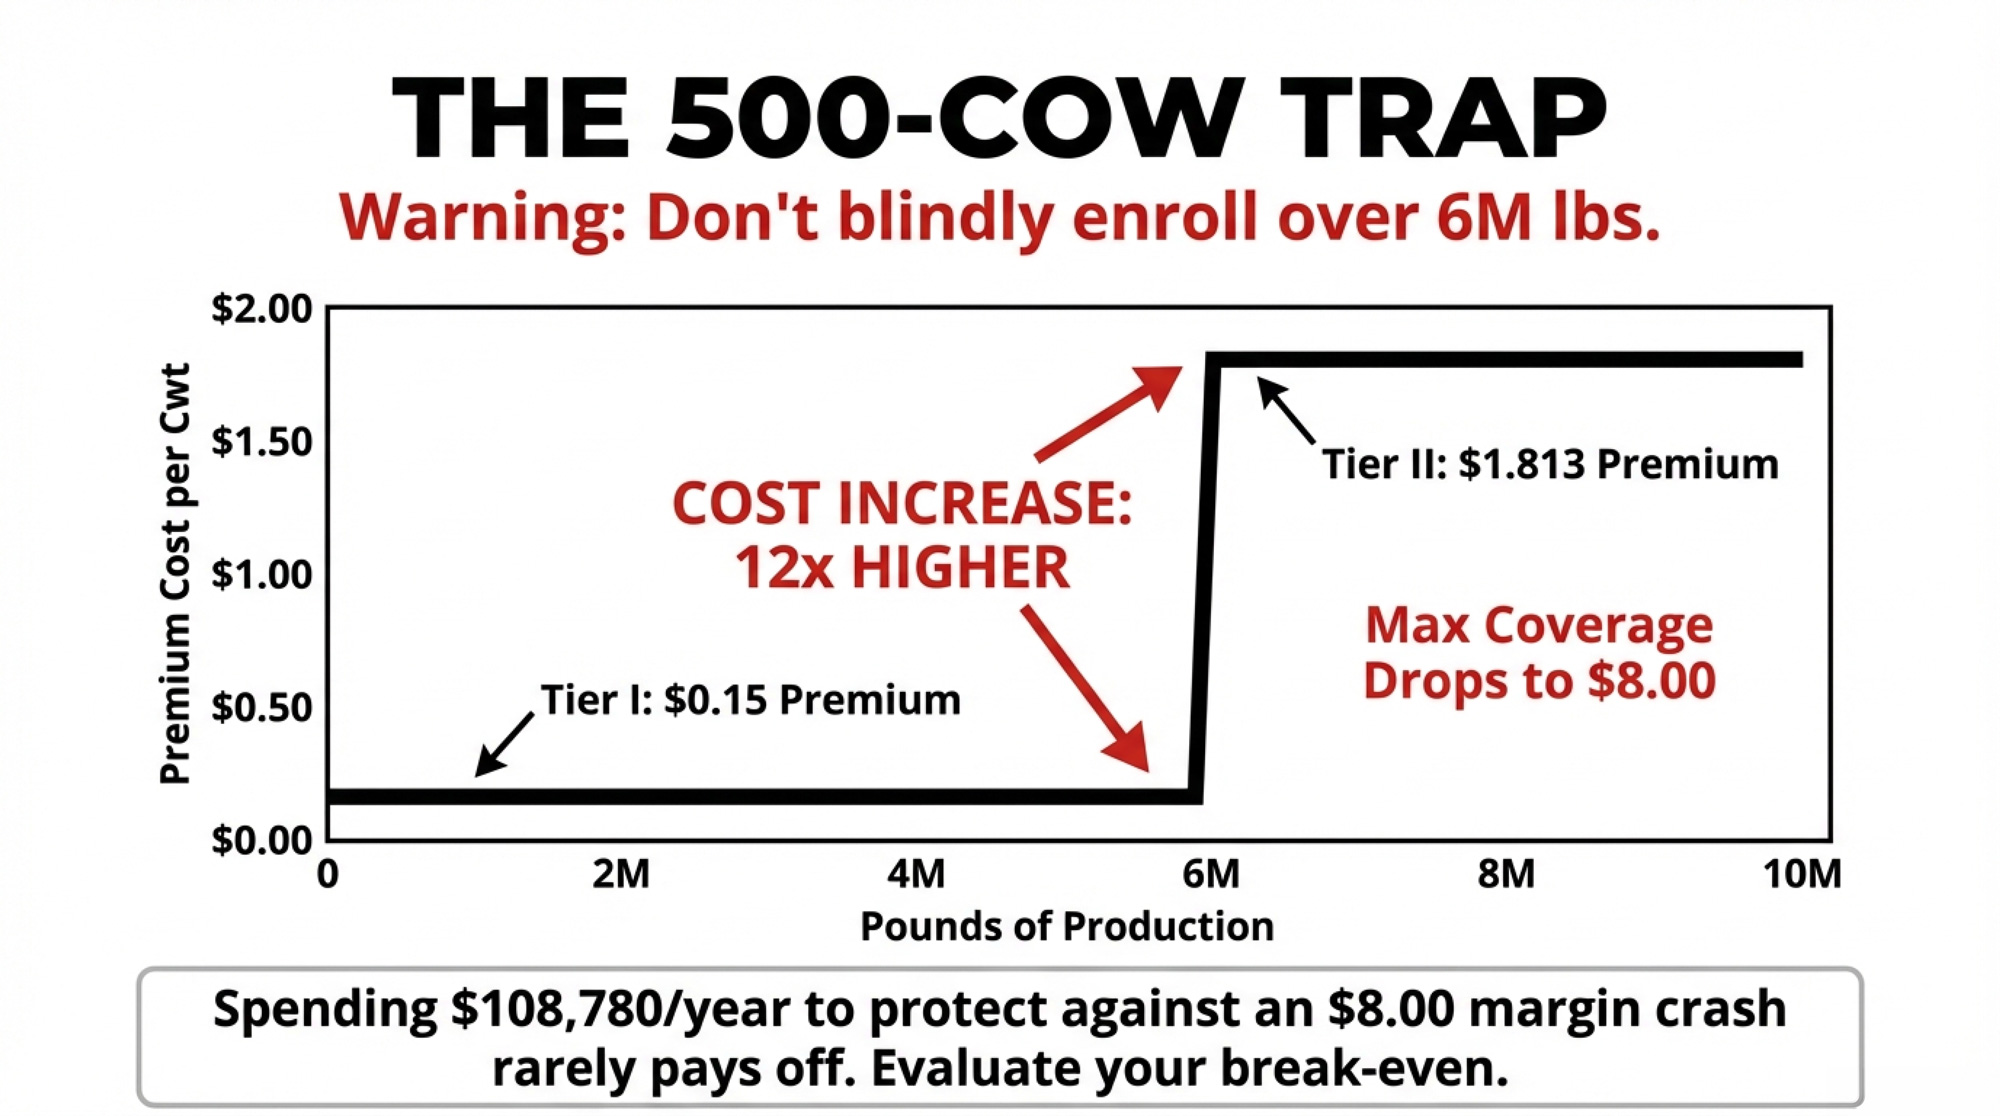
Bigger herds hit a wall. At 500 cows producing 24,000 lb/cow, you’re generating 12 million pounds a year. Under the new Tier I cap, the first 6 million pounds qualifies for Tier I. The remaining 6 million drops into Tier II — and the economics shift sharply:

  • Tier I (first 6 million lb): Max coverage = $9.50/cwt. Premium at $9.50 = $0.15/cwt.
  • Tier II (remaining 6 million lb): Max coverage drops to $8.00/cwt. Premium at $8.00 = $1.813/cwt — a 12x increase for $1.50 less protection.
  • Tier II annual premium math: 6,000,000 lb ÷ 100 = 60,000 cwt × $1.813 = $108,780/year at the $8.00 ceiling.
  • And here’s what you’d get back: If the margin drops to $7.00 for three months, Tier II indemnity on 60,000 cwt = $1.00 × 60,000 × 3/12 = $15,000 — against $108,780 in annual premium.
  • Meanwhile, the make allowance hit on 500 cows: $105,600/year, and that lands regardless of your DMC election.

Most large-herd advisors, including Mike North at Ever.ag, counsel producers to carefully evaluate Tier II against the frequency with which margins actually fall below $8.00. If your breakeven sits well above $9.00, Tier II may not be worth the premium.

Coverage TierCoverage CeilingAnnual PremiumIndemnity (3 mo @ $7.00)Net CostWorth It?
Tier I (first 6M lb)$9.50/cwt$9,000$37,500+$28,500Yes
Tier II (next 6M lb)$8.00/cwt$108,780$15,000-$93,780Rarely
Tier I + Tier II combinedMixed$117,780$52,500-$65,280No

How Two-Thirds of Processors Sat Out and Shaped Your Check

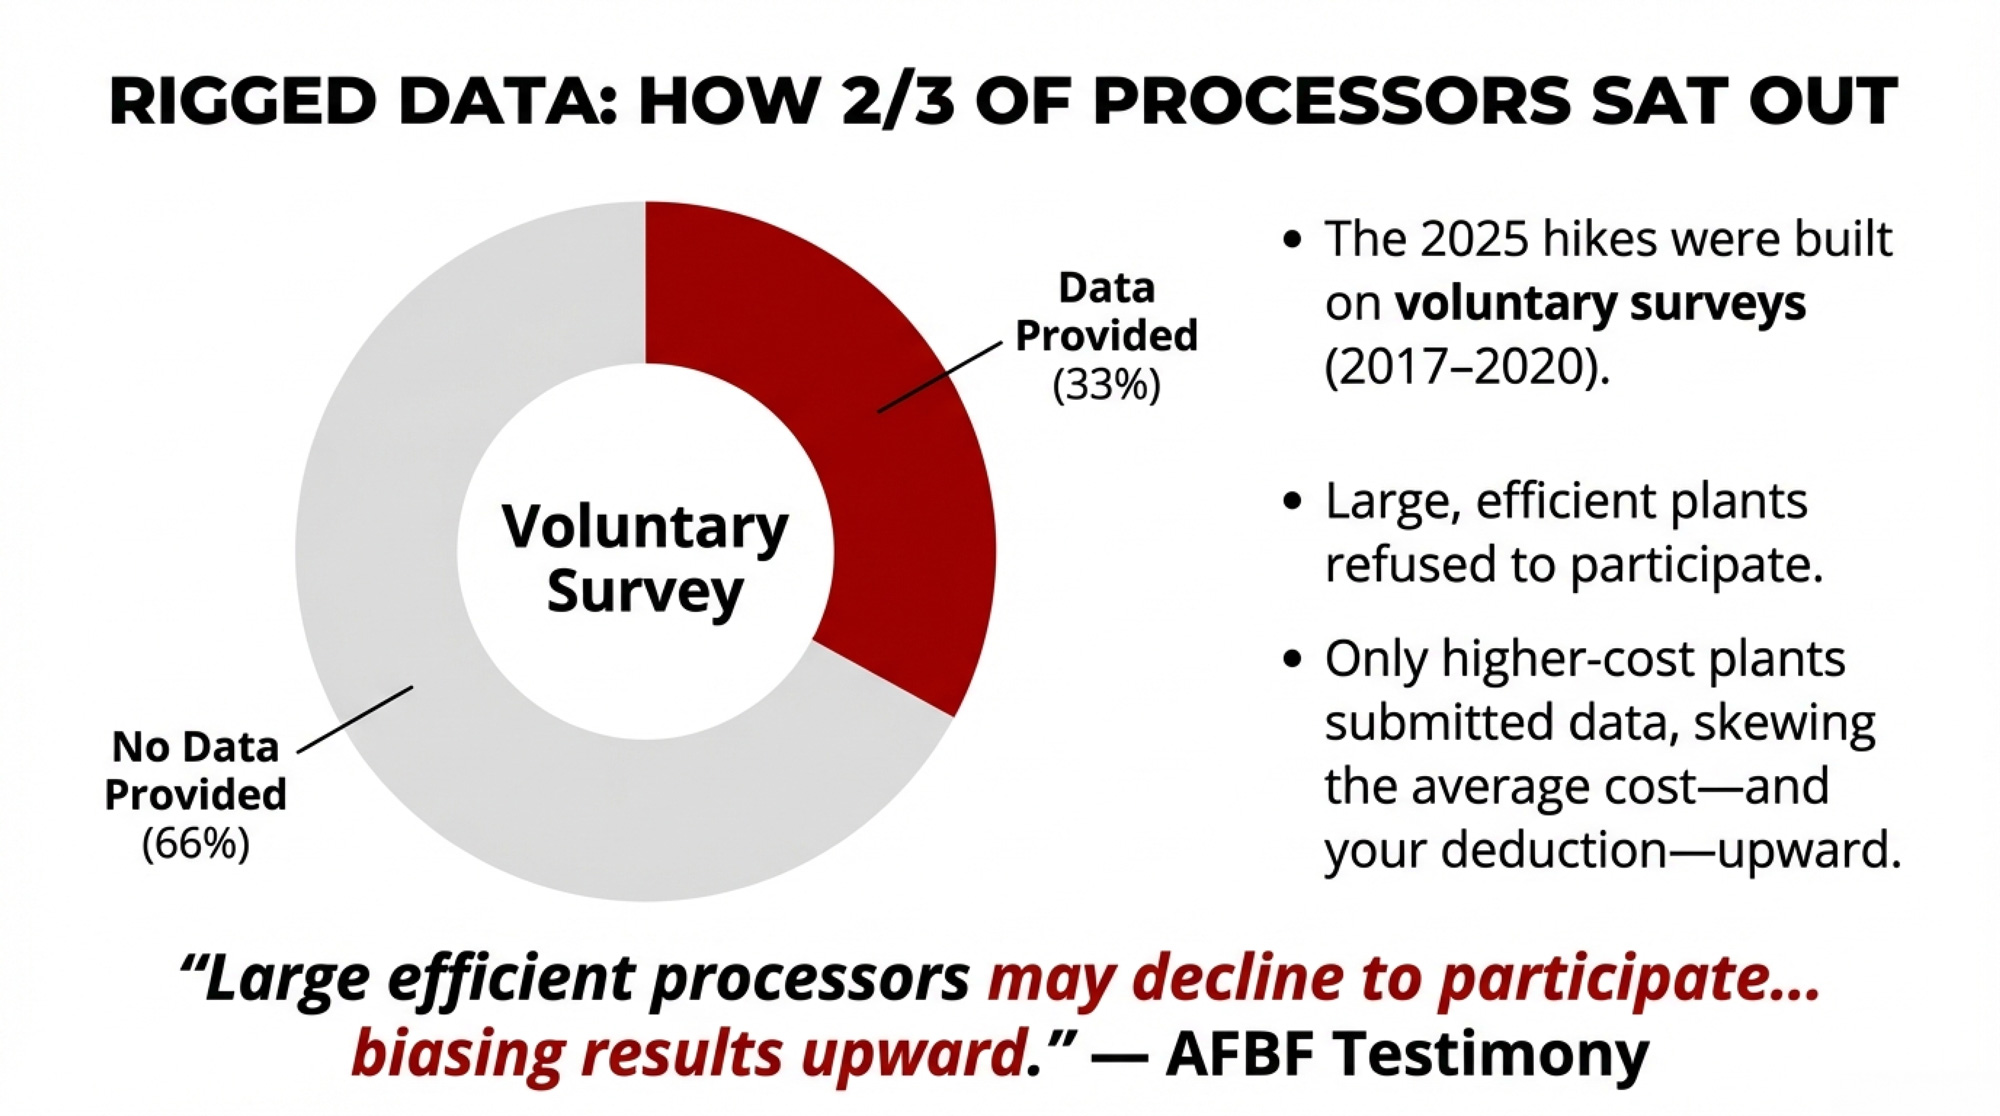
Munch has been sounding this alarm for two years. When Brownfield covered AFBF’s concerns at World Dairy Expo in October 2024, he laid out the numbers: “76% of cheddar cheese plants, 80% of butter plants, 40% of nonfat dry milk plants” skipped the voluntary cost surveys entirely. The cheese survey covered about 43 million pounds in total, but Stephenson’s sample captured only 6 to 7 million. The joint AFBF/NMPF petition to USDA put an even finer point on it: roughly two-thirds of dairy manufacturing plants provided no cost data at all.

Product TypeParticipation Rate (%)
Cheese24%
Butter20%
Nonfat Dry Milk60%
Dry Whey~30%

The survey, conducted by University of Wisconsin economist Mark Stephenson, gathered data from October 2017 through December 2020. So the make allowance increases, hitting your 2025 checks, were built on cost data that’s largely 5 to 8 years old, from a voluntary sample that skewed toward higher-cost operations.

The structural incentive isn’t subtle. Plants that benefit from higher make allowances were the same ones deciding whether to supply cost data. Big, modern facilities running at scale — with the lowest per-unit costs — had every reason to sit out. As AFBF wrote in its hearing testimony: “large efficient processors may decline to participate, which would bias the cost survey results upward.” Even Edmiston at Land O’Lakes acknowledged in his testimony that “the ideal data that a mandatory and audited survey would provide does not exist today.”

And there’s a historical pattern here. Allowances have been raised twice in the modern FMMO era — once in 2008 and again in 2025 — since the current formula structure was established during the 2000 order consolidation. They’ve never been reduced. The ratchet turns one direction.

[Read more: The U.S./Canada dairy comparison that puts domestic pricing reform in a continental context]

Will Section 1006 Actually Change Anything?

Here’s where it gets interesting. Section 1006 of the Farm, Food, and National Security Act of 2026 — titled “Mandatory reporting of dairy product processing costs” in the bill’s table of contents — makes permanent the mandatory biennial cost surveys initially authorized and funded at $9 million in the OBBBA (the 2025 reconciliation package).

NMPF President Gregg Doud said it plainly in the organization’s February 13, 2026, statement: “NMPF thanks Chairman Thompson, House Agriculture Committee members, and their staffs for working to put together a farm bill that will bring greater certainty to producers at a difficult time.” IDFA’s Michael Dykes called it “a permanent authorization for Mandatory Cost Surveys that will ensure make allowances in the Federal Milk Marketing Orders accurately reflect the cost of manufacturing dairy products.”

Kevin Krentz, Wisconsin Farm Bureau president and owner of a 600-cow dairy near Berlin, Wisconsin, has been a consistent voice for this reform — testifying at the 2023 FMMO hearing and at Farm Bill listening sessions that make allowance changes need mandatory, verifiable data behind them.

Lesher has walked that same path. She testified before the House Ag Committee and told Lancaster Farming that she received more questions from representatives than from the economists and professors in the room. “If I don’t tell our story,” Lesher said, “somebody else is going to tell a story. And it may not be as accurate.”

But Section 1006 doesn’t automatically adjust make allowances when new data arrives. Munch told Brownfield in October 2025 — after the OBBBA passed — that this is a common misconception: “That’s not the case. There’s still the traditional federal milk marketing order hearing process in place to make those amendments, so we would have to have a dairy industry stakeholder claim that there’s a problem, mention that problem, and initiate a whole other hearing.” And even getting the surveys running is on hold. “They’re going to have to set up a methodology. They’re going to have to have staff and researchers set aside for this,” Munch said, adding that government shutdowns have already caused delays.

There’s also a scenario nobody’s talking about. Mandatory surveys could confirm that processor costs genuinely rose as much as the voluntary data suggested. Edmiston’s own testimony showed that Land O’Lakes’ manufacturing costs at their Tulare, Carlisle, and Kiel plants all increased since 2008. If mandatory data backs that up, the reform argument shifts from “lower make allowances” to “at least now we know.” Either way, verified data beats unaudited self-reporting from one-third of plants.

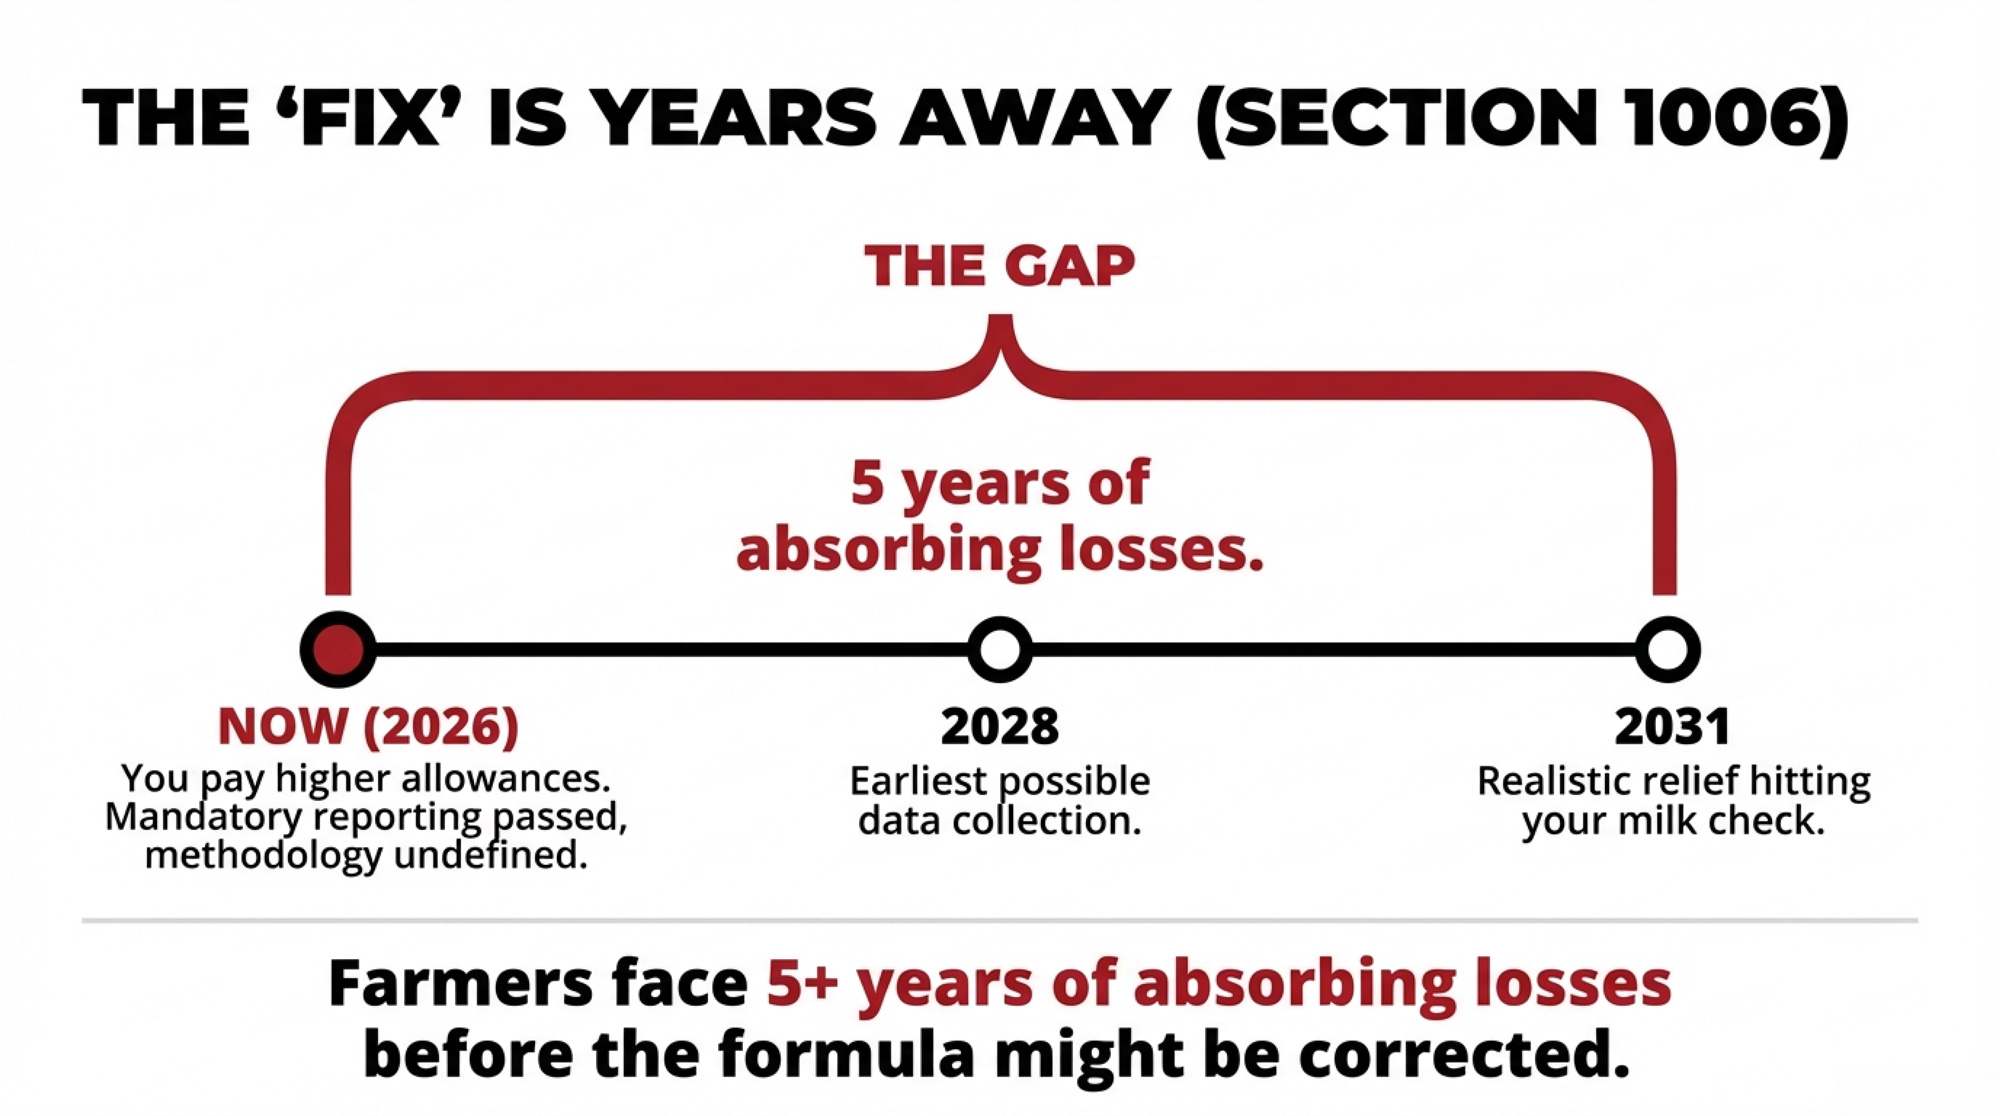
Munch has been clear on the timeline: “any resulting formula adjustments remains unclear, with changes unlikely to reach milk checks before 2028.” That’s Munch’s floor. A more conservative read based on the full FMMO hearing track record: AMS builds survey methodology through 2027–2028, first mandatory report around 2029, then add two to three years if stakeholders petition for an adjustment. Possible relief in the 2031–2032 range.

Five to six years of absorbing $42,240 annually on a 200-cow herd before make allowances might come down. “Might” is doing heavy lifting.

[Read more: When the financial pressure is structural, not cyclical, the playbook has to change]

What Canadian Producers Should Watch

Bullvine readers north of the border: this isn’t just an American story. When U.S. FMMO pool prices drop structurally — not due to a bad market but to a formula change — it depresses the price at which American dairy enters the USMCA tariff-rate quota system. Lower U.S. pool prices mean American milk crosses into the TRQ window at a wider discount relative to Canadian cost-of-production pricing, shifting the competitive dynamics Canadian producers face under supply management. And there’s a sharper edge: if Section 1006 ultimately fails to lower make allowances, sustained U.S. price depression could widen the gap between what American and Canadian producers receive for comparable components — a gap that already sparks political friction on both sides of the border.

If you’re tracking your quota value against cross-border pricing, this formula change affects the spread. We’ll break down the Canadian math when the Senate version drops.

[Read more: We compared what’s happening to U.S. farms vs. Canadian quota holders]

Four Moves Before Markup

Chairman Thompson confirmed the House Ag Committee will begin markup the week of February 23. Here’s what you can do between now and then.

This month:

  • Lock in your 2026 DMC coverage by February 26. That’s the enrollment deadline. At $9.50 Tier I with the 25% six-year discount, a 200-cow herd pays ~$5,130 vs. ~$6,840 at the full rate. The trade-off: you’re committed through 2031. If margins run strong over those six years, you can’t adjust coverage until the next cycle. Here’s the threshold: if your margin has dropped below $9.50 in any month since June 2025, the $9.50 level is likely worth the premium. If it hasn’t, model the savings at $8.50 and $9.00 coverage before locking into $9.50 through 2031 — the premium savings at lower levels may outweigh the indemnity probability over a six-year window.
  • Call your representative with two specific asks on Section 1006. First, compress the timeline for the first mandatory cost report—if AMS already audits prices weekly under NDPSR, cost data shouldn’t take years to collect. Second: add explicit penalties for non-compliance. Roughly two-thirds of plants sat out the voluntary surveys. Mandatory only works with teeth. Thompson’s DC office: (202) 225-5121.

Within 90 days:

  • Calculate your make allowance exposure. Pull your milk statements from April–May 2025 (pre-FMMO change) and compare blended price per cwt to July–September 2025 (post-change). Your annual hundredweight × that difference = your structural loss from the formula shift, separate from any market-driven movement. That number strengthens every conversation with your lender, your co-op board rep, and your congressman.
  • Check EQIP eligibility if you’re planning capex. USDA removed EQIP payment limits for 2025 — the previous $450,000 five-year cap is gone. The Farm Bill draft supports conservation “with a continued designation of conservation funds for livestock producers and a directive for states to prioritize methane-reducing practices,” per NMPF’s analysis. With no cap, larger manure-handling or precision-feeding projects now qualify. But EQIP is competitive — uncapped funding attracts bigger operations too — and most state batching deadlines fall in March through April. Contact your local NRCS office this week if you want to be in the spring cycle.

Within 12 months:

  • Watch for AMS’s announcement of the mandatory cost survey methodology. Once AMS publishes how they’ll collect data under Section 1006, the clock starts on when new make allowance data could inform a hearing. That announcement is your signal for whether the 2028 floor or the 2031 ceiling is more realistic.
ActionDeadlineUrgencyWhat to DoWhy It Matters
Enroll in DMCFeb 26, 2026HIGHLock $9.50 Tier I with 25% 6-year discount; model Tier II carefully$1,710/year savings on 200-cow herd; production history reset to highest of 2021–2023
Call your rep on Section 1006Feb 23, 2026 (before markup)HIGHAsk for faster reporting timeline + penalties for non-complianceMandatory surveys are only mechanism to lower make allowances; voluntary surveys had 2/3 non-response
Calculate your exposureWithin 90 daysMEDIUMCompare April–May 2025 vs. July–Sept 2025 milk statementsSeparates formula loss from market loss; strengthens lender/co-op conversations
Check EQIP eligibilityMarch–April 2026 (state batching deadlines)MEDIUMContact NRCS for methane/manure projects; no payment capUncapped funding but competitive; larger projects now qualify
Watch for AMS methodology announcementWithin 12 monthsLOWMonitor when AMS publishes Section 1006 survey designSignals whether 2028 floor or 2031 ceiling is realistic for relief

When the financial pressure is this structural — baked into the formula, not driven by the market — the hardest call isn’t to your congressman. [If you or someone on your operation is feeling the weight of it, read this.]

[Read more: How your balance sheet tells the story before your milk check does]

What This Means for Your Operation

  • The make allowance hit is permanent and automatic. It lands on every hundredweight of pooled milk, every month, regardless of your DMC enrollment or conservation participation. You don’t choose this deduction. It’s already in the formula.
  • The offset is real but uneven. Higher Class I differentials added $137 million to pool values nationwide — but the gains concentrated in the Northeast and the Mideast. If you’re in the Upper Midwest or California, the differential cushion covers a fraction of your make allowance loss.
  • DMC improvements are conditional. You only see indemnity payments when the margin drops below your coverage level. In a year where DMC never triggers, the benefit is limited to the premium discount — about $1,710 for a 200-cow herd at $9.50 Tier I with the six-year lock-in.
  • If your operation crosses 250 cows, you’re now likely within Tier I under the expanded 6-million-pound cap. Run your numbers at Tier I rates before assuming you need Tier II — the premium jump from $0.15/cwt to $1.813/cwt on production above 6 million pounds is steep, the coverage ceiling drops from $9.50 to $8.00, and the indemnity math rarely justifies the premium.
  • Section 1006 is the only mechanism in this bill that could eventually reduce make allowances. But the FMMO hearing process has never produced a downward adjustment. The regulatory timeline suggests 2031–2032 at best. Necessary, not sufficient.
  • Bozic’s pooling argument is worth watching. If higher make allowances genuinely pull more milk back into pools — by reducing the price misalignment that incentivizes processors to de-pool — that could partially offset class price reductions through restored over-order premiums. “Partially” is the key word, and the offset depends on your region’s pooling dynamics.
  • The gap frames your advocacy. For every $1 the safety net returns, the formula deducts roughly $14 to $23 from the same check, depending on whether DMC triggers and how often it does so. That imbalance doesn’t change until mandatory cost data forces a reckoning.

Key Takeaways

  • Enroll in DMC before February 26 — the production history reset and higher Tier I cap may change your optimal coverage level. Don’t default to last year’s election.
  • Calculate your per-cwt make allowance exposure by comparing pre-June and post-June 2025 blended prices on your actual milk statements. That’s your starting point for every financial conversation this year.
  • Contact your House rep before the February 23 markup with specific asks on Section 1006: a faster reporting timeline and enforcement penalties for non-participating plants.
  • If you milk 500+ cows, model the Tier I/Tier II split carefully before locking in coverage. The expanded 6-million-pound Tier I cap helps mid-size operations, but the Tier II premium and coverage ceiling haven’t changed—and the $8.00 Tier II indemnity-to-premium ratio is brutal.

The Bottom Line

Pull your April 2025 and September 2025 milk statements. Look at the blended price. That gap isn’t all market. A meaningful piece of it is structural — baked into a formula built on voluntary data from roughly one-third of plants, through make allowances that have never been adjusted downward. Section 1006 gives producers like Lesher — who expanded her herd, built a farm market, and testified before Congress — the first real tool to challenge that pattern with mandatory data instead of hunches. Whether it works depends on what happens between now and markup, and whether enough dairy farmers make the call.

When the committee marks this up, we’ll re-run every number. Bookmark this page.

Complete references and supporting documentation are available upon request by contacting the editorial team at editor@thebullvine.com.

Learn More

The Sunday Read Dairy Professionals Don’t Skip.

Every week, thousands of producers, breeders, and industry insiders open Bullvine Weekly for genetics insights, market shifts, and profit strategies they won’t find anywhere else. One email. Five minutes. Smarter decisions all week.

NewsSubscribe
First
Last
Consent

Your Milk Check Just Got $337M Lighter – And Your Co-op Helped Plan It

$337M vanished from producer pools in 90 days, while cooperatives counted processing profits

EXECUTIVE SUMMARY: Here’s what we discovered: while cooperatives sold “technical modernization” to members, they orchestrated regulatory changes that transferred $337 million from producer pool values to processing advantages in just three months. Farm Bureau’s analysis reveals that make allowance increases of 26-60% across dairy commodities will slice 85-90 cents per hundredweight from milk prices—but here’s the kicker: cooperatives with processing operations capture these enhanced cost recovery mechanisms through their manufacturing divisions. Geographic warfare is surgical: California faces $94 million in annual losses, while the Mid-Atlantic regions gain $2.20/cwt through Class I differential increases, systematically advantaging politically connected fluid-milk territories over efficient manufacturing regions. December brings another redistribution wave as component assumptions jump to 3.3% protein, creating pool formulas that reward genetic and nutritional investments while penalizing volume-focused operations. This isn’t market evolution—it’s regulatory capture disguised as industry progress, and the data proves your cooperative helped design the very mechanisms now draining your milk checks.

 dairy pricing reform

Look, I’m gonna start with something that might sting a little.

Your cooperative just sold you out.

I know, I know… that’s harsh. But honestly? Sometimes the truth cuts deep, especially when it’s been buried under two years of “technical modernization” doublespeak and regulatory complexity designed—and I mean specifically designed—to hide what amounts to the largest wealth transfer from dairy producers to processors in modern history.

$337 million.

That’s how much money vanished from producer pool values between June 1st and August 31st this year. The American Farm Bureau Federation just released their quarterly analysis, and I’ve been poring over these numbers for weeks, trying to wrap my head around the scale of what just happened. Not because of feed costs going crazy. Not weather disasters. Hell, not even the usual corporate greed we’ve all grown accustomed to dealing with.

This is something way worse—systematic regulatory changes that, regardless of intent, redistributed massive wealth from the farm gate to processing margins.

While cooperatives were telling members about “updating outdated formulas” and “technical improvements”—you know, the same buzzwords they always use when major changes are coming—they were actually implementing reforms that drained $337 million from farmer milk checks to processor profit margins in just 90 days.

And here’s what really gets me: the National Milk Producers Federation—supposedly representing your interests as a farmer—spent over two years designing these proposals. Two years to figure out how to help farmers, and the end result is the biggest wealth transfer in dairy history.

Now, to be fair, NMPF and their supporters argue these changes were necessary to “modernize” pricing formulas and improve industry competitiveness. However, when you examine who actually benefits versus who pays, the math tells a different story than their press releases.

The Make Allowance Money Grab: When “Technical Updates” Create Winners and Losers

Alright, let me strip away all the regulatory jargon and show you exactly what happened to your money.

Make allowances… they sound innocent enough, right? Manufacturing cost deductions are processors’ claims against milk prices when they produce cheese, butter, or powder. These hadn’t been comprehensively updated for over a decade—which, by the way, gave everyone involved the perfect justification for what they successfully marketed as “technical modernization.”

Here’s where it gets interesting, though. USDA and NMPF argued these increases were based on actual cost increases in processing operations. They commissioned studies, held hearings, and gathered input from the industry. The whole regulatory process looked legitimate from the outside.

But here’s what really happened. Check out these numbers from the USDA’s final decision:

Cheese allowance: Jumped 26% from twenty cents to 25.19 cents per pound
Butter allowance: Spiked 34% from seventeen cents to 22.72 cents per pound
Nonfat dry milk: Get this—exploded 60% from fifteen cents to 23.93 cents per pound
Dry whey: Climbed 37% from 19.5 cents to 26.68 cents per pound

The Regulatory Heist in Numbers – While NMPF sold ‘technical updates,’ they engineered percentage increases that slice 85-90¢ from every hundredweight. That 60% nonfat dry milk spike? That’s your money flowing straight to processor profit margins.

Danny Munch—he’s the economist over at Farm Bureau who actually crunched these numbers instead of just accepting industry explanations—calculates these increases slice 85 to 90 cents per hundredweight from milk prices across all classes. Every single class.

Now, NMPF would tell you these increases reflect genuine cost inflation in processing operations since… well, since they were last comprehensively updated. Labor costs, energy costs, equipment costs—all legitimate concerns. And honestly? Some of that argument holds water.

However, what they don’t emphasize is that while these “cost adjustments” reduced producer pool values by $337 million in three months, cooperatives with processing operations receive enhanced make allowance cost recovery through their manufacturing facilities.

Think about the dynamic here. You ship milk to your “farmer-owned” cooperative. They process it into cheese. Those new make allowances let them claim extra cents per pound as “manufacturing costs” before calculating what they owe back to the pool. So your co-op’s processing division captures the benefit while your farm-gate price absorbs the cost.

Industry defenders would argue that this reflects economic reality—processing really does cost more than it did years ago. And they’re not entirely wrong. However, when cost increases are passed down to producers while the processing benefits flow to cooperative manufacturing divisions, that represents a fundamental shift in how value is distributed throughout the system.

What Your Cooperative’s Official Position Doesn’t Tell You

NMPF’s public justification emphasizes modernizing outdated formulas and improving competitiveness. Their white papers discuss aligning with current processing realities, supporting rural economies, and strengthening the industry’s global position.

And you know what? Some of those arguments aren’t completely without merit. Processing costs have increased significantly. Energy, labor, compliance costs—they’ve all gone up.

However, what their official positions overlook is that the industry cost studies justifying these increases primarily came from companies and cooperative processing divisions that benefit most from higher allowances. The processors provided the studies that justified their own enhanced cost recovery.

That’s not necessarily a case of fraud or conspiracy. It may simply be a matter of how regulatory processes work when complex industries are required to provide their own cost data. However, the conflict of interest becomes apparent when one steps back and examines it.

Industry trade groups framed these changes as an economic necessity rather than a move driven by advantage-seeking. And maybe they genuinely believe that. But notice what’s missing from all the official justifications? Any mechanism to ensure these “cost adjustments” flow back to producers through higher over-order premiums when processing operations benefit.

The Geographic Warfare: When Good Intentions Create Regional Winners and Losers

Here’s where the FMMO reforms get really complicated, and honestly, where some of the industry’s official reasoning starts to fall apart.

The changes didn’t just redistribute money between producers and processors—they systematically advantaged some regions while disadvantaging others. Now, USDA would argue this reflects legitimate differences in transportation costs and market dynamics. And again, that’s not entirely wrong.

The Protected Class: Northeast and Mid-Atlantic operations got massive Class I differential increases that more than offset the make allowance hits. Federal Order 5, which covers the Mid-Atlantic region, saw differentials increase from $3.40 to $5.60 per hundredweight, according to USDA implementation data.

The official justification? Higher transportation costs, market premiums for fluid milk, and regional economic factors. All legitimate considerations that regulators weighed during the hearing process.

The Sacrifice Zones: California, the Upper Midwest, and Western orders—basically, the regions where most of the milk is actually processed for manufacturing—they absorb the full impact of milk allowance increases with zero offsetting benefits.

In California, they’re examining what Edge Dairy Farmer Cooperative calculated as a $94 million annual reduction in pool value. Southwest Order? They’re expecting $72 million in annual losses.

Now, USDA would argue these manufacturing-heavy regions benefit from lower transportation costs and established processing infrastructure. The regulations aren’t deliberately targeting anyone—they’re just reflecting economic realities.

However, here’s the problem with that reasoning: when regulatory changes systematically favor politically connected fluid-milk regions while disadvantaging efficient manufacturing areas, the practical effect appears to be deliberate economic engineering, regardless of the official intent.

Edge Dairy Farmer Cooperative released an analysis acknowledging that the reforms “would slightly decrease the minimum regulated price private milk buyers have to pay to pooled milk producers.” That’s cooperative-speak for “your margins just got systematically compressed through regulatory changes.”

The Complexity of Regulatory Intent vs. Practical Impact

What strikes me about the regional disparities is how they align so perfectly with political influence rather than economic efficiency. The regions that benefit most from Class I differential increases happen to be the areas with the strongest political representation in dairy policy discussions.

Is that deliberate favoritism? Or just how regulatory processes naturally work when different regions have different levels of political sophistication and influence?

The USDA would argue that they’re simply responding to economic data on transportation costs, market premiums, and regional factors. They’d point to studies showing legitimate cost differences between regions that justify differential adjustments.

But when the practical effect systematically advantages less efficient regions while penalizing more efficient ones, the intent becomes less important than the outcome.

You talk to any Pennsylvania or Maryland producer, and they’ll tell you those differential increases help cushion the blow from higher make allowances. Meanwhile, down in Wisconsin or California—the backbone of American cheese production—they’re getting hammered by make allowance increases with no relief.

The Cooperative Dilemma: Competing Loyalties and Conflicting Interests

And this is where it gets really complicated, because I don’t think most cooperative leadership deliberately set out to screw their members.

The National Milk Producers Federation spent over two years developing these proposals through extensive consultation with the industry. They held meetings, commissioned studies, and gathered member input. NMPF President Gregg Doud genuinely believes the final decision provides “a firmer footing and fairer milk pricing.”

From their perspective, these changes represent necessary modernization that will ultimately strengthen the entire industry in the long term. They’d argue that stronger processing margins benefit everyone by supporting infrastructure investment, improving competitiveness, and stabilizing markets.

And honestly? That’s not entirely a bogus argument. A strong processing infrastructure benefits producers by providing market outlets and value-added opportunities.

But here’s where the cooperative model creates inherent conflicts: when your “farmer-owned” organization also owns processing facilities that receive enhanced make allowances, which interest takes priority?

The Governance Challenge of Dual Roles

Modern cooperatives have evolved far beyond their origins as farmer-protection organizations, and this evolution creates genuine dilemmas rather than simple betrayals of their founding principles. They’ve become processor stakeholders through joint ventures, shared manufacturing facilities, and board governance that has to balance multiple interests.

Your co-op’s leadership may genuinely believe that stronger processing margins will ultimately benefit all members through improved services, a stronger market position, and enhanced competitiveness. That’s not necessarily wrong—it’s just a different theory of value creation than direct milk price maximization.

The problem lies in governance structures that concentrate decision-making power among the largest operations—exactly those most likely to benefit from processing partnerships and enhanced allowances. When delegates representing 5,000-cow operations with processing deals outvote representatives from 500-cow farms focused purely on milk prices, that’s not a conspiracy. That’s just how voting power works in cooperative governance.

But the practical effect is the same: systematic advantages for the largest, most diversified operations at the expense of smaller, milk-focused producers.

You’re running 500 or 800 cows in Ohio or Wisconsin? Your voice gets drowned out by delegates representing mega-operations with processing partnerships. Small and mid-scale producers… we lack the influence to counteract delegate votes that favor processing investments over farm-gate returns.

Industry position differences during the hearing process suggest that some cooperative leadership recognized these tensions. The question is whether they had realistic alternatives given the political dynamics of regulatory change.

The Price Discovery Changes: Technical Complexity vs. Market Impact

The removal of 500-pound barrel cheese from Class III pricing calculations represents another layer of regulatory change that official explanations struggle to justify convincingly.

USDA’s reasoning focused on streamlining price discovery and reducing complexity in commodity pricing formulas. They argued that barrel pricing created volatility and confusion in market signals.

From a technical regulatory perspective, that argument has some merit. Simpler pricing mechanisms can reduce administrative complexity and improve market transparency.

But the practical effect concentrates price-setting power among fewer market participants, which typically benefits buyers more than sellers. When you reduce the number of pricing points used to set commodity values for the entire industry, you typically reduce competitive pressure.

Block cheese producers lobbied for these pricing changes during the hearing process, and their arguments about market efficiency and price discovery weren’t entirely without merit. But they got exactly what they wanted: reduced competitive pressure from barrel pricing.

The Challenge of Technical vs. Political Justifications

What bothers me about pricing formula changes is how technical complexity provides cover for market advantages. When regulatory changes require specialized expertise to understand, most participants can’t effectively evaluate whether the changes serve broader industry interests or specific player advantages.

USDA’s technical justifications for barrel removal sound reasonable in isolation. However, when you combine these with allowance increases and regional differential changes, the overall pattern systematically favors certain players while disadvantaging others.

Is that deliberate market manipulation? Or just the inevitable result of complex regulatory processes where different players have different levels of technical expertise and political influence?

The answer probably depends on your position in the industry hierarchy. If you benefit from the changes, they represent necessary modernization. If you’re disadvantaged, they looks like regulatory capture.

What This Really Means Long-Term: Competing Visions of Industry Structure

The $337 million first-quarter transfer from Farm Bureau’s analysis represents more than just money moving between accounts. It reflects competing visions of how the dairy industry should be structured and who should capture value at different points in the supply chain.

NMPF and their supporters would argue that these regulatory changes strengthen the industry by improving processing margins, encouraging infrastructure investment, and enhancing global competitiveness. They’d point to expansion plans and processing investments as evidence that their approach is working.

From this perspective, temporary producer pain leads to long-term industry strength that eventually benefits everyone through stronger markets, better services, and enhanced competitiveness.

However, critics, such as Edge Dairy and the Farm Bureau, view a systematic wealth transfer from efficient producers to processing interests that may never be reflected in farm-gate prices. Their analysis suggests continued consolidation pressure in manufacturing-focused regions that could undermine the industry’s competitive foundation.

Industry analysts are already projecting different scenarios depending on whether these regulatory structures drive beneficial investment or simply redistribute wealth from producers to processors without creating genuine value.

The honest answer? We won’t know which vision proves correct for several years. However, the immediate impact is clear: $337 million was transferred from producer pool values to processing advantages in just three months.

Regional Implications and Competitive Dynamics

You’re going to see the Northeast and Mid-Atlantic regions positioned to benefit from permanent Class I premiums and processing investments that capture regulatory advantages. Whether that strengthens or weakens overall industry competitiveness depends on whether protected regions utilize their advantages for genuine improvement or merely engage in rent-seeking.

Meanwhile, California, the Upper Midwest, and Western operations face continued pressure from regulatory disadvantages that may force consolidation or exit. If those regions represent the industry’s most efficient production, it could undermine long-term competitiveness, regardless of short-term improvements in processing margins.

The global implications are murky. Enhanced make allowances might improve U.S. processing competitiveness by providing guaranteed cost recovery. Or they might create artificial advantages that reduce incentives for genuine efficiency improvements.

International buyers increasingly value supply chain consistency and reliable quality over marginal regulatory advantages. Whether FMMO changes enhance or undermine those qualities remains to be seen.

Component Factor Changes: Modernization or Redistribution?

Starting December 1st, the assumed protein content increases from 3.1% to 3.3%, while other solids rise from 5.9% to 6.0%, according to the USDA implementation schedule.

The USDA’s justification emphasizes the recognition of genuine improvements in milk quality and genetic progress over the past decade. And honestly? That argument has solid support. Average component levels have improved significantly through genetic selection and nutrition management.

From a technical perspective, updating component assumptions to reflect current reality makes perfect sense. If most producers are achieving higher components than the formulas assume, the assumptions should be updated.

However, here’s where technical accuracy creates practical consequences: these changes will benefit operations already achieving high efficiency while disadvantaging those still focused on volume production.

The December changes don’t create new value—they redistribute existing pool money based on component assumptions that favor certain production strategies over others.

The Question of Fair vs. Advantageous Updates

Smart operators are already adjusting their breeding programs and ration formulations to capitalize on these regulatory advantages. Whether that represents a necessary adaptation to industry evolution or regulatory changes in gaming depends on your perspective.

USDA would argue they’re simply updating formulas to reflect current industry reality. Producers achieving higher components deserve recognition for their genetic and management investments.

But producers focused on volume production—often smaller operations with older genetics or limited nutritional resources—will subsidize their higher-component competitors through pool redistribution formulas.

Is that fair recognition of superior management? Or systematic disadvantaging of producers who can’t afford the latest genetic and nutritional technologies?

The answer probably depends on whether you view dairy as a commodity industry where efficiency should be rewarded, or as a rural economic system where smaller operations deserve protection from technological displacement.

Down in Pennsylvania, I was speaking with a producer who has been pushing his nutritionist hard on component manipulation strategies. He’s targeting 3.8% butterfat and 3.3% protein specifically because of these December changes. He said he’s not going to subsidize his neighbors who haven’t yet figured out the new game.

And honestly? This is no longer about milk volume. It’s about maximizing value per pound in a system that’s been restructured to reward components over quantity.

You’re still focused on pounds per cow? You’re gonna get killed in this new regulatory environment.

Fighting Back: Navigating Complex Realities Rather Than Simple Villains

Look, the wealth transfer is happening whether the motivations were pure or calculated. Your milk checks already reflect these new realities, regardless of whether cooperative leadership intended to disadvantage smaller producers or genuinely believed they were modernizing industry structures.

Independent producers who refuse to accept systematic disadvantages must move aggressively, but the solutions are more complex than simply fighting “bad actors.”

Component Optimization: Adapting to Regulatory Realities

Target 3.8% butterfat and 3.3% protein through systematic genetic selection and precision nutrition management. Whether the December component changes represent fair modernization or regulatory favoritism, they’re happening.

Work with nutritionists who understand component manipulation strategies, rather than just focusing on volume maximization. Focus on rumen-degradable protein levels that support component synthesis while maintaining the health of the cow.

Utilize genomic services to identify high-genetic potential within your existing herd. Cull animals that can’t achieve competitive component levels regardless of management inputs.

The reality is that operations unable to compete on components will subsidize those that can, starting December 1st. Whether that’s fair or not doesn’t change the economics.

And honestly, if your fresh cows aren’t consistently meeting these component targets, you need to refine your transition cow management. Because starting December 1st, every cow below these assumptions is subsidizing your competitors.

Strategic Milk Marketing: Working Within Flawed Systems

Negotiate over-order premiums with processors who receive enhanced make allowance cost recovery. Document your component achievements and demand premiums that reflect true quality rather than just pool averages.

These processors are capturing regulatory advantages whether they deserve them or not. Demand your share through premium negotiations based on documented quality metrics.

What I’m seeing work in Ohio is producers forming marketing groups to negotiate collectively rather than accepting whatever pools provide. When you consistently achieve high component targets, you have leverage regardless of regulatory advantages.

Explore partnerships with regional processors willing to share value-added margins rather than just paying pool prices. Direct-to-market alternatives bypass FMMO redistribution entirely.

Coalition Building: Addressing Systemic Issues

Pool resources with other disadvantaged producers to challenge regulatory methodologies through formal petitions or legal action. Whether the original intent was benign or calculated, the practical effects are documentable and challengeable.

The power structure that created these advantageous changes can be influenced through organized pressure, but it requires coordination across regional and cooperative boundaries.

What strikes me about current producer responses is that most operations are adapting individually rather than organizing collectively to address systemic disadvantages. That approach might preserve individual operations, but it won’t change the underlying regulatory structures.

Political Engagement: Long-term Structural Reform

Launch campaigns targeting legislators in manufacturing-disadvantaged regions with specific evidence of regulatory impacts. Whether the original changes were intentional or accidental, the documented effects provide concrete evidence for advocacy.

Frame regulatory reform around fairness and competitive balance rather than conspiracy theories about deliberate theft. Focus on documented outcomes rather than speculated motivations.

Partner with consumer groups and rural development organizations to widen coalitions beyond agriculture. Position regulatory reform as supporting competitive markets and rural economic vitality.

The key is addressing the systemic issues that allow regulatory processes to systematically advantage certain players while disadvantaging others, regardless of whether that outcome was originally intended.

Down in Wisconsin, there’s already talk about organizing producer groups to pressure state legislators. The question is whether enough people realize they’re being systematically disadvantaged and actually do something about it.

The Bottom Line: Complex Problems Require Sophisticated Responses

The dairy industry has just experienced its largest wealth redistribution in decades, thanks to regulatory changes that may have been well-intentioned but have created systematic disadvantages for independent producers. $337 million transferred from farmer milk checks to processing advantages in three months, with more likely to follow.

Whether cooperative leadership deliberately betrayed producer interests or genuinely believed they were modernizing industry structures matters less than the documented outcomes. The regulatory process systematically advantaged certain players while disadvantaging others, regardless of original intent.

This isn’t simply about fairness versus unfairness—it’s about competing visions of industry structure and value distribution. The challenge is building sufficient political and economic pressure to rebalance regulatory outcomes without getting trapped in conspiracy theories about deliberate betrayal.

Strategic Response Framework

This month: Adapt to regulatory realities through component optimization while documenting the costs of regulatory disadvantages for advocacy purposes. Those December component changes are coming fast.

  • Audit your herd’s genetic potential for 3.8% butterfat and 3.3% protein targets
  • Begin processor premium negotiations based on documented quality metrics
  • Calculate your operation’s specific losses from the 85-90¢/cwt make allowance impact

Next three months: Form coalitions with other disadvantaged producers to pool resources for legal challenges and political pressure targeting regulatory rebalancing. The Farm Bureau analysis gives you concrete numbers to work with.

  • Join regional producer alliances across cooperative boundaries
  • Pool resources for economic and legal expertise on regulatory challenges
  • Document specific financial impacts for legislative advocacy

Through 2025: Implement marketing strategies that capture value outside regulated pool formulas while supporting broader reform efforts. But honestly? Most of us lack the expertise for complex workarounds.

  • Explore direct-to-market partnerships bypassing FMMO pools
  • Negotiate over-order premiums, capturing regulatory advantages
  • Support cooperative governance reform requiring transparent processing profit disclosure

Strategic thinking: Support regulatory process reforms that require independent verification of industry cost claims and broader representation in policy development.

The $337 million wealth transfer already happened, according to Farm Bureau’s analysis. Whether it represents deliberate theft or unintended consequences, the practical effect is systematic disadvantaging of independent producers who lack processing partnerships and political influence.

Your response determines whether you adapt successfully to capture remaining value while building pressure for fairer regulatory processes… or watch your operation subsidize others’ advantages through government formulas that may never be rebalanced without sustained political pressure.

The regulatory game is complex, but the outcomes are clear. Understanding that complexity is essential for developing effective responses rather than just complaining about unfairness.

Your milk didn’t become less valuable. The formulas valuing your milk got restructured in ways that systematically favor certain players over others. The only question now is what you’re gonna do about it.

KEY TAKEAWAYS

  • Target 3.8% butterfat and 3.3% protein immediately—December component changes will redistribute pool money from operations below new assumptions to those hitting higher targets through systematic genetic selection and precision nutrition management
  • Negotiate over-order premiums with processors benefiting from enhanced make allowances—document your component quality and demand sliding-scale premiums that capture portions of the regulatory advantages flowing to processing margins
  • Form regional coalitions across cooperative boundaries to challenge regulatory methodologies—Farm Bureau’s $337 million documentation provides concrete evidence for legal petitions and political pressure targeting make allowance reversals
  • Calculate your operation’s specific losses from the 85-90¢/cwt make allowance impact—operations shipping 2,000 cwt monthly face $17,000-$18,000 annual reductions that cooperative processing divisions now capture as enhanced cost recovery
  • Explore direct-to-market alternatives, bypassing FMMO pool redistribution—regional partnerships with specialty processors willing to share value-added margins offer escape routes from regulatory formulas systematically favoring large-scale operations with processing partnerships

Complete references and supporting documentation are available upon request by contacting the editorial team at editor@thebullvine.com.

Learn More:

The Sunday Read Dairy Professionals Don’t Skip.

Every week, thousands of producers, breeders, and industry insiders open Bullvine Weekly for genetics insights, market shifts, and profit strategies they won’t find anywhere else. One email. Five minutes. Smarter decisions all week.

NewsSubscribe
First
Last
Consent

More Than Policy: For Jim Mulhern, Legacy is Measured One More Season at a Time

When times got tough, Jim Mulhern fought to keep dairy farmers afloat—his legacy is measured in seasons survived, not speeches made.

Jim Mulhern speaks on Capitol Hill: Leading with calm resolve and a producer’s perspective during his transformational tenure at NMPF.

What’s interesting about Jim Mulhern’s legacy—really, what stands out if you hang around barn meetings or share coffees after a long Expo day—isn’t just the policies on paper or the speeches under the lights. It’s how many dairy producers, across regions and generations, end up telling the same sort of story: when margins went south, when feed costs jumped, when times felt especially lean—somewhere in the background, or sometimes the foreground, Jim or his policy work was part of the survival toolkit. Sometimes it’s an NMPF Zoom, sometimes it’s a barn newsletter that started somewhere in DC, but at the end of the day, it’s about service, not a resume.

Ask producers from different regions and you hear variations of the same story: when margins got tight and options felt limited, Jim’s approach—listening first, speaking plainly—made challenging situations feel more manageable. Jim never had miracles—but if you picked up the phone, he’d listen, cut through the DC fog, and, true to form, drop that middle-child line: ‘You get good at compromise or you don’t eat!’ It made disaster feel… survivable.”

That earthy, honest support is the current running through his 45 years. Policy? It matters—but in dairy, legacy is how many operations get to run another season. So, let’s skip the official bio-paper and start where it hits hardest: with those farm stories that turn ‘legacy’ into something you can actually hold.

The Thing About Legacy in Dairy

It’s never been about reform tallies or titles. Ask anyone who’s watched drought suck the valley dry in Tulare, or a New Yorker calculating butterfat after a ration swap, or a Nevada dairyman wincing at the new heifer price sheet. Legacy’s about who keeps showing up—boots on, sleeves rolled—when everyone else is home.

Jim’s roots? Portage, Wisconsin—a big breakfast table, weekends on neighbors’ farms, one of those upbringings where you learned fast how problems got solved. Shuffled off to UW-Madison, he wasn’t in it for the hands-on milking; it was about using ag journalism to keep his hands in the land. That early DC internship with Bob Kastenmeier made it real: policy’s not a sideline, not if you steer it for the folks actually working the ground.

Compromise Isn’t a Dirty Word—It’s the Dairy Way

Here’s what the industry crowd knows: volume in a boardroom never means as much as listening on the ground. Jim, one of nine siblings, had the lessons of compromise engrained before he could drive. “The hardest part of co-op isn’t the milk check—it’s getting everyone on the same page.”

The road through FMMO reform? Nobody who was there would call it smooth. Those months would test anyone’s patience—herding Holsteins along a muddy path more than a couple of times. With all the regional priorities—Midwest cheese, Plains expansion, fluid markets in the West—compromise wasn’t an act, it was the job description. Jim pulled in trusted voices like Jim Sleper, and always circled back to what mattered: “Nobody walked away with everything, but everybody left knowing, ‘Yeah, my big worry was on the table.’” That’s why the results stuck when it mattered most.

Living Risk—Not Just Avoiding It

Let’s get down to it: bring up MILC, MPP, DMC (Dairy Margin Coverage program) at any coffee shop, and yeah, you’ll get some eye-rolls—until another dairy downturn reminds folks why it matters. Before the overhaul, many people figured their best shot was a prayer, insurance, and maybe a check if things got rough.

However, this is the new trend: with DMC, mid-sized to small operations have a real net. DMC’s pushed out over $2 billion when the pain hit hardest—money that kept for-sale signs out of the barn windows. You hear the same story everywhere—Michigan’s Thumb, a dry-lot outside Yuma, a late-night text from Idaho. When COVID hammered the sector, and the checks came, people said straight up, “That’s what kept cows fed and my kids in 4H.” That’s policy making a difference.

But managing risk wasn’t just about safety nets; it was also about fighting for a fair, predictable price in the first place—a battle that brought Jim straight to the messy heart of FMMO reform.

FMMO Reform—Messy, But Worth It

“Modernization” means one thing in Kansas, another in the Northwest—new barns going up in the plains, headaches with fluid class in the West. What’s striking, if you circle back with any co-op lead or new face from Montana to the Southeast, is that Jim didn’t duck the bumps. “Processors wanted unity for the Farm Bill, but the pandemic called the bluff—the formula needed rewriting. Still, we got folks back at the table and eventually hammered it out.” Grumbling’s still common (just call Vermont), but, as one co-op chair reminded me, “predictable beats chaos in my mailbox.”

Stewardship—Not Buzz, Just How You Farm

Sustainability’s trendy on the panel circuit, but “stewardship”—that’s been inside farming forever. Jim credits his convictions to watching families, his and others, do more with less, finding ways to turn waste into value, and always prepping for next year.

Ask the digester crew in Yakima. Or Florida operators who count every rainstorm and stretch a cover crop for two seasons. Policy eventually caught up: “We’ve cut emissions, improved yields, done more with less. Maybe, finally, that story is landing with customers and Congress.”

The Unfinished Battles: Immigration and Trade

You can measure most farm headaches by the grumble at Bullvine coffee hours, and nothing comes up more than labor and trade. Western herds, New York recalls, up into Quebec—if you don’t have crew, or if a new market wall goes up, everything halts. Jim’s honest about it: “Progress or not, it isn’t done until the guys in the parlor feel a difference.” Right now, Congress is stuck. And in ag, policy’s only as good as its impact before sunrise.

Labels, School Milk, and the Small Battles

Want to get Mulhern animated? Bring up almond “milk.” “Fake products using real dairy terms—FDA should’ve stepped in years ago.” And getting whole milk back in schools? If you’re not convinced, check in with a school nutrition lead in the Upper Midwest. “What we feed kids isn’t just a menu—it’s a message to the next generation.”

Passing the Torch—Not Just Polished Shoes on the Boardroom Floor

Ask Jim about wins, and he talks about his team, not tallies. “Building up smart, driven staff—beating paperwork by a mile,” he’ll say if you push. A real legacy isn’t a retirement countdown; it’s whether the next generation takes the lessons and actually runs with them.

Gregg Doud’s taking over, and from what Mulhern’s said publicly, the endorsement couldn’t be clearer: ‘Gregg is an established leader with a wealth of experience in ag policy. He knows the issues well, and he knows how to get things done.’ As more than one industry observer has noted, Jim’s legacy isn’t about grand gestures—it’s about leaving the field a little more level than he found it.

The Bottom Line—From the Parlor to the Boardroom

When you talk legacy around here, don’t glance at the plaque. Remember a neighbor scraping through a thin season thanks to a new rule, a check that cleared, or maybe just the right frank call at the right time. Sometimes it’s small, sometimes it makes the difference between getting the next shipment of feed or not.

You spot Jim Mulhern at Expo, maybe catching a sunrise before the barns get busy? You don’t need to make a speech. A nod—or a simple thank you—does the trick. The glue in this business has always been the unsung folks, steady at the wheel while the rest of us are milking before dawn.

Here at The Bullvine, that’s the vantage point we stand by: from the muddy middle, never giving up, proud of the next mile. Telling stories that help us all do it again, season after season.

Key Takeaways

  • Jim Mulhern’s legacy is defined by practical, producer-first leadership—he prioritized compromise, collaboration, and real-world policy solutions that mattered at the farm level.
  • His tenure saw major wins for dairy risk management (notably the DMC program), FMMO modernization, and timely COVID relief, helping stabilize milk checks and ensure producer survival through volatile markets.
  • Mulhern’s approach was always rooted in listening, unity, and finding common ground, even amid fierce regional and industry divides.
  • Ongoing challenges like labor, immigration, and global trade remain urgent—not “wrapped up” as he exits, but spotlighted as unfinished business for the next generation.
  • Beyond the boardroom, Mulhern is remembered for championing dairy’s true values—stewardship, authenticity, and resilience—leaving U.S. dairy better prepared for whatever comes next.

Executive Summary

Jim Mulhern’s legacy as retiring NMPF President isn’t written in speeches or boardroom victories—it’s measured season by season, in the everyday resilience of dairy producers his work helped sustain. Drawing on Midwestern roots and a knack for compromise forged as the middle child in a large family, Mulhern led policy moves like FMMO modernization and the Dairy Margin Coverage program that directly impacted milk checks in tough years. He was known for human-scale leadership: listening, cutting through politics, and prioritizing practical solutions that reached the parlor as much as the Capitol. The article spotlights Mulhern’s industry role in navigating regional divides, rallying co-ops, and meeting challenge after challenge—from market risk to labor and trade demands—with humility and relentless advocacy. Through anecdotes, peer insight, and grounded storytelling, it connects his legacy to themes of stewardship, collaboration, and the quiet determination that defines the dairy industry’s backbone. Even as he steps aside for a new generation, Mulhern’s mark endures in the unity he fostered and the real-world relief he delivered when it counted most.. This is the story of a leader whose true victories remain etched in seasons survived, not just awards won.

Learn More:

The Sunday Read Dairy Professionals Don’t Skip.

Every week, thousands of producers, breeders, and industry insiders open Bullvine Weekly for genetics insights, market shifts, and profit strategies they won’t find anywhere else. One email. Five minutes. Smarter decisions all week.

NewsSubscribe
First
Last
Consent

The Dairy Apocalypse of 2025: Why Your Milk Check Is Disappearing and Who’s Profiting from It

Milk prices crash 15% as trade wars erupt & new policies gut profits. Can dairy farmers survive 2025?

EXECUTIVE SUMMARY: US dairy faces a perfect storm in 2025: Plummeting milk prices (USDA slashes forecasts by $1.50/cwt), crippling tariffs locking exporters out of China/Mexico, and FMMO reforms reinstating $millions from producers to processors. HPAI outbreaks rage unchecked, while tight heifer supplies, and policy inertia expose farmers. Survival demands radical shifts-optimizing components over volume, aggressive risk management, and treating biosecurity as profit protection.

KEY TAKEAWAYS:

  • Milk checks nosedive: 2025 prices projected at $21.10/cwt (-15% from 2024), with Class IV hit hardest (-$2.55).
  • Trade wars backfired: 135% Chinese tariffs and Mexico/Canada retaliation threatened $1+/cwt price drops.
  • FMMO “modernization” = wealth transfer: Higher processors make allowances slash farm payouts, favoring fluid-heavy regions.
  • HPAI is the new normal: 1,000+ herds are infected, production losses are up to 15%, and no vaccine will be until 2026.
  • Adapt or collapse: Component-focused feeding, blended risk strategies, and biosecurity investments separate survivors from casualties.
dairy market outlook 2025, US milk prices, dairy trade tariffs, FMMO modernization, HPAI dairy cattle

The 2025 dairy industry faces a perfect storm that nobody wants to discuss. Milk prices are in free fall, with USDA slashing forecasts by $1.50/cwt in just 90 days. Meanwhile, bureaucrats are ramming through FMMO “reforms” that will drain millions from producers’ pockets through bloated make allowances, all while government-imposed trade wars lock us out of our most valuable export markets. And if that wasn’t enough, HPAI continues to ravage herds nationwide, with regulators pretending they’ve got it under control. The days of $23 milk and $4 corn are dead and buried.

The data doesn’t lie, folks. After riding high on record-breaking $16/cwt margins in late 2024, dairy producers are staring at a financial cliff in 2025. Let’s cut through the spin and get to the ugly truth about what’s happening to your milk check this year.

Your Disappearing Milk Price

Remember February, when USDA economists confidently projected a 2025 all-milk price of $22.60/cwt? That number has evaporated faster than dew on a summer morning in Texas. By March, it mysteriously dropped to $21.60. The latest May forecast? A pathetic $21.10/cwt.

That’s not a rounding error – it’s a $1.50/cwt heist in just 90 days. For a 500-cow dairy producing 25,000 pounds per cow annually, we’re talking about $187,500 in vanished income. When’s the last time an “adjustment” cost you nearly $200K?

Every month this year, USDA forecasters have slashed their milk price predictions while offering zero explanation for why they got it so wrong the month before. This isn’t meteorology, where predictions naturally become more accurate over time – it’s economics, and this pattern of consistent downward revisions reveals either incompetence or a deliberate attempt to mask how bad things are getting.

Look at what’s happening to your milk check:

Price Indicator2024 (Actual/Est.)2025 (Latest Forecast)Change
All-Milk Price$22.61/cwt$21.10/cwt-$1.51
Class III Price~$19.00/cwt$17.60/cwt-$1.40
Class IV Price$20.75/cwt$18.20/cwt-$2.55

The spotty good news? Feed costs remain relatively stable. But don’t celebrate yet – the projected declines in milk prices will still outpace any savings on your feed bill. It’s like finding a nickel in the parlor drain the same day your milk truck jackknifes on the highway.

The Trade War Nobody’s Talking About

While economists drone on about “shifting market fundamentals,” they’re tiptoeing around the elephant in the milking parlor: we’re in an unprecedented trade war systematically dismantling decades of market development.

In March, the administration unleashed a barrage of new tariffs – 25% on nearly all imports from Mexico and Canada and escalating rates on Chinese goods. Did anyone bother to ask dairy farmers if they wanted to sacrifice their export markets on the altar of immigration politics? The predictable result? Swift and severe retaliation targeting US dairy:

  • China slapped additional tariffs of 10-15% on US dairy products, pushing effective rates to an eye-watering 135%
  • Mexico announced its retaliatory measures against US goods
  • Canada immediately hit back with tariffs on approximately $21 billion of US products

The impact has been immediate and devastating. Nonfat dry milk/skim milk powder exports have collapsed 20% year-over-year, while lactose exports are down 14%. The critical dry whey market faces crippling tariffs of 84% to 150% in China.

Here’s what dairy economists won’t say publicly: this isn’t a typical trade dispute – it’s a full-scale market destruction that could take a decade to rebuild. When’s the last time you heard industry leaders acknowledge this reality instead of offering tepid statements about “hoping for resolution”?

The timing couldn’t be worse. New domestic cheese processing capacity is coming online just as international markets are slamming their doors in our faces. With no place for this additional production, the pressure on domestic prices will only intensify.

This is pure politics trumping economics. According to industry analysts, each posturing speech about “getting tough” on trade costs dairy farmers real money – about /cwt in Class III prices alone. That’s not theoretical – that’s your mortgage payment.

FMMO Reform: The Great Dairy Robbery

After years of debate and months of hearings, the Federal Milk Marketing Order modernization takes effect on June 1st. But before you celebrate this “achievement,” you might want to check which side of the dividing line you’re standing on – because this reform is nothing short of a massive wealth transfer.

The most crucial change is getting the least attention: substantially higher make allowances for processors. These allowances are increasing to $0.2519/lb for cheese, $0.2272/lb for butter, $0.2393/lb for NDM, and $0.2668/lb for dry whey.

Let’s call this what it is: a direct transfer of money from farmers to processors. Higher make allowances mathematically reduce the milk price paid to farmers. Period. Industry representatives frame this as “necessary adjustments reflecting higher processing costs,” but the reality is simpler: processors get guaranteed margin relief while farmers bear all the market risk.

When processors face higher costs, they get an automatic adjustment. When your diesel or labor costs skyrocket, where’s your automatic adjustment? The hypocrisy is stunning, yet industry organizations dominated by processor interests have convinced farmers to vote for their financial disadvantage.

And here’s where it gets interesting. The net impact will vary dramatically by region:

  • If you’re producing milk in the Southeast, Florida, or Appalachia Orders where fluid utilization is high, congratulations – you’ll likely see a net benefit from these changes.
  • But are you in the Upper Midwest, Pacific Northwest, California, or Arizona? You’re about to get fleeced. The higher make allowances will hit you hard, while your region’s manufacturing-heavy utilization will dilute the benefits of Class I changes.

This regional disparity raises a fundamental question: Should dairy policy create winners and losers based on geography rather than efficiency? Does penalizing regions that have invested billions in creating efficient manufacturing infrastructure make sense? The data suggests that the FMMO changes reward location over innovation, potentially distorting signals for long-term industry development.

HPAI: The Disease They Can’t Control

While policymakers debate prices and tariffs, dairy farmers face a more immediate threat: the relentless spread of Highly Pathogenic Avian Influenza (HPAI) in cattle. Despite more than a year of intervention efforts, this crisis is accelerating, not receding.

As of April 2025, HPAI had been confirmed in dairy cattle on over 1,009 premises across 18 states – a dramatic increase from the 16 states reported in late 2024. The states with the highest number of affected herds include California (with approximately 765 affected herds), Idaho (65), Colorado (64), Michigan (31), and Texas (27).

The most alarming finding? Scientists have identified multiple viral strains, confirming at least two spillover events from wild birds into dairy herds. This means the threat isn’t just from cattle movement – even operations with strict biosecurity remain vulnerable to environmental exposure from wild bird populations.

Why isn’t this front-page news? If a virus affecting food production had infected over 1,000 operations in any other industry, it would be deemed a national emergency. Yet HPAI has been normalized, with USDA officials repeating reassurances while case numbers climb.

The impact on affected farms is significant: reduced appetite, decreased milk production (estimated at 10-15% in clinical cases), and changes in milk consistency. While mortality rates remain relatively low, production losses can devastate farm economics.

California’s experience illustrates the scale of impact. In October 2024, the state’s milk production was down a dramatic 3.8% year-over-year, partly attributed to HPAI infections. As the virus spreads through 2025, similar production declines could emerge in other major dairy regions.

The USDA’s response, including the National Milk Testing Strategy and enhanced biosecurity recommendations, has failed to contain the spread. Let’s be honest about where we stand: regulators have shifted from containment to management after over a year. The virus is here to stay.

Breaking With Conventional Wisdom

Let’s challenge some sacred cows in the dairy industry:

1. The “Produce More” Mentality Is Dead

For decades, the standard advice during low-price periods has been to maximize production to spread fixed costs. This outdated thinking is financial suicide in today’s market. While the industry mantra has been “produce more to spread fixed costs,” the economic reality has fundamentally changed.

Instead of chasing volume, leading producers are pivoting to component optimization. With cheese prices showing relative strength compared to other products, farms focusing intensely on butterfat and protein percentages rather than raw volume are capturing premium returns despite lower overall prices.

“We’ve shifted from a volume mindset to a component value mindset,” explains one Wisconsin producer whose operation has maintained profitability despite the market downturn. “Our nutritionist now formulates rations to maximize component yield rather than total production. It’s completely changed our approach to feeding.”

Would you rather ship 80 pounds of 3.8% fat, 3.3% protein milk or 90 pounds of 3.5% fat, 3.0% protein milk? Do the math – the lower volume, higher component milk is worth significantly more in today’s market, with lower hauling costs.

2. Risk Management Isn’t Optional – It’s Essential

Too many producers still treat risk management as something only big dairies need to worry about. That mentality is financial suicide in today’s volatile market. The most successful operations have abandoned the all-or-nothing approach to risk management.

Instead of either fully contracting or staying completely exposed to the market, they’re employing blended strategies that combine:

  • Targeted contracts for specific periods based on margin opportunities
  • Strategic use of put options to establish price floors while maintaining upside
  • Maintaining a portion of production unhedged to capture potential market improvements

Think of risk management like your breeding program – you’d never breed your entire herd to a single bull with extreme traits. You select a group of sires with complementary strengths to manage genetic risk. Your marketing approach should follow the same diversified strategy.

What Smart Producers Are Doing Differently

Faced with falling milk prices, export disasters, policy upheaval, and disease threats, smart dairy farmers aren’t waiting for conditions to improve – they’re taking decisive action now:

1. Biosecurity as a Profit Center, not a Cost

Forward-thinking operations have reconceptualized biosecurity from a regulatory burden to a profit-protection strategy. These farms aren’t just implementing basic HPAI prevention measures; they’re treating disease prevention as a core business function with dedicated staff, regular training, and rigorous protocols.

“We’ve stopped thinking about biosecurity as something we do to satisfy regulators,” notes a California producer who has kept HPAI at bay despite being surrounded by affected operations. “Now we treat it like we treat cow comfort or nutrition – as a direct driver of profitability that deserves significant time and investment.”

Consider the return on investment: spending $15,000 on enhanced bird deterrents, boot wash stations, and dedicated equipment between pens might seem excessive until you calculate the $85,000 lost milk revenue from even a moderate HPAI outbreak in your herd. The prevention math suddenly looks compelling.

2. Feed Efficiency: The New Production Frontier

With milk prices falling faster than feed costs, the margin between the two is compressing rapidly. In response, innovative producers are doubling on feed efficiency programs that reduce production costs by $0.75-1.25/cwt.

These initiatives go far beyond basic ration balancing, incorporating:

  • Intensive forage quality programs that maximize digestibility
  • Precision feed management systems that reduce shrink and waste
  • Genomic selection specifically targeting feed conversion efficiency

“We can’t control milk prices, but we absolutely can control how efficiently our cows convert feed to milk,” explains a New York producer who has reduced feed costs by over $1/cwt in the past year. “That’s where our focus needs to be in this market.”

Every pound of feed lost to shrinkage, sorting, or spoilage is pure profit leakage. Are you treating your silage face management with the same precision you apply to your synchronization protocols? Both directly impact your bottom line.

The Bottom Line

The 2025 dairy landscape presents unprecedented challenges: systematically lower milk prices, destructive trade policies, confusing order reforms, and a persistent disease threat. The combined impact creates a perfect storm that will test even the most efficient operations.

Here’s what you need to understand:

  1. Official forecasts have consistently underestimated the severity of price declines – expect continued downward pressure through 2025 as export markets remain constrained and domestic production increases.
  2. The trade war is not a temporary disruption but a fundamental reshaping of market access that could take years to resolve – plan accordingly rather than hoping for a quick fix.
  3. FMMO changes taking effect mid-year will create significant regional disparities – understand exactly how they’ll impact your operation’s specific milk check calculation.
  4. HPAI remains uncontained and will continue to spread despite official intervention – investing in rigorous biosecurity isn’t optional but essential for financial survival.
  5. Component optimization, strategic risk management, biosecurity investment, and feed efficiency programs aren’t just marginal improvements but essential strategies for navigating this challenging environment.

Are you still operating with a 2023 mindset in a 2025 market? The rules have fundamentally changed. Those waiting for markets to “return to normal” will be waiting for a train never arriving. Instead of hoping for better days, take control of what you can influence: your components, your risk management, your biosecurity, and your feed efficiency.

The question isn’t whether conditions will improve – it’s whether you’ll still be in business when they do. The dairy industry has weathered difficult periods, but 2025 presents complex challenges. Success will require abandoning outdated assumptions, embracing uncomfortable realities, and implementing bold strategies that challenge conventional wisdom.

What are you changing today to ensure you’re still milking cows in 2026?

Learn more:

The Sunday Read Dairy Professionals Don’t Skip.

Every week, thousands of producers, breeders, and industry insiders open Bullvine Weekly for genetics insights, market shifts, and profit strategies they won’t find anywhere else. One email. Five minutes. Smarter decisions all week.

NewsSubscribe
First
Last
Consent
Send this to a friend