


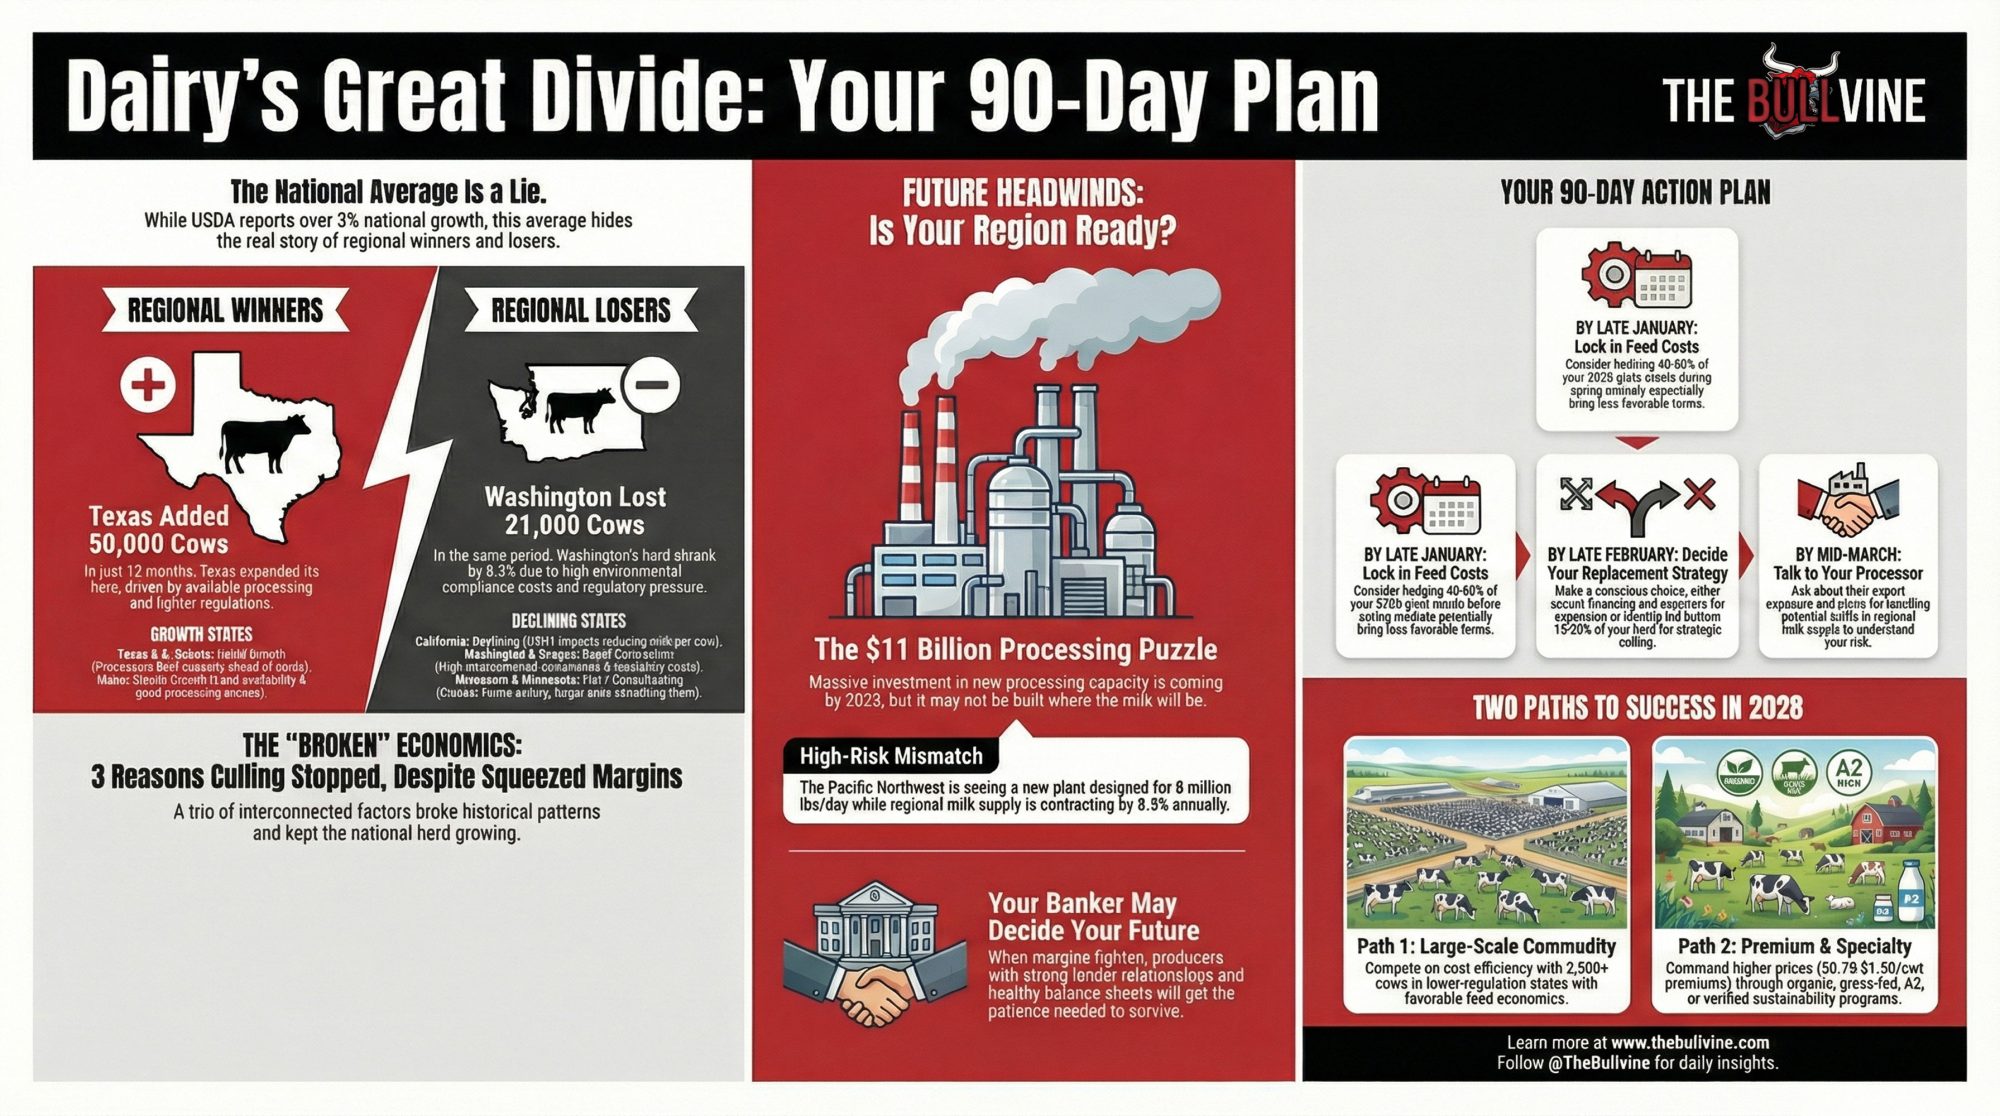
Here’s the thing about national averages—they can hide more than they reveal. While USDA reports 3%+ growth, one state added 50,000 cows and another lost 21,000. Let me walk you through what’s really happening and the decisions that matter most before spring.

Executive Summary: Here’s what the national dairy numbers aren’t telling you: Texas added 50,000 cows last year while Washington lost 21,000—and both get averaged into that 3% growth everyone’s celebrating. Three self-reinforcing factors explain why herds haven’t contracted despite margin pressure: heifer prices above $3,400, making culling uneconomical; beef-on-dairy breeding consuming 25% of the herd’s replacement capacity; and feed costs near multi-year lows. Add $11 billion in new processing capacity coming online through 2028—much of it potentially misaligned with where milk will actually be produced—and you’ve got an industry approaching a meaningful reset. Smart producers have a 90-day window to hedge feed costs, lock in replacement strategies, and have honest conversations with their processors and bankers. The operations that come out ahead won’t just be the best operators—they’ll be the ones who understood their regional trajectory and kept enough flexibility to move when the time came.
You’ve seen the headlines by now. Milk production up. Herd expanding. Cheese exports are hitting records.
Now here’s what those numbers don’t tell you.
There isn’t one U.S. dairy industry anymore. There are at least two, maybe three—and they’re operating under completely different conditions, facing completely different futures. A producer in the Texas Panhandle and a producer in Washington’s Yakima Valley might see similar milk prices on any given month. But you know what? They’re playing entirely different games right now.
I should mention upfront: not everyone sees it this way. I was talking with a consultant last month who made a pretty compelling case that strong export demand signals continued growth across the board. And honestly, the optimists might be right. But the regional divergence I’ve been tracking suggests the headline numbers are masking something we all need to understand.
So let me show you what I mean.
The Great Divide: Where Dairy Is Growing vs. Where It’s Shrinking
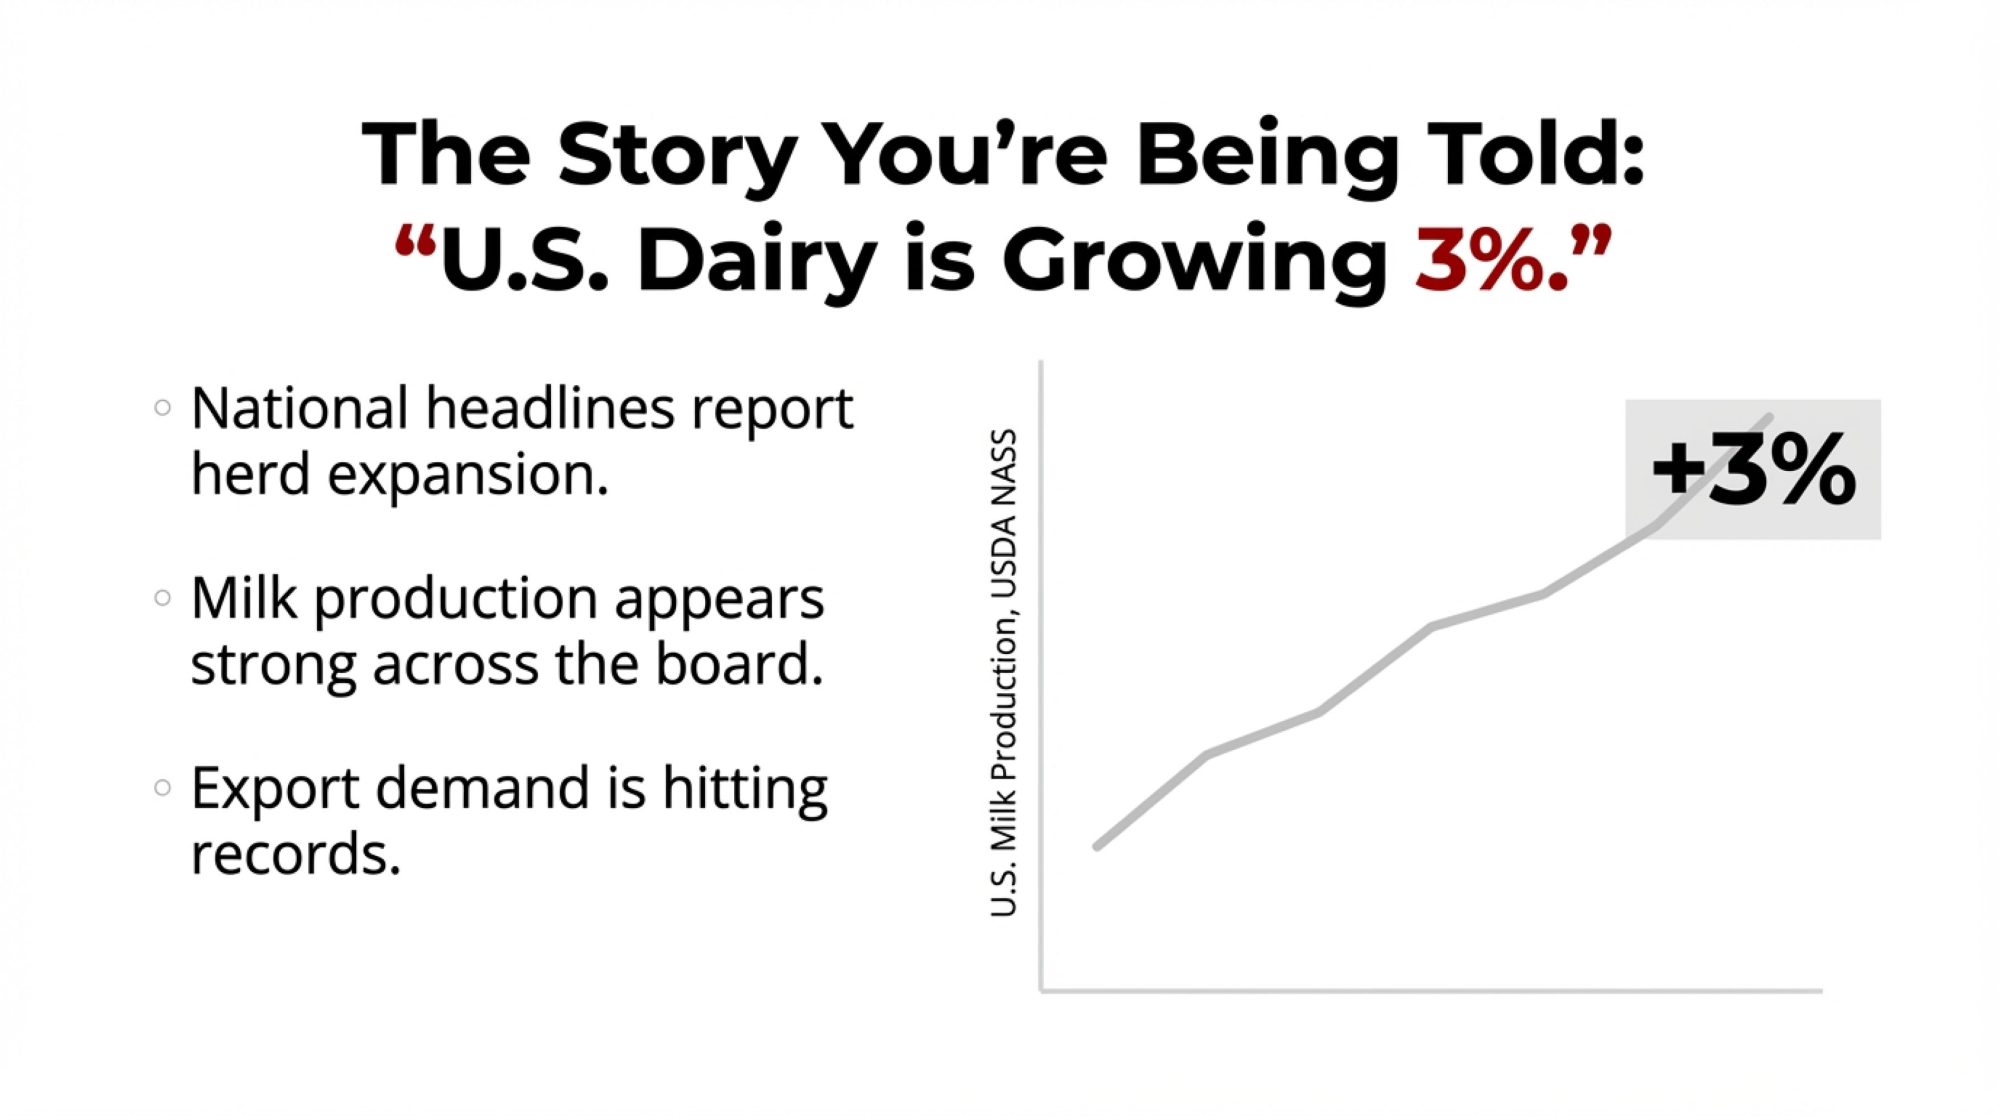
That national milk production number everyone’s quoting—up more than 3% in August according to USDA NASS—is really just the average of dramatically different regional stories.
Here’s how it actually breaks down:
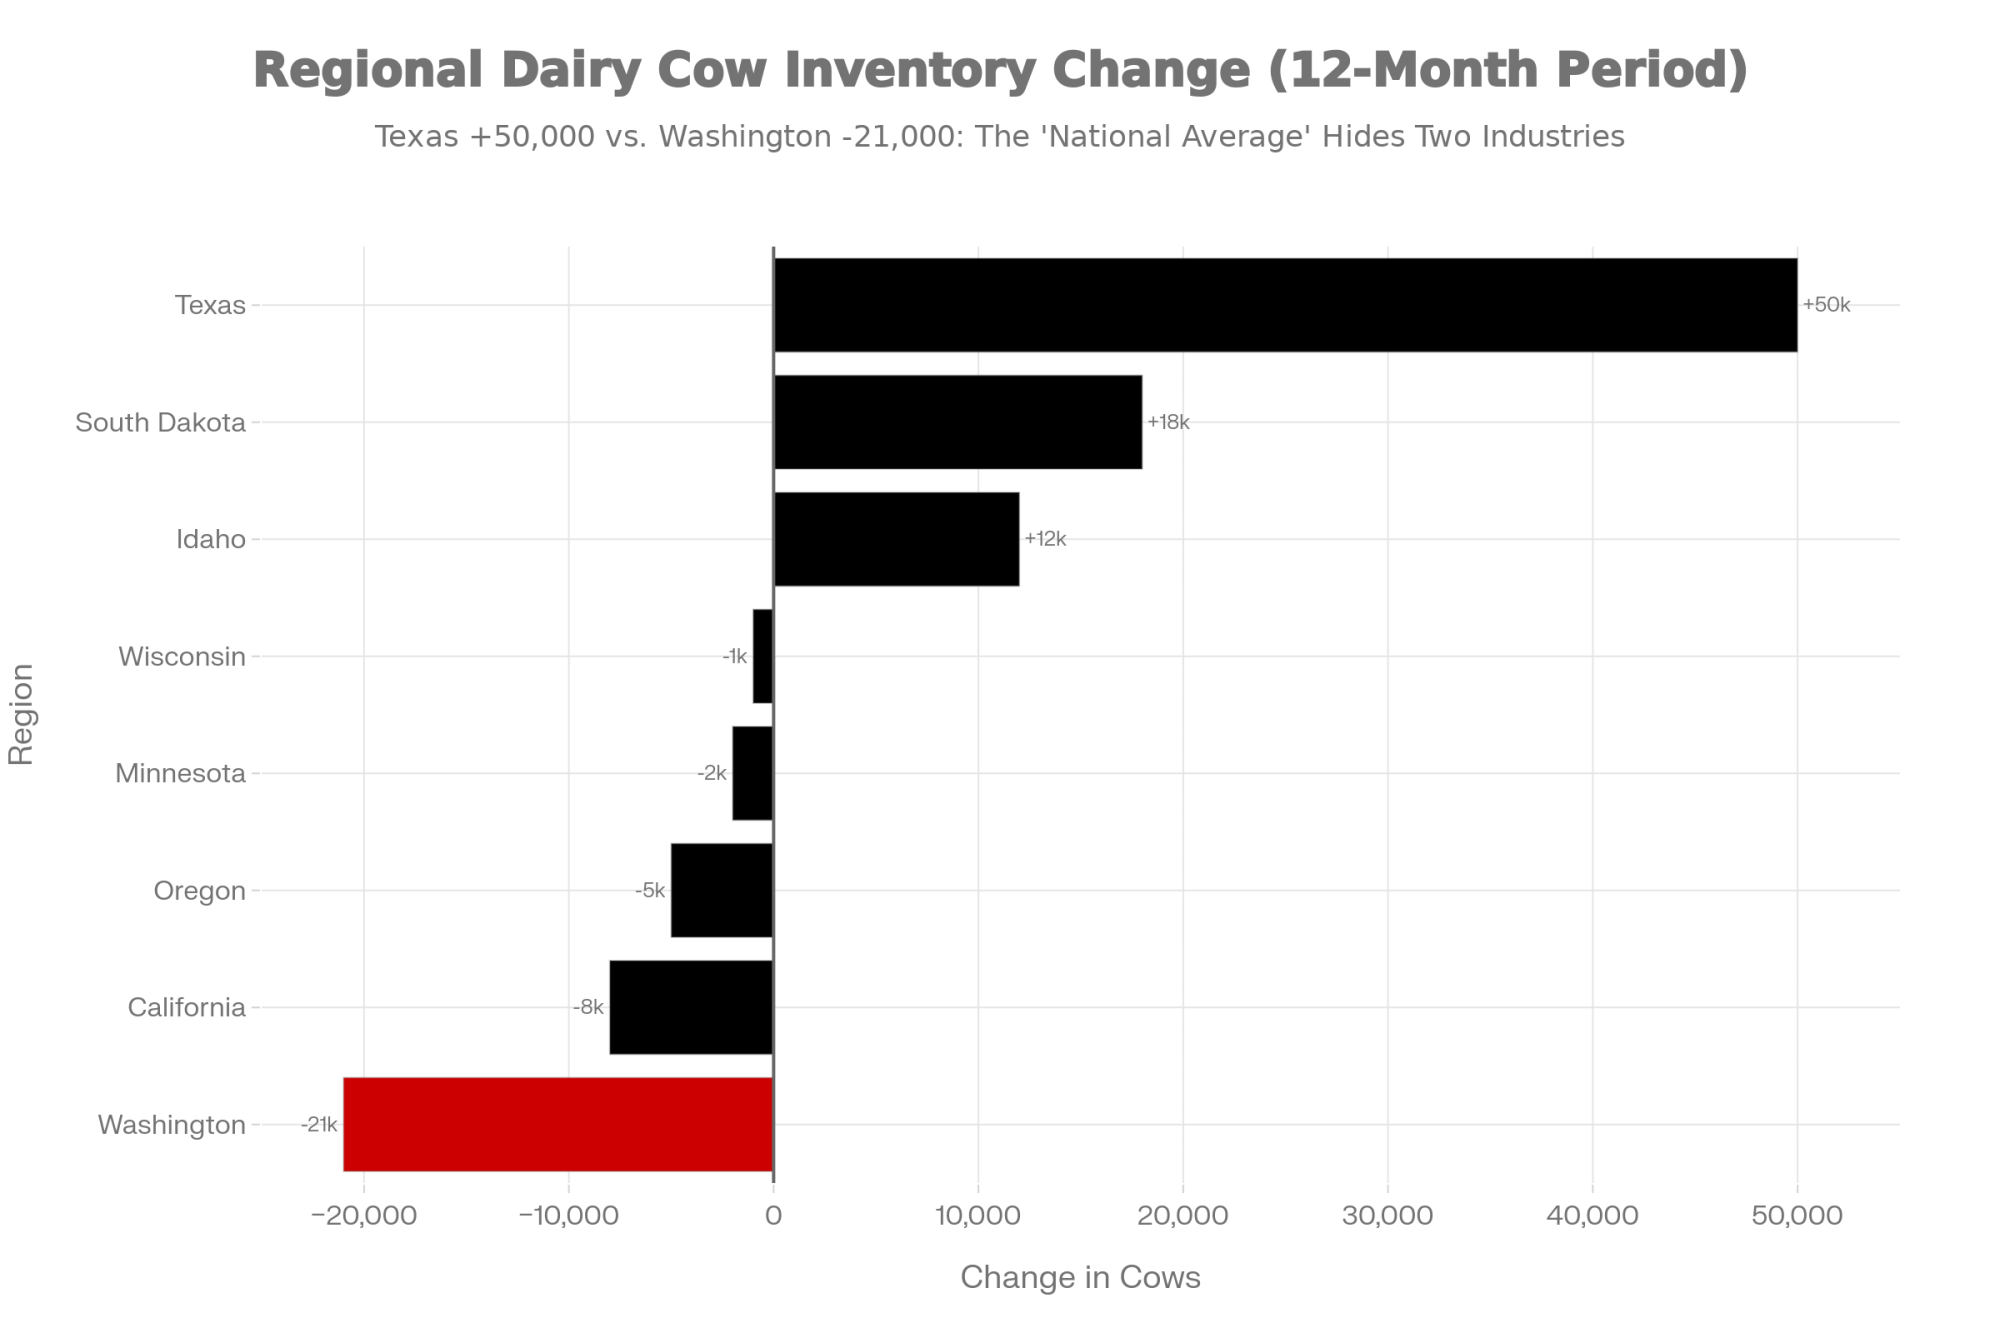
| Region | What’s Happening | The Numbers | What’s Driving It |
| Texas | Rapid expansion | +50,000 cows in 12 months | Processing built ahead of herds; lighter regulations |
| South Dakota | Strong growth | Valley Queen is adding capacity for 25,000 cows | Processor investment is pulling producers in |
| Idaho | Steady growth | Continued herd expansion | Land availability; good processing access |
| Wisconsin | Flat, consolidating | Production is barely above flat in 2025 | Smaller farms exiting; larger ones absorbing neighbors |
| Minnesota | Consolidating | Steady structural change | Similar pattern to Wisconsin |
| California | Declining | Production down despite stable herd | H5N1 impacts; milk per cow dropping |
| Washington | Rapid contraction | -21,000 cows year-over-year; -8.5% output | Environmental compliance costs; EPA involvement |
| Oregon | Steady decline | Continued farm attrition | Air quality regulations; rising costs |
Data from USDA NASS September 2025, Dairy Herd Management, Farmers Advance, and IDFA analysis
You see what’s happening here? Texas added enough cows to fill a major cooperative. Washington lost enough to empty one. And we’re calling that a “national trend.”

What’s Fueling the Growth States
I had a chance to tour a newer Texas Panhandle operation last spring, and a few things really stood out to me.
First—and this is important—the processing came before the cows. Cheese plants in Dumas, Amarillo, and Lubbock were already running when producers started expanding. That sequencing matters more than people sometimes realize. You don’t have to wonder where your milk’s going when there’s a plant down the road hungry for supply.
The feed economics work differently out there, too. Land costs and crop prices create structural advantages that are hard to replicate in traditional dairy regions. And while Texas certainly has regulations, the overall compliance burden is measurably lighter than that faced by coastal operations.
South Dakota’s telling a similar story. Dairy Herd Management reports that Valley Queen’s expansion could accommodate roughly 25,000 additional cows over 2025-2026. The processor built the capacity first. The cows are following.
What’s Driving the Contraction
Now, Washington’s situation… that’s tougher to watch.
A producer I know in the Yakima Valley—third-generation, solid operator—told me he’s spending more time with regulators than with his cows some weeks. That’s an exaggeration, but it captures something real about what’s happening out there.
The challenges are stacking up: groundwater nitrate issues have brought EPA involvement to some operations. The Washington State Department of Ecology is proposing regulations that would substantially increase costs. Labor costs run higher than competing regions. And the result, according to Dairy Herd Management, is 21,000 fewer cows in October compared to the prior year.
California’s dealing with its own complexity—H5N1 outbreaks have hit productivity in numerous Central Valley herds, contributing to declining milk per cow even while the overall herd held relatively steady. It’s a different challenge, but the direction is similar.
Producers Who’ve Made the Move
Not everyone’s standing still, though. I’ve talked with a few producers who saw the writing on the wall and made strategic relocations. One Wisconsin family I know sold their 800-cow operation two years ago and partnered with an established South Dakota dairy. They’re now managing a larger string with better margins and—here’s what surprised them—less overall stress despite the bigger numbers. “The regulatory load alone,” the son told me, “freed up 15 hours a week we used to spend on paperwork.”
That’s not the right move for everyone. Plenty of operations have deep roots, family land, and established processor relationships that make staying put the smarter play. But it’s worth noting that some producers actively choose their region rather than just accept the one they inherited.
The Math Is Broken: Why High Costs Didn’t Shrink the Herd
Here’s something that’s been puzzling economists for months now: margins got squeezed, but culling rates stayed low. The national herd actually grew when every historical pattern said it should contract.
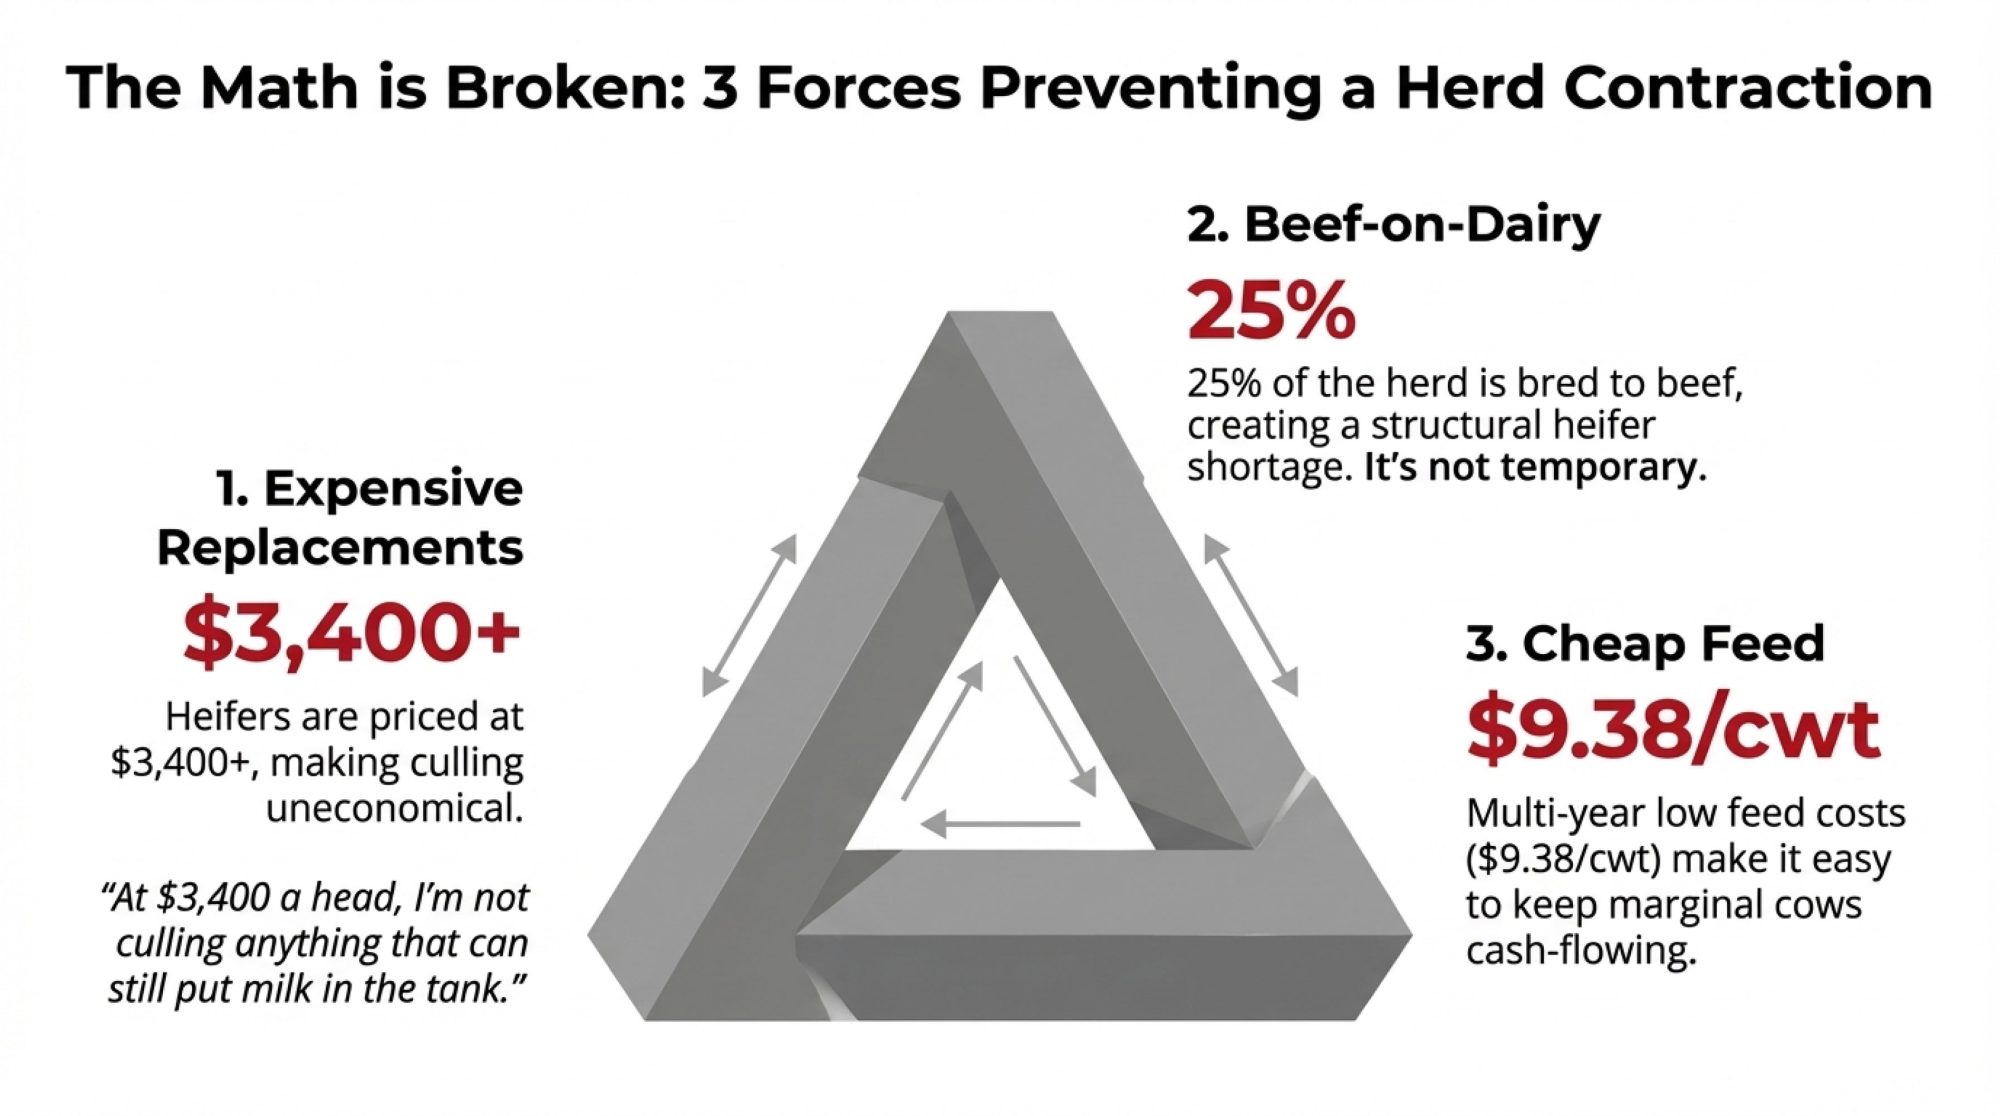
What’s going on? Three factors, and they’re all connected.
Metric | 2022 | 2024 | 2025 |
|---|---|---|---|
| Replacement Heifer Price ($/head) | $2,400 | $2,900 | $3,400 |
| Beef-on-Dairy Breeding Rate (%) | 18% | 22% | 25% |
| Feed Cost ($/cwt) | $11.20 | $10.10 | $9.38 |
| Cull Rate (%) | 38% | 34% | 31% |
| Heifer Shortage Severity | Moderate | Elevated | Critical |
Replacement Heifers Got Really Expensive
You probably know this already if you’ve been to an auction lately. Current prices from USDA Agricultural Marketing Service reports:
- Upper Midwest: $3,200-$3,500 per head for quality replacements
- Premium springers: $4,000+ at some California and Wisconsin auction barns
Mark Stephenson—he’s the director of dairy policy analysis at the University of Wisconsin-Madison—has pointed out that at these prices, payback periods on marginal replacements stretch to nearly 15 years.
I was talking with a 400-cow producer in central Wisconsin who put it pretty simply: “At $3,400 a head, I’m not culling anything that can still put milk in the tank.” And that sentiment seems widespread.
Beef-on-Dairy Changed Everything
This is the part that doesn’t get enough attention, in my view. Council on Dairy Cattle Breeding data shows roughly 25% of the dairy herd is now bred to beef genetics. Those crosses are generating $400-$600 premiums—sometimes more—for quality blacks with good conformation.
But here’s the catch, and it’s a big one: every beef-cross calf is a dairy heifer that doesn’t exist.
The heifer shortage isn’t temporary. It’s structural. And it’s self-reinforcing.
Feed Costs Hit Multi-Year Lows
The USDA Dairy Margin Coverage program calculated feed costs at $9.38 per cwt for August 2025. The Center for Dairy Excellence confirmed that figure—down nearly 50 cents from July. That’s among the lowest readings we’ve seen in years.
When feed is cheap, even that older cow in the back pen—the one you’d normally have shipped by now—can still contribute to cash flow. The economic pressure to cull just isn’t there.
And here’s the trap: These factors reinforce each other. Expensive heifers mean you keep old cows. Keeping old cows means you don’t need expensive heifers. Beef-on-dairy means fewer heifers get born anyway. And cheap feed makes all of it pencil out.
For now, anyway.
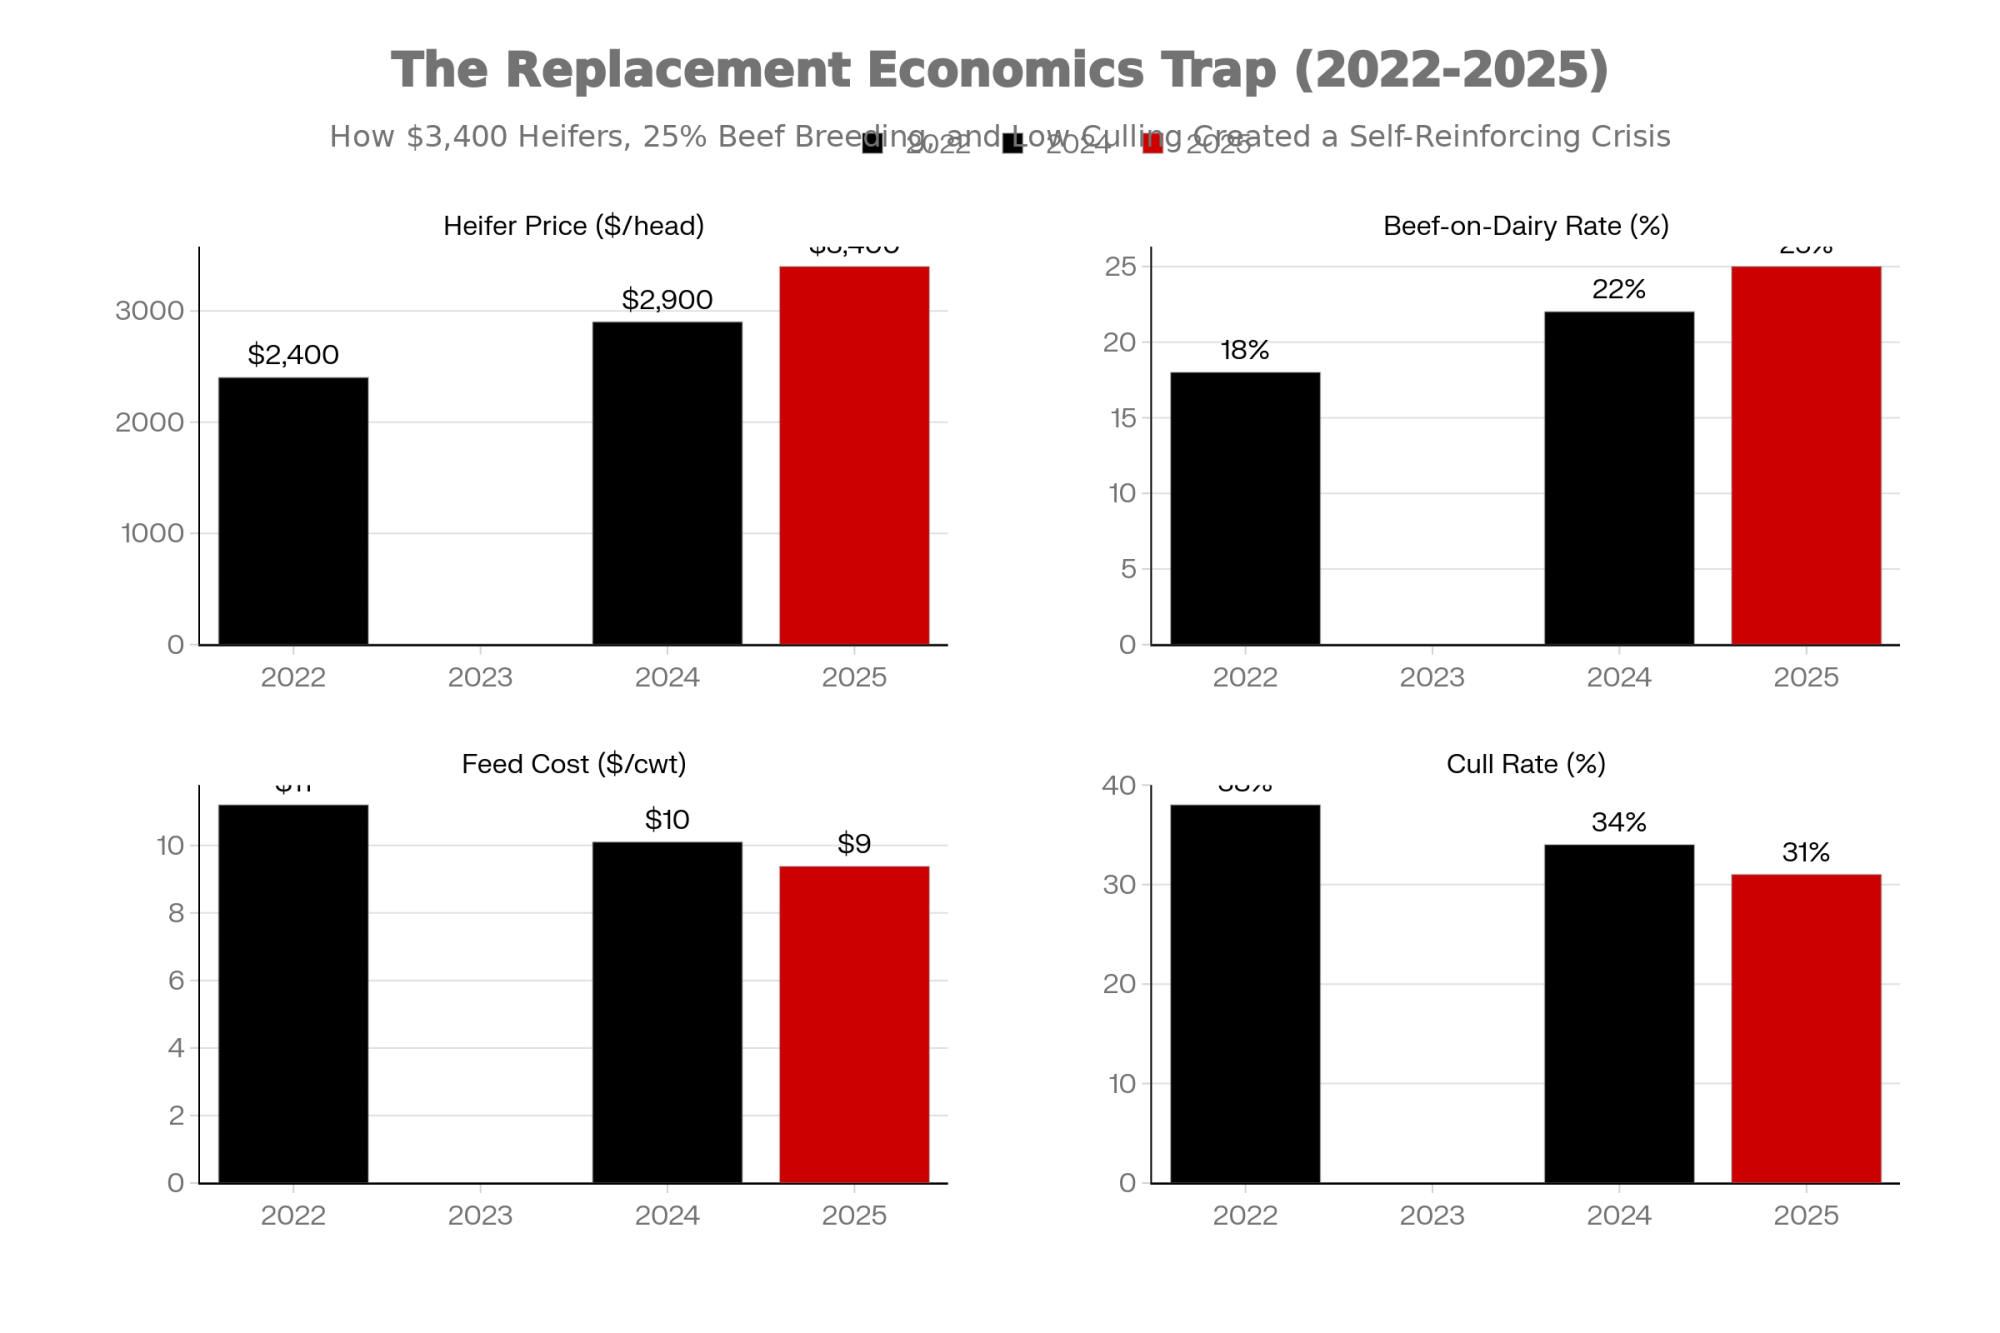
Feed Cost Outlook: Why Many Advisors Are Saying Hedge Now
Here’s what’s interesting about the forward markets. CME Group data shows that December 2026 corn futures are trading above current spot prices. The market’s signaling higher costs ahead.
| Timeframe | What Corn’s Telling Us | What It Means for Feed Costs |
| Right now | Favorable pricing | $9.38/cwt (August DMC calculation) |
| Dec 2026 futures | Higher than spot | Could push toward $11.00+/cwt |
| Normal price swing | +$0.50-$0.75/bushel | Adds $1.50-$2.00/cwt to your feed line |
Now, futures markets have been wrong before—I want to be honest about that. But the signal’s worth noting.
The window to lock in favorable feed pricing may be closing. I’ll get into specific timing in the action steps below.
| Period | Feed Cost ($/cwt) | Futures Signal |
|---|---|---|
| Aug 2025 | $9.38 | Spot (Favorable) |
| Nov 2025 | $9.50 | Favorable |
| Mar 2026 | $10.20 | Rising |
| Jun 2026 | $10.80 | Elevated |
| Sep 2026 | $11.20 | High |
| Dec 2026 | $11.40 | High |
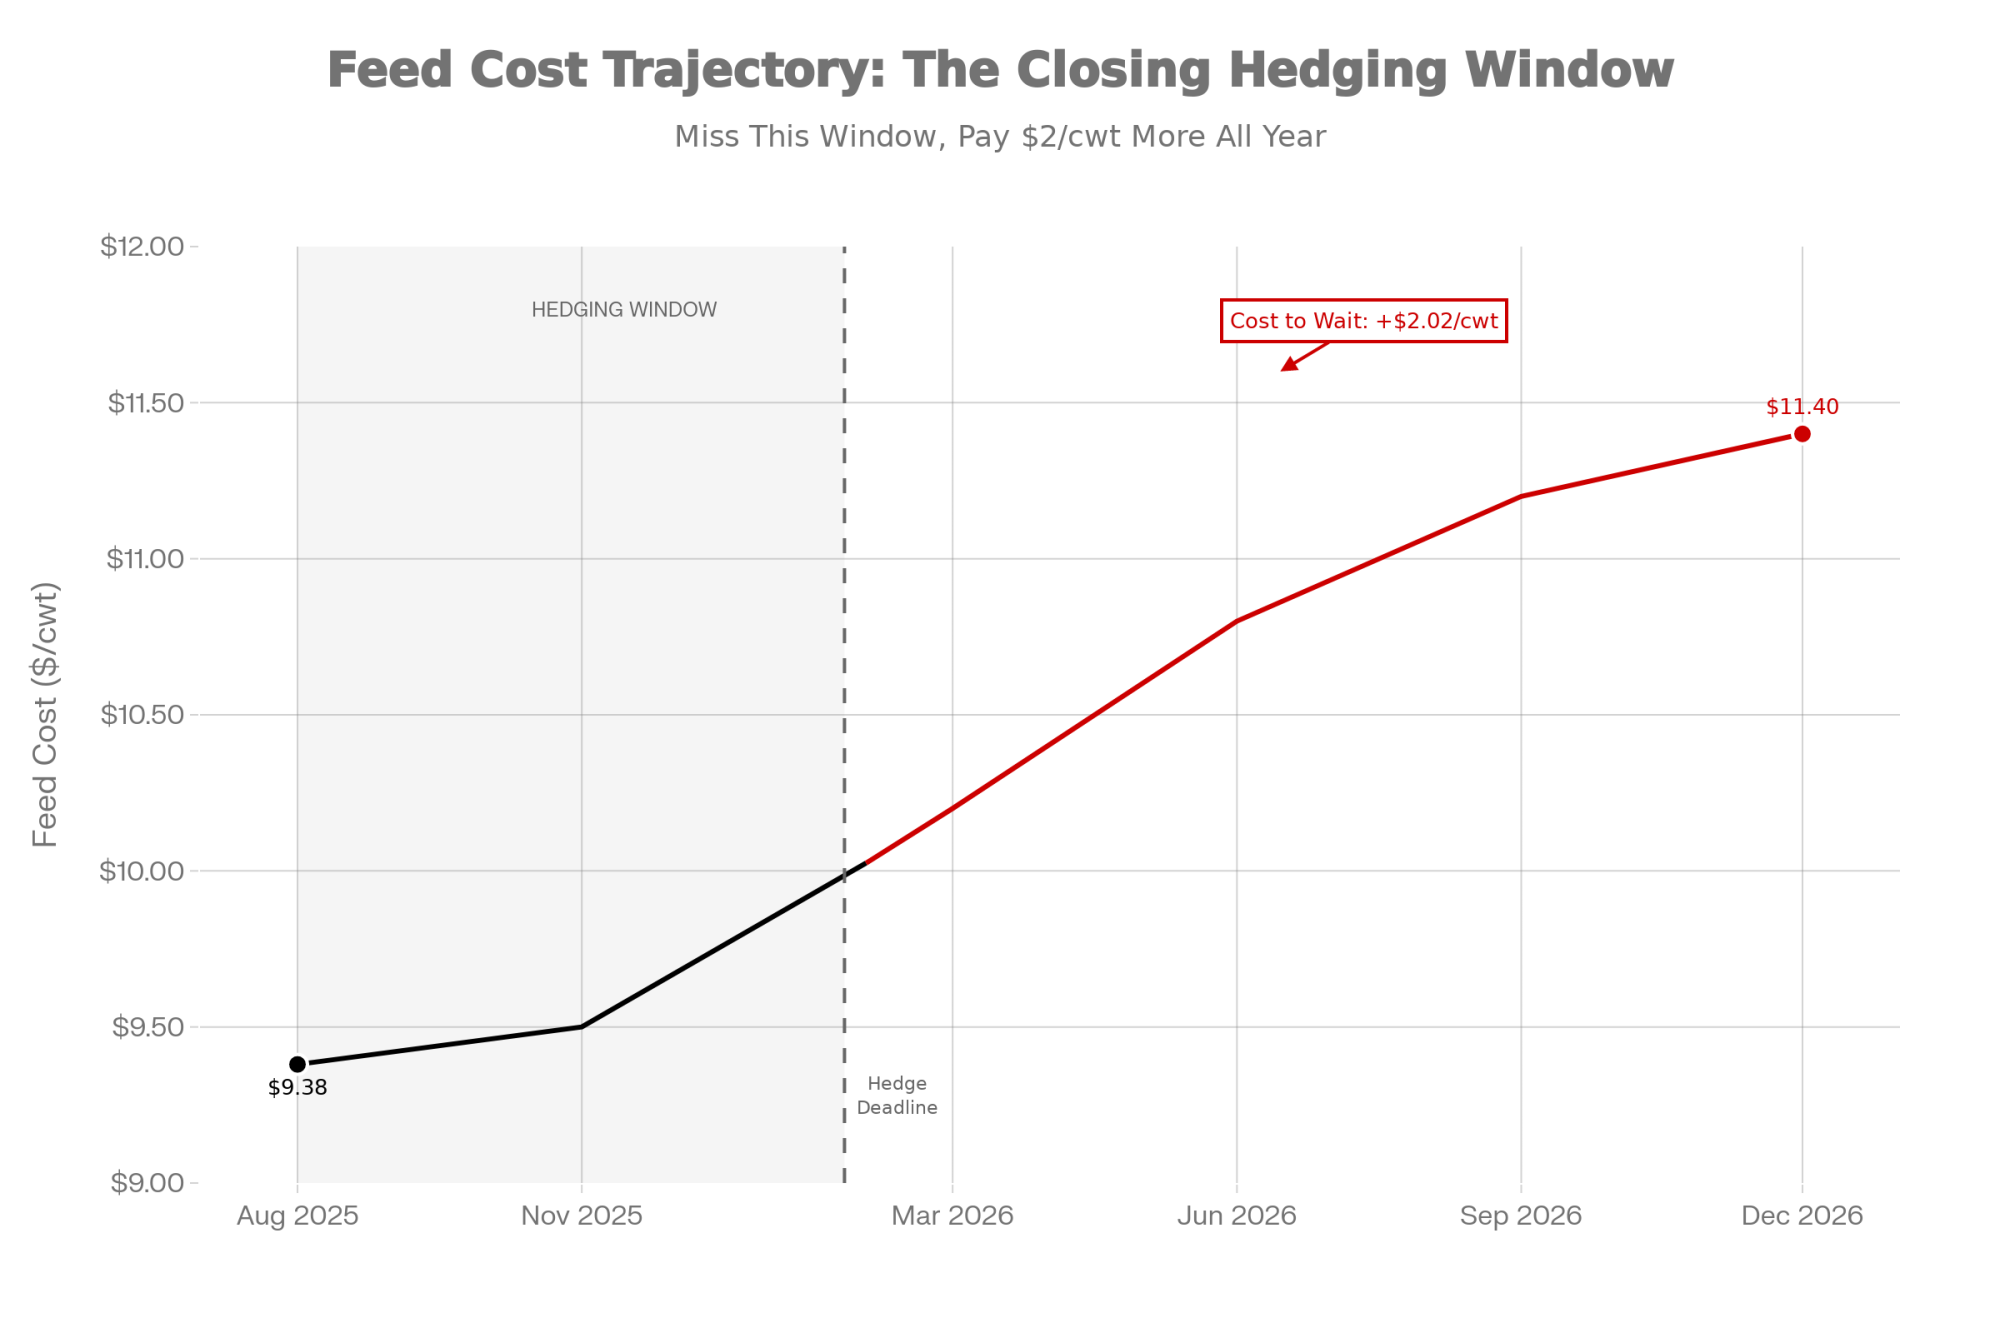
The Processing Puzzle: $11 Billion in New Capacity—But Is It in the Right Places?
IDFA confirmed during Manufacturing Month that more than $11 billion in new dairy processing capacity is coming online through 2028 across 19 states. That’s cheese plants, butter facilities, powder operations, and fluid processing. It’s a massive investment that reflects real confidence in American dairy’s future.
But here’s the question worth asking: Is it being built where the milk will be?
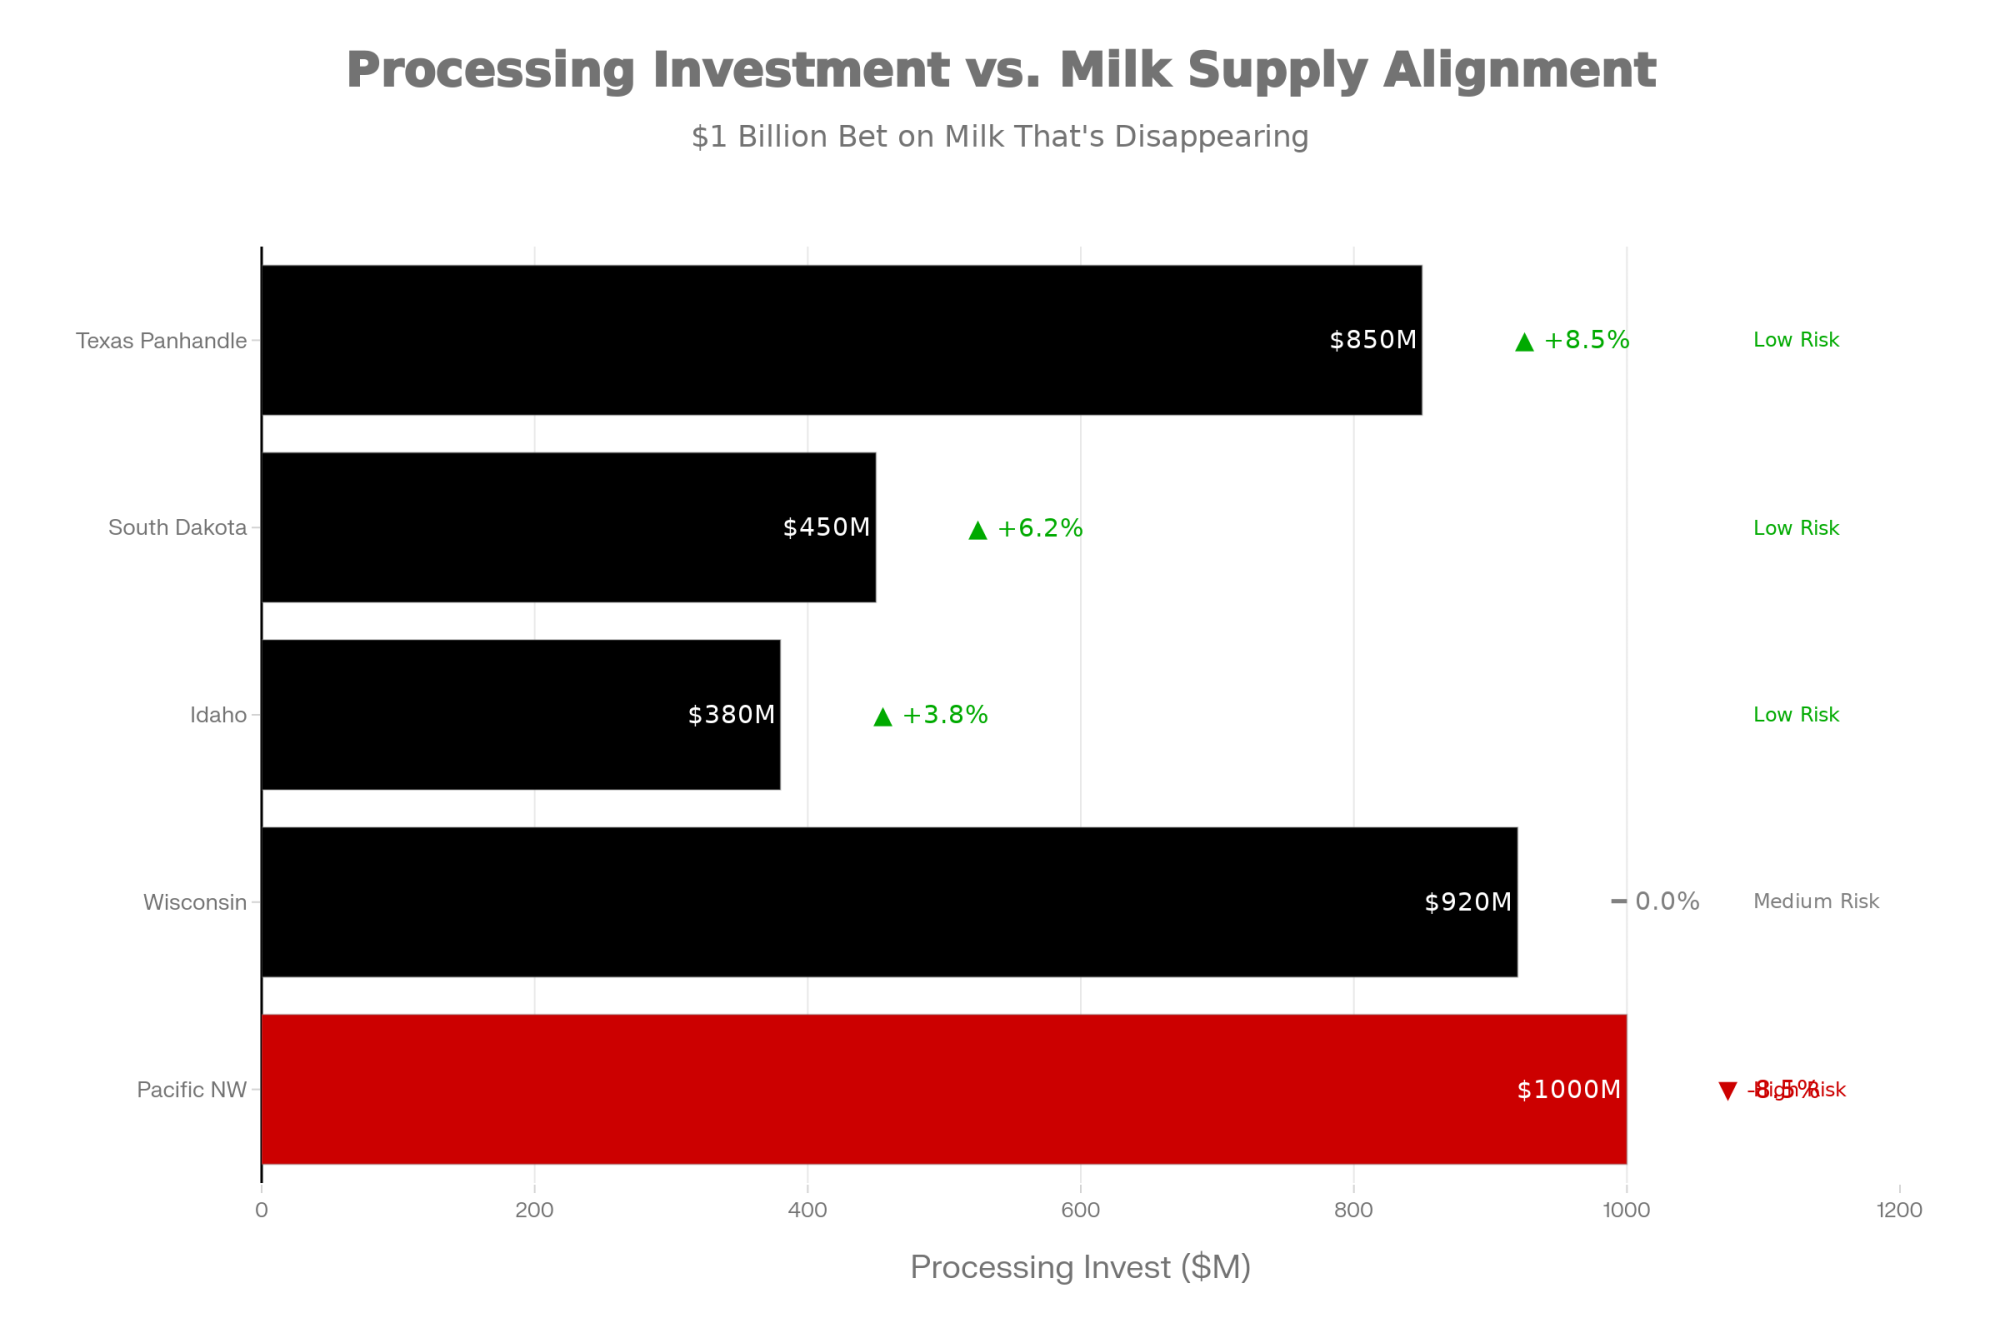
The Mismatch Worth Watching:
| Region | Processing Investment | Milk Supply Trend | What to Watch |
| Wisconsin | Major expansions underway | Essentially flat production | Where does the milk come from? |
| Pacific Northwest | Darigold’s $1 billion Pasco plant (8M lbs/day) | Contracting 8.5% annually | Real supply/capacity tension |
| Texas/South Dakota | Matched to growth | Expanding steadily | Better alignment |
I don’t have a definitive answer on how Darigold plans to fill a billion-dollar facility when regional supply is declining nearly 9% annually. Their leadership clearly sees a path forward that I may not fully appreciate—and they know their market far better than I do.
But facilities built expecting 90%+ utilization that end up running at 70-75%… that financial stress eventually flows somewhere. Often, back to producers through milk payment adjustments or cooperative equity calls. It’s something to be aware of.
The Silent Partner: Why Your Banker Decides Who Survives 2026
Here’s something that rarely makes industry headlines but may matter as much as milk price or feed cost.

When margins compress—and they will at some point; they always do—the question isn’t just “Can my farm cash flow at $14 milk?” It’s “Will my lender give me time to get back to $17?”
That’s not purely an economic question. That’s a relationship question. And it might quietly decide who’s still farming in 2028.
Two producers with nearly identical cost structures can face completely different outcomes:
| Producer A | Producer B |
| Modest leverage | Aggressive expansion of debt from low-interest years |
| Six months of working capital | Thin operating lines |
| Lender who’s been through dairy cycles | Lender with stressed ag portfolio |
| Gets patience when needed | Gets pressure instead |
A farm financial consultant I was talking with in Minnesota made this point effectively: the best-positioned producers right now aren’t just focused on cost per cwt. They’re using this window—while milk checks are decent and lines aren’t maxed—to:
- Clean up any covenant issues
- Term out short-term debt into longer amortizations
- Build transparent, data-driven relationships with their lenders
The operations that emerge as consolidators on the other side of any transition won’t necessarily be the best operators. They’ll often be the ones whose banks stayed in the game.
The Biosecurity Wildcard: H5N1
I’d be remiss not to mention what’s been on everyone’s mind this year.
USDA APHIS has confirmed Highly Pathogenic Avian Influenza outbreaks in dairy cattle across multiple states, including Kansas, Idaho, Texas, Iowa, and others. The virus can move between herds, particularly through cattle movements and the use of shared equipment.
The current picture: Economic damage has been contained and localized so far. Some affected dairies experience temporary production drops during transition periods and during the fresh-cow phase. Export partners are watching but haven’t acted dramatically.
The risk: If regulators move from “monitor and manage” to “contain and control,” the orderly consolidation we’ve been discussing could become something more disruptive.
What to do now: The basics matter more than ever. Review boot and clothing protocols. Tighten visitor policies. Isolate new animals before introducing them to the string. Be thoughtful about shared equipment between operations.
None of this is new advice for anyone who’s been around dairy cattle. But the stakes for following it have increased.
The Sustainability Angle: $0.75-$1.50/cwt in Potential Premiums
Let’s skip the greenwashing debate and talk about what actually matters here: money.
Global food companies—Nestlé, Danone, and PepsiCo—have legally binding 2030 emission targets they must meet. Multiple pilot programs are already paying producers premiums for:
- Verified methane reductions
- Documented feed efficiency improvements
- Low-carbon-intensity milk tagged to specific supply chains
The math that actually matters:
A “preferred” supplier with documented feed conversion efficiency, verified practices, and tight nutrient management could capture $0.75-$1.50/cwt in stacked value—base premiums, carbon credits, sustainability bonuses, and preferential contract access.
What’s encouraging is that a well-managed 1,500-cow Wisconsin or New York operation with strong sustainability credentials could compete with a 3,000-cow commodity operation. The premium contracts change the math.
Scale isn’t the only path forward. For producers looking for differentiation that doesn’t require doubling herd size, this is worth exploring.
The 90-Day Plan: What to Do Before Spring
Given everything we’ve walked through, what should you actually be doing between now and late March? Let me get specific.
By Late January: Consider Locking Feed Costs
- Target: Hedge around 40-50% of your projected 2026 grain needs
- Why now: December 2026 corn futures are already pricing above spot; winter weather and planting signals will move markets further
- Risk of waiting: March and April often bring less favorable terms
Worth talking through with your nutritionist and financial advisor.
By Late February: Make Your Replacement Decision
If you’ve got capital flexibility:
- Establish financing now
- Identify heifer suppliers
- Be positioned to move fast if prices soften mid-2026
If you’re focused on efficiency:
- Identify the bottom 15-20% of your string
- Target chronic health cases and poor reproduction performers
- Consider strategic culling Q1-Q2 while beef prices remain favorable
The key: Make a conscious choice. Operations that drift into mid-2026 without a strategy end up reacting rather than acting. And reactive decisions during stressed markets rarely work out as well.
By Mid-March: Have the Processor Conversation
Four Questions Worth Asking:
- What percentage of our facility’s intake goes to export markets? Which destinations?
- What’s our Mexico concentration—and how might USMCA review affect intake decisions?
- If you needed to reduce intake by 15-20%, what would the notification timeline be?
- If regional supply keeps changing, how does that affect sourcing and our cost structure?
These conversations are easier to have now than during a disruption. The answers tell you a lot about your actual risk exposure.
Deadline | Critical Action | Why Now | Risk of Delay |
|---|---|---|---|
| Late January | Hedge 40-50% of 2026 grain needs | Dec 2026 futures above spot | Higher feed costs locked in |
| Late February | Lock replacement strategy (buy or cull) | Heifer prices still elevated | Forced culling decisions |
| Mid-March | Processor/banker conversations | Build relationships pre-crisis | Reactive instead of proactive |
| April (Post-Action) | Monitor and adjust | Flexibility to pivot | Lost opportunities |
What 2028-2029 Might Look Like
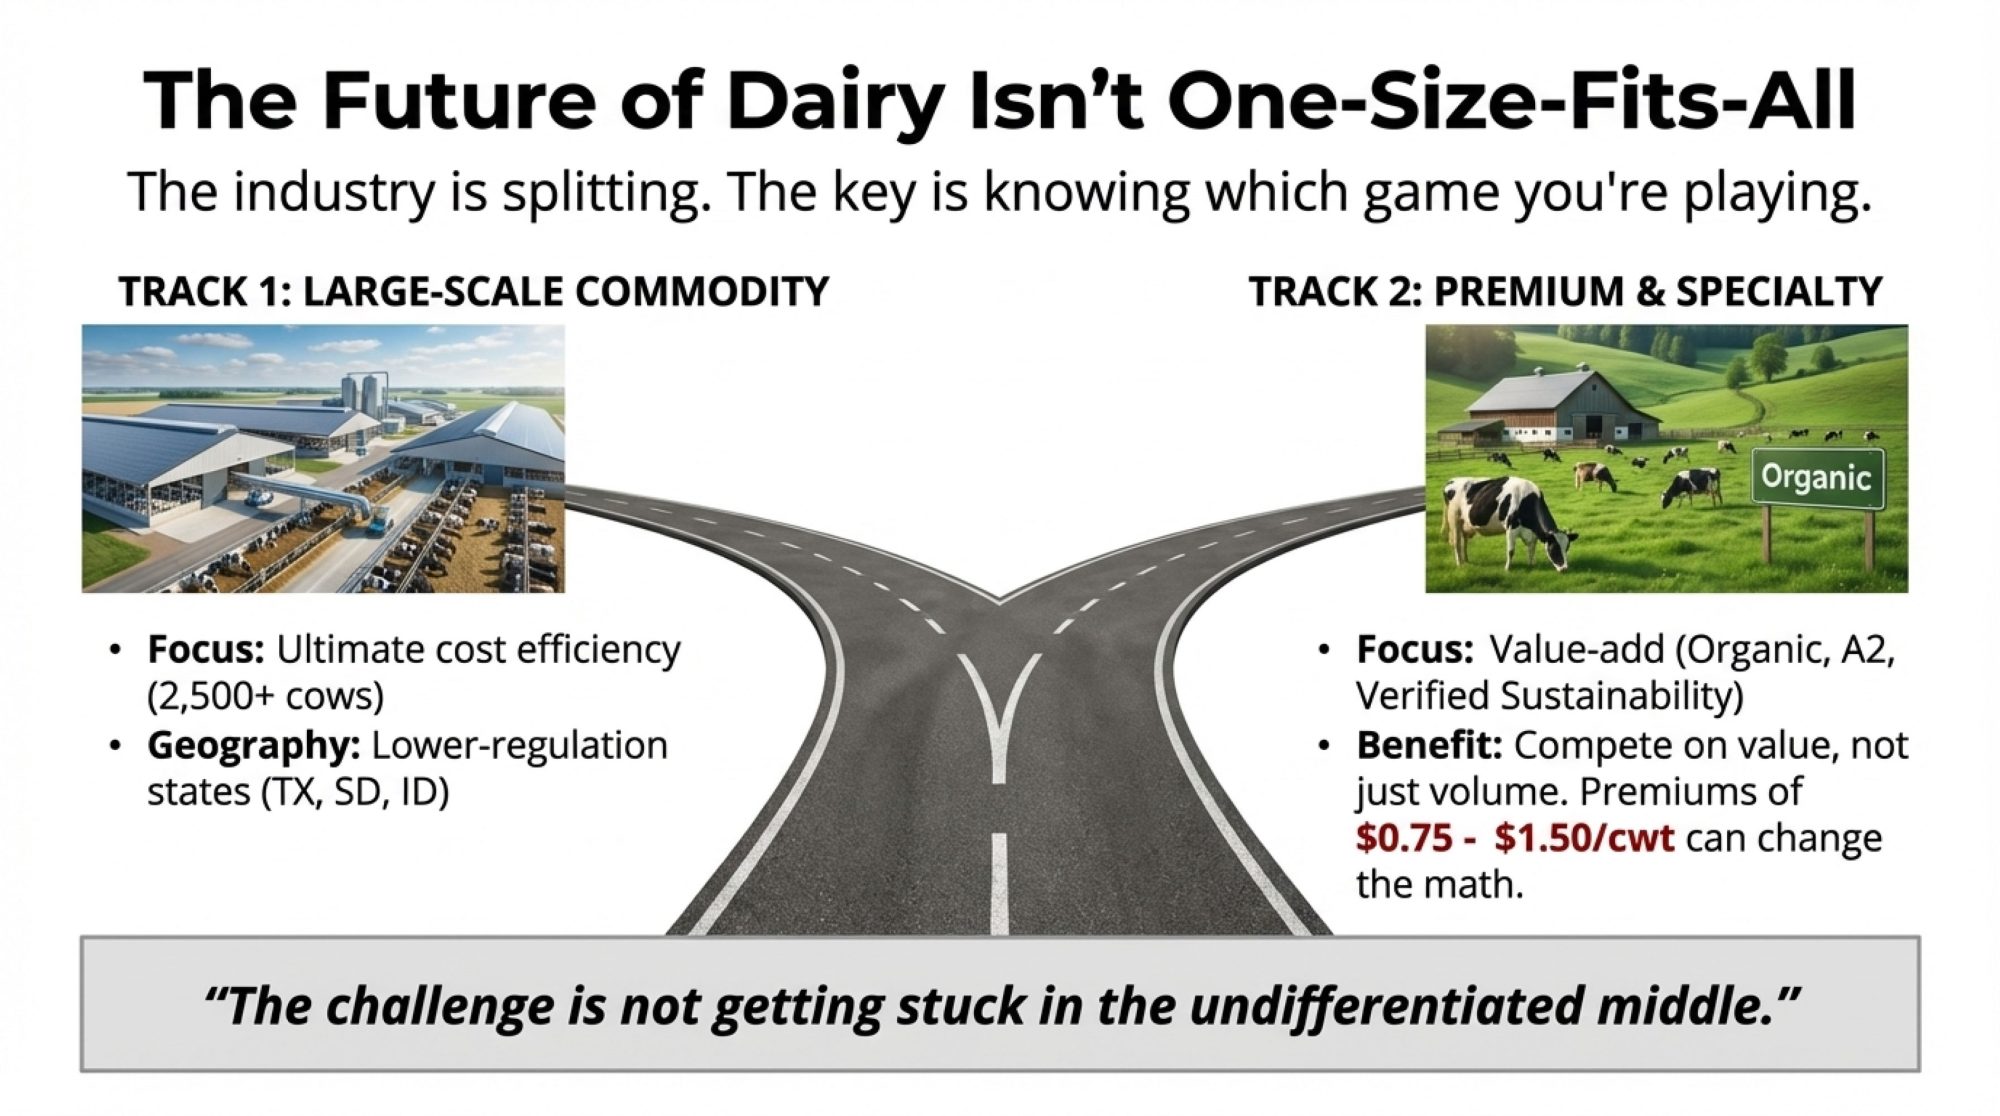
If current trends hold—and that’s always a meaningful “if”—here’s what seems to be taking shape:
Fewer, larger operations. U.S. dairy farms dropped from over 40,000 to under 25,000 over the past couple of decades. Generational transitions without clear successors continue to accelerate this. It’s not inherently good or bad—it’s just the reality we’re working with.
Geographic shifts. Texas, South Dakota, and Idaho are capturing share. The Pacific Northwest faces headwinds. California likely remains the largest state, but its market share is declining.
Two distinct tracks are emerging. This is the part I find most interesting. The industry’s splitting into large-scale commodity operations—think 2,500+ cows competing primarily on cost efficiency, often in lower-regulation states with favorable feed economics—and premium/specialty production commanding meaningful price premiums through organic certification, grass-fed programs, A2/A2 genetics, or verified sustainability credentials.
Production Model | Typical Herd Size | Milk Price Range ($/cwt) | Primary Strategy | Risk Level |
|---|---|---|---|---|
| Large Commodity | 2,500+ | $16-18 | Cost efficiency | Commodity exposed |
| Mid-Size Conventional | 800-1,500 | $17-19 | Scale up or exit | High vulnerability |
| Organic Certified | 400-900 | $26-28 | Premium capture | Protected |
| Grass-Fed/Verified | 300-800 | $23-26 | Direct relationships | Moderate |
| A2/Specialty | 200-600 | $22-25 | Niche differentiation | Moderate |
I know a 900-cow organic operation in Vermont that’s pulling $26-28/cwt consistently while their conventional neighbors struggle at $18. Different game entirely. And a grass-fed producer in Missouri who’s built direct relationships with regional grocery chains that insulate him almost completely from commodity price swings.
Both tracks can work. The challenge is being clear about which game you’re playing—and not getting stuck in the undifferentiated middle where you’re too small for cost leadership but not specialized enough for premium markets.
This isn’t a story of decline. Dairy demand remains solid. Exports keep expanding. Well-run operations build real wealth.
But it is a story of restructuring. And the producers who navigate it successfully will be those who understand the forces at play, make deliberate choices, and maintain enough flexibility to adapt.
Resources Worth Bookmarking
If you want to track the indicators we’ve discussed, a few sources are worth checking monthly—it takes maybe 20 minutes:
- USDA NASS Milk Production Reports — released around the 20th
- CME Group Dairy Futures — corn, soybean meal, Class III/IV signals
- CoBank Quarterly Rural Economy Reports — solid dairy analysis, heifer market outlook
- USDA APHIS H5N1 Updates — current outbreak status
The planning window’s open. What you do with it is up to you.
We’ll be watching these developments and keeping you informed as things unfold.
KEY TAKEAWAYS
- The national average is hiding two industries: Texas +50,000 cows, Washington -21,000—both called “3% growth”
- Three factors broke the old economics: $3,400+ heifers, beef-on-dairy taking 25% of replacements, and feed costs at multi-year lows
- $11B in new processing capacity may be misaligned: Plants expanding where milk supply is flat or declining
- Your 90-day action window: Hedge 40-50% of feed (January) → Lock replacement strategy (February) → Processor/banker conversations (March)
- Your lender decides who survives: The winners won’t just be the best operators—they’ll be the ones whose banks stayed in the game
Complete references and supporting documentation are available upon request by contacting the editorial team at editor@thebullvine.com.
Learn More:
- Feed Smart: Cutting Costs Without Compromising Cows in 2025 – Provides a tactical playbook for the “feed cost hedging” strategy mentioned in your 90-day plan. Learn specific methods for forward contracting corn below $4.60 and optimizing forage digestibility to protect margins against the potential spring rally.
- The Wall of Milk: Making Sense of 2025’s Global Dairy Crunch – Expands on the “24-month trap” and global supply factors currently capping milk prices. This strategic analysis explains why the U.S., EU, and New Zealand expanding simultaneously creates the specific market ceiling your banker is watching closely.
- Generate $15,000+ Annual Carbon Revenue: The Dairy Producer’s Guide – Delivers the implementation roadmap for the “sustainability premiums” opportunity. Discover how to stack Section 45Z tax credits with feed additives and carbon markets to generate new revenue streams without increasing herd size.
 Join the Revolution!
 Join the Revolution!
Join over 30,000 successful dairy professionals who rely on Bullvine Weekly for their competitive edge. Delivered directly to your inbox each week, our exclusive industry insights help you make smarter decisions while saving precious hours every week. Never miss critical updates on milk production trends, breakthrough technologies, and profit-boosting strategies that top producers are already implementing. Subscribe now to transform your dairy operation’s efficiency and profitability—your future success is just one click away.


