


Why this downturn is different—and the brutal math deciding which operations survive
EXECUTIVE SUMMARY: The dairy cycle you’re waiting for isn’t coming back. China added 22 billion pounds of domestic production since 2018, permanently closing a market that absorbed half of global import growth. Meanwhile, American dairying is migrating: Texas gained 46,000 cows last year while Wisconsin lost 455 farms, and $11 billion in new Southwest processing capacity is cementing this shift for the foreseeable future. The economics have turned existential. Operations above $20 per hundredweight are hemorrhaging cash, while larger dairies at $16-17 are building war chests for acquisition. Beef-on-dairy bought time, but created a replacement crisis—heifer inventories at 20-year lows, prices hitting $4,000. This structural shakeout accelerates through 2027. The market doesn’t care about your heritage. It cares about your production costs. Do the math now, or the bank will do it for you.
Stop waiting for the cycle to turn.
Economists tracking dairy markets are increasingly using a word we don’t often hear: structural. This isn’t 2009 or 2018. The game board has changed.
The FAO’s November numbers tell the story: the Dairy Price Index recorded its fifth consecutive monthly decline, dropping to 137.5 points—the lowest since September 2024. Global food prices have fallen for three straight months. But what’s making veteran producers uneasy isn’t just the price decline. It’s what’s driving it.
The forces reshaping this market aren’t cyclical headwinds that will reverse when prices fall far enough. They’re structural shifts that have permanently altered the demand equation. Understanding that distinction changes everything about how we should approach the next few years.

The China Syndrome: Why the Export Dragon Stopped Roaring
If there’s one development that separates this market environment from previous downturns, it’s China’s move toward dairy self-sufficiency. We’ve heard “China is changing everything” before, and sometimes those predictions haven’t aged well. But this time? The numbers don’t lie.
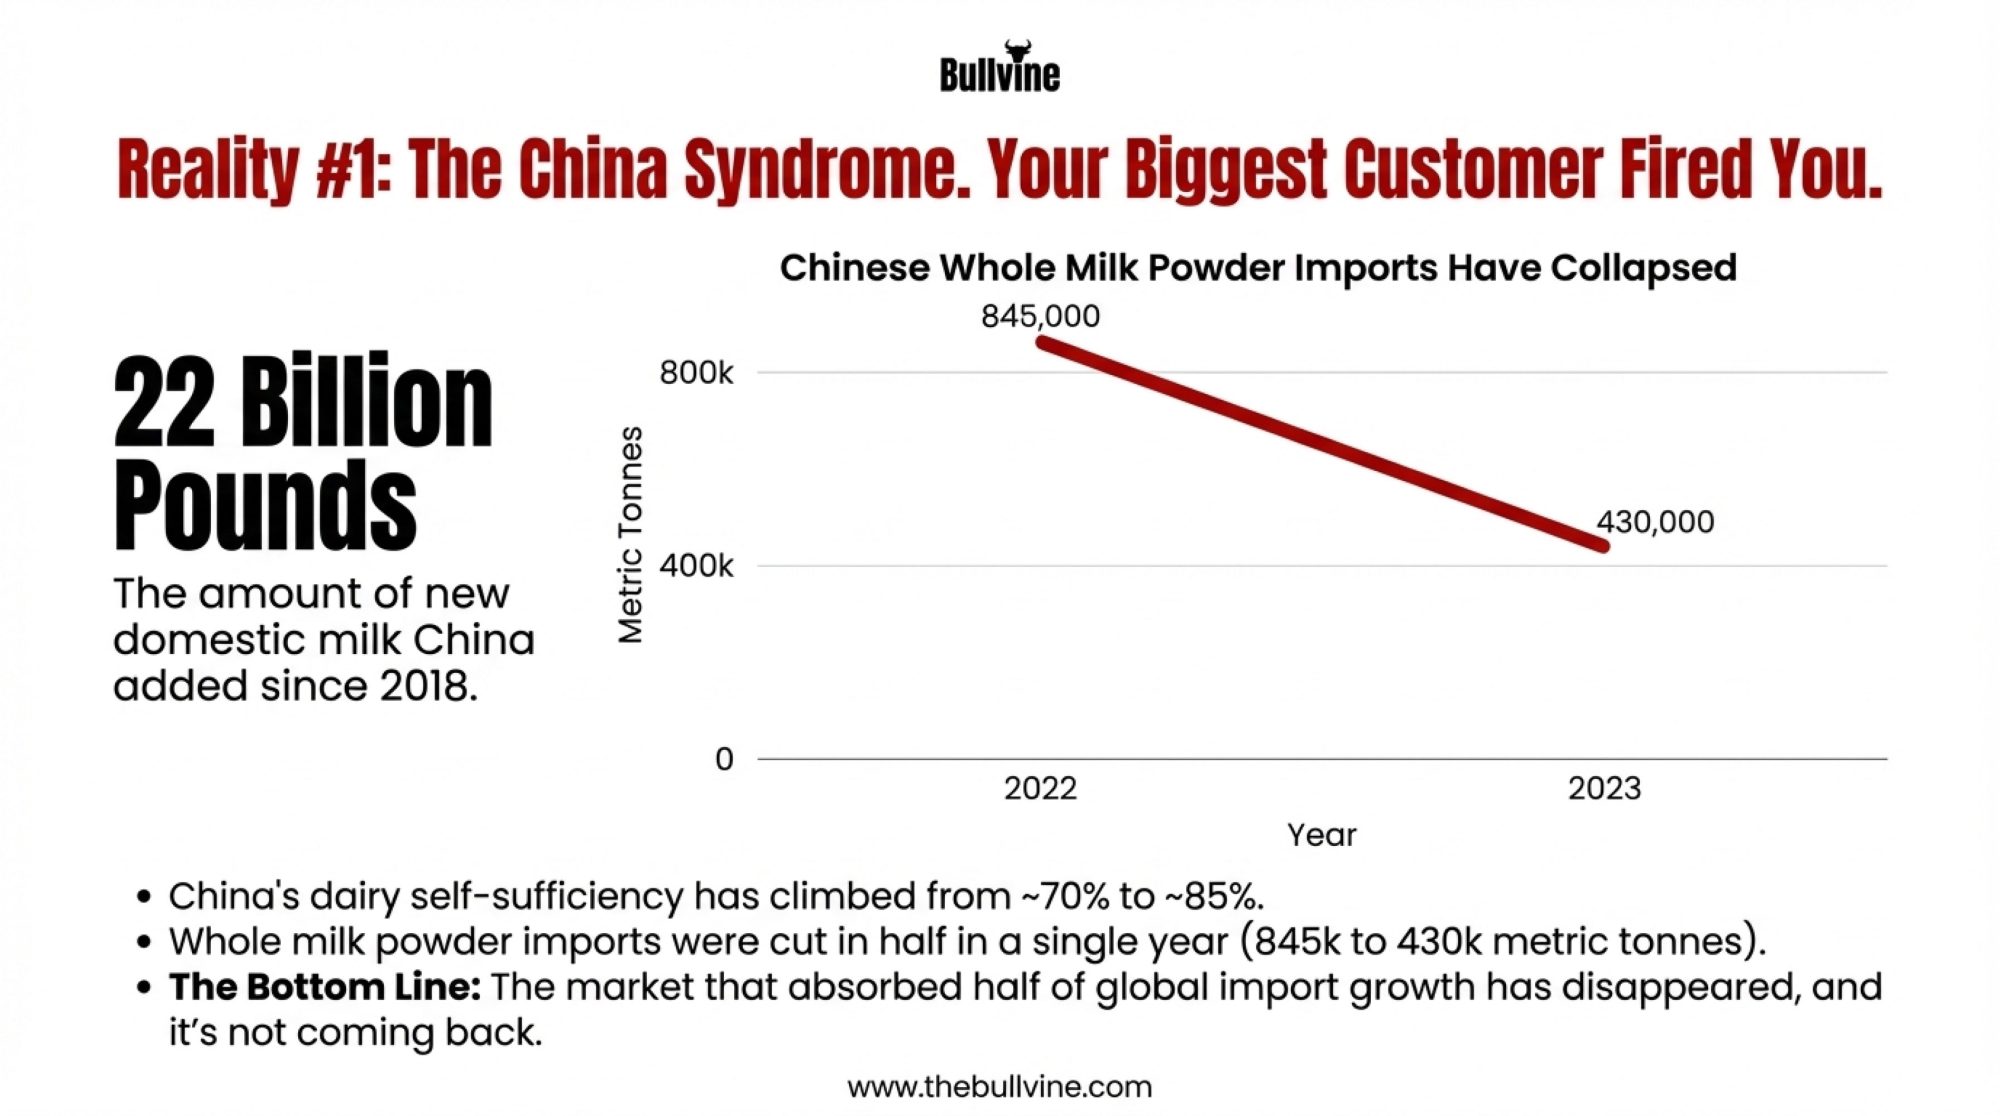
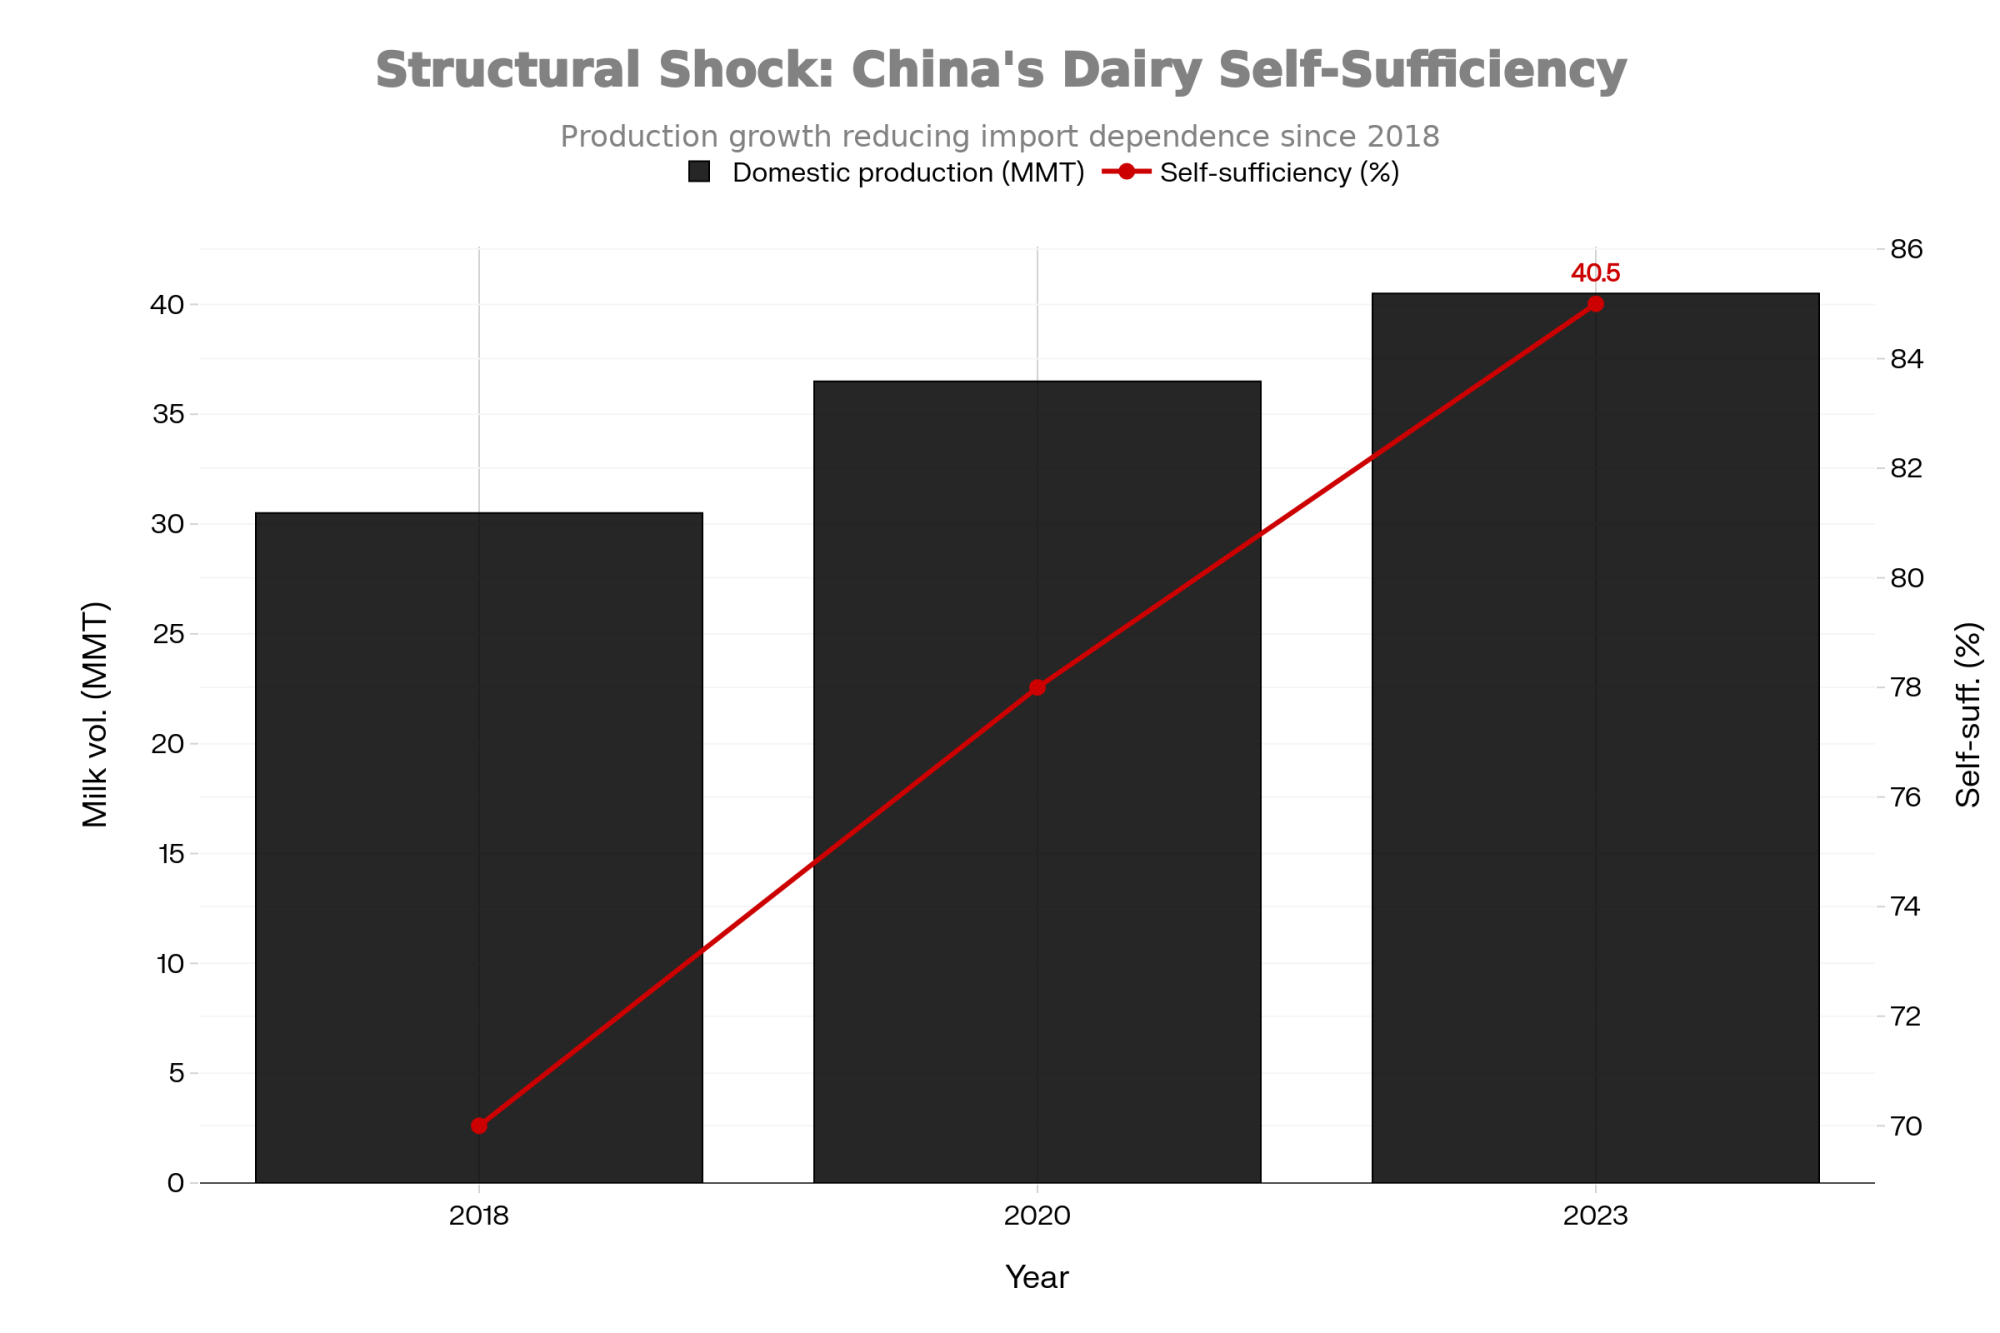
Between 2018 and 2023, China increased domestic milk production by 10 million metric tonnes. Let that sink in for a moment—that’s roughly 22 billion pounds of new milk supply that used to come from exporters like us. According to the USDA Foreign Agricultural Service, they reached the 40.5 million tonne target ahead of schedule. This wasn’t gradual market evolution. It was deliberate policy execution backed by massive state investment.
The Rabobank analysts tracking this have documented the shift in brutal detail. China’s dairy self-sufficiency climbed from roughly 70% in 2018 to approximately 85% by 2023. Their whole milk powder imports got cut in half in a single year—dropping from 845,000 metric tonnes in 2022 to just 430,000 in 2023.
And the domestic farms driving this aren’t small operations. Chinese dairy farms with more than 1,000 head grew from 24% of the national herd in 2015 to 44% by 2020, with government targets pushing toward 56% by 2025. These are modern, efficient mega-dairies designed to eliminate import dependency.
Why does this matter for a dairy farmer in Minnesota or Idaho, or Vermont? Because China was absorbing roughly half of global dairy import demand growth during the 2010-2020 period. That demand engine hasn’t just stalled—it’s running in reverse.
Industry economists point out that even optimistic forecasts project only about 2% growth in Chinese imports for 2025. That’s nowhere near sufficient to absorb the additional production coming from major exporting regions.
Could Chinese demand recover faster than expected? A severe domestic disease outbreak or major policy shift could alter the trajectory. But those mega-dairy operations represent 20-30 year infrastructure investments. They’re not going away. Building your business plan around hoping they will is a recipe for disappointment.
The Great Migration: Why the Cows Are Leaving the Heartland
While global demand dynamics shift, something equally dramatic is happening right here at home. The geographic center of American dairying is moving—and moving fast.
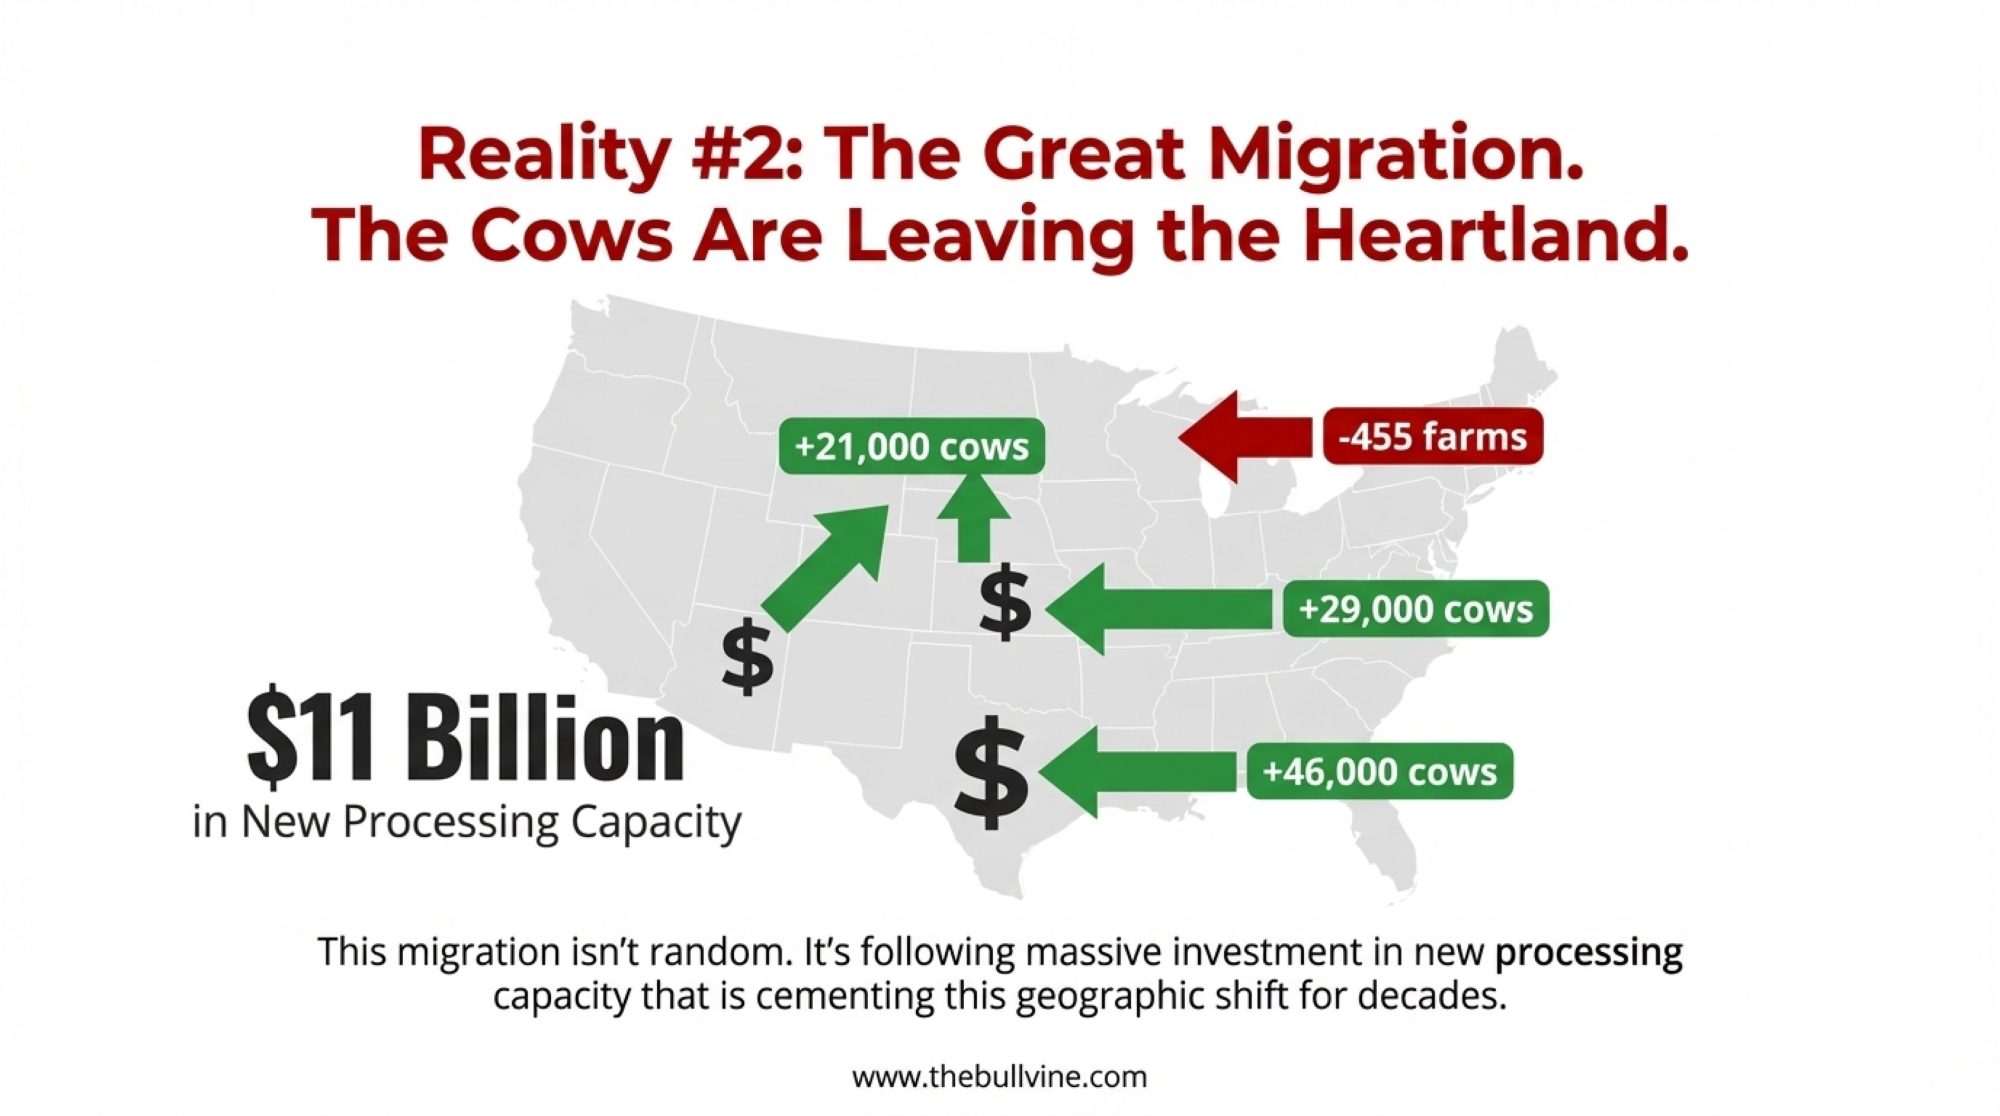
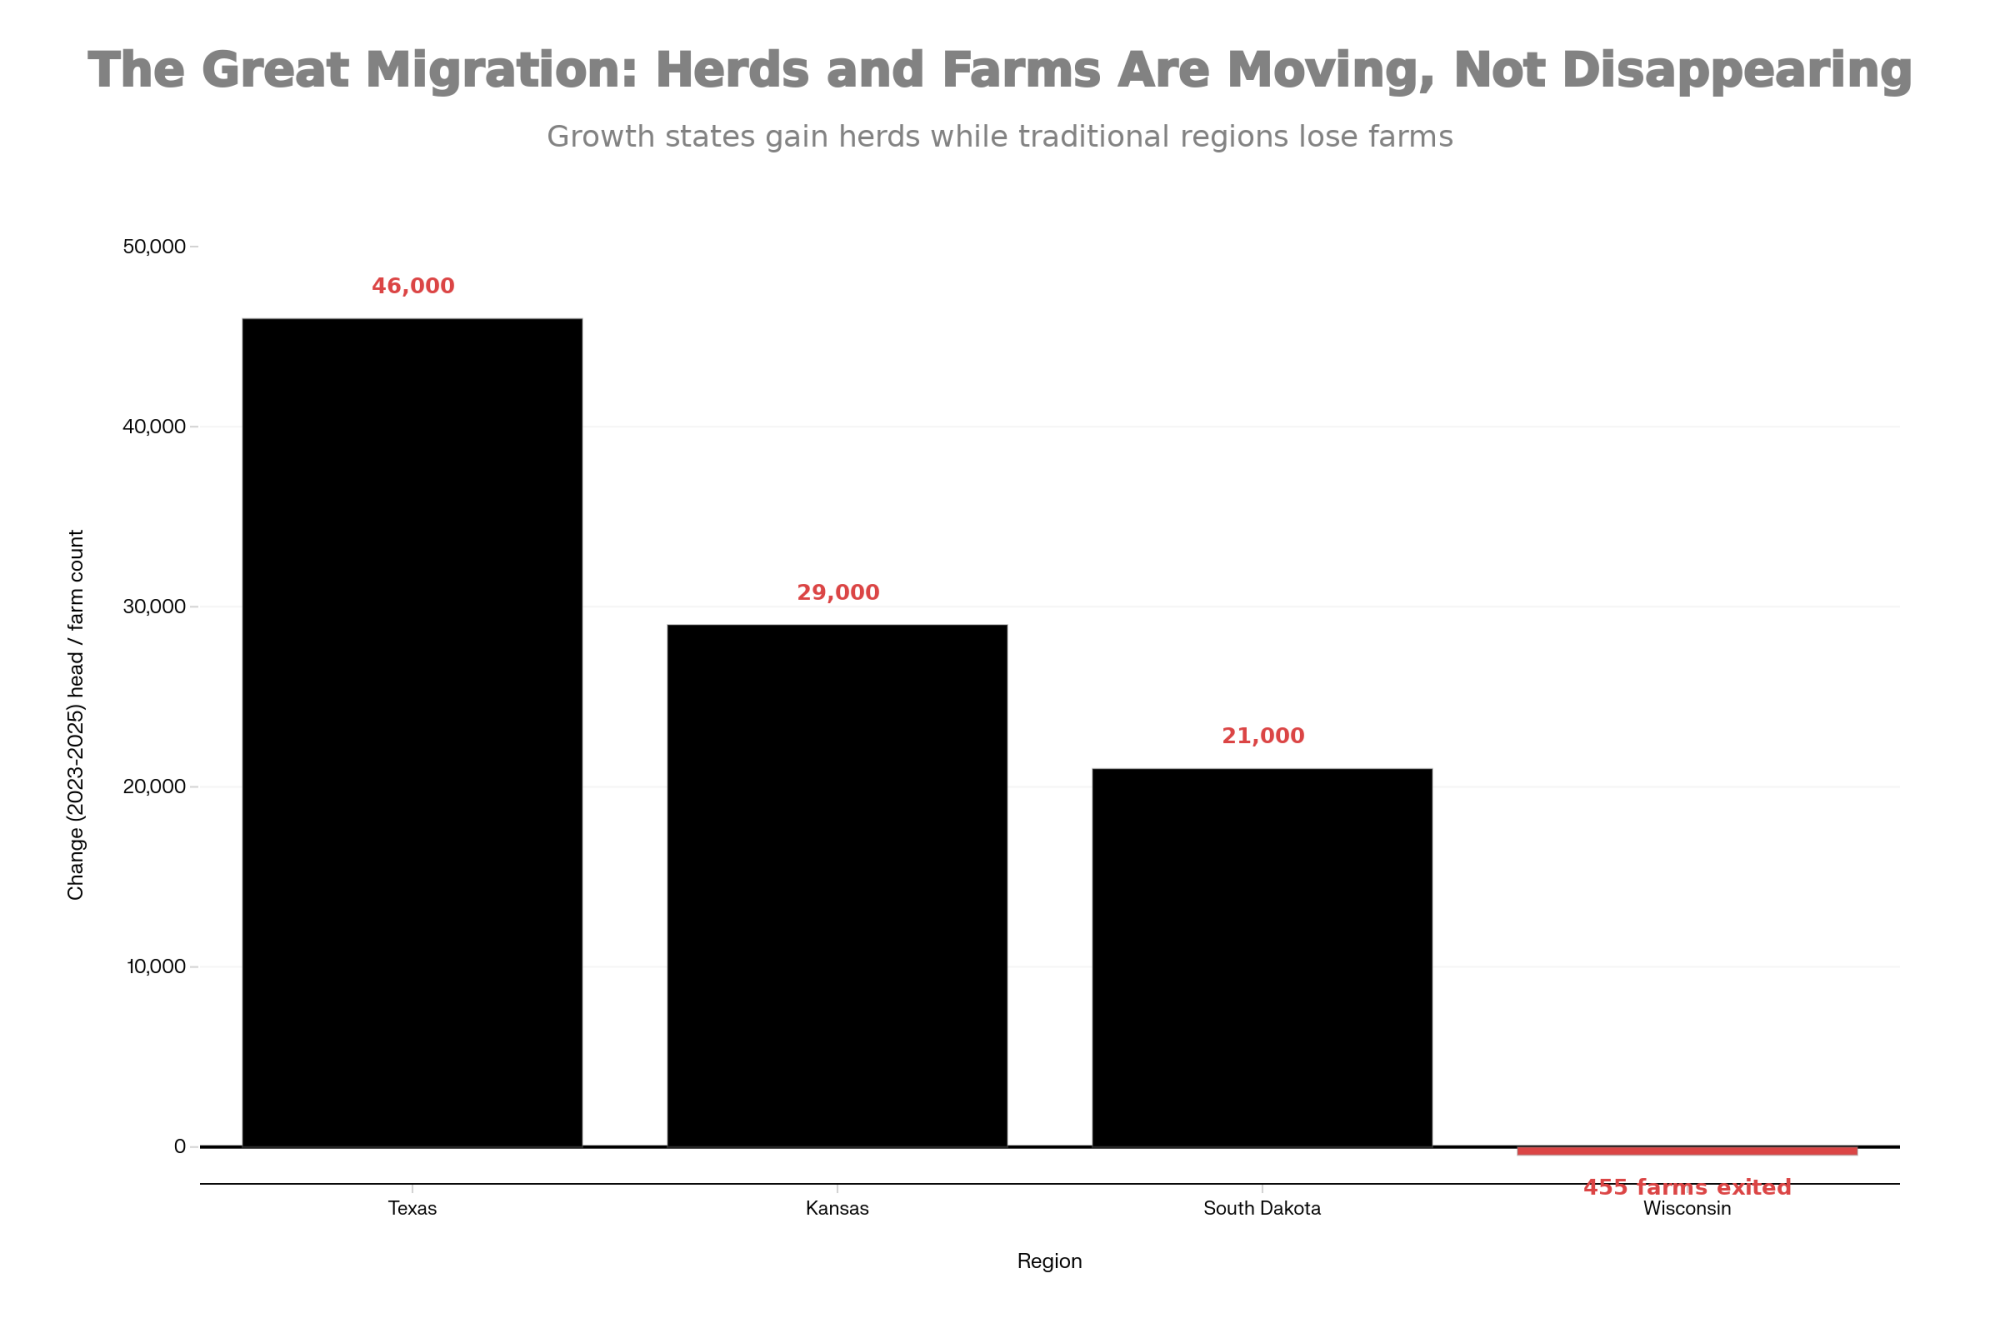
The USDA’s production reports tell the story. Texas added about 46,000 dairy cows between late 2023 and early 2025, increasing from about 635,000 to roughly 690,000. Texas accounted for about 56% of all U.S. herd growth during that period. Production in the state increased by more than 10% year over year. Kansas added another 29,000 head. South Dakota grew by 21,000.
What’s driving it? Processing capacity. New cheese plants are pulling production to the region like gravity.
Texas A&M AgriLife Extension has been tracking the build-out: Cacique Foods opened their cheese plant in Amarillo in May 2024. Great Lakes Cheese completed their Abilene facility late last year. H-E-B’s processing operation in San Antonio opens this summer. And Leprino Foods’ Lubbock facility reaches Phase 1 completion in early 2026.
Meanwhile, traditional dairy states are hemorrhaging farms. Data from the Wisconsin Department of Agriculture shows the state lost 455 licensed dairy farms in 2023, with monthly exits running at 87-94 operations through late 2024—94 dairies exited in October, 94 in November, and 87 in December.
Here’s the twist: total herd size stayed relatively flat at around 1.27 million cows, and production actually ticked up slightly. The remaining farms are becoming remarkably more efficient—Wisconsin producers achieved 10-pound-per-cow yield gains last year, double the national average.
California faces its own pressures—water constraints and regulatory costs have contributed to herd reductions in recent years, though the state remains the nation’s top milk producer. In the Northeast, many operations have found viability through fluid milk premiums and direct market relationships that provide some insulation from commodity swings.
The cows aren’t leaving these states entirely. They’re concentrating into fewer, larger operations. That’s consolidation, not collapse—though the distinction offers cold comfort to the families exiting the business.
The Brutal Math: Why Location Determines Survival
Let’s cut through the sentiment.
When you build a new dairy operation in Texas or the Southwest, you’re typically building at a 3,000-5,000 cow scale with modern facilities optimized from the ground up. Land costs range from $2,000 to $ 3,500 per acre. Feed availability is strong—corn belt proximity, regional sorghum production, steady distillers grain supplies. University extension budgets from the region suggest efficient large operations can often achieve costs of production in the $15-17 per hundredweight range.
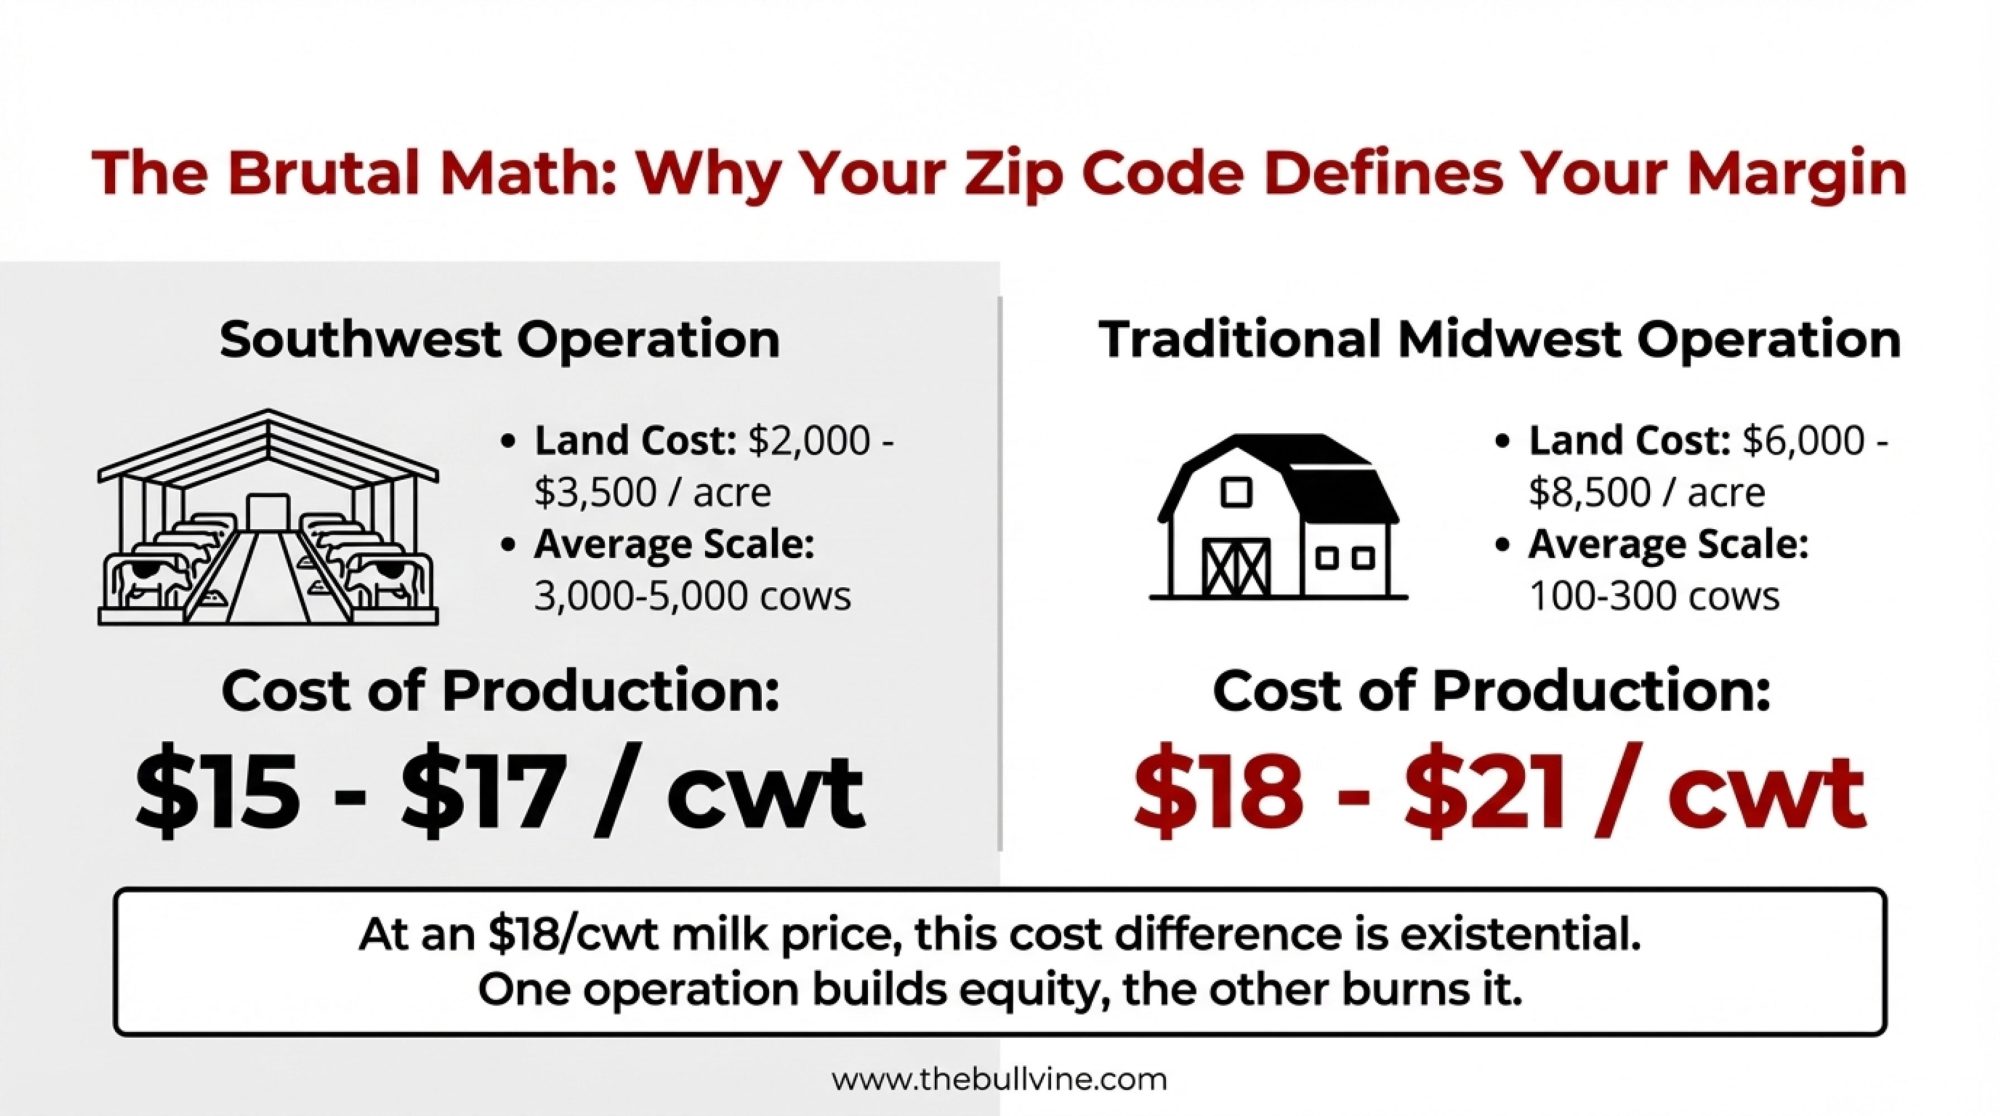
Wisconsin operations face different math. Land costs run $6,000-8,500 per acre—two to three times Texas levels. Existing farms often average 100-300 cows. Extension analysis from the region puts the average dairy’s cost of production in the $18-21 per hundredweight range.
At current milk prices of $17-19, that cost differential isn’t just significant; it’s substantial. It’s existential.
A Texas 4,000-cow dairy optimized from scratch can show positive margins at these prices. A 200-cow dairy in the Upper Midwest at the same prices is bleeding cash every single month.
Heritage and sentiment don’t pay the bills. If you’re milking 200 cows in Wisconsin without a niche market or paid-off land, the math is working against you every single month. That’s not pessimism—it’s arithmetic.
This doesn’t mean Upper Midwest dairy is dead. Wisconsin has real advantages: exceptional forage quality, deep industry infrastructure, generations of expertise, and world-class cheese-making facilities. But the farms that thrive there will look different than the traditional model. Larger. More efficient. More specialized. The producers who recognize this and adapt will survive. The ones waiting for the old economics to return will not.
Following the Cheese: Where the Processing Money Is Going
Dairy processors are making strategic allocation decisions that favor cheese production over commodity powders. These decisions have direct implications for which farms command premium pricing.
The investment numbers are staggering. According to the International Dairy Foods Association’s October announcement, U.S. dairy processors are putting approximately $11 billion into more than 50 new or expanded facilities across 19 states, with projects coming online between 2025 and early 2028. Industry publications are calling it the largest investment wave in U.S. agricultural processing history.
The market signal is clear: cheese demand remains genuinely strong. Global cheese market projections show growth of 4-5% annually through 2035. U.S. cheese exports surged significantly in 2025. Domestic consumption continues climbing.
Powder markets tell a different story. The FAO noted that weak import demand for powders—particularly from Asia—contributed to recent price declines, with heavy butter and skim milk powder inventories in the EU adding pressure.
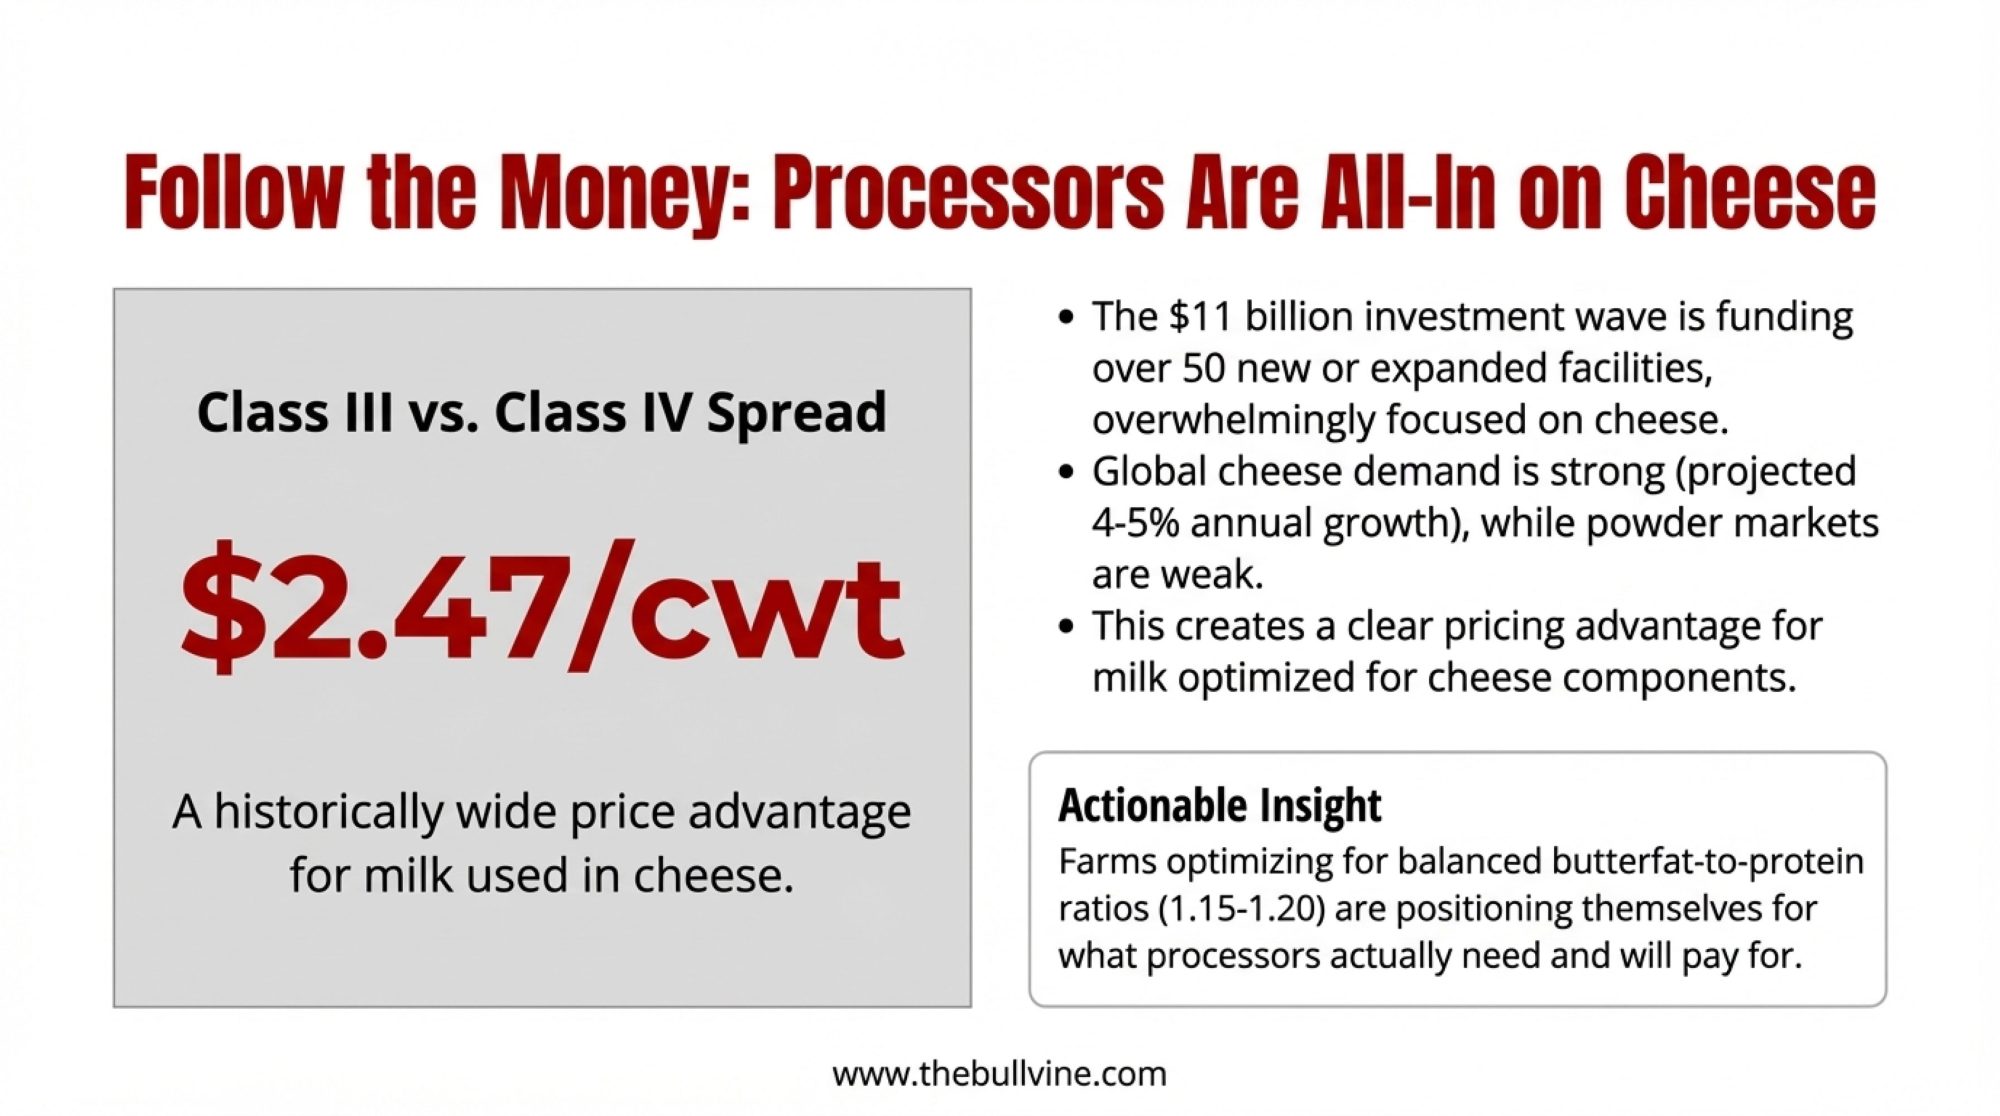
This creates a pricing divergence showing up directly in milk checks. Industry reports from October showed the spread between Class III and Class IV prices reaching around $2.47 per hundredweight—historically wide. For a 500-cow farm, that’s a meaningful income difference depending on how your milk gets allocated.
The guidance from dairy economists is straightforward: think carefully about component profiles and processor relationships. Farms optimizing production for cheese components—typically balanced butterfat-to-protein ratios in the 1.15-1.20 range—are positioning themselves for the products processors actually need.
The Beef-on-Dairy Trap: When Short-Term Cash Creates Long-Term Problems
Beef-on-dairy helps cash flow. No question about it. According to NAAB data, beef semen sales to dairy farms reached 7.9 million units in 2023, with 2024 showing continued growth. Farms producing 300 beef-cross calves annually at current market prices of around $1,400 per head are generating substantial supplemental income.
But beef-on-dairy creates downstream consequences that are about to bite.
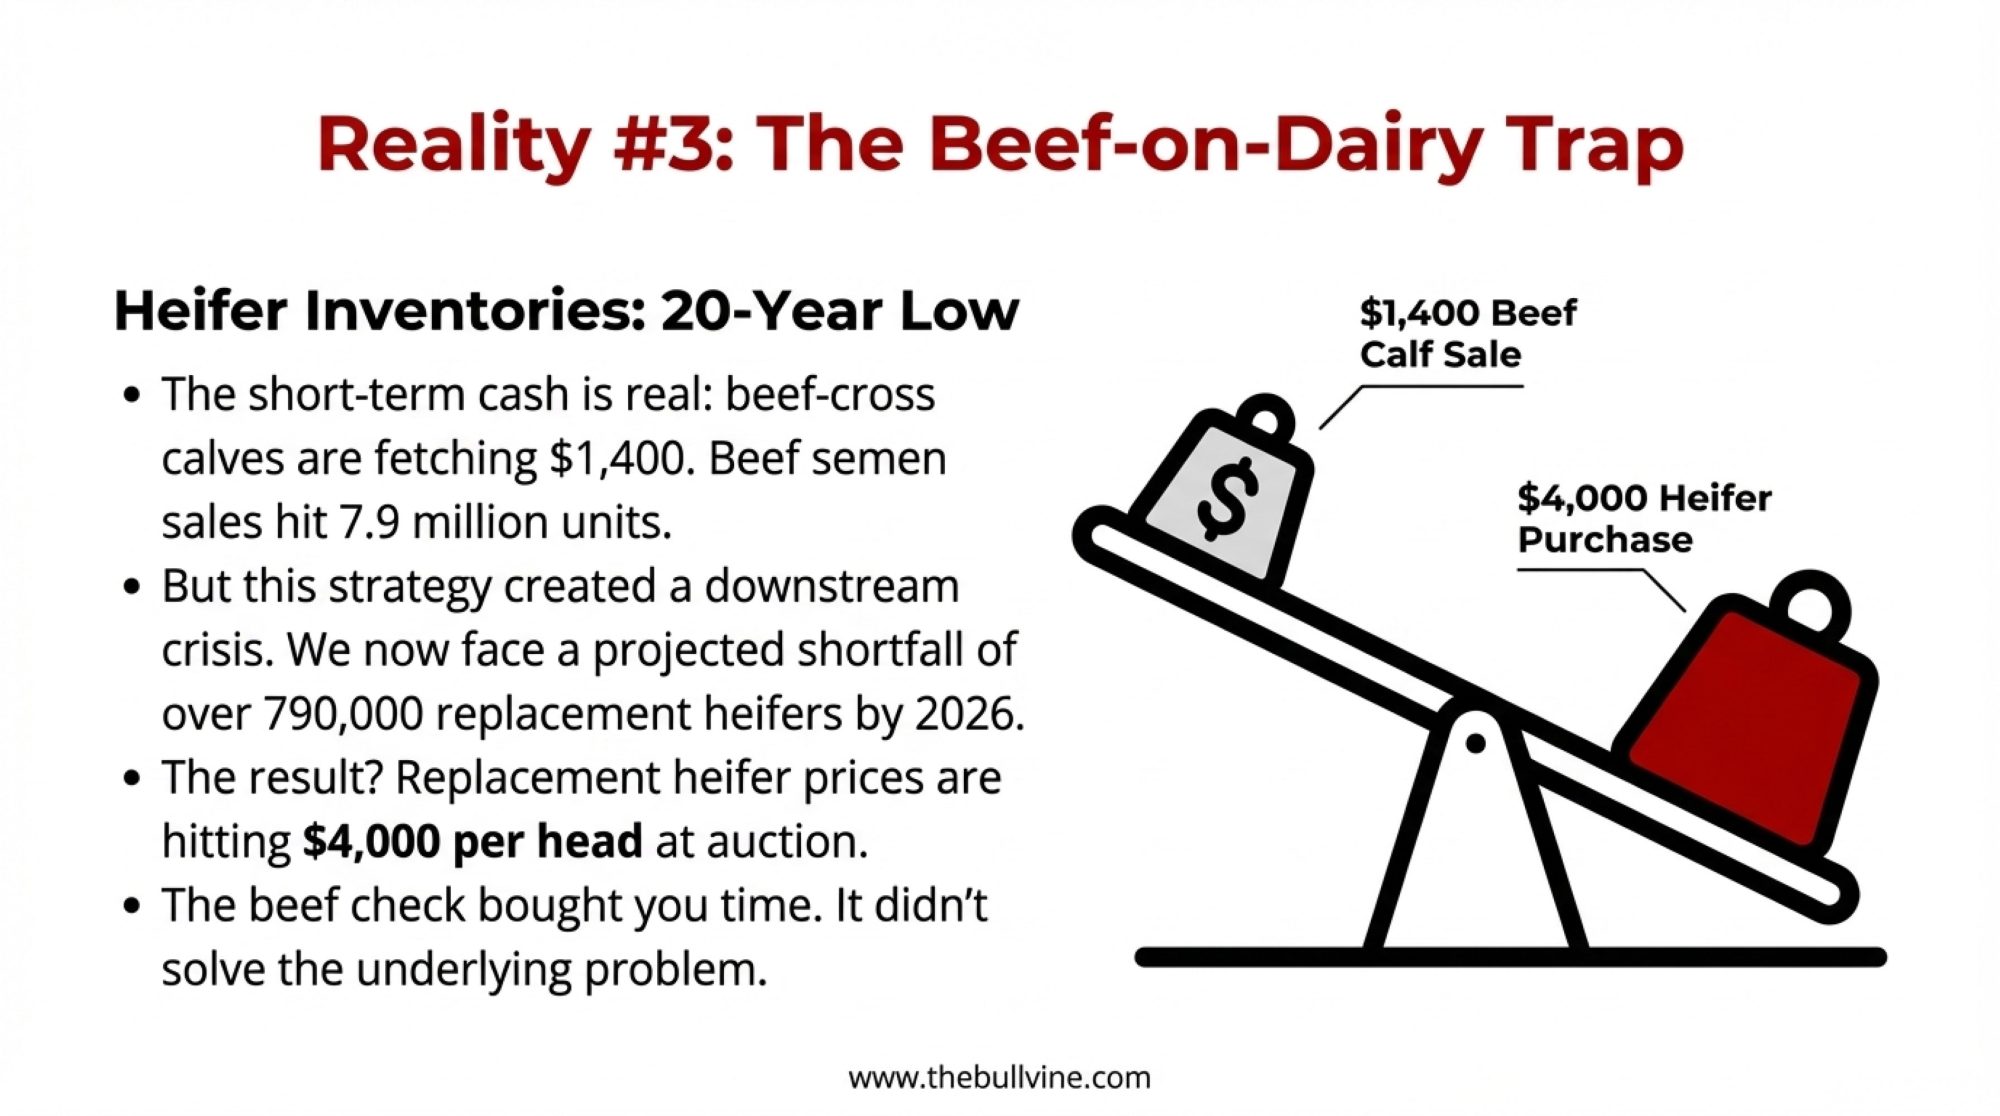
CoBank’s dairy analysis team has documented what’s coming: they project roughly 357,000 fewer dairy replacement heifers available in 2025, with an additional 439,000 fewer in 2026. These shortfalls reflect breeding decisions made in 2022-2023 that can’t be reversed. It takes more than two years for a heifer calf born today to enter the milking string.
Here’s where the math gets ugly. CoBank’s analysis shows heifer inventories have fallen to a 20-year low, with prices at some auctions reaching $4,000 per head. Think about that for a moment. If you’re selling beef-cross calves for $1,400 and you need to buy replacement heifers at $3,500-$4,000, the economics of that trade look very different from than they did two years ago.
New processing capacity coming online in 2025-2026 needs milk supply now. But the heifer rebound won’t materially impact milk supply until 2027-2028 at the earliest.
“The beef check helps. But it buys time rather than solving the underlying milk price problem. What producers do with that time is the real question.”
The Scale Advantage: Why Size Matters More Than Ever
USDA’s Economic Research Service publishes cost-of-production data that shows why scale has become the critical survival factor.
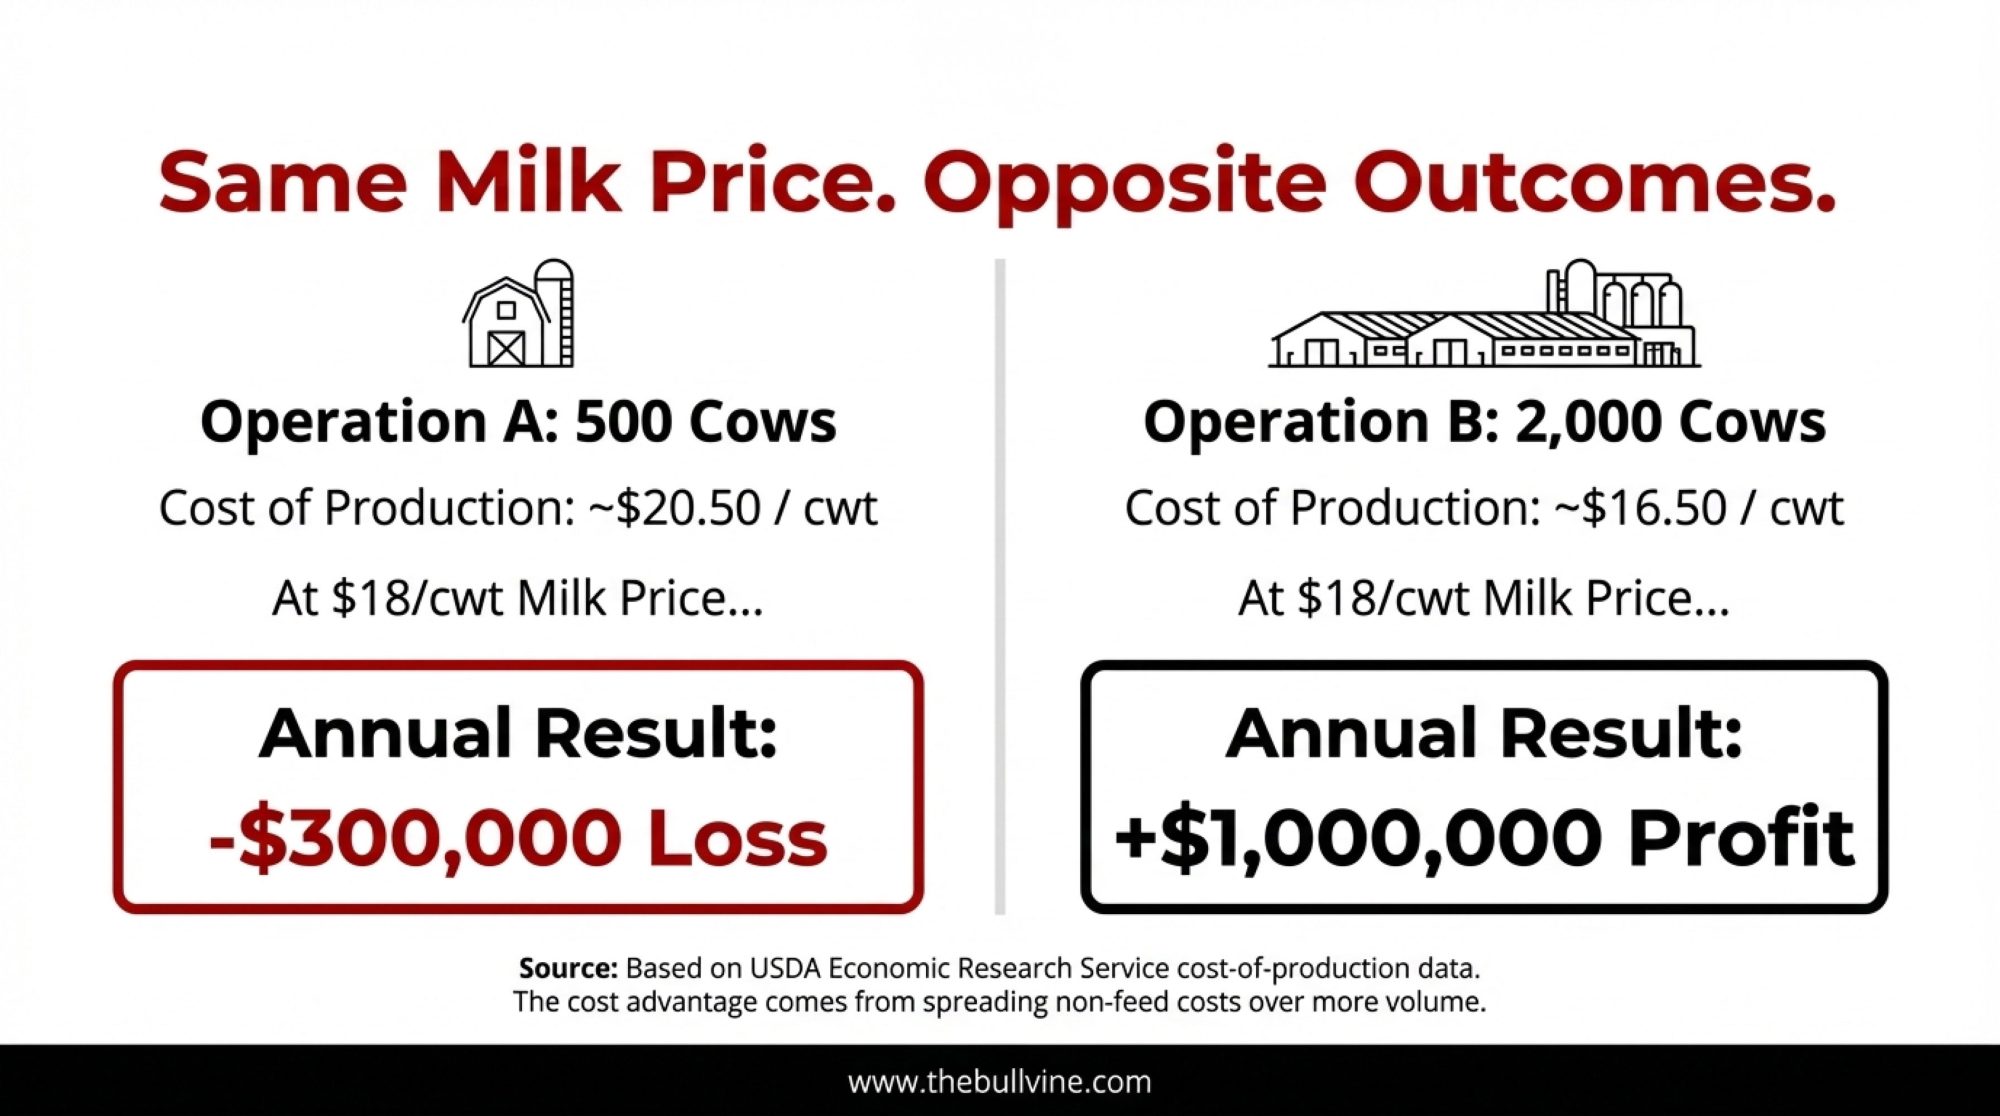
For a 500-cow operation at current prices around $18 per hundredweight, total production costs often run in the $20-21 per hundredweight range. Run those numbers across annual production, and you’re looking at losses approaching $300,000 or more per year. That’s roughly $600 per cow in the red.
A 2,000-cow operation at the same milk price sees different economics. Total production costs can run closer to $16-17 per hundredweight when you spread overhead across more volume. That translates to potential profit approaching $1 million annually—$450-500 per cow in the black.
Same milk price. Opposite outcomes.
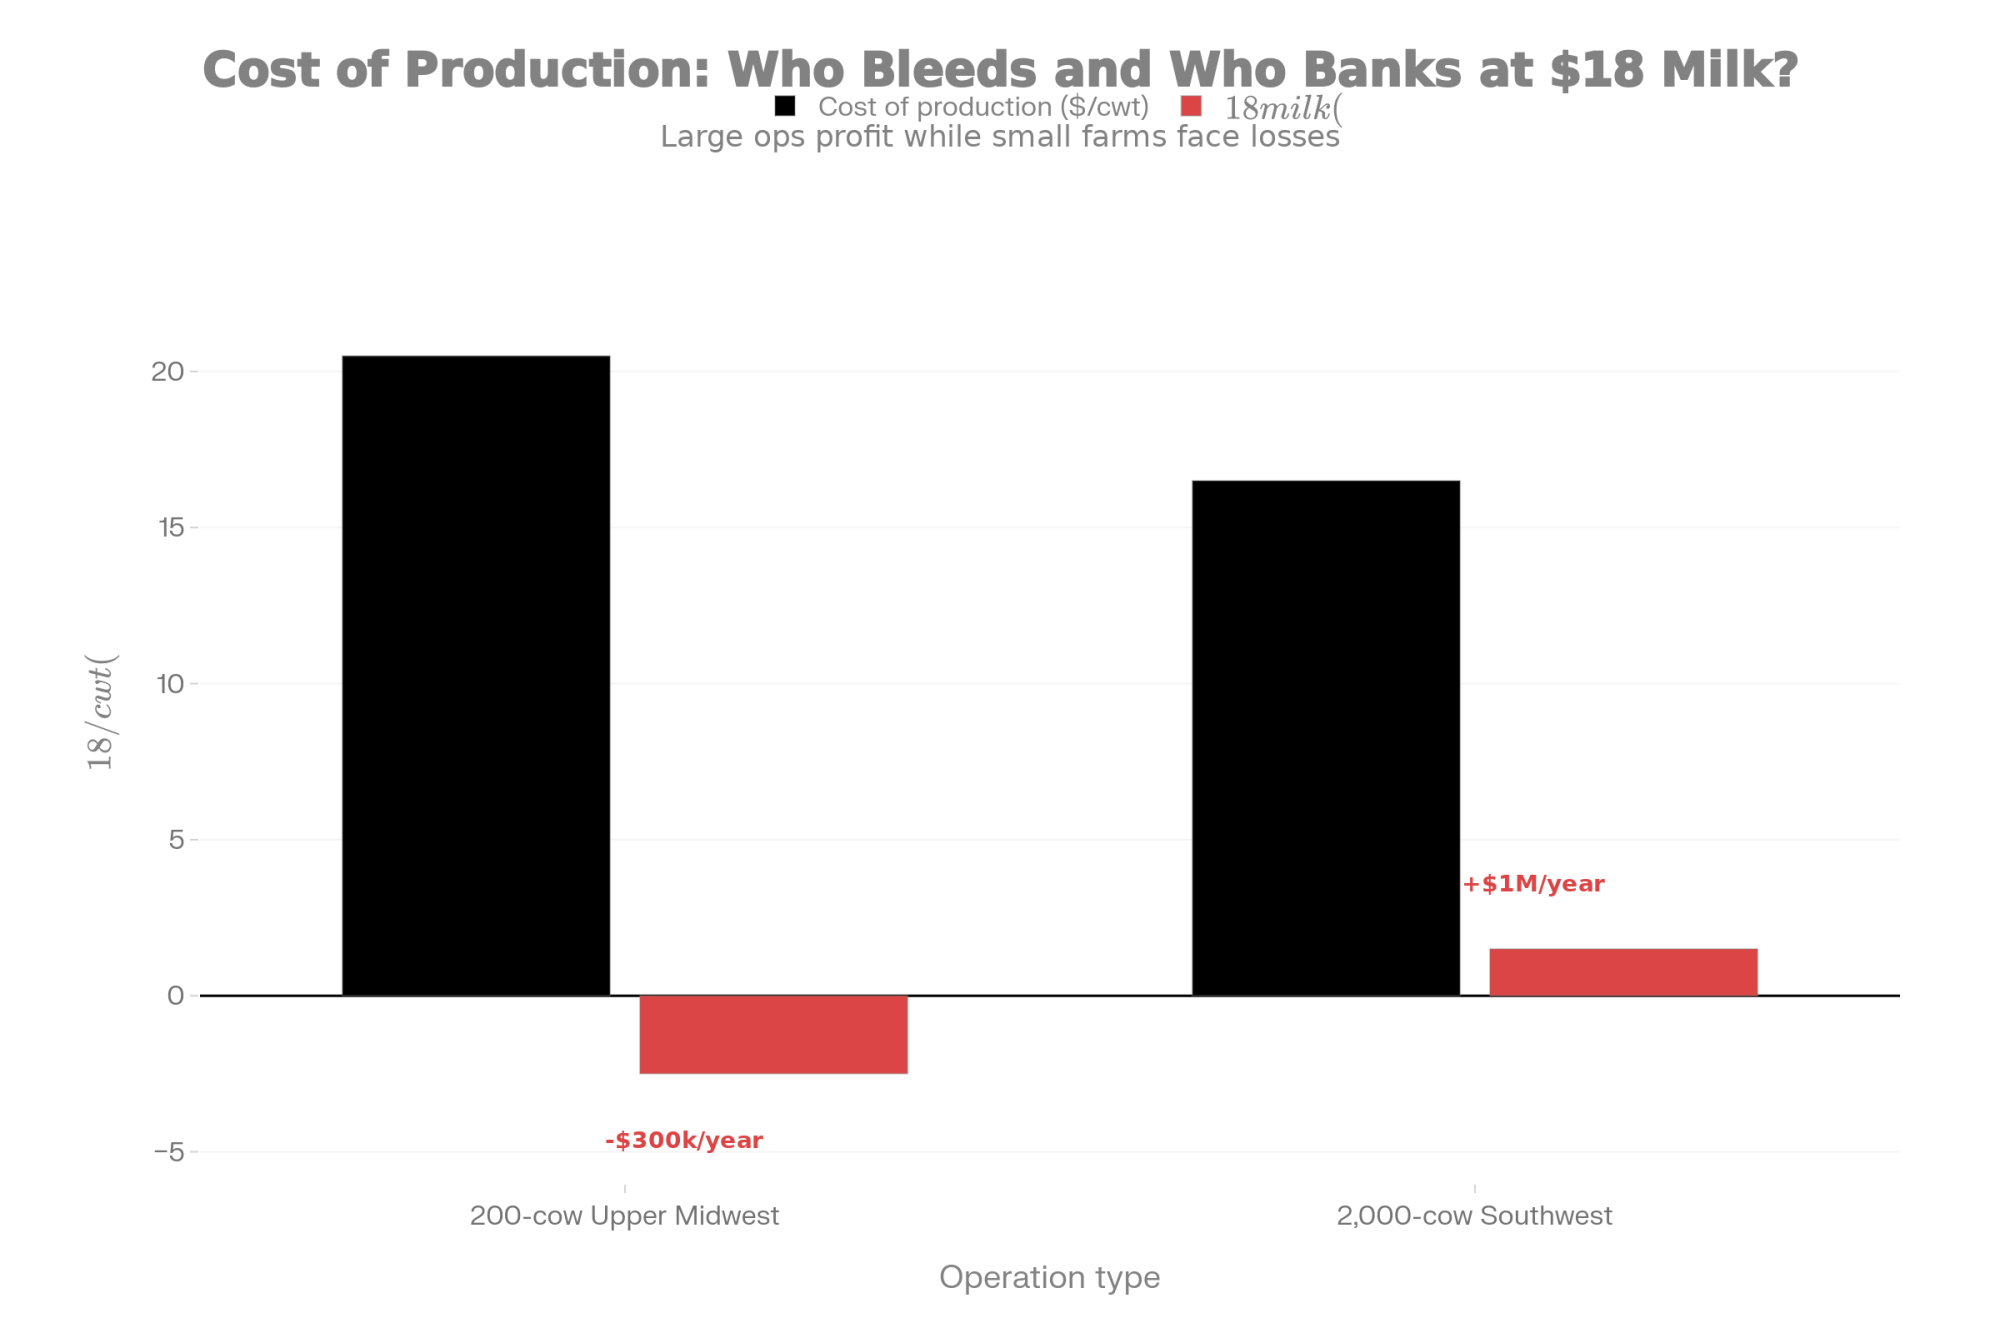
The cost advantage comes primarily from non-feed costs: overhead, labor, equipment, and management spread across more production. Agricultural economists note that the cost curve has gotten steeper over the past decade. The spread between high- and low-cost producers has widened, meaning price downturns hit the bottom quartile much harder than in previous cycles.
Operations losing $300,000 annually are burning through reserves. With typical liquid reserves of $50,000-150,000, these farms face 6-18 months before financial stress forces difficult conversations with lenders. The larger operation strengthens its balance sheet—positioning to weather extended weakness or acquire neighboring operations.
The Consolidation Trajectory: Where We’re Headed
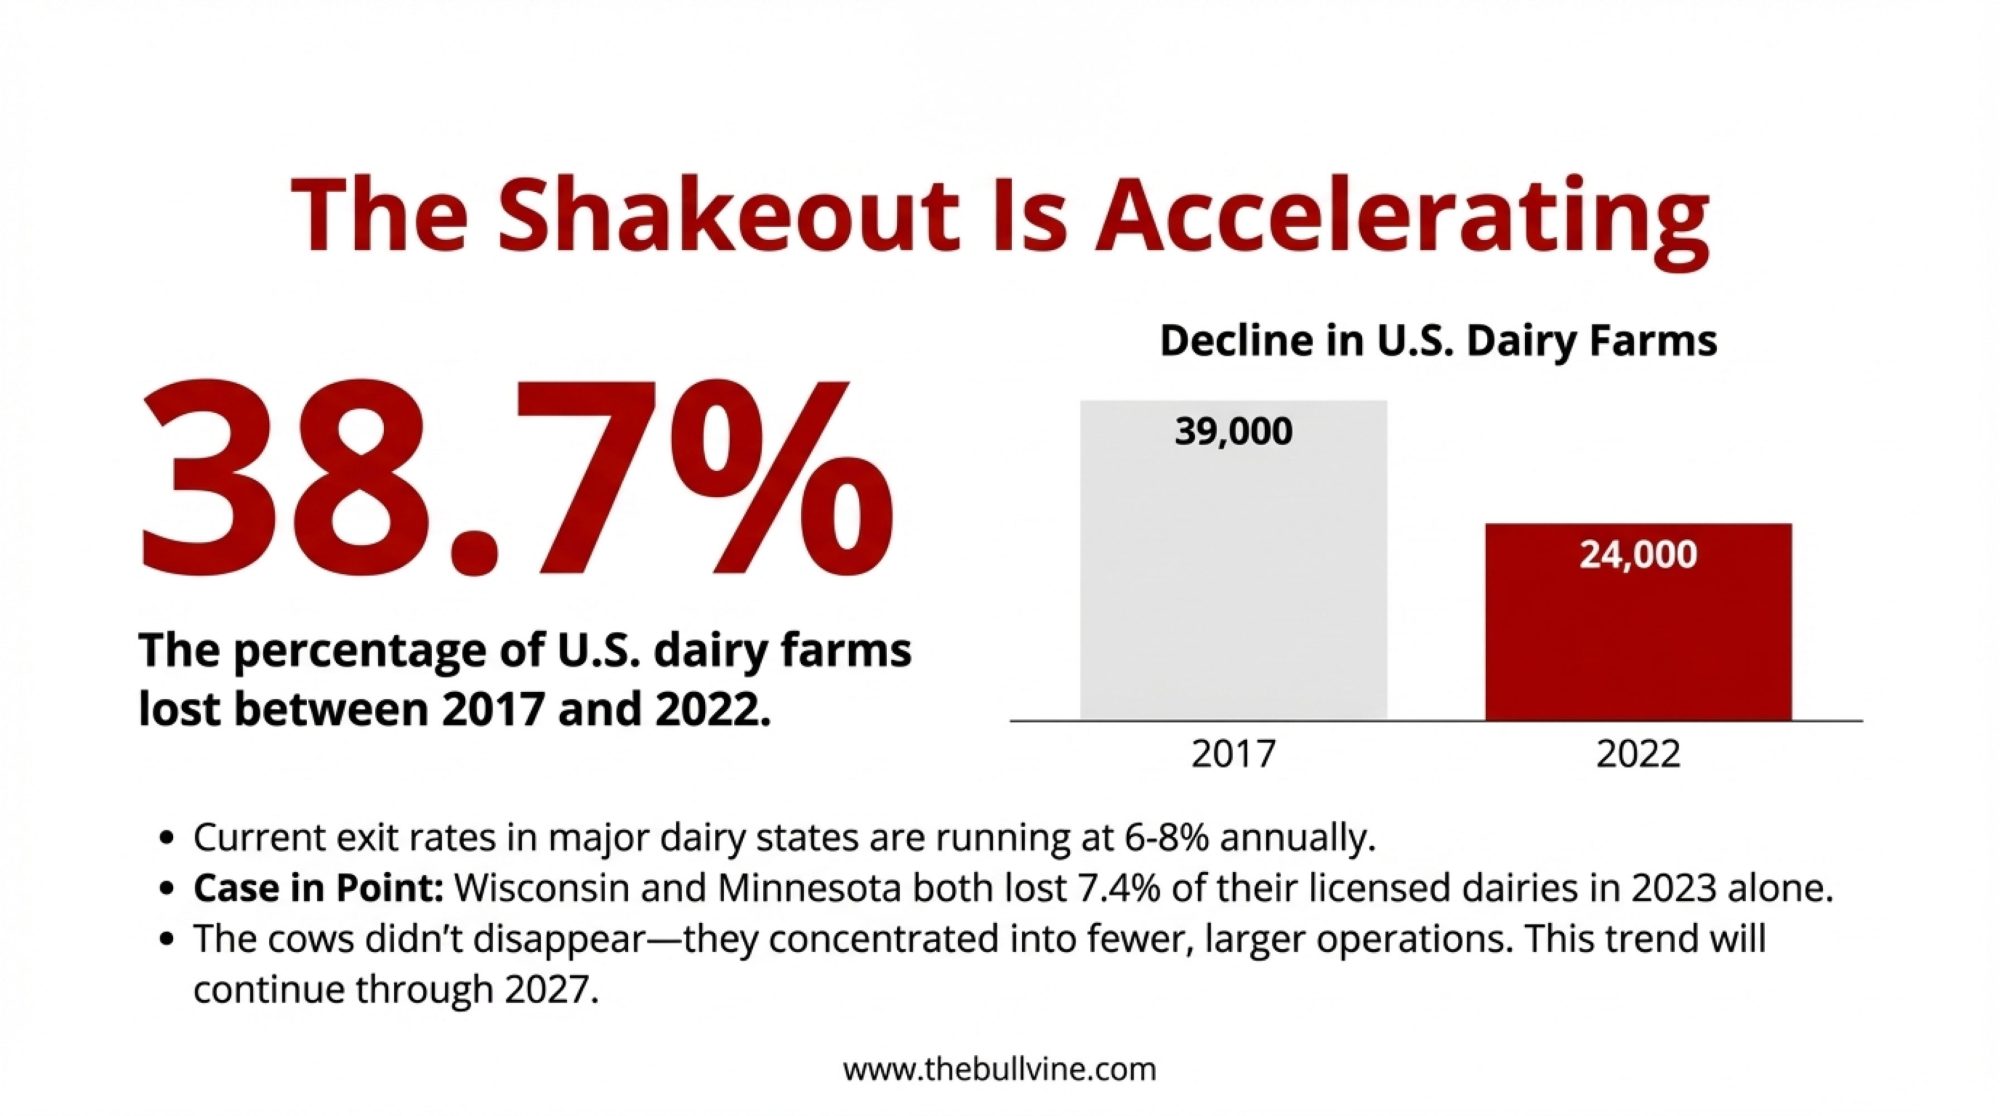
According to USDA Census data, the U.S. had about 24,000 dairy farms as of 2022, down from over 39,000 in 2017. That’s a 38.7% decline in five years. During this period, total milk production grew, and the national herd stayed near 9.4 million cows. The cows didn’t disappear—they concentrated into fewer, larger operations.
Current exit rates in major dairy states are running 6-8% annually. Wisconsin and Minnesota both saw 7.4% declines in 2023 alone.
Based on current cost structures and price forecasts, industry analysts project continued consolidation through 2026-2027, with exit rates potentially moderating toward 2028-2030 as the bottom of the cost curve exits and remaining operations stabilize.
These projections could shift based on several variables, including policy changes to the Dairy Margin Coverage program, unexpected demand recovery, disease events, or significant movements in feed costs. But they represent the trajectory suggested by current economics.
What’s Working: Patterns from Farms That Are Thriving
Certain patterns emerge among operations that are well positioned for this environment. None of this is magic—it’s execution.
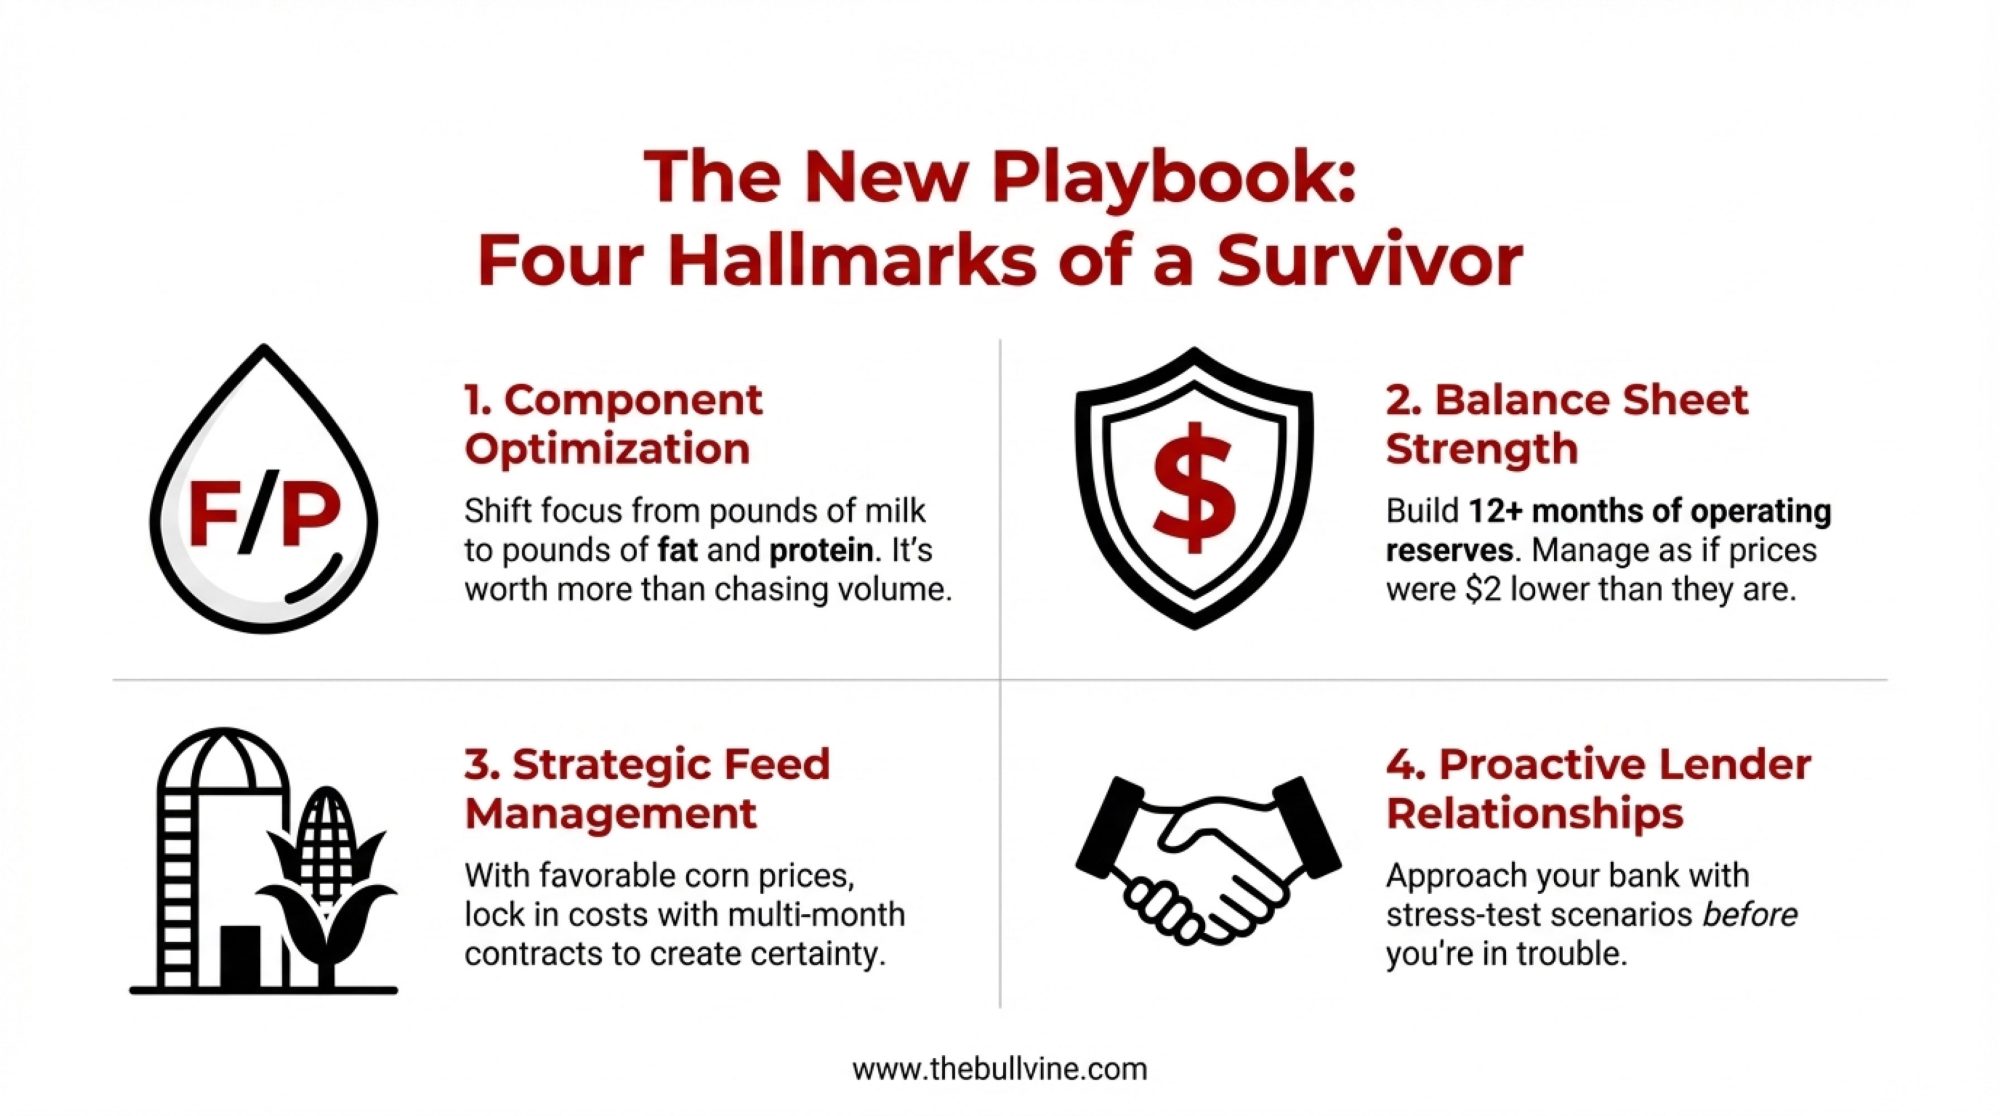
Component optimization. Forward-thinking operations are shifting focus from pounds of milk to butterfat and protein pounds. Producers selecting for component production and feed efficiency rather than just milk yield are seeing butterfat gains of 0.2-0.3 points and protein improvements of 0.1-0.15 points. At current component prices, that’s often worth more than chasing another 1,000 pounds of milk per cow.
Balance sheet strength. Farms that will weather extended price weakness are preserving every dollar of margin for cash reserves or debt reduction. Agricultural lenders consistently advise producers to manage as if prices were $2 lower than they actually are. The farms that build 12-plus months of operating reserves will have options. The ones operating margin-to-margin won’t.
Feed cost management. With corn prices relatively favorable—USDA projects season-average prices around $3.90 per bushel for 2025—strategic operations are securing pricing on multi-month contracts. The operation with 60% of corn needs forward-priced knows its costs precisely. That certainty creates planning ability when milk prices are volatile.
Proactive lender relationships. Farms approaching lenders early—before struggling—are presenting scenarios showing performance at $18, $17, and $16 per hundredweight. Lenders who understand an operation’s position in advance tend to be more flexible than those who discovering stress after the fact.
The Questions That Matter
As you evaluate your operation, here are the questions that will determine your future:
On your cost position: What’s your true cost of production? Not the industry average—your number. How many months can you sustain current conditions with the reserves you actually have?
On your market position: Is your milk optimized for what processors need? Do you know whether your processor has growing, stable, or declining capacity needs?
On your regional position: Is new processing capacity coming to your area? What’s happening with your neighbors—expanding, maintaining, or showing signs of exiting?
On your timeline: If you’re contemplating an exit, does acting sooner preserve more equity than waiting? If you’re committed to continuing, what specific improvements can you implement in the next 90 days?

The Bottom Line
The dairy industry that emerges from this period will feature fewer, larger, more efficient operations concentrated in regions with processing capacity and favorable cost structures. That’s the direction the data points, consistent with trends underway for decades—just compressed and accelerated.
Some farms will use this period to strengthen their position and emerge as regional leaders. Others will make the difficult but wise choice to exit while equity remains intact.
The market doesn’t care about your family history. It cares about your production costs. Do the math, or the bank will do it for you.
KEY TAKEAWAYS:
- This isn’t cyclical—it’s structural. China added 22 billion pounds of domestic milk production since 2018, permanently closing a market that absorbed half of global import growth.
- The cows are moving Southwest. Texas gained 46,000 head last year; Wisconsin lost 455 farms. $11 billion in new processing capacity is cementing this shift for decades to come.
- Scale now determines survival. Operations above $20/cwt are hemorrhaging cash at current prices. Larger dairies at $16-17/cwt are building war chests for acquisition.
- Beef-on-dairy bought time—at a price. Heifer inventories hit 20-year lows. Replacements are reaching $4,000 per head.
- Act while options exist. This shakeout accelerates through 2027. Know your true cost of production—before the bank calculates it for you.
Complete references and supporting documentation are available upon request by contacting the editorial team at editor@thebullvine.com.
Learn More:
- The $200K Dairy Margin Trap: What Cheap Feed Won’t Tell You About 2026 – Provides immediate tactical adjustments for cost control, revealing how weekly forage analysis and precise income-over-feed-cost (IOFC) calculations can uncover hidden margins even when feed prices look deceptively favorable.
- The Wall of Milk: Making Sense of 2025’s Global Dairy Crunch – Deepens the structural analysis by explaining the “24-month biological trap,” showing why global supply collisions in the EU and Argentina are keeping prices suppressed despite strong U.S. exports.
- The Beef-on-Dairy Wake-Up Call: What Some Farms Are Still Missing – Offers a strategic solution to the “heifer trap” mentioned above, demonstrating how to use genomic testing on the bottom 20% of the herd to balance beef premiums with adequate replacement generation.
 Join the Revolution!
 Join the Revolution!
Join over 30,000 successful dairy professionals who rely on Bullvine Weekly for their competitive edge. Delivered directly to your inbox each week, our exclusive industry insights help you make smarter decisions while saving precious hours every week. Never miss critical updates on milk production trends, breakthrough technologies, and profit-boosting strategies that top producers are already implementing. Subscribe now to transform your dairy operation’s efficiency and profitability—your future success is just one click away.


