18 months after Walmart opened its first milk plant, Dean Foods filed for bankruptcy. Plant #2 is now open. Mid-size dairies—what’s your move?
Executive Summary: Walmart’s second milk plant opened in Valdosta, Georgia, on December 2, 2025—and history offers a sharp warning. Dean Foods filed for bankruptcy just 18 months after Walmart launched its first plant. For mid-size dairies, this isn’t background noise; it’s a decision point. Three paths forward exist: scale to 1,500+ cows with processor commitments in writing, pivot to specialty markets with buyer agreements secured upfront, or exit strategically while cattle and land values hold. Your timeline isn’t set by milk prices alone—your lender’s risk appetite and your region’s Class I dependency matter just as much. Southeast producers face tighter constraints than Upper Midwest operations with cheese plant alternatives. The dairies that navigated the Fort Wayne transition successfully weren’t the biggest; they were the ones asking hard questions while everyone else was still waiting for news.

While the ribbon-cutting in Valdosta was all smiles and corporate handshakes, the silence in Georgia’s milking parlors was deafening. Walmart just cut another slice out of the middleman’s pie by opening its second owned-and-operated milk plant and sourcing directly from regional farms, and producers are rightfully asking: “Am I next?”
When Walmart opened its $350 million milk processing facility in Valdosta, Georgia, on December 2, 2025, it didn’t generate the national headlines you might expect for a project of this scale. But for those of us watching the dairy supply chain closely, it’s a development worth understanding.
This is Walmart’s second owned-and-operated dairy facility, following Fort Wayne, Indiana, back in 2018. A third plant in Robinson, Texas, is set to open in 2026. According to Walmart’s corporate announcement, the Valdosta plant will serve more than 650 stores and Sam’s Clubs across the Southeast under the Great Value and Member’s Mark labels.
What does this mean for producers? Well, that depends on your situation, your region, and your position in the supply chain. Let me walk through what we know and what it might suggest.
Dr. Mark Stephenson—who spent years as Director of Dairy Policy Analysis at the University of Wisconsin-Madison before his recent retirement—offers a useful perspective here. “We’re watching the supply chain reorganize in real time,” he’s noted. “When retailers capture processing margin internally, it changes the economics for everyone else in the chain.”
That’s neither inherently good nor bad—it’s a structural shift that creates both challenges and opportunities depending on where you sit.
I reached out to both Walmart and Dairy Farmers of America for their perspectives on this piece. Walmart pointed us to their public statements about the Valdosta facility. DFA didn’t respond to our request.
What We Learned from the Fort Wayne Transition
The pattern that emerged after Walmart’s Fort Wayne plant came online in 2018 offers a useful case study—both in terms of what went sideways for some producers and what went right for others.
Dean Foods, then America’s largest fluid milk processor, lost substantial Walmart volume when Fort Wayne opened. The company filed for Chapter 11 bankruptcy protection in November 2019—about 18 months later—in the Southern District of Texas under Case No. 19-36313. Now, it’s worth remembering that Dean was already facing significant headwinds: declining fluid milk consumption, aging infrastructure, and substantial debt. The Walmart contract loss accelerated an existing trajectory rather than creating it from scratch.
What happened next reshaped the cooperative landscape considerably. Dairy Farmers of America acquired 44 Dean Foods processing facilities for approximately $433 million in May 2020, according to DOJ filings related to the transaction. Industry analyses at the time suggested this significantly expanded DFA’s processing footprint—on the order of one-third more capacity, though the exact figure depends on how you measure it.
I’ve spoken with producers in Indiana and Ohio who experienced this transition firsthand, and their perspectives vary widely. One producer—who asked to remain anonymous because he still ships through a DFA-affiliated handler—described the compressed timeline: “We had maybe six months of warning before everything changed. Guys who moved fast found alternatives. Guys who waited got whatever terms were left.”
But I also spoke with Mike (not his real name), who runs about 900 cows in northeast Indiana and came through the transition in good shape. His approach was instructive. When Dean started showing financial stress in early 2019, he didn’t wait for official announcements. He spent three months building relationships with regional processors—before he needed them.
“By the time Dean went under, I had two backup options lined up,” he told me. “The difference wasn’t herd size or butterfat performance or who had the best fresh cow protocols. It was just who started making phone calls earlier.”
That’s a lesson worth holding onto: early information gathering creates options that may not exist later.
Regional Market Structures: Why Location Matters So Much
Here’s something that deserves more attention in industry discussions: the same consolidation trend creates very different situations depending on where you’re located.
The USDA Agricultural Marketing Service tracks Class I utilization—the percentage of milk going to fluid beverage use versus manufacturing—by Federal Order. The numbers tell an interesting story about regional market structure:
- Florida Federal Order: Class I utilization runs around 82%, meaning the vast majority of milk goes to fluid products
- Southeast Federal Order: Generally in the mid-to-high 70s for Class I utilization
- Upper Midwest Federal Order: Roughly 8-10% Class I utilization—almost all the milk goes to cheese, butter, and powder

Think about what this means practically. A Wisconsin producer in the I-29 corridor has remarkable market flexibility. Dozens of cheese plants, butter manufacturers, and powder processors compete for milk within a reasonable trucking distance. If one buyer changes terms, alternatives exist. You might take a hit on hauling costs or accept different component premiums, but you’ve got options.
A Georgia producer faces a fundamentally different situation. According to UGA Extension’s most recent data, Georgia currently has on the order of 75-80 dairy farms, averaging roughly 1,000-1,050 cows each. Georgia Farm Bureau reports those farms produced about 227 million gallons of milk in 2024. And before Valdosta opened, Georgia Milk Producers confirms the state had exactly two commercial milk processing plants—in Atlanta and Lawrenceville.
“We’re working with a more concentrated market,” one South Georgia producer explained to me last month. “When your milk has to go to fluid processing, and there are limited plants in the region, the negotiating dynamics are just different than what our friends in Wisconsin experience.”
This isn’t about one region being better than another—it’s about understanding how market structure shapes your strategic options. A trucking constraint of roughly 300 miles for fluid milk (where economics start to get challenging) means Southeast producers can’t easily access Midwest cheese markets as an alternative outlet.
Understanding the Cooperative Landscape
This topic generates strong opinions, and I want to approach it thoughtfully. DFA’s position in the market is complex, and reasonable people can disagree about what it means.
When DFA acquired those 44 Dean Foods plants in 2020, it created something unusual: an organization that simultaneously represents milk producers as a cooperative and purchases milk from producers as a processor. The USDA Packers and Stockyards Division has examined this dual structure.
This arrangement has faced legal scrutiny over the years. A federal lawsuit filed by Food Lion and the Maryland-Virginia Milk Producers Cooperative in May 2020 (Middle District of North Carolina, Case No. 1:20-cv-00442) raised questions about market practices. DFA has also paid or agreed to pay settlements in various pricing cases: $140 million in a Southeast settlement back in 2013, $50 million in a Northeast settlement in 2015, and most recently about $34.4 million (combined with Select Milk Producers) in July 2025, according to Reuters coverage of that agreement.
So how should producers think about this? Here’s my read on the tradeoffs:
The case for cooperative membership is genuine:
- Guaranteed milk pickup provides real security, especially in volatile markets
- An extensive processing network offers market access across regions
- Collective bargaining can deliver input cost advantages
- For producers without strong independent processor relationships, membership provides a reliable home for their milk
The considerations are also worth weighing:
- Various fees and deductions typically reduce effective milk prices—I’ve reviewed producer milk checks showing $1.50-4.00/cwt below Federal Order minimums, though this varies considerably by situation
- Equity contributions may be locked for extended periods with limited liquidity
- Governance structures naturally give larger members more influence
- The processing division’s interests don’t always align perfectly with member pricing
The right answer depends entirely on your specific situation. For some operations, cooperative membership is clearly the best choice. For others with strong independent relationships, different arrangements make more sense. The key is evaluating your actual options rather than making assumptions either way.
| Aspect | Membership Upside | Membership Considerations |
| Milk pickup | Guaranteed pickup, logistical security | Hauling and service fees reduce net price |
| Market access | Extensive processing network | Limited ability to pursue independent buyers |
| Milk price | Collective bargaining benefits | $1.50–4.00/cwt below Federal Order minimums |
| Equity | Ownership stake in system | Equity locked, limited short‑term liquidity |
| Governance | Voice through member structure | Larger members hold more influence |
| Processor alignment | Shared interest in volume | Processing margin may not align with member pricing |
The Economics of a Mid-Size Operation
Let me walk through some representative numbers, because I find concrete figures help clarify the discussion.
A 600-cow dairy—fairly typical for a mid-size operation in the Southeast or Mid-Atlantic—produces roughly 150,000 hundredweight of milk annually at 25,000 pounds per cow. That’s achievable with good genetics, solid fresh-cow management, and attention to transition-period health.

Current economics, as best we can estimate:
- All-milk prices have been running in the $22-24/cwt range, depending on region and components, with USDA’s December 2024 figure coming in around $23.30/cwt, according to Brownfield Ag News
- Gross revenue at $23/cwt: roughly $3.45 million
- Many university and FINBIN-type benchmarks suggest total costs for mid-size commercial dairies commonly fall in the high-teens to low-$20s per cwt, depending on feed costs, labor markets, and debt structure
- Annual margin: perhaps $300,000-450,000 in favorable conditions
It’s worth noting that feed costs remain a significant variable right now. Corn and soybean meal prices have moderated from their 2022 peaks, but purchased feed still represents 40-50% of total costs for most operations. And labor—particularly finding reliable, skilled help for milking and fresh cow protocols—continues to challenge operations across most regions. These factors can swing your actual cost of production by $1-2/cwt in either direction.
That margin covers debt service, family living expenses, capital reserves, equipment replacement, and taxes. It works—but it doesn’t leave much buffer for extended downturns, as many of us have experienced firsthand.
The sensitivity is worth understanding: every $1/cwt price decline reduces this operation’s annual income by $150,000. That’s $12,500 monthly. For a 600-cow barn at these benchmarks, at $19/cwt milk, margins get tight. At $18/cwt sustained over 12-18 months, working capital generally starts to deplete.

Now, here’s some important context: larger operations often achieve meaningfully lower production costs meaningfully. Highly efficient herds in the 2,500-cow-and-up range can, in some documented cases, drive total costs into the mid-teens per cwt—say $14.50-16.00. That advantage comes from spreading fixed costs, volume purchasing power, dedicated transition facilities, and automation investments that require scale to justify.
This isn’t a criticism of mid-size management—many mid-size operations are exceptionally well-run. It’s simply the mathematics of fixed cost allocation. Understanding this dynamic helps inform strategic thinking.
| Dimension | 600‑Cow Mid-Size Herd | 2,500‑Cow+ Large Herds |
| Annual milk per cow | ~25,000 lbs | Similar or slightly higher |
| Total cost per cwt | High‑teens to low‑$20s | $14.50–16.00 per cwt |
| Fixed cost per cow | Higher per cow | Lower per cow via scale |
| Purchasing power | Standard feed and input pricing | Volume discounts, stronger vendor leverage |
| Automation investment | Limited by capital | More justified: robots, rotary parlors, tech |
| Margin resilience | Tight margins, less downturn buffer | More buffer to ride price dips |
The Credit Dimension
Here’s an aspect of industry economics that deserves more discussion: how agricultural lenders respond to sector-wide changes.
A Farm Credit loan officer shared his perspective with me recently (off the record, as is typical for these conversations): “We’re not predicting which farms will succeed. But we are required to manage portfolio risk. When we see structural shifts in an industry, our credit committees ask harder questions about renewals and terms.”
This matters because agricultural lenders operate under regulatory requirements—Farm Credit Administration examination standards and Basel III provisions—that mandate risk management responses to changing sector conditions.
The practical implications:
- When industry consolidation becomes visible, lenders flag portfolios for review
- Credit line renewals may face additional documentation requirements
- Covenant thresholds (typically 45-50% debt-to-asset ratios) get enforced more carefully
- Operations near covenant limits may face restructuring conversations
Dr. David Kohl—Professor Emeritus of Agricultural Finance at Virginia Tech, who’s consulted with farm lenders for decades—makes an important observation: producers sometimes don’t realize their decision timeline is partly defined by their lender’s risk tolerance, not just their own cash flow.
This isn’t about lenders being difficult—it’s about understanding how institutional constraints shape available options. Knowing this in advance lets you plan accordingly.
Three Strategic Directions Worth Considering
Based on current conditions and conversations with producers who’ve navigated similar transitions, three general pathways emerge. Each has different requirements and realistic odds of success.
Pathway 1: Scaling to 1,500-2,500+ Cows
What this typically requires:
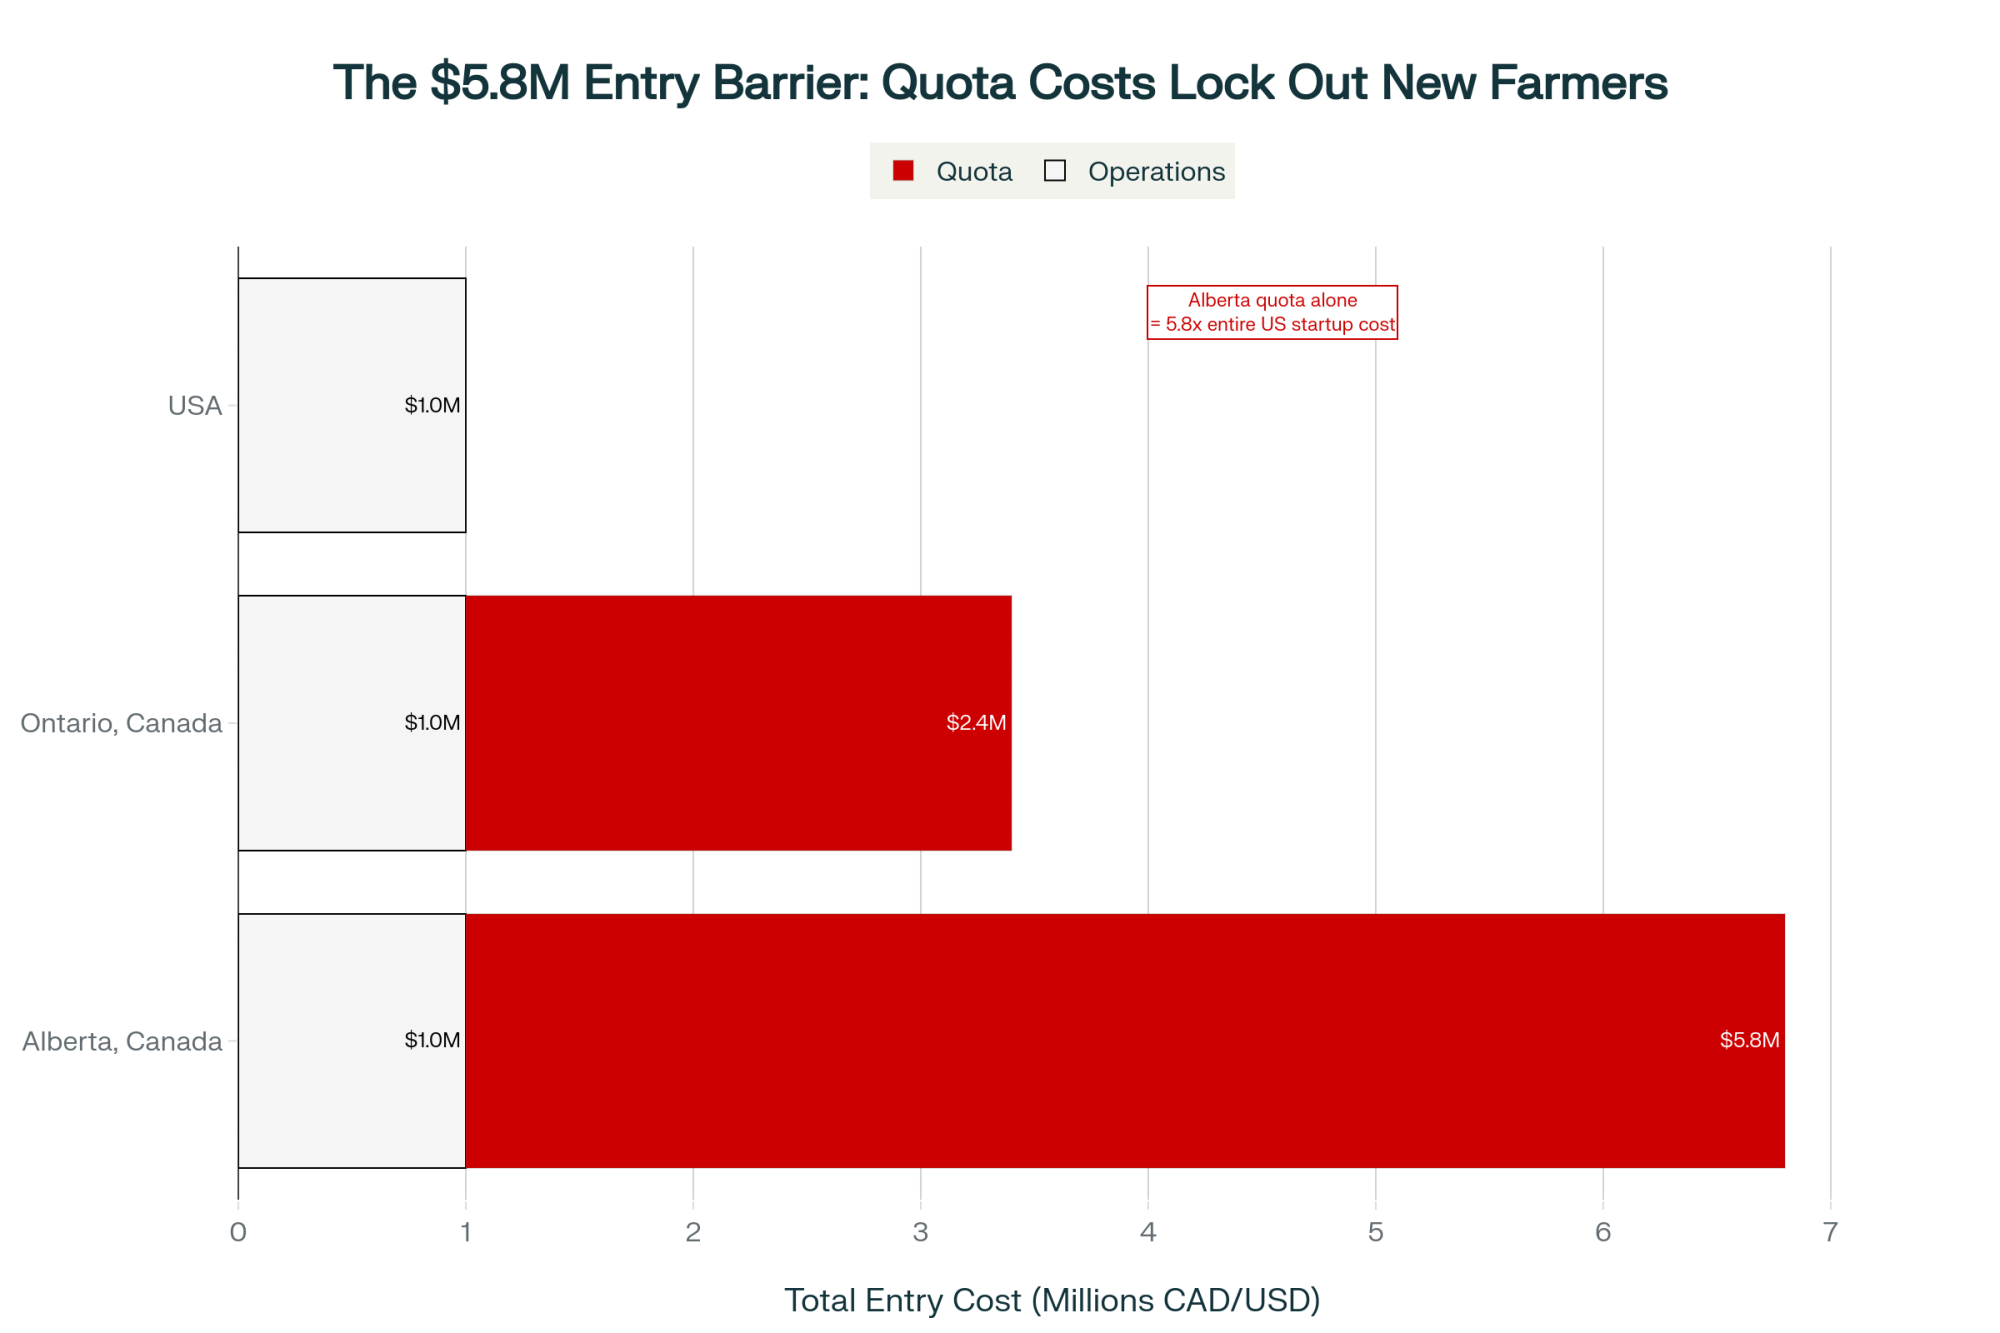
- Capital investment of $3.5-7.5 million for facilities, animals, and working capital
- Processor commitment (in writing) before lenders will typically approve expansion financing
- Current debt-to-asset ratio below 50%—many mid-size operations run higher
- Access to replacement heifers in a constrained market
Regarding heifers: USDA data shows the national replacement heifer inventory has declined about 18% from 2018 levels, to around 3.92 million head. Premium springers at California and Minnesota auction barns have been bringing $3,500-4,000 per head, while USDA’s mid-2025 national average is around $3,010. This creates a real constraint on expansion timelines.
There’s another factor that doesn’t get enough attention: regulatory and permitting requirements. Depending on your state and county, expanding from 600 to 2,000 cows may trigger new CAFO permitting thresholds, nutrient management plan requirements, and neighbor notification processes. In some regions—particularly parts of the Upper Midwest and Northeast—these timelines can add 12-18 months to an expansion project. I’ve seen producers budget the capital and line up the heifers, only to spend a year and a half working through environmental review. Factor this into your planning if you’re seriously considering this path.
Realistic assessment: This pathway generally works best for operations with existing scale infrastructure, strong lender relationships, and confirmed processor partnerships. From what I’m seeing, success probability runs maybe 30-40% for operations currently in the 500-800 cow range, based on capital access constraints and market conditions.
Pathway 2: Specialty Market Transition
Options worth evaluating:
- Organic certification: 36-month transition absorbing higher input costs before receiving organic premiums. Current organic prices are $26-28/cwt, according to USDA data, but buyer capacity is limited in many regions.
- A2 milk: Requires 5-7 years of genetic transition through breeding and culling. Buyer infrastructure is still developing, particularly outside major metro areas.
- Grass-fed/regenerative: 2-3 year infrastructure development for rotational grazing. Works better in some climates than others—those July temperatures in South Georgia make intensive grazing pretty challenging compared to, say, Vermont or Wisconsin.
I spoke with a producer in Pennsylvania—she asked me not to use her name—who completed an organic transition in 2021 after three years of planning. “The transition period was brutal financially,” she told me. “But I had my buyer commitment from Organic Valley before I started, and that made all the difference. Neighbors who converted without a commitment lined up… some of them waited eight, nine months for a market. You can’t cash flow that.”
Realistic assessment: Specialty markets can transform mid-size economics when accessible. The key is securing buyer commitment before incurring transition costs. With a confirmed buyer in place, the success probability runs perhaps 50-65%. Without pre-transition commitment, it’s considerably lower.
Pathway 3: Strategic Exit
This option deserves serious consideration rather than dismissal. For some families, it’s the path that best serves long-term financial security.
What orderly exit typically preserves:
- Cattle values at current market prices (quality milking cows around $2,000/head per recent USDA livestock reports)
- Land values before any consolidation-related softening
- Equipment values through private sale versus auction liquidation
As an illustrative example—and I want to be clear, these numbers are scenario-based rather than universal—a 600-cow operation with 800 acres in a reasonably strong land market might preserve something like $5.5-6.0 million in net equity with a carefully planned 12-18-month exit after debt payoff.
What pressured liquidation often costs:
- Cattle at distress prices: typically 75-80% of normal market value
- Land under time pressure: often 80-85% of fair value
- Equipment at auction with other distressed sellers: sometimes 45-55% of book value
- Potential recovery in this scenario: perhaps $3.5-4.0 million
| Dimension | Orderly 12–18‑Month Exit | Forced / Distress Liquidation |
| Cattle prices | Around current market ($2,000/head) | 75–80% of normal value |
| Land sale | Near full fair market value | 80–85% of value under pressure |
| Equipment value | Better via private sale | 45–55% of book at auction |
| Net equity example | $5.5–6.0M preserved | $3.5–4.0M recovered |
| Decision timing | Proactive, with planning runway | Reactive, after cash and credit crunch |
The difference—potentially $1.5-2.5 million in preserved family wealth—is substantial. Your specific numbers will vary based on region, debt load, and market timing, but the principle holds.
A Wisconsin producer I know—he’s given me permission to share this—made the exit decision in 2022 with 650 cows and came out with enough to pay off all debt, set up his son in a different agricultural enterprise, and retire comfortably. “Hardest decision I ever made,” he told me. “But waiting another three years would have cost us at least a million dollars. The numbers don’t lie.”
Dr. Kohl has worked with families on both sides of this decision. His observation: “The ones who made proactive decisions came out in far better financial position than those who waited until circumstances forced their hand. The hardest part is accepting that exiting strategically isn’t giving up—it’s making the best decision with available information.”
| Pathway | Core Requirements | Key Advantages | Major Risks / Constraints |
| Scale to 1,500–2,500+ | $3.5–7.5M capital, written processor commitment | Lower cost per cwt, stronger plant leverage | Heifer shortage, permitting delays, lender appetite |
| Specialty markets | Buyer agreement before transition, multi‑year planning | Premium prices (organic, A2, grass‑fed) | Limited buyer capacity, tough transition cash flow |
| Strategic exit | 12–18‑month planned wind‑down, asset valuation work | Preserves $1.5–2.5M more equity | Emotional difficulty, timing decisions |
Looking Toward 2030
Industry projections suggest continued structural evolution, though the pace and extent remain uncertain. USDA Economic Research Service data and academic analyses from places like Wisconsin and Cornell point toward some likely trends:
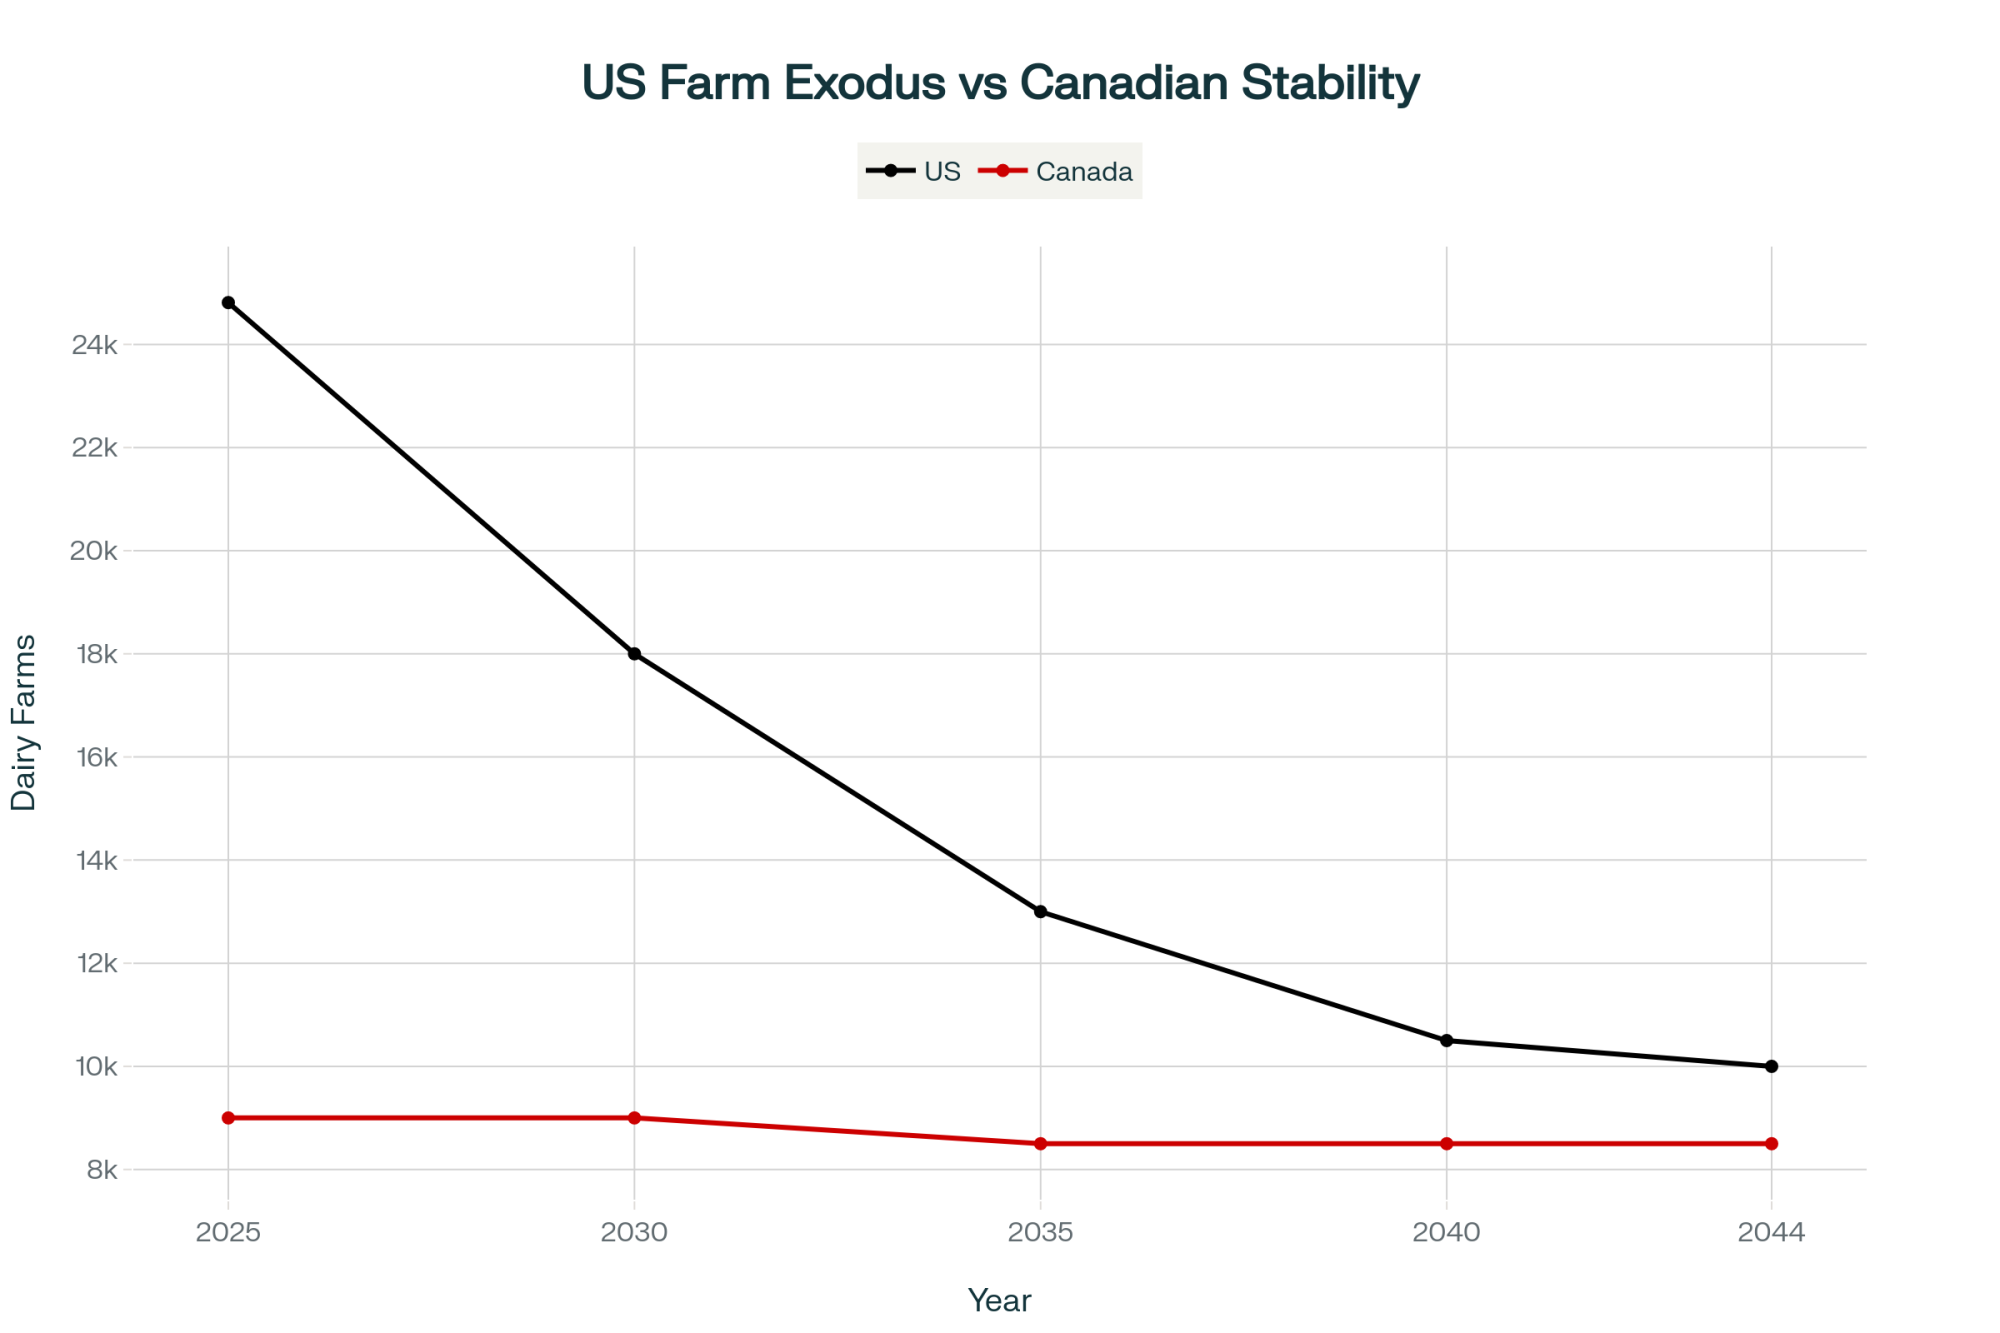
- Continued farm count decline: If current closure and consolidation rates continue, several credible analyses suggest U.S. dairy farm numbers could fall into the mid-teens of thousands by 2030—perhaps 15,000-18,000 operations, compared to higher numbers today
- Increasing herd concentration: Rabobank analysis shows roughly 65% of the national dairy herd already lives on 1,000+ cow operations. That share could reach perhaps three-quarters of cows by decade’s end if trends continue
- Processing evolution: Continued shifts in processing ownership and structure, with remaining capacity increasingly concentrated
Regional variation matters considerably here. The Southeast and Mid-Atlantic, with their reliance on Class I markets, may see faster adjustment than the Upper Midwest, with its diverse cheese and manufacturing base.
This isn’t necessarily negative—the remaining operations will likely be financially strong and highly capable. But the structure is evolving, and mid-size operations occupy a challenging position in that evolution.
The Value of Early Information
What I keep coming back to is timing. The producers who successfully navigated the Fort Wayne transition were generally the ones who started asking questions before the answers became obvious to everyone.
Here are conversations worth having in the next month or two:
With your lender:
- What’s our current debt-to-asset position relative to your covenant thresholds?
- How would an expansion proposal be received in the current environment?
- What scenarios would trigger concern about our operating line?
With your processor or cooperative:
- How do you see your capacity and operations evolving through 2027-2028?
- Are there volume commitments or contract structures worth discussing?
- How is retail processing expansion affecting your planning?
With trusted advisors:
- What are realistic current valuations for our assets?
- What’s the tax-optimized approach for different strategic directions?
- What are we not considering that we should?
The goal isn’t rushed decisions—it’s gathering information while options remain open.
| Factor | Early Movers (Prepared) | Late Movers (Waited) |
| Timeline | Backup options lined up ~6 months ahead | Waited for official announcements |
| Processor relationships | Proactively built with regional plants | Scrambled after Dean collapse |
| Contract terms | Negotiated better hauling and price terms | Accepted remaining, less favorable deals |
| Stress level | More control, planned changes | High stress, limited leverage |
| Outcome | Generally maintained stable markets | Higher risk of poor terms or stranded milk |
The Bottom Line
What I see in the current environment is a transition, not a crisis. Those are different things. Transitions allow preparation time for those who use it.
The market reality:
- Retail vertical integration is changing how processing margin flows through the supply chain
- Regional market structures create meaningfully different situations for different producers
- Cooperative membership involves tradeoffs worth evaluating for your specific situation
What this suggests for planning:
- Understand where you sit on the cost curve and what that implies for your operation
- Know your credit position and how your lender likely views sector conditions
- Think through which strategic direction genuinely fits your operation, capital position, and family goals
On timing:
- Information gathered now creates options later
- Decision windows narrow gradually but persistently
- Strategic choices made proactively typically preserve more value than reactive ones
On risk management:
- Whatever pathway you’re considering, don’t overlook the tools available through USDA’s Dairy Margin Coverage program and Livestock Gross Margin for Dairy (LGM-Dairy). They won’t solve structural challenges, but they can provide a floor during the transition period while you’re executing your strategic plan. Your local FSA office or a crop insurance agent familiar with dairy can walk you through the current coverage options and premium costs.
The dairy industry has navigated significant transitions before and will do so again. Operations that approach current conditions with clear information, realistic assessment, and thoughtful timing will be well-positioned—regardless of which path they choose.
The least favorable outcome isn’t choosing Path 1, 2, or 3. It’s deferring the evaluation until circumstances make the choice for you.
For additional resources on dairy operation analysis and planning, contact your state extension service. The University of Wisconsin’s Dairy Marketing and Risk Management Program at dairymarkets.org offers valuable tools for price risk analysis, and the USDA’s Dairy Margin Coverage information is available at fsa.usda.gov
Key Takeaways:
- 18 months—that’s the precedent: Dean Foods filed bankruptcy 18 months after Walmart’s first plant opened. Plant #2 launched on December 2, 2025.
- Three paths, three price tags: Scaling requires $3.5-7.5M and processor commitments in writing. Specialty markets need buyer agreements before you transition. Strategic exit preserves $1.5-2.5M more equity than forced liquidation.
- Your region shapes your risk: Southeast Class I markets have 2-3 processor options. Upper Midwest cheese country has dozens. Same trend, completely different exposure.
- Lenders may move before you do: At 45-50% debt-to-asset ratios, credit committees tighten terms regardless of milk prices. Your timeline isn’t just about cash flow.
- Early movers had options; late movers got leftovers: The producers who navigated Fort Wayne had backup relationships six months before the headlines hit. By then, the best deals were gone.
Complete references and supporting documentation are available upon request by contacting the editorial team at editor@thebullvine.com.
Learn More:
- The Rules Changed and Nobody Told You: Three Paths Left for the 300-Cow Dairy – Provides a specific survival framework for smaller operations (under 500 cows), contrasting with the main article’s 600-cow model, and details the “investment vs. exit” equity calculations that every producer must run before credit markets tighten further.
- America’s 800,000-Heifer Crisis: How Chasing Beef Premiums Broke Our Replacement Pipeline – Explains the “heifer trap” preventing many expansions today and offers immediate tactical breeding adjustments to secure your replacement inventory before costs hit the predicted $3,000+ mark in 2026.
- How AI is Banking Dairy Farmers an Extra $400 Per Cow – Demonstrates how integrating AI health monitoring and precision feeding can deliver the efficiency gains needed to survive lower margins, offering a clear ROI roadmap for producers who aren’t in a position to double their herd size.
 Join the Revolution!
 Join the Revolution!
Join over 30,000 successful dairy professionals who rely on Bullvine Weekly for their competitive edge. Delivered directly to your inbox each week, our exclusive industry insights help you make smarter decisions while saving precious hours every week. Never miss critical updates on milk production trends, breakthrough technologies, and profit-boosting strategies that top producers are already implementing. Subscribe now to transform your dairy operation’s efficiency and profitability—your future success is just one click away.