Your kid’s sweat equity is worth $0 without a signed agreement. A 2025 dairy farm court ruling just proved it the hard way.
Executive Summary: If your succession plan only lives in family conversations, this piece shows why that’s a bet you can’t afford to keep making. A 2025 Ontario court ruling in Metske v. Metske cut six years of a son’s sweat equity down to $31,700, because the family never put clear price, terms, or timelines on the transfer. At the same time, U.S. dairy farm numbers are down 39% in five years, farmland has more than doubled in value since 2010, and average net earnings sit around $592 per cow — a mismatch that makes “equal” inheritance almost impossible to cash‑flow. You see the flip side in Minnesota’s 150‑year Heusinkveld dairy, where education, scale, and structure give the next generation a real shot instead of just hopes and handshakes. The article walks you through why “equal” splits usually force a sale, while “equitable” transfers — separate entities for land and cows, earned buy‑ins, and written, bank‑vetted agreements — keep the doors open. You also get hard numbers to work with (4:1 max debt‑to‑EBITDA, 1.25+ term debt coverage, current FSA rates) and a 90‑day triage plan to start turning vague expectations into signed paper your lender and your kids can actually rely on.
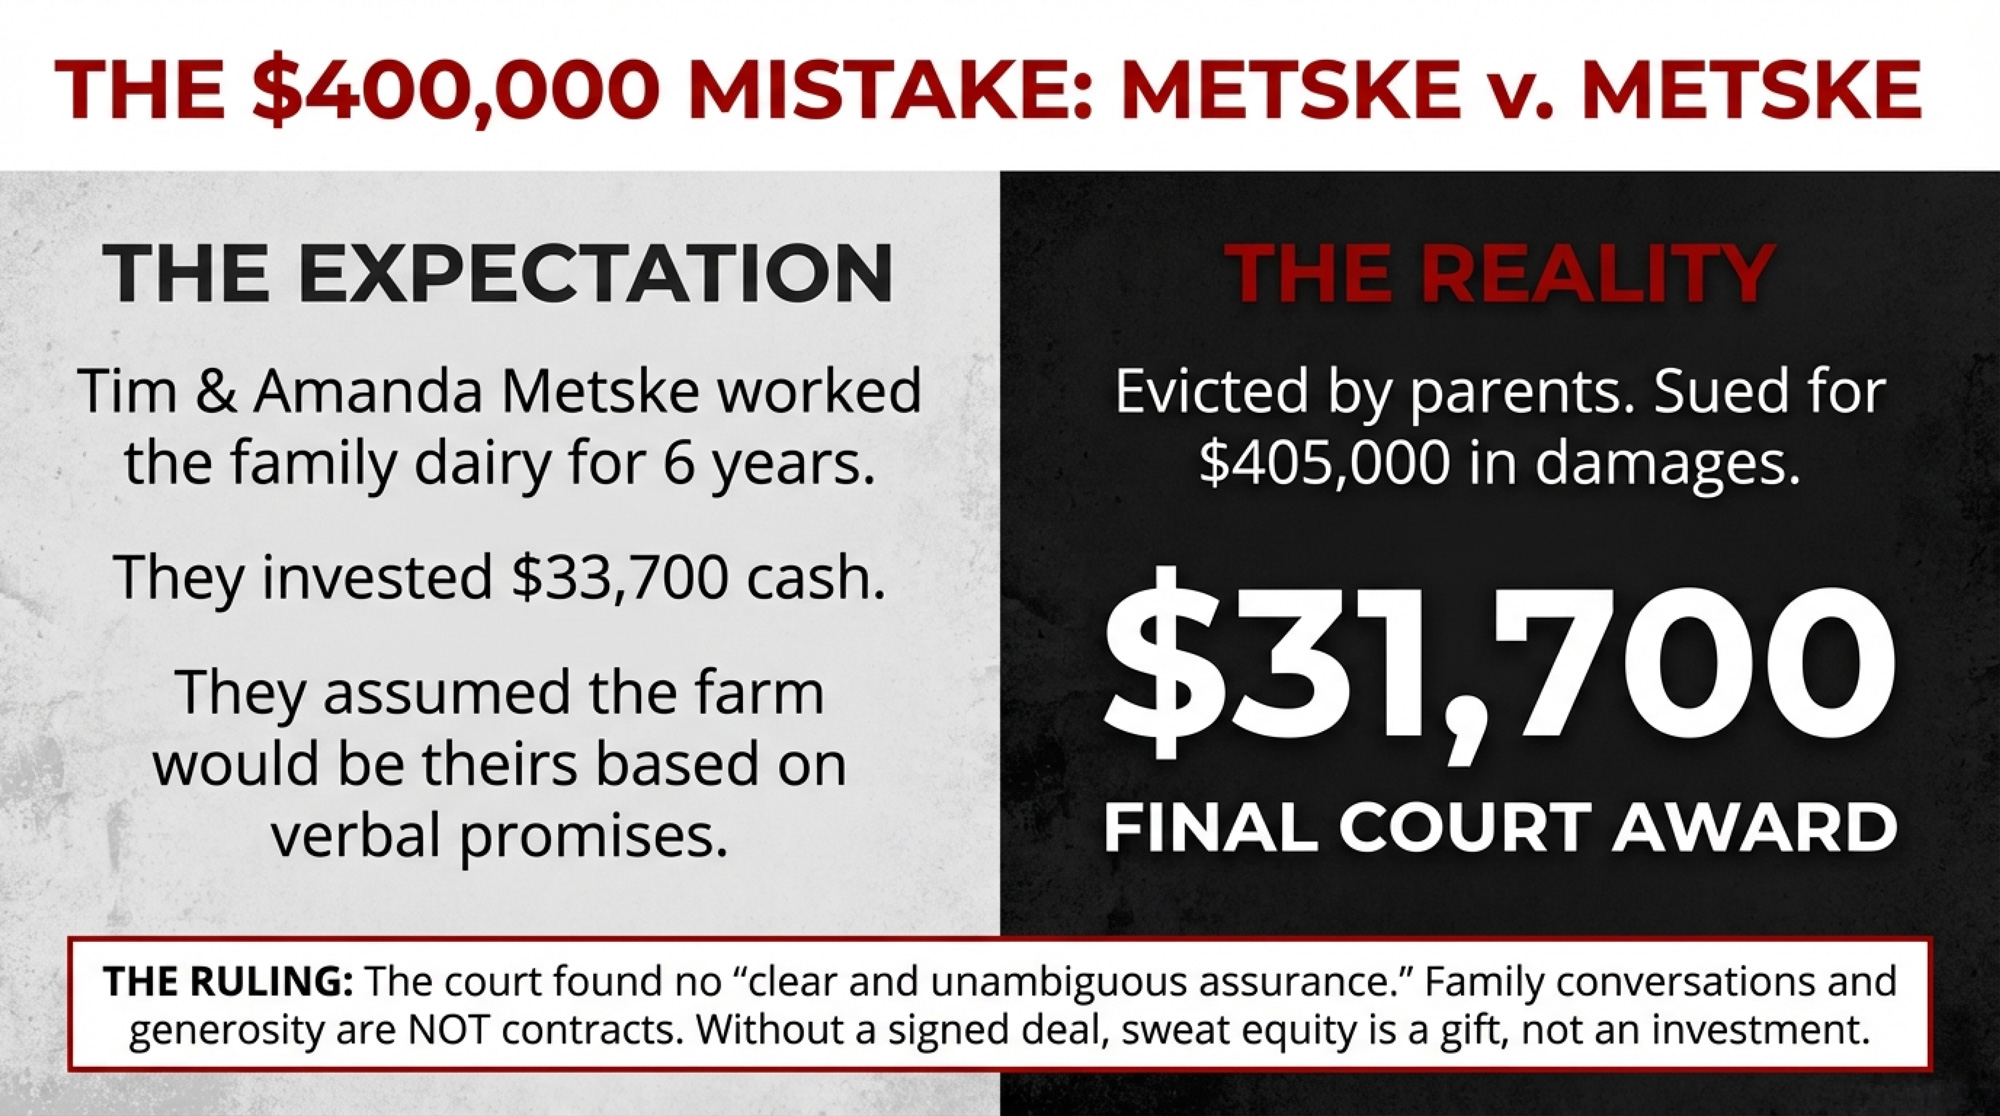
By every outward measure, Tim Metske was building his future. Starting around 2012, he and his wife, Amanda, ran his parents’ Ontario dairy — bought the herd from Martin and Roseanne Metske for approximately $90,000 (funded by a bank loan Martin co-signed), leased the quota, and drew up a business plan for the bank. They invested $33,700 of their own money in property improvements, including a furnace and repairs. The whole time, they operated under what the trial judge later described as “favourable but undefined” terms for eventually acquiring the land and buildings.
Nobody wrote anything down.
In April 2018, Roseanne told them to leave by the end of May. Forced off the land and without the dairy quota attached to it, they disposed of the herd at a loss and sued. The trial judge awarded $405,000 in damages. Martin and Roseanne appealed. In 2025, the Ontario Court of Appeal — in Metske v. Metske, 2025 ONCA 418 — overturned the bulk of that award and reduced Tim and Amanda’s recovery to $31,700: the net value of tangible improvements minus $2,000 in damages to the farmhouse.
Six years of sweat equity, reduced to a number smaller than the original investment. The court couldn’t build a structure that the family never built.
Why the Court Ruled the Way It Did
The Court of Appeal’s reasoning exposes exactly why informal dairy farm succession plans collapse.
The court found no “clear and unambiguous assurance.” The Metskes’ family conversations never crystallized beyond a willingness to negotiate. Price, financing, timing, and even which properties were included — all remained undefined. An “agreement to agree,” the court held, isn’t enough to ground a legal claim.
Here’s the part that should keep every dairy family up at night: Tim and Amanda’s own business plans worked against them. The documents they’d prepared for the bank showed acquisition at fair market value. The Court of Appeal said this contradicted any claim of a promised below-market deal. Martin’s past generosity, even Roseanne’s warm words at the wedding, weren’t enough to establish “donative intent”.
And the financial reality sealed it. When Tim tried to secure financing for the dairy quota in 2013, the bank insisted on a 10-year amortization, which the projected cash flow couldn’t support. From that moment forward, the contemplated succession was financially dead — but nobody acknowledged it for another five years.
As Lerners LLP noted in their analysis: proprietary estoppel “protects against the unfairness of a promisor resiling from a promise, not against the commercial risk of an aspirant purchaser who cannot perform”.
The law can’t save you from a plan that was never a plan.
What Is Proprietary Estoppel — And Why Should You Care?
You’ve probably never heard this term. But if your succession “plan” is built on verbal promises, it’s the legal concept that will decide your family’s future.
Proprietary estoppel is a legal claim that arises when one person relies on another’s promise regarding property — and suffers a loss when that promise is broken. In farm succession disputes, the incoming generation typically argues: “You told me I’d get the farm, I worked for years based on that promise, and now you’ve pulled the rug out.”
The Metske ruling shows how hard it is to win this claim. Ontario’s Court of Appeal required a “clear and unambiguous assurance” — not vague encouragement, not general family goodwill, not a willingness to negotiate someday. The court also demanded proof that the promise was specifically intended as a commitment, not just an optimistic conversation. Tim and Amanda’s own bank documents — showing they expected to buy at fair market value — contradicted any claim of a guaranteed below-market deal.
The bottom line: “My dad said I’d get the farm” is not a contract. It’s not even close. If the terms aren’t written, signed, and witnessed — with independent legal advice for both sides — they don’t exist in the eyes of the law.
The Numbers Behind the Crisis
The Metskes aren’t an outlier. They’re a pattern.
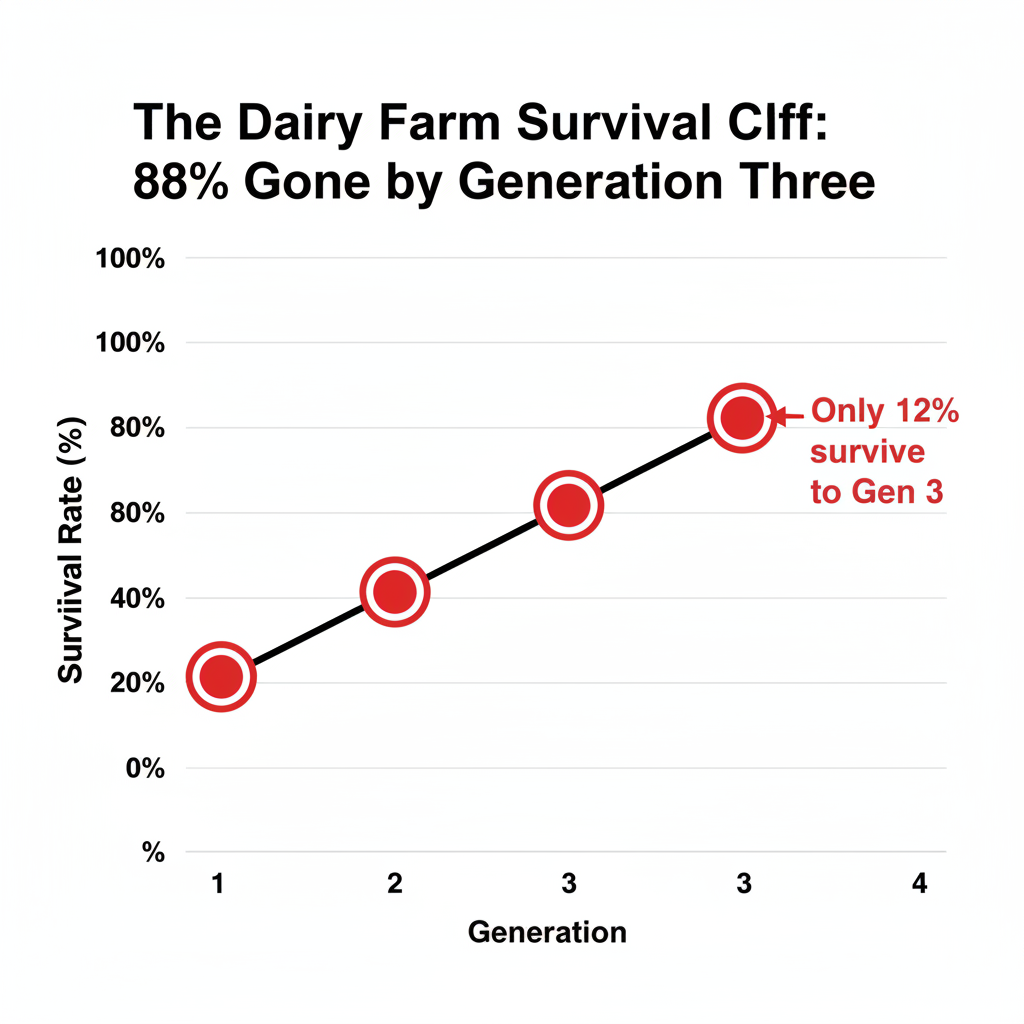
Ron Hanson, professor emeritus at the University of Nebraska, has spent his career studying farm succession. His numbers: 30% of family farms survive to the second generation. Just 12% make it to the third. Only 3% reach the fourth. John Ward’s foundational 1987 research at Northwestern’s Kellogg School of Management found similar results across all family businesses — roughly 30% to the second generation, 10–15% to the third.
Nearly 9 in 10 family farms don’t survive to see a third generation at the helm. Not because the kids don’t want the farm. Because nobody built the structures to make the transfer work.
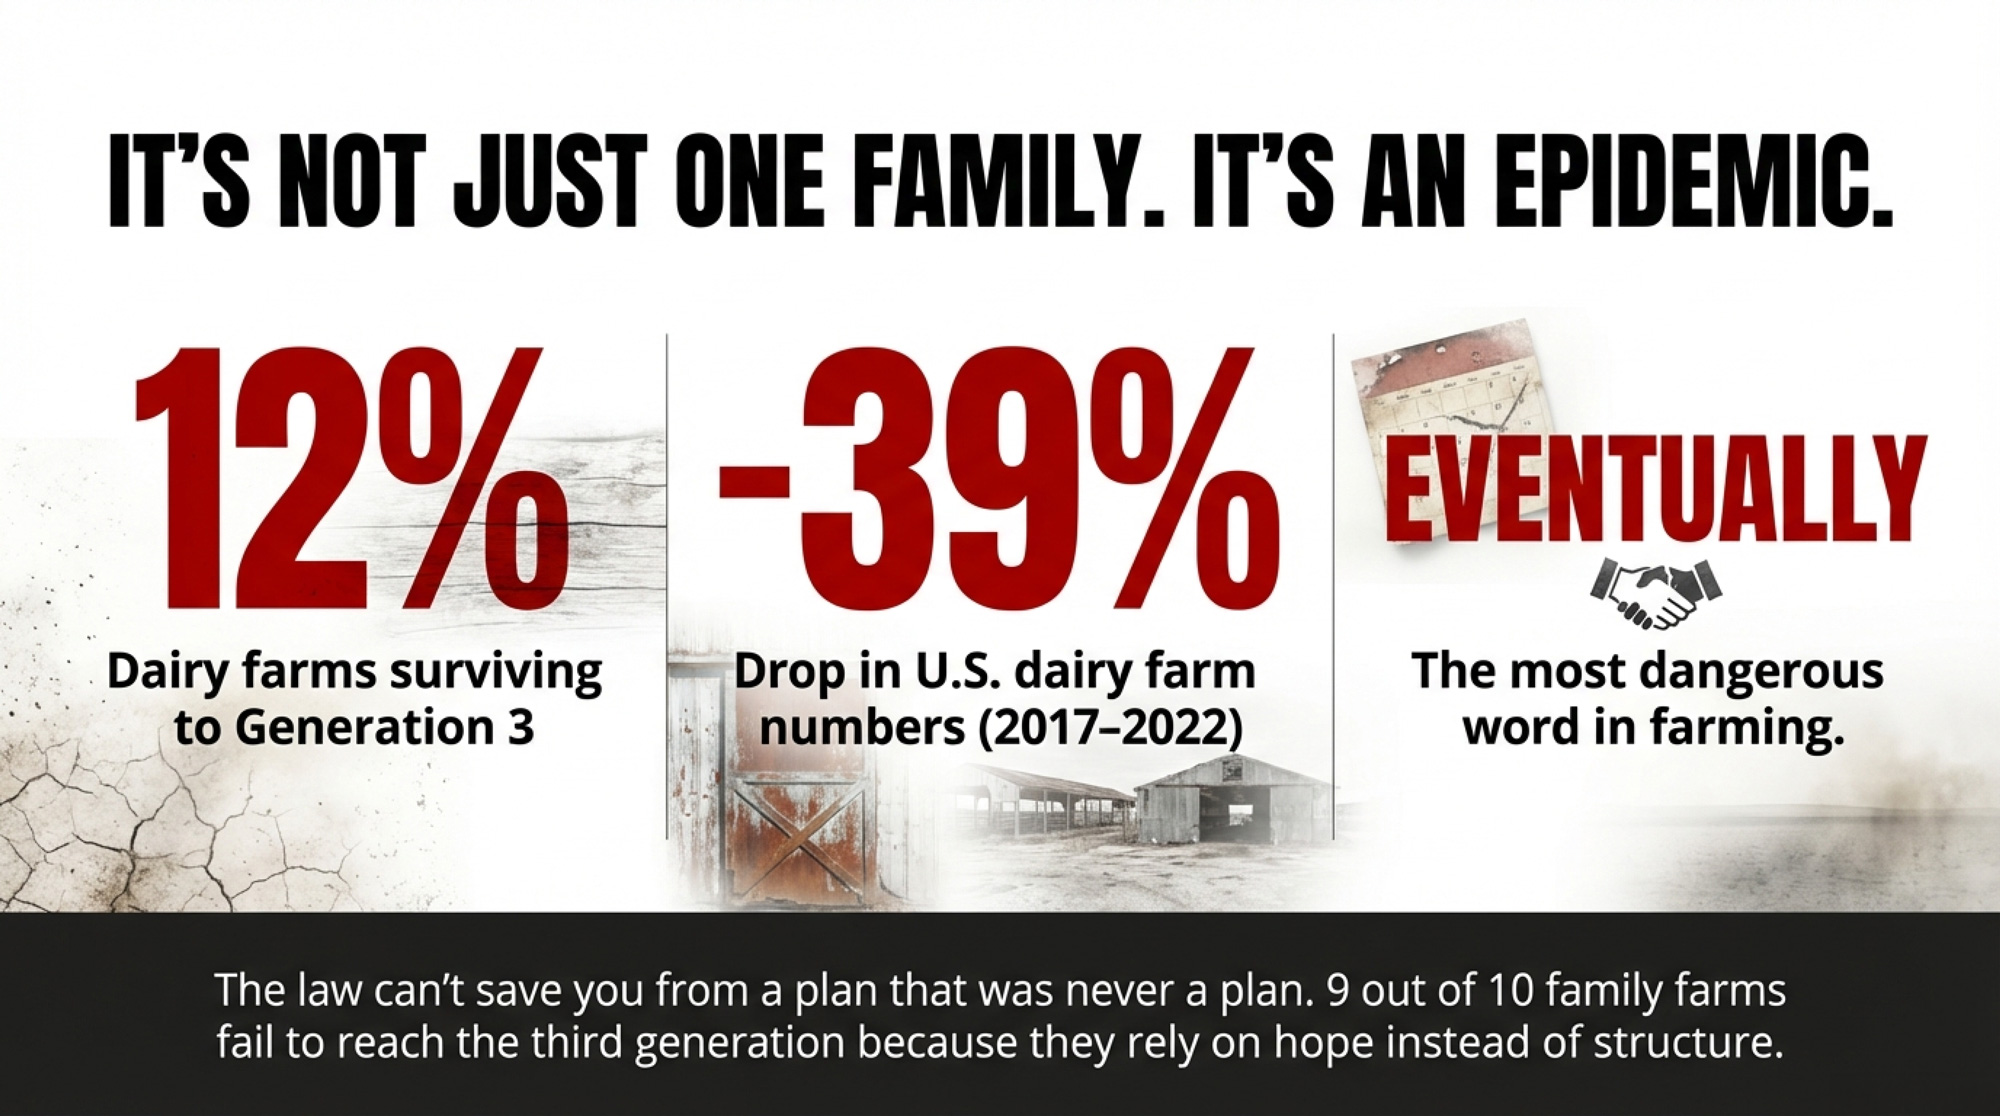
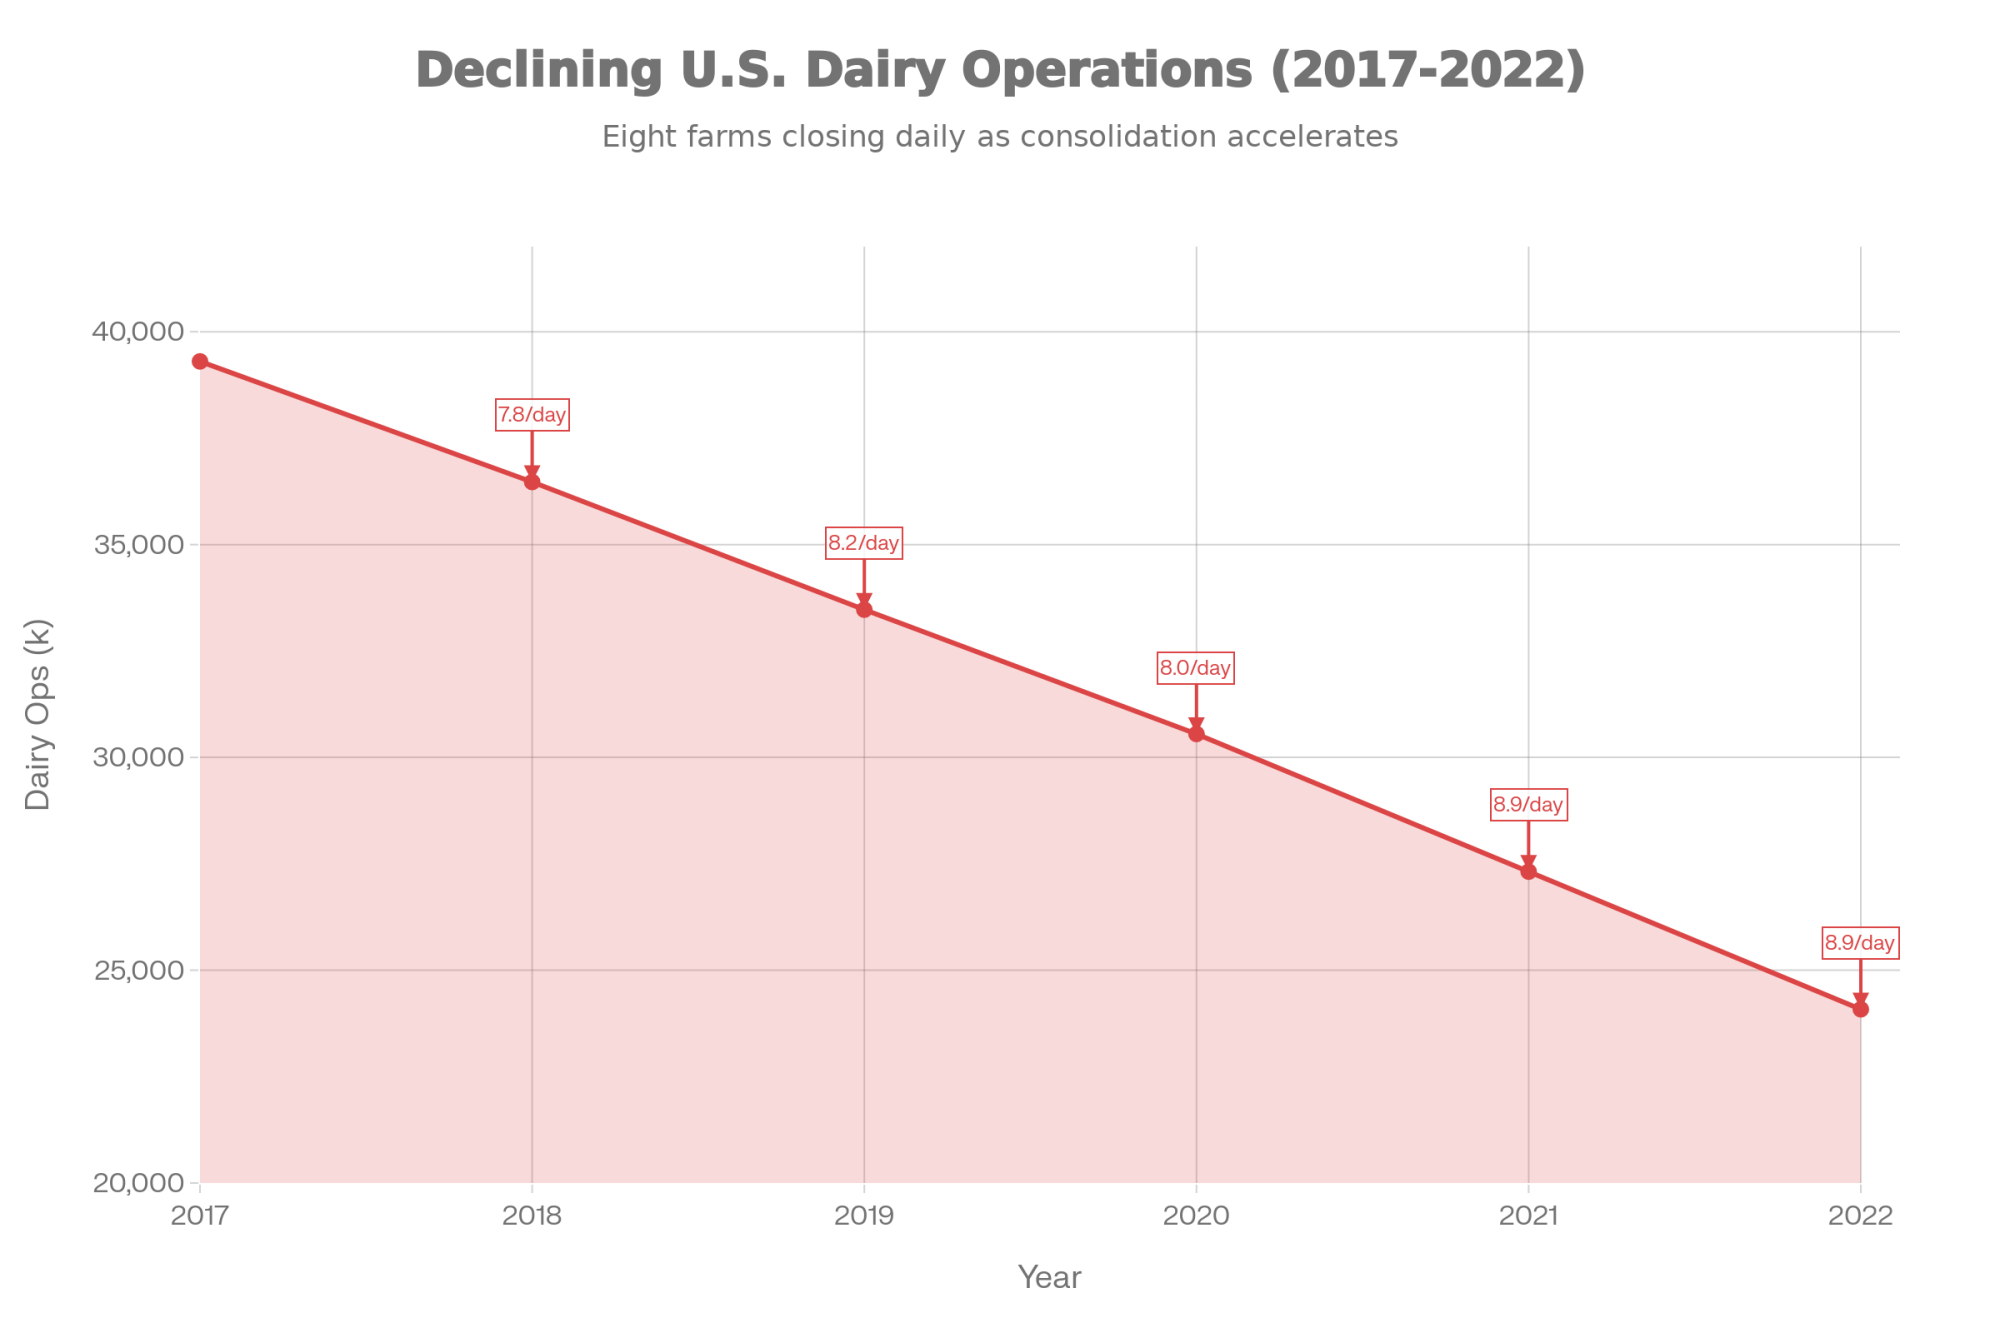
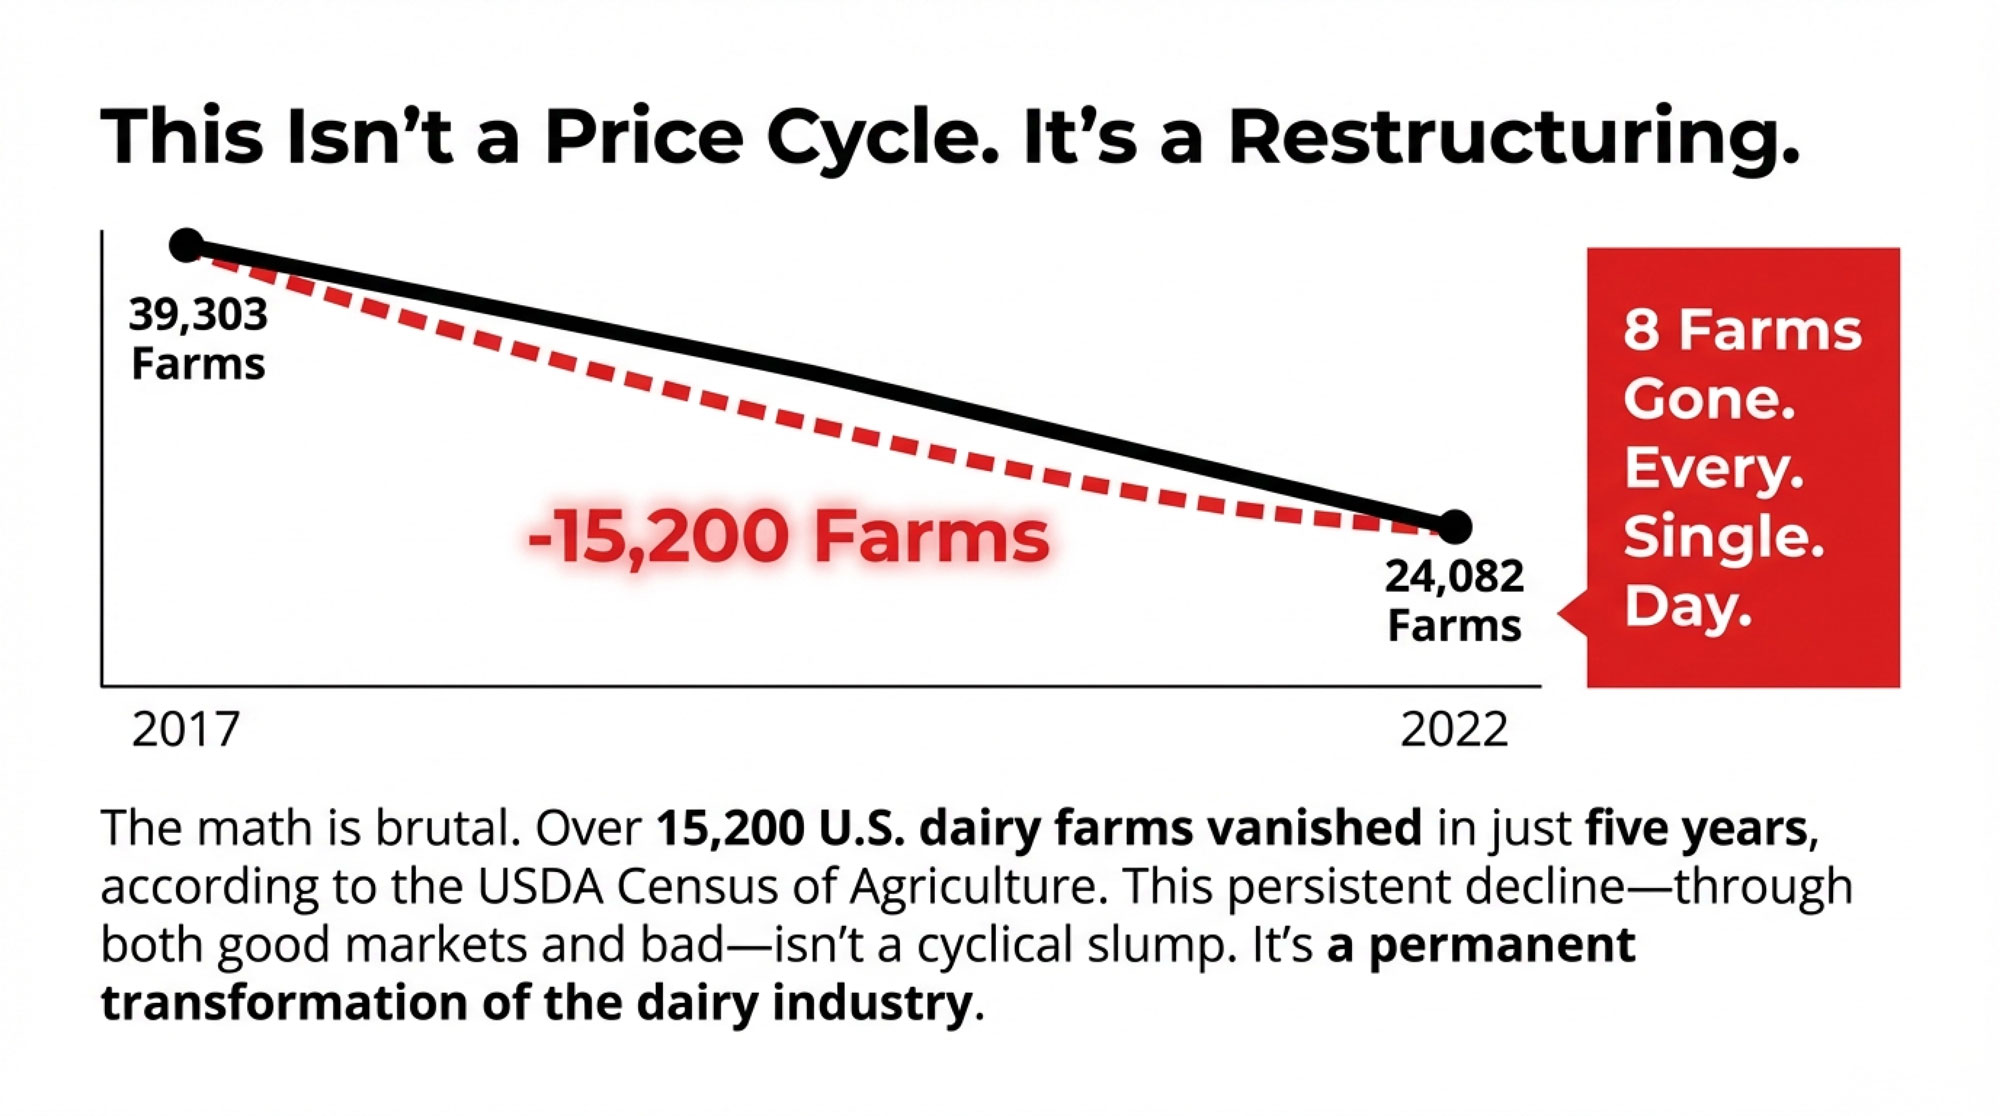
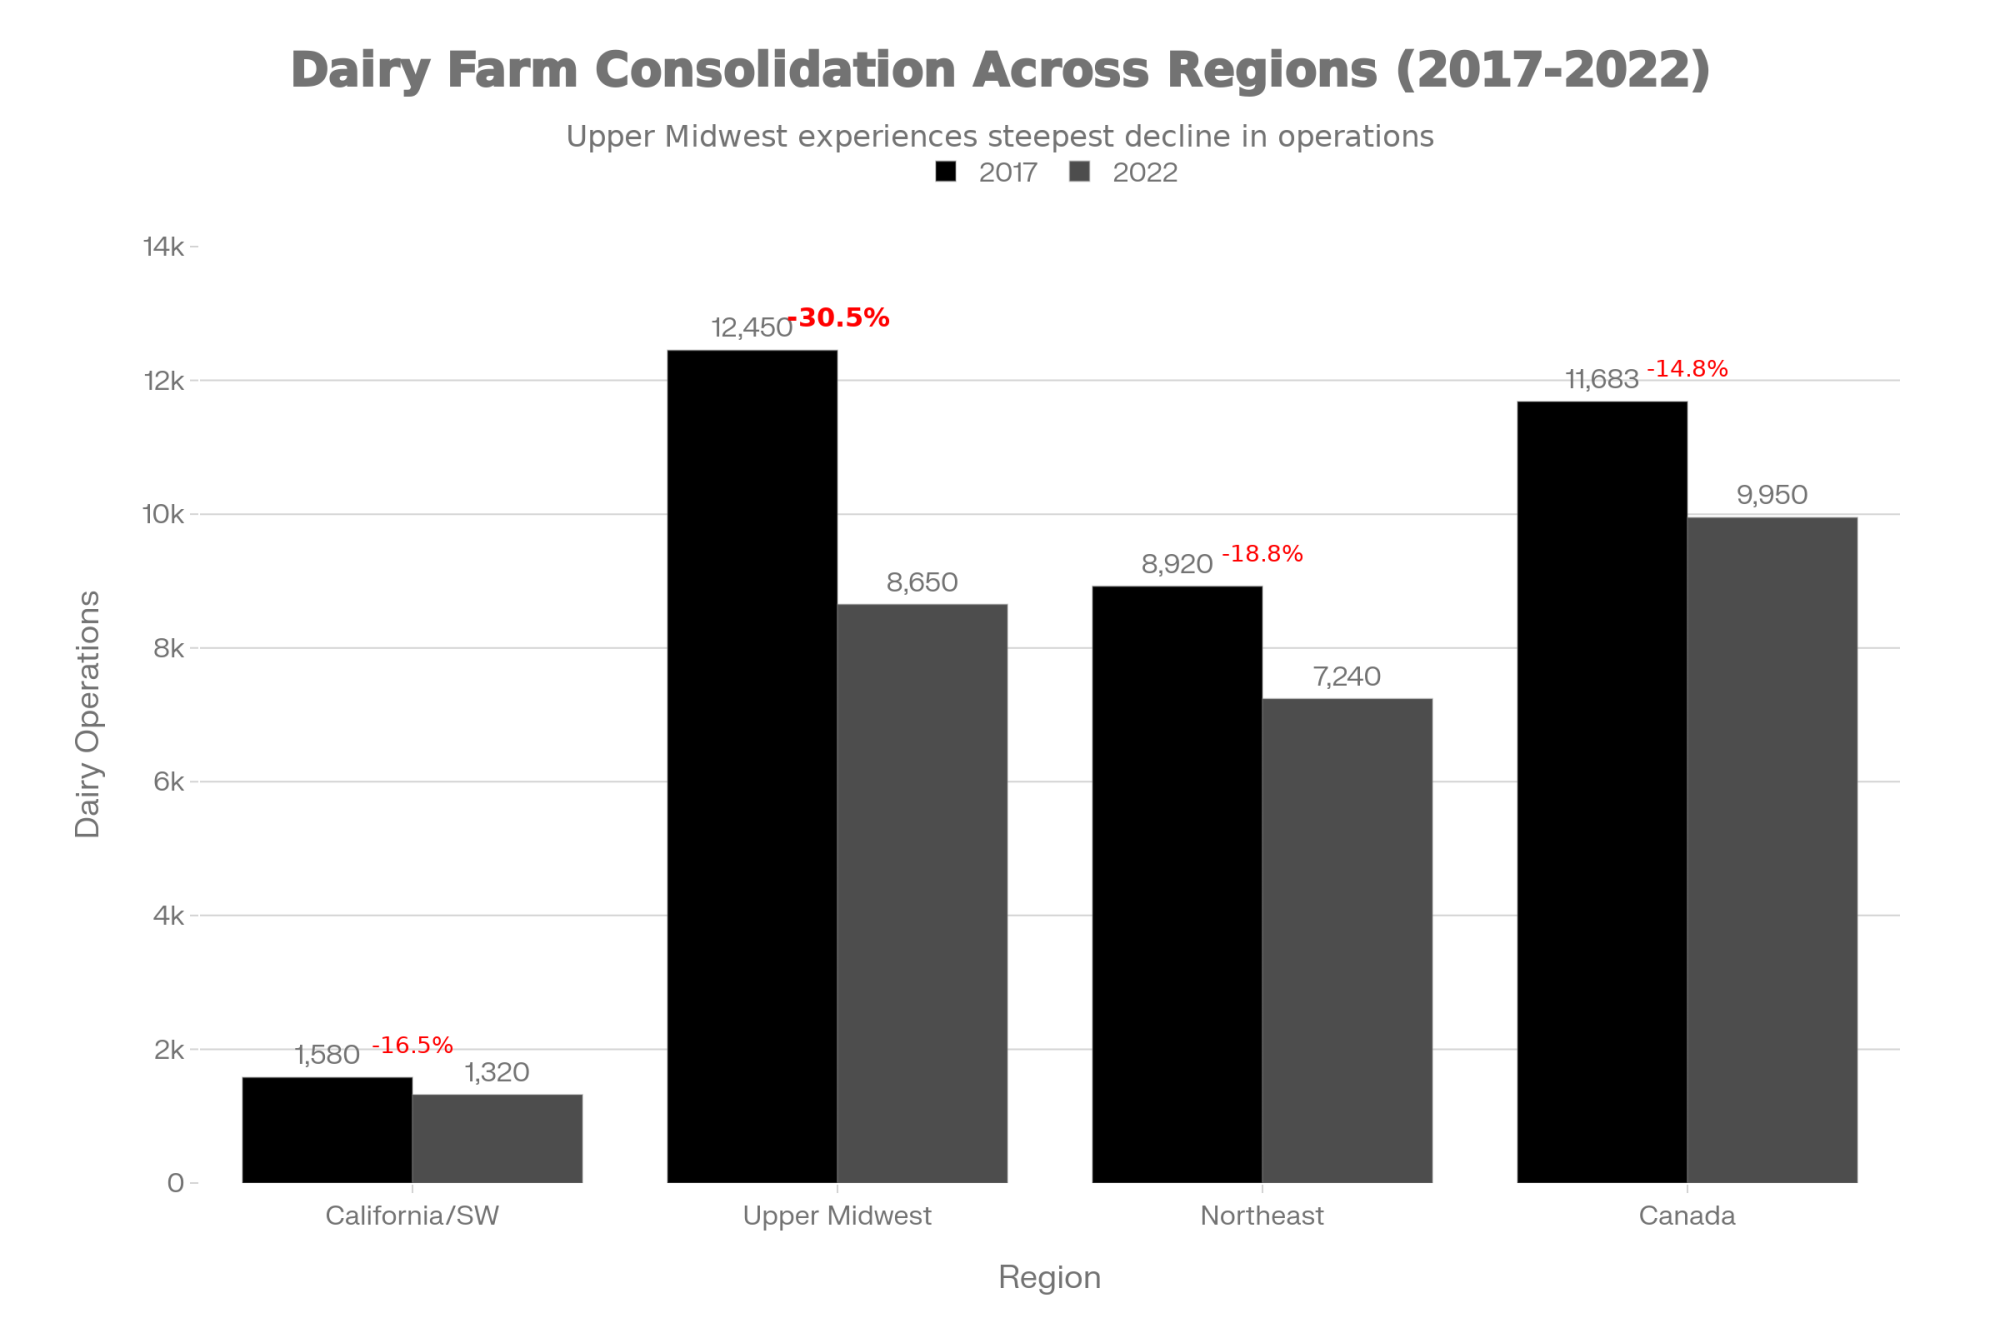
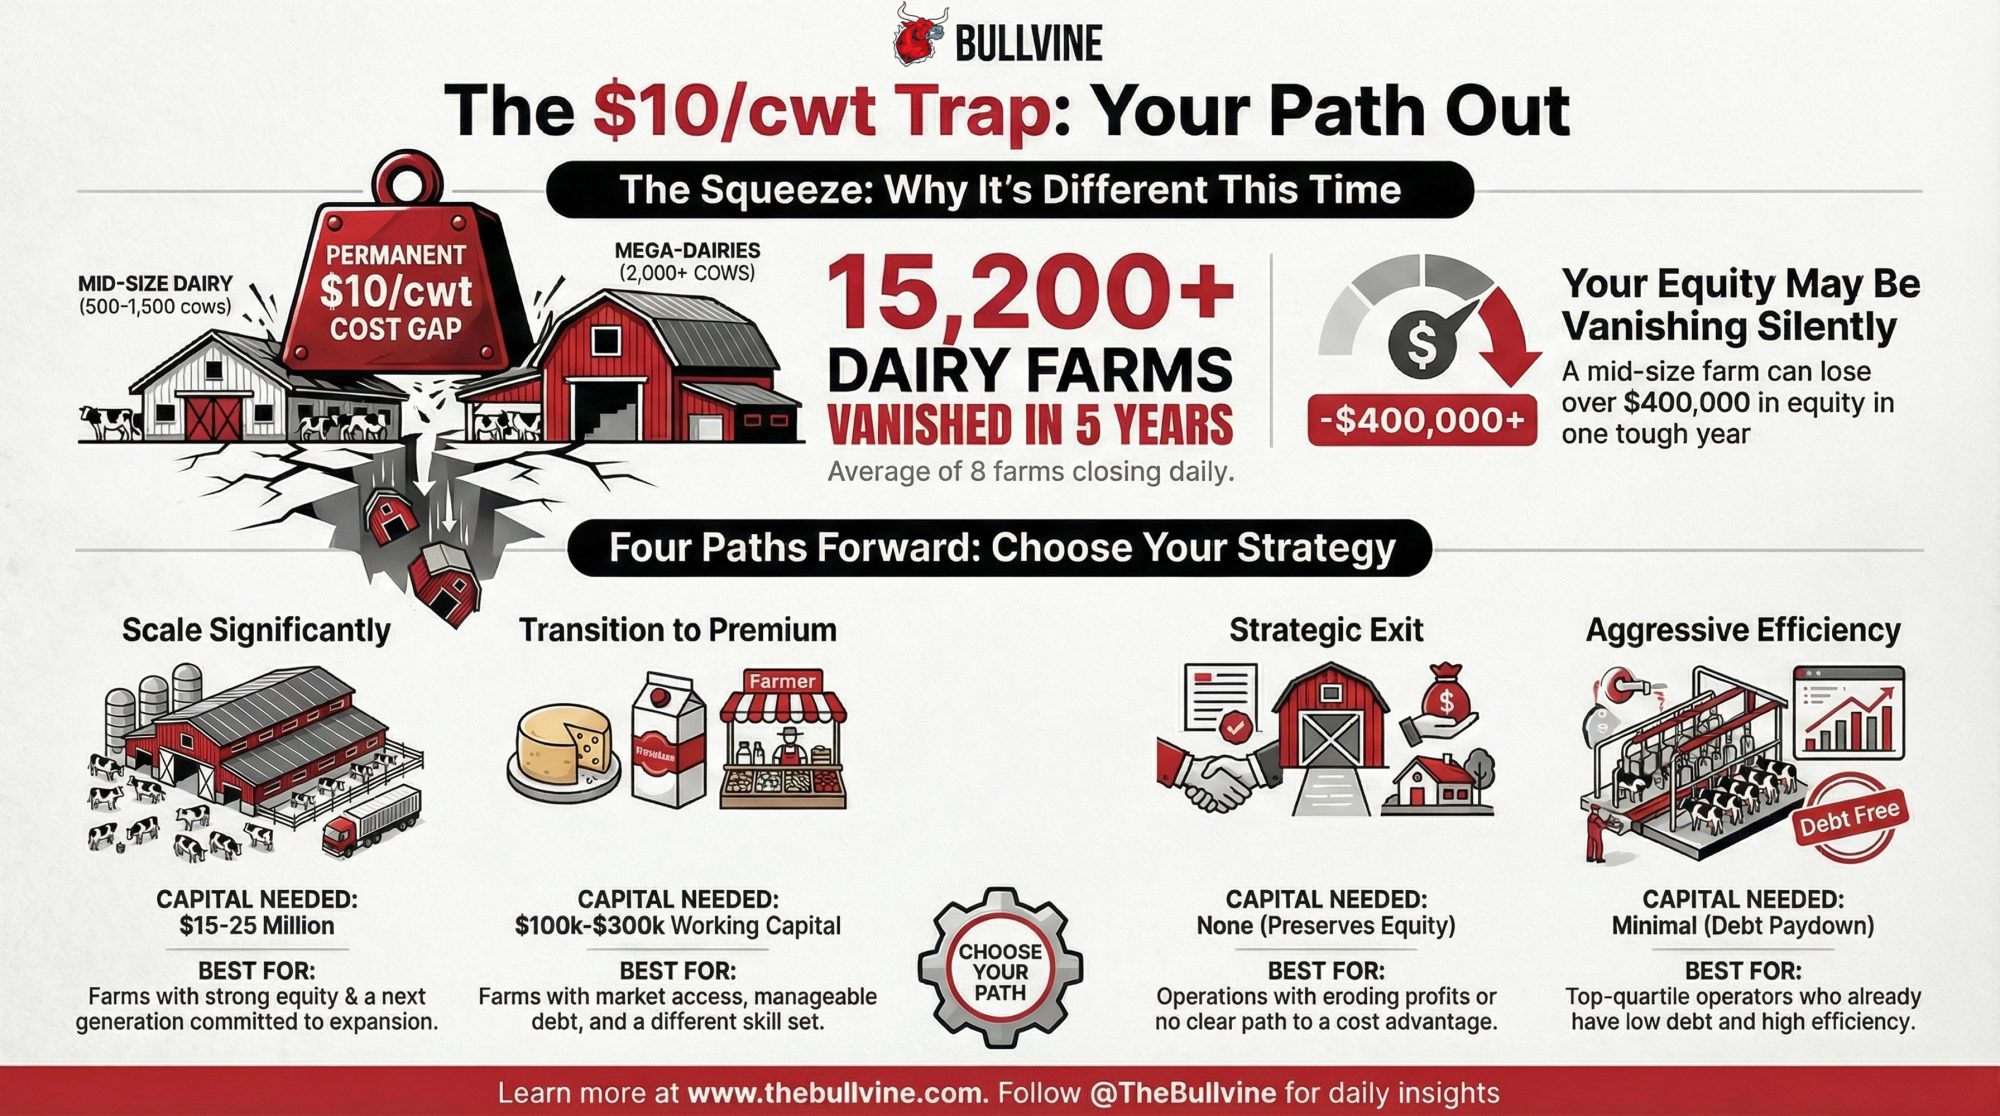
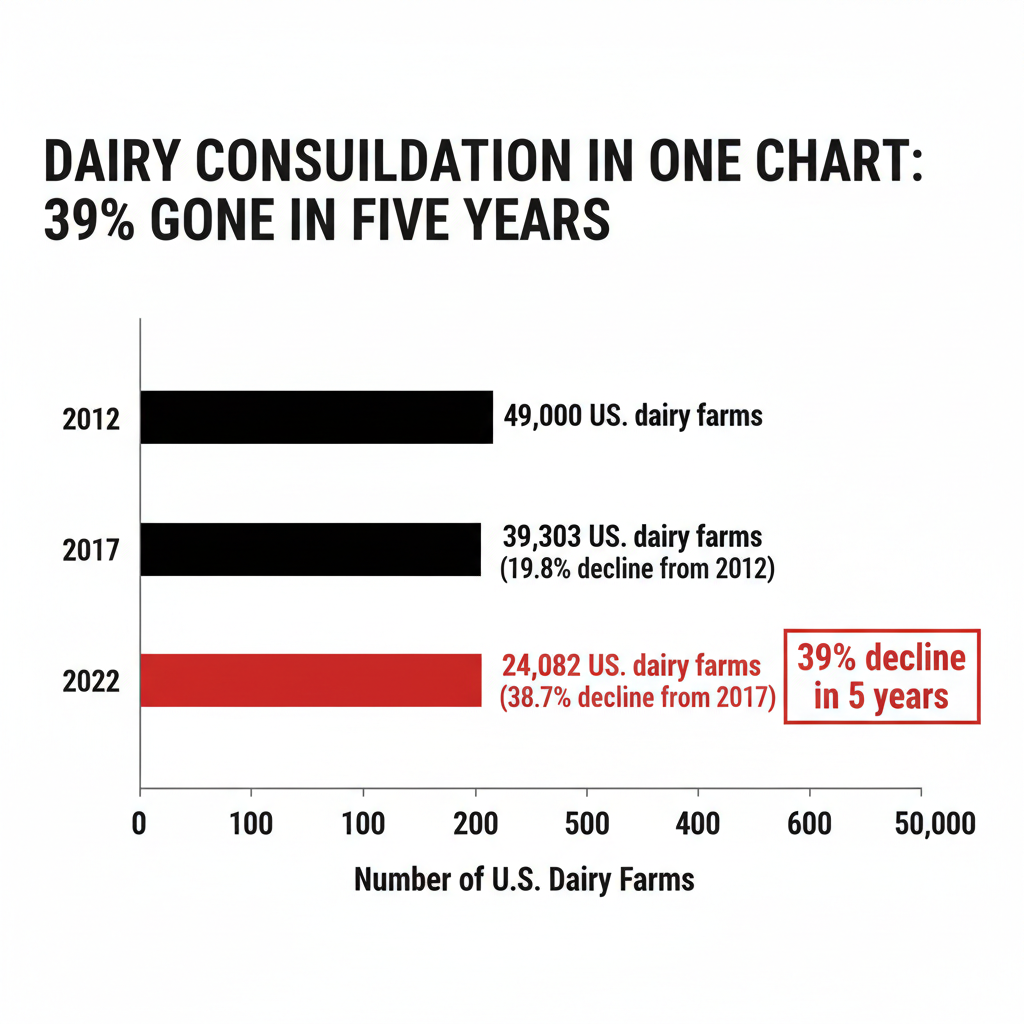
The consolidation data tells the same story from a different angle. The 2022 USDA Census of Agriculture shows U.S. dairy farms dropped from 39,303 operations in 2017 to 24,082 in 2022 — a 39% decline in five years, and 51% down from 2012. Canada tracks the same direction: the Canadian Dairy Information Centre reports 12,007 dairy farms in 2014, down to 9,256 by 2024 — a steady 2.6% annual decline. Wesley Tucker, MU Extension agriculture business specialist, puts the pipeline in even starker terms: 70% of farms are projected to trade hands in the next 20 years.
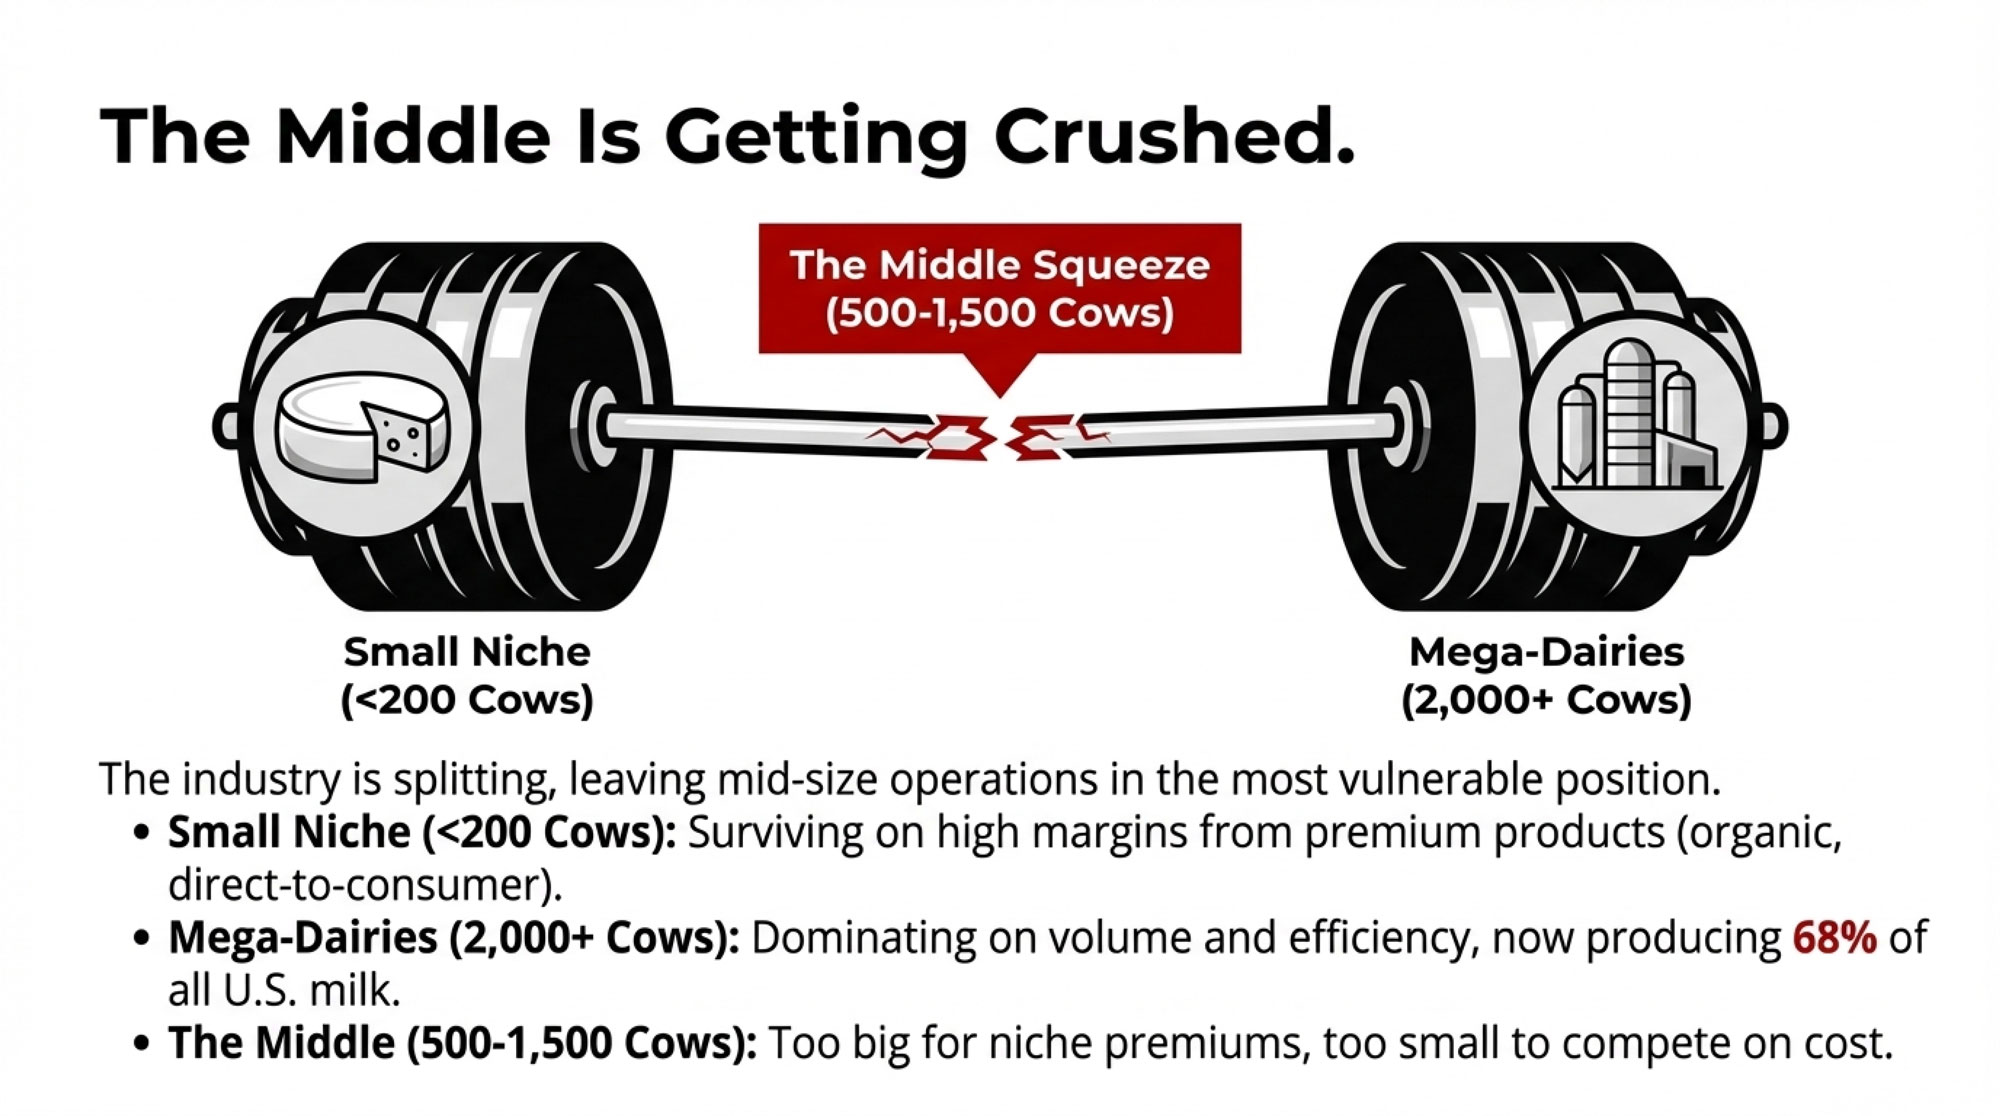
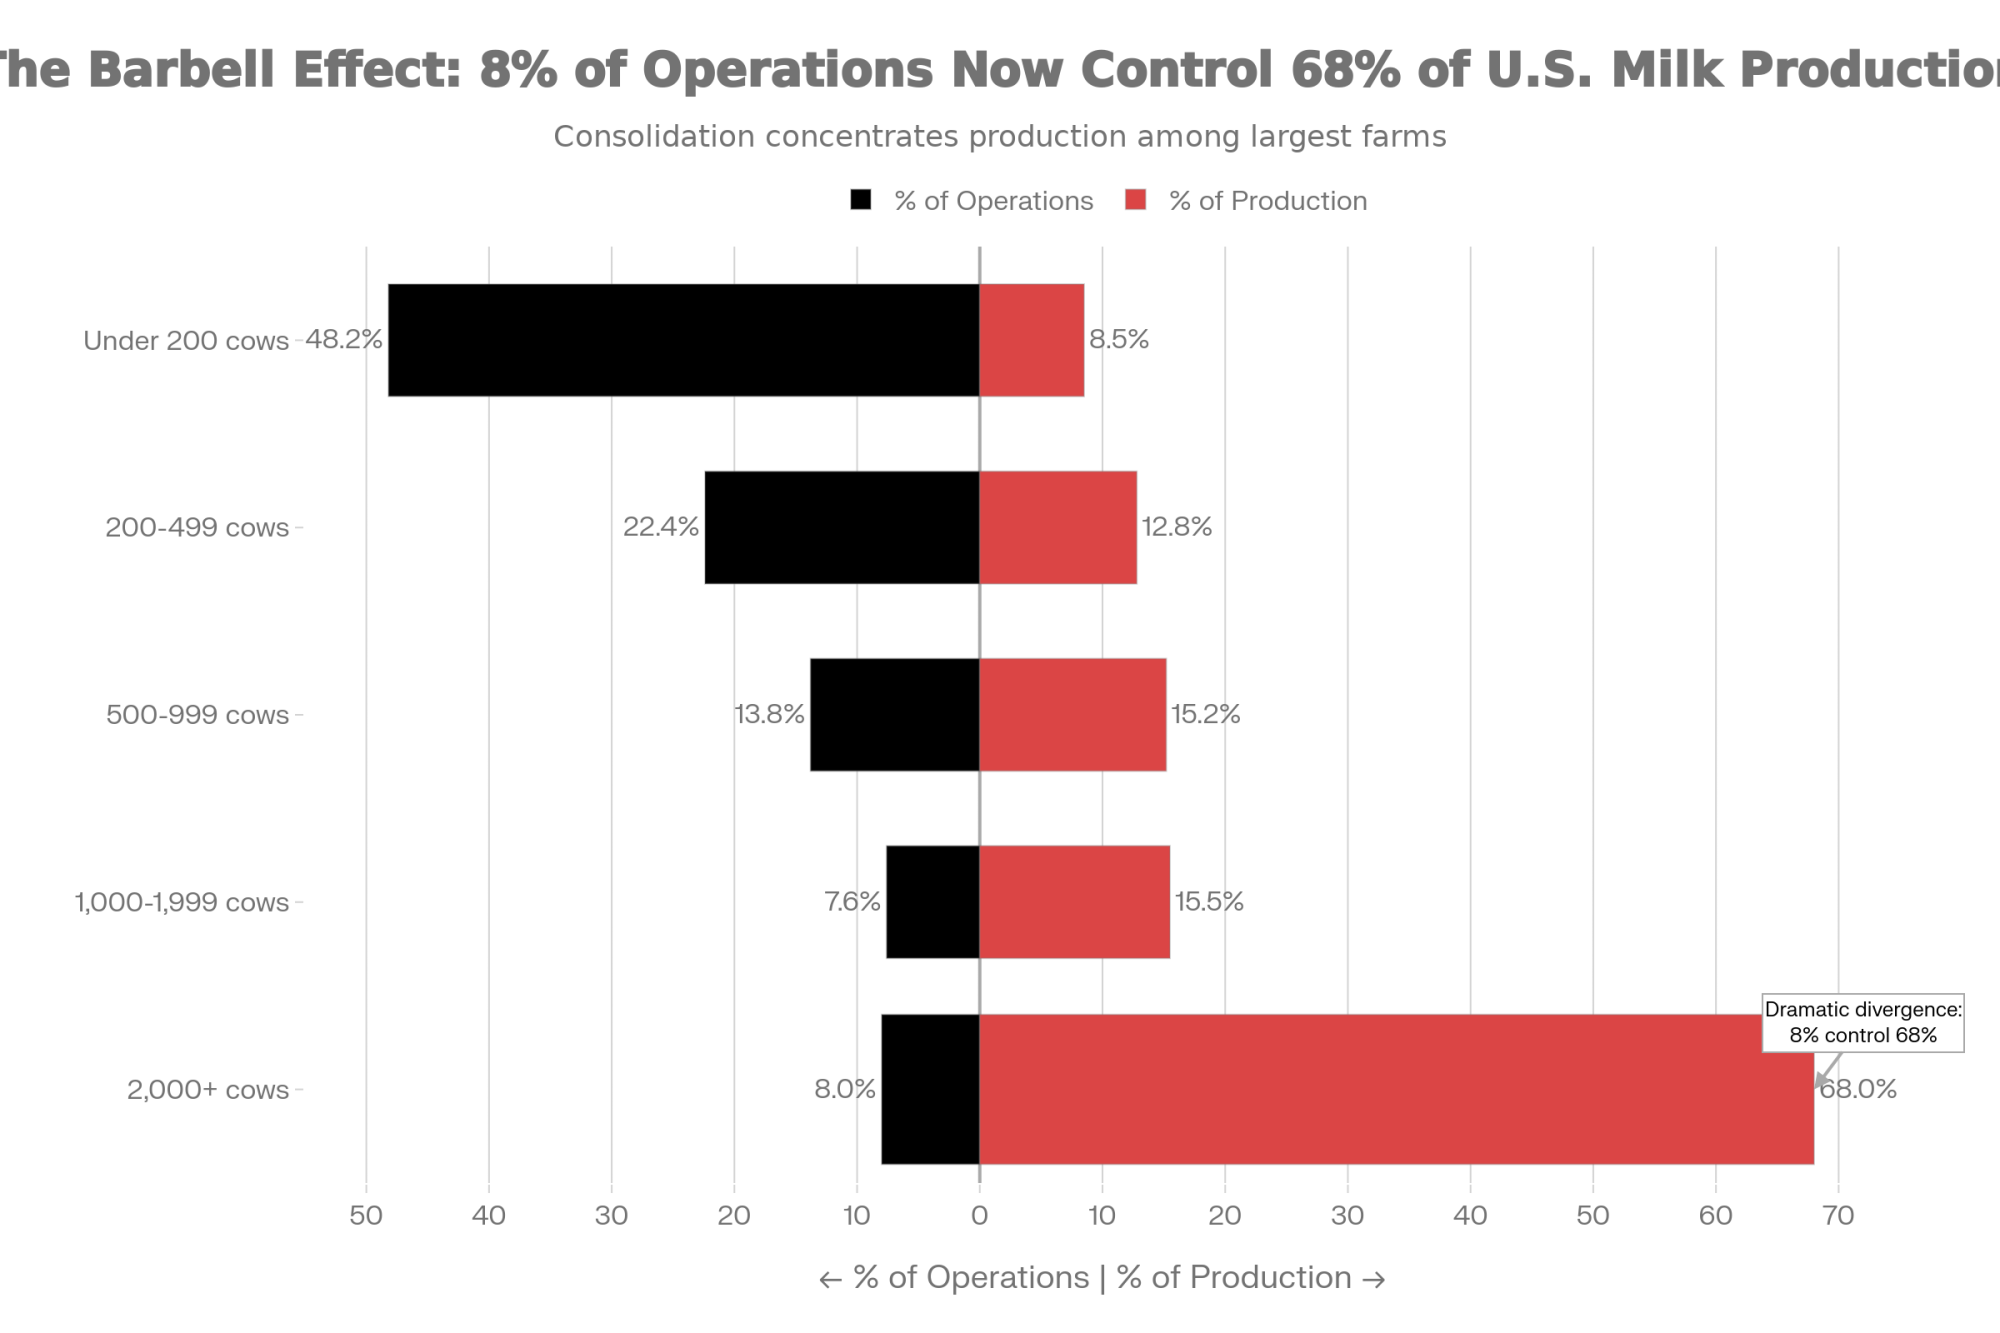
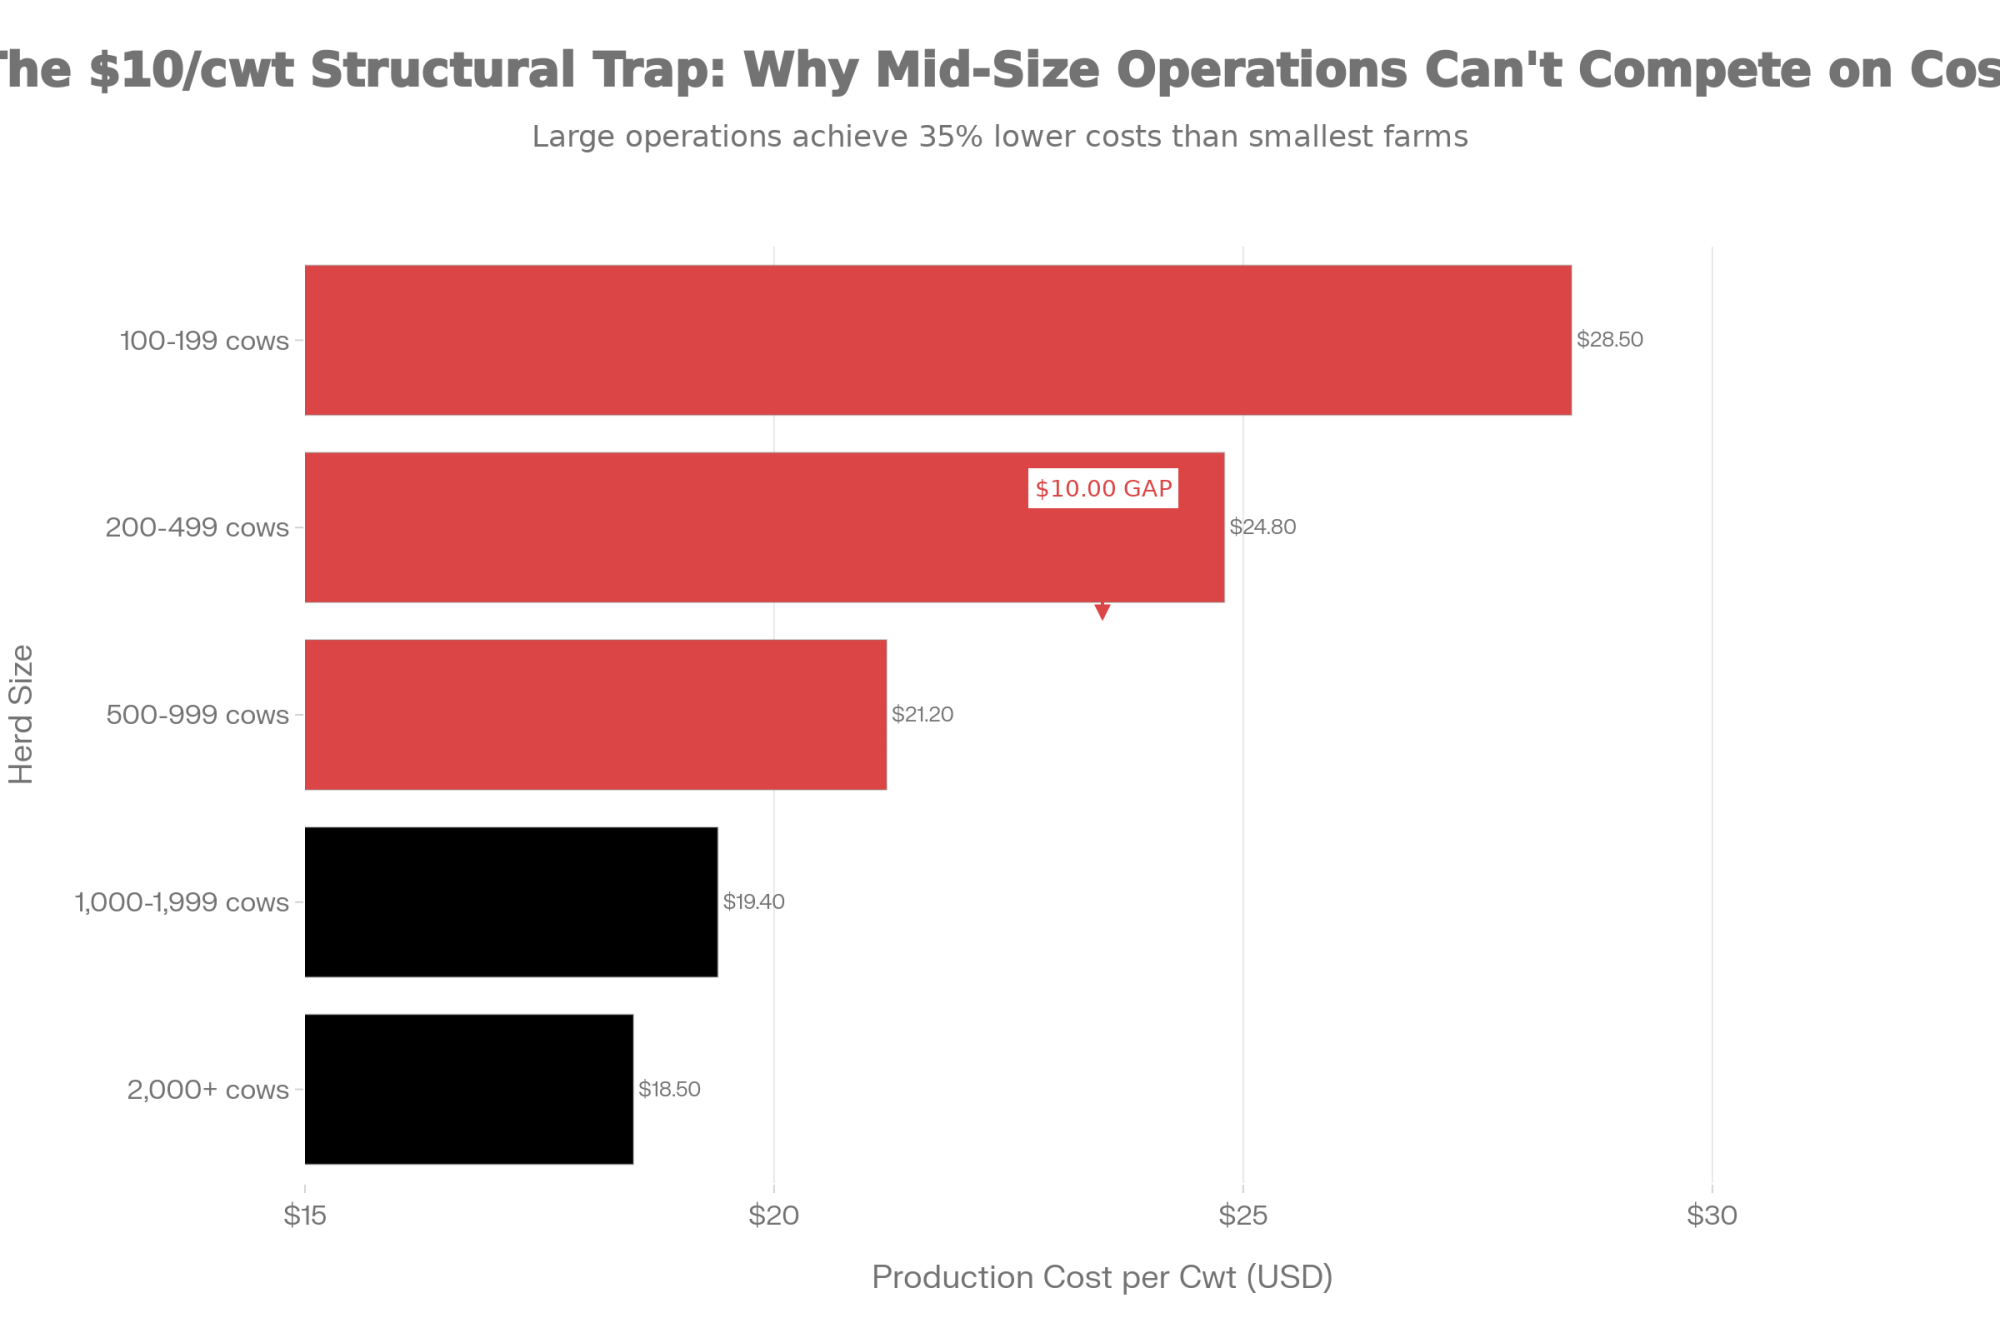
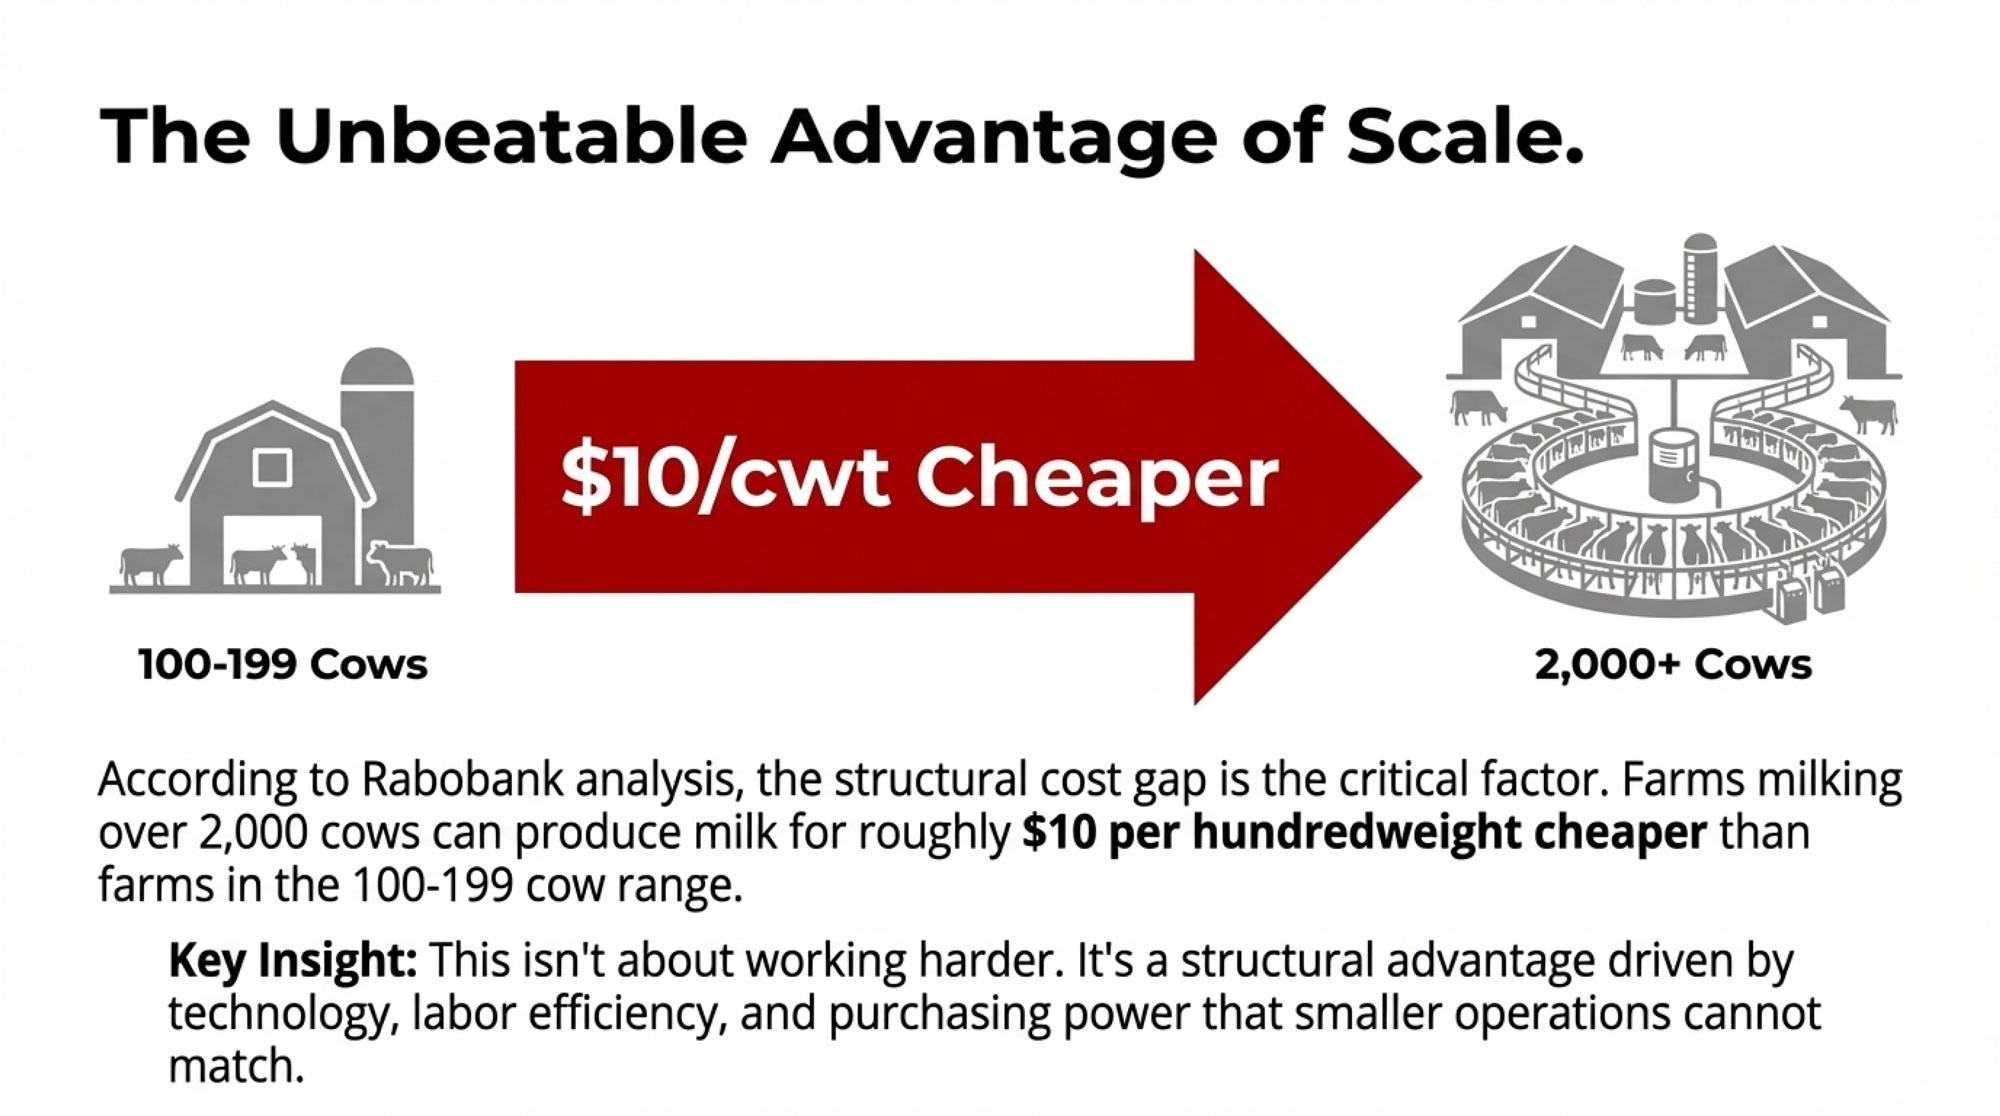
Farms with 1,000 or more cows — roughly 2,013 operations, about 8% of all U.S. dairies — now produce approximately two-thirds of the country’s milk, according to Rabobank analysis. The mid-size family dairy is getting squeezed from both ends: too big to walk away from, too asset-heavy to hand off without a structure in place.
This article draws on an Ontario court ruling, Canadian farmland data, U.S. census figures, and a Minnesota family operation. The legal frameworks differ at the border — Canadian supply management and quota add layers that the American system doesn’t have, and property law varies province to province and state to state. But the math and the human nature remain the same. Families that don’t formalize their plans lose the farm, whether it’s sitting on 500 acres outside Guelph or in Fillmore County, Minnesota.
Why the Math Keeps Getting Worse
The asset-value problem isn’t easing up. It’s accelerating.
U.S. farm real estate averaged $4,350 per acre in 2025, up 4.3% year-over-year and more than double the $2,150 average in 2010, according to the USDA’s August 2025 Land Values Summary. Cropland specifically hit $5,830 per acre — up 4.7% from the prior year, compared to $2,980 in 2011. In major dairy states, the numbers climb higher: Michigan farmland jumped 7.8%, and Iowa cropland averaged $10,300 per acre.
North of the border, Farm Credit Canada’s mid-year 2025 review showed Canadian cultivated farmland values rose 6.0% in the first half of 2025 alone, a slight acceleration from the 5.5% growth in the same period of 2024. Over the 12 months from July 2024 to June 2025, Canadian farmland appreciated 10.4%. Manitoba led the nation at 11.2%, while Ontario farmland values held flat.
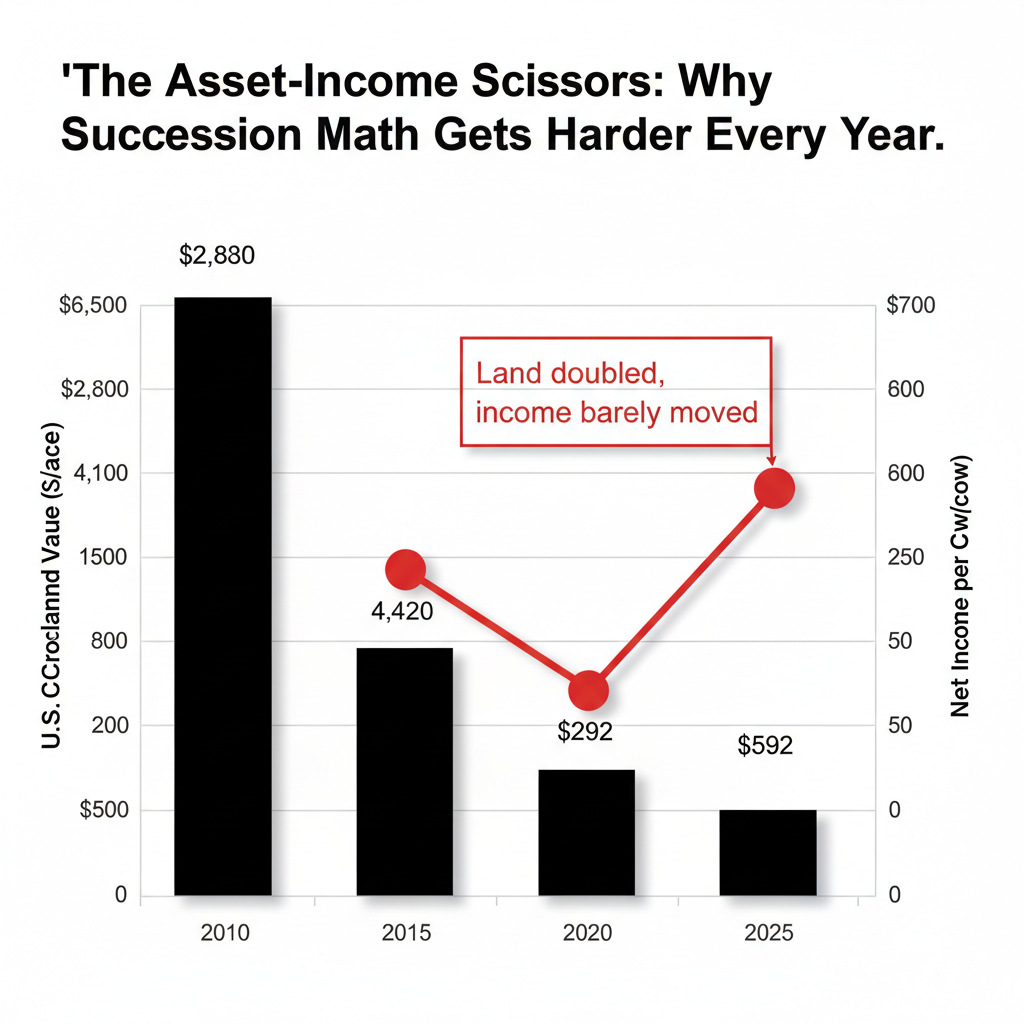
Now stack those asset values against what milk actually pays. Zisk projections for 2025 ranged from $531 to $1,640 per cow, depending on region and herd size. A 2024 Northeast Dairy Farm Summary pegged average net earnings at $592 per cow, up from $292 the year prior. Better than 2023, sure. But $592 per cow against land that doubled in 15 years — that’s the succession math in one sentence.
What 150 Years of Continuity Looks Like
In Fillmore County, Minnesota, the Heusinkveld dairy tells a different kind of story.
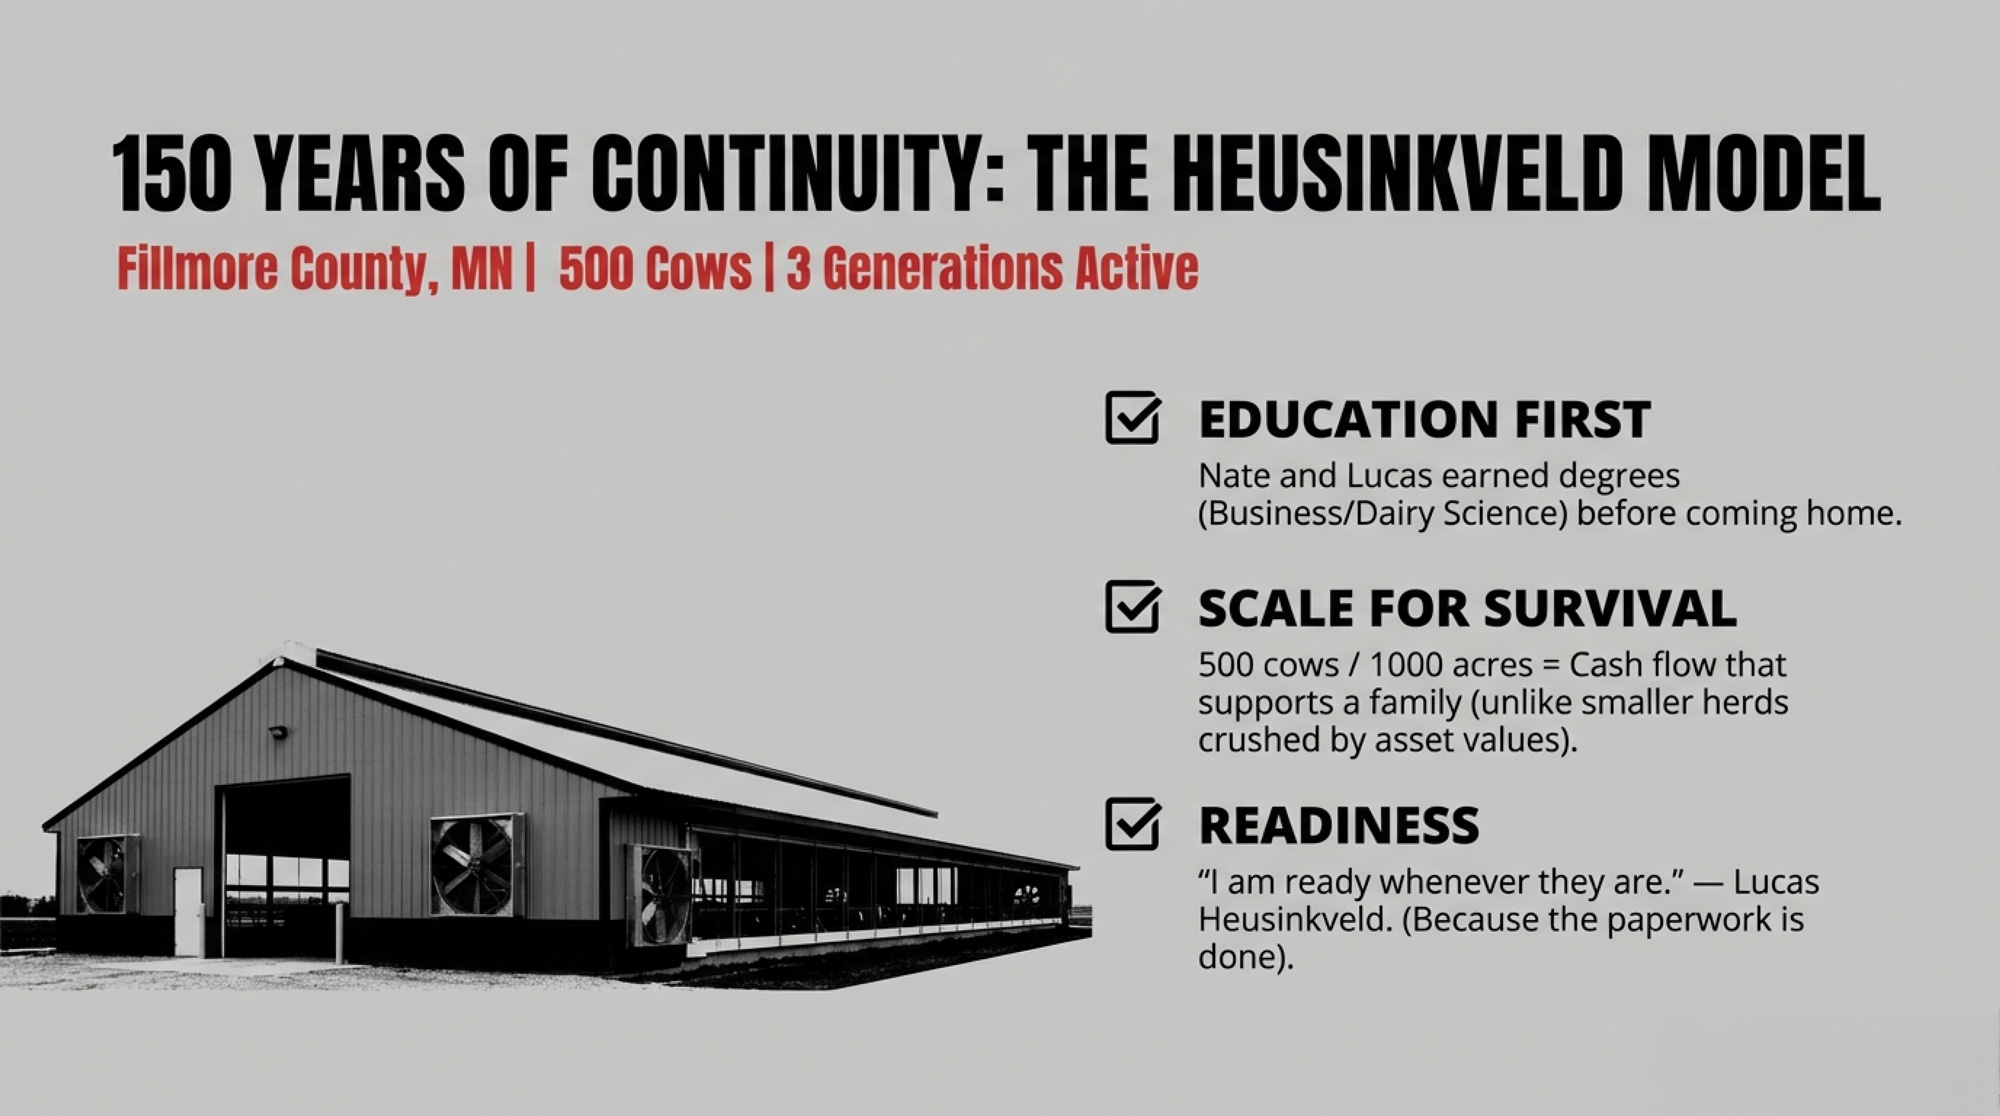
The operation has run continuously for about 150 years — a milestone the Fillmore County Journal covered in April 2024. Jeff and Steve Heusinkveld took their turn running the farm in 1970. Jeff’s son, Nate — an agri-business management degree from Mankato State — came back to take over. He married Misty in 2000 and moved onto the farm.
Today, Nate runs the operation. Jeff has since passed away, but Nate’s mother, Darla, still lives on the farm and handles the calf chores. The dairy has grown to 500 cows — 450 milked three times daily through a double-12 parallel parlor — plus 85 beef cows. They crop 350 acres of hay and 550 acres of corn, and seven full-time employees round out the crew.
The next generation is already in the barn. Nate’s son Lucas earned a dairy science degree from NICC Calmar, Iowa, and works alongside his dad every day. “I am ready whenever they are,” Lucas told the Fillmore County Journal — talking about the day Nate and Misty decide it’s his turn.
What jumps out about this family: education before entry. Nate got his business degree, and Lucas got his dairy science degree, both before coming home. And 500 cows on nearly a thousand crop acres generates the kind of cash flow that can actually support a transition — unlike operations where asset values dwarf annual income by a factor of 10 or more.
The Inheritance Math That Breaks Most Transitions
Farm Credit Canada’s transition resources put it bluntly: “unspoken expectations are the silent killers of transition plans.” Their guidance notes that agriculture has a deeply ingrained pattern of assumed succession — “Either the parent assumes a particular child will farm, or a child thinks they’ll get the farm — but they’ve never had a conversation about it”.
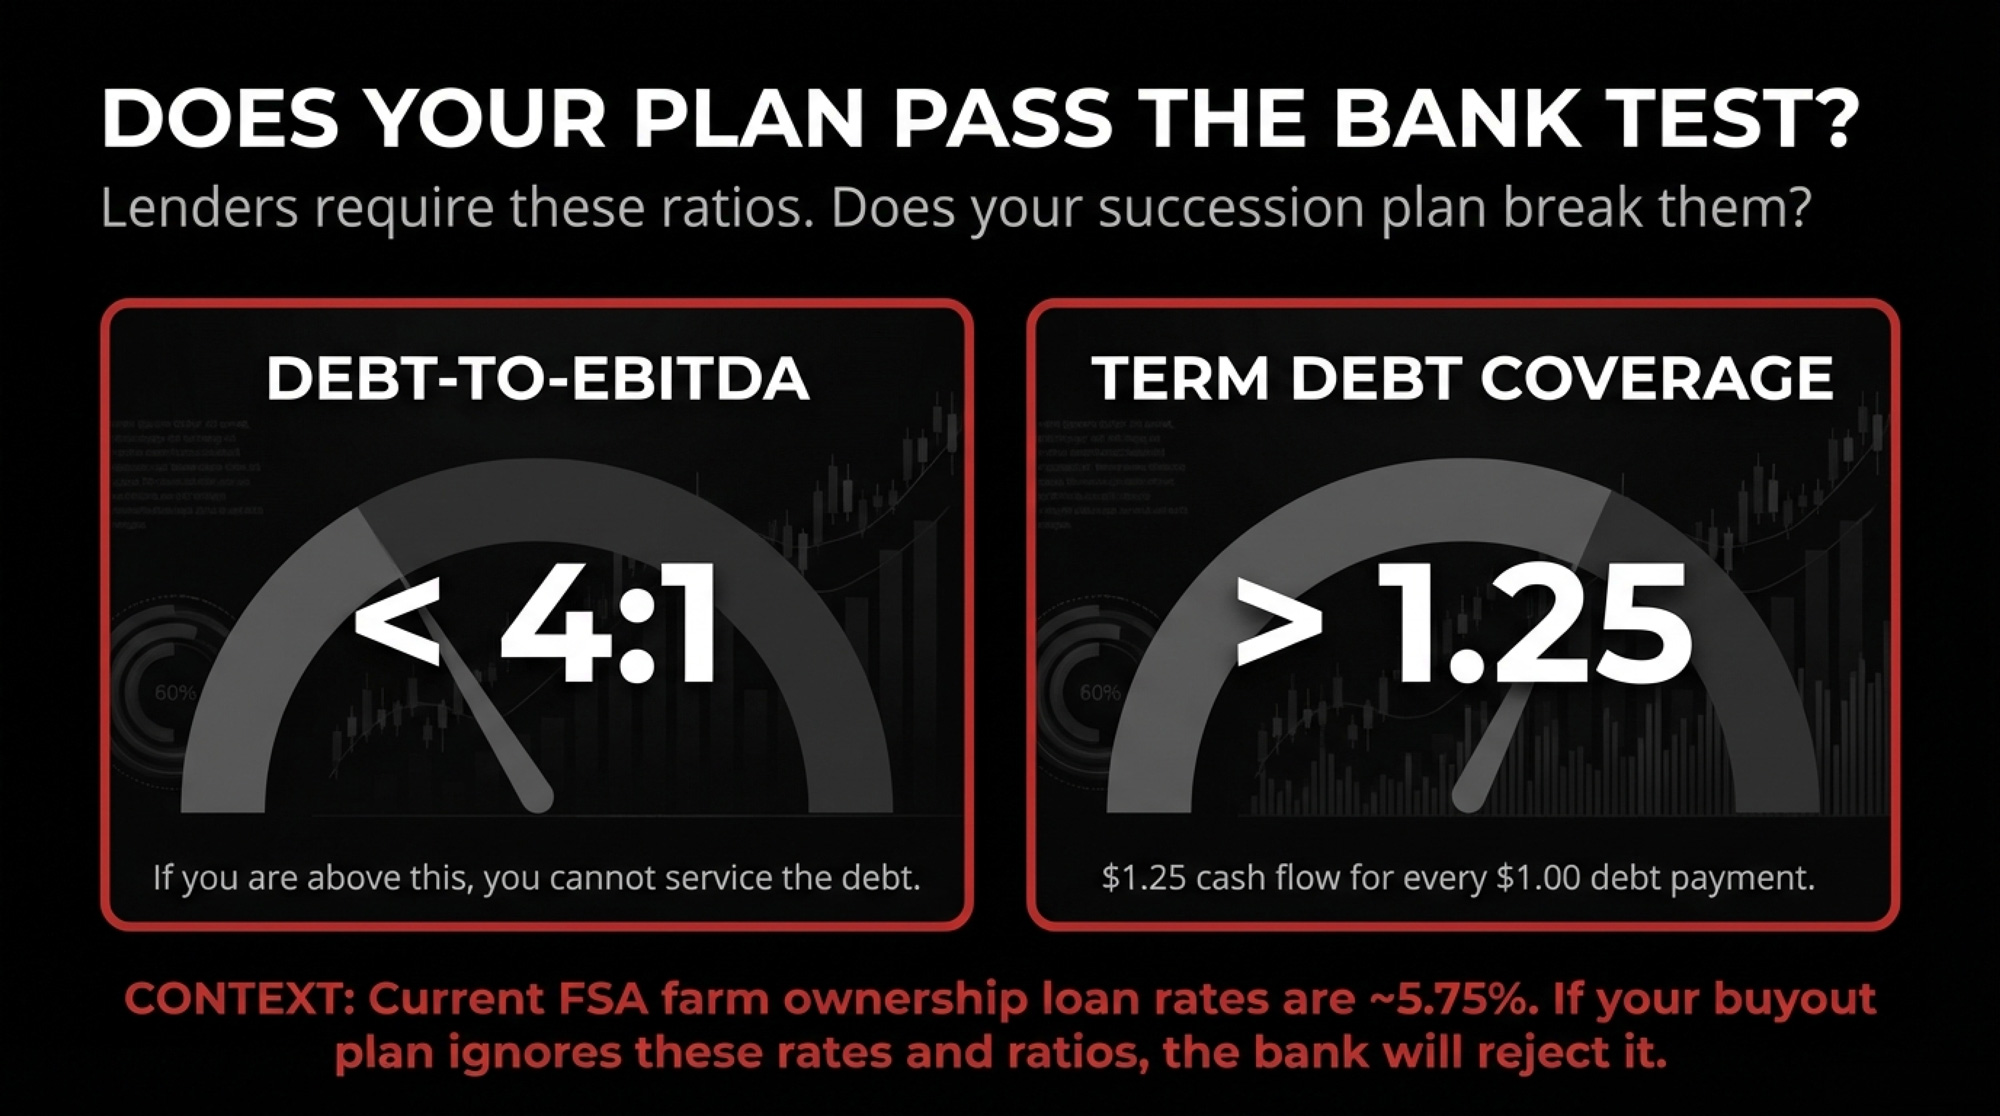
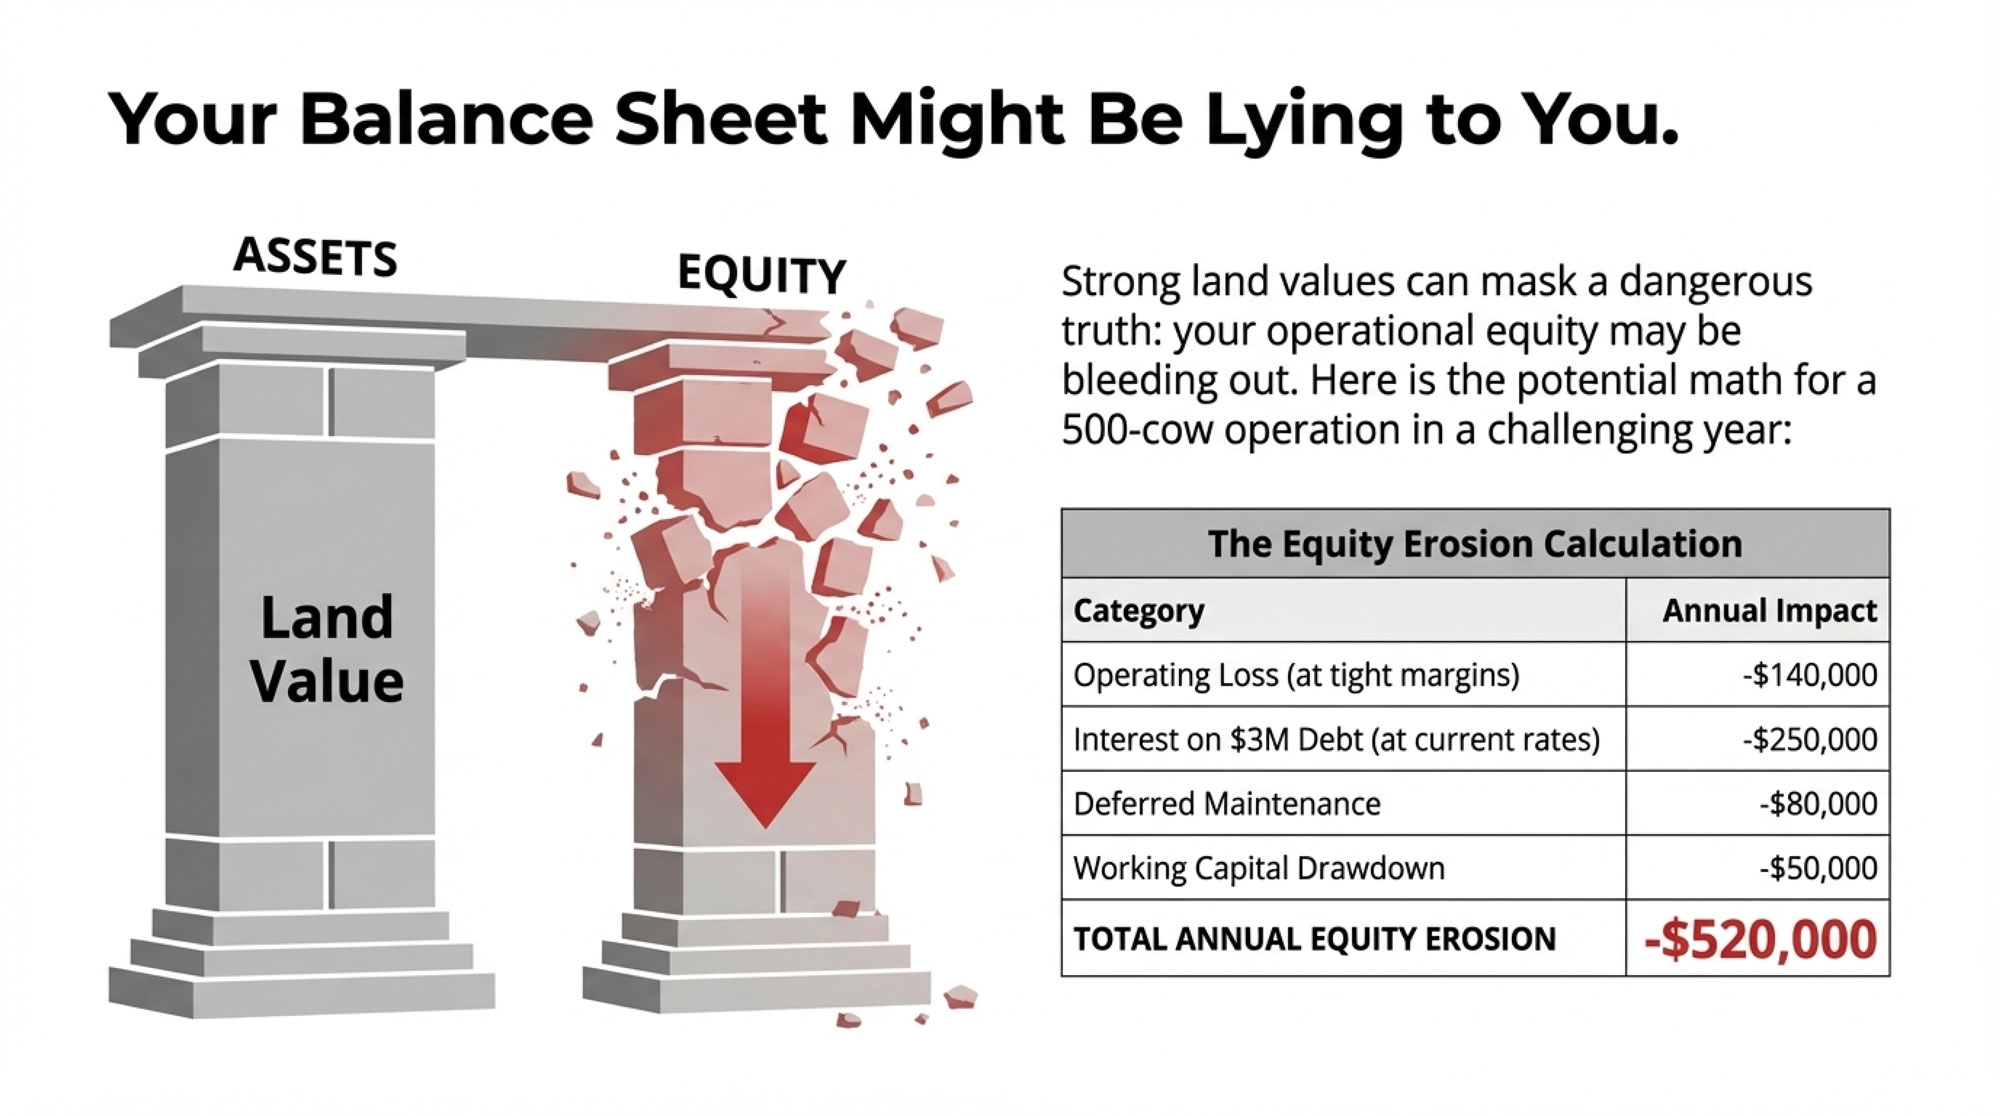
When parents want to treat all kids “equally,” the farming heir has to buy out siblings at asset-value prices, somehow using cash-flow-level income. At $5,830 per acre for U.S. cropland, a 500-acre operation’s land alone is worth $2.9 million before you count cattle, equipment, or buildings. Now run the debt math. Analysts recommend staying below a 4-to-1 debt-to-EBITDA ratio to cash flow expenses and meet scheduled debt payments. Penn State Extension notes that many lenders require a term debt coverage ratio of at least 1.25 — meaning the farm generates $1.25 in cash flow for every $1.00 in scheduled intermediate- and long-term debt payments — just to consider a plan viable. They flag 1.75 or better as the green zone.
So ask yourself: if your successor takes on $2.9 million in land debt alone at current FSA rates of 5.750% for farm ownership loans, can that 500-cow herd, generating $592 per cow in net earnings, cover the payments and still operate? One tough milk year tips the balance. Two tough years and you’re looking at a forced sale.
As agricultural attorney Trent Hilding told the Michigan State Dairy Extension podcast: “In a lot of cases, for the farms to be viable and successful, they do have to transfer in a fashion that’s not equal.” But he added, “it still could be considered equitable and fair.”
Equal vs. Equitable: Why the Distinction Decides Your Farm’s Future
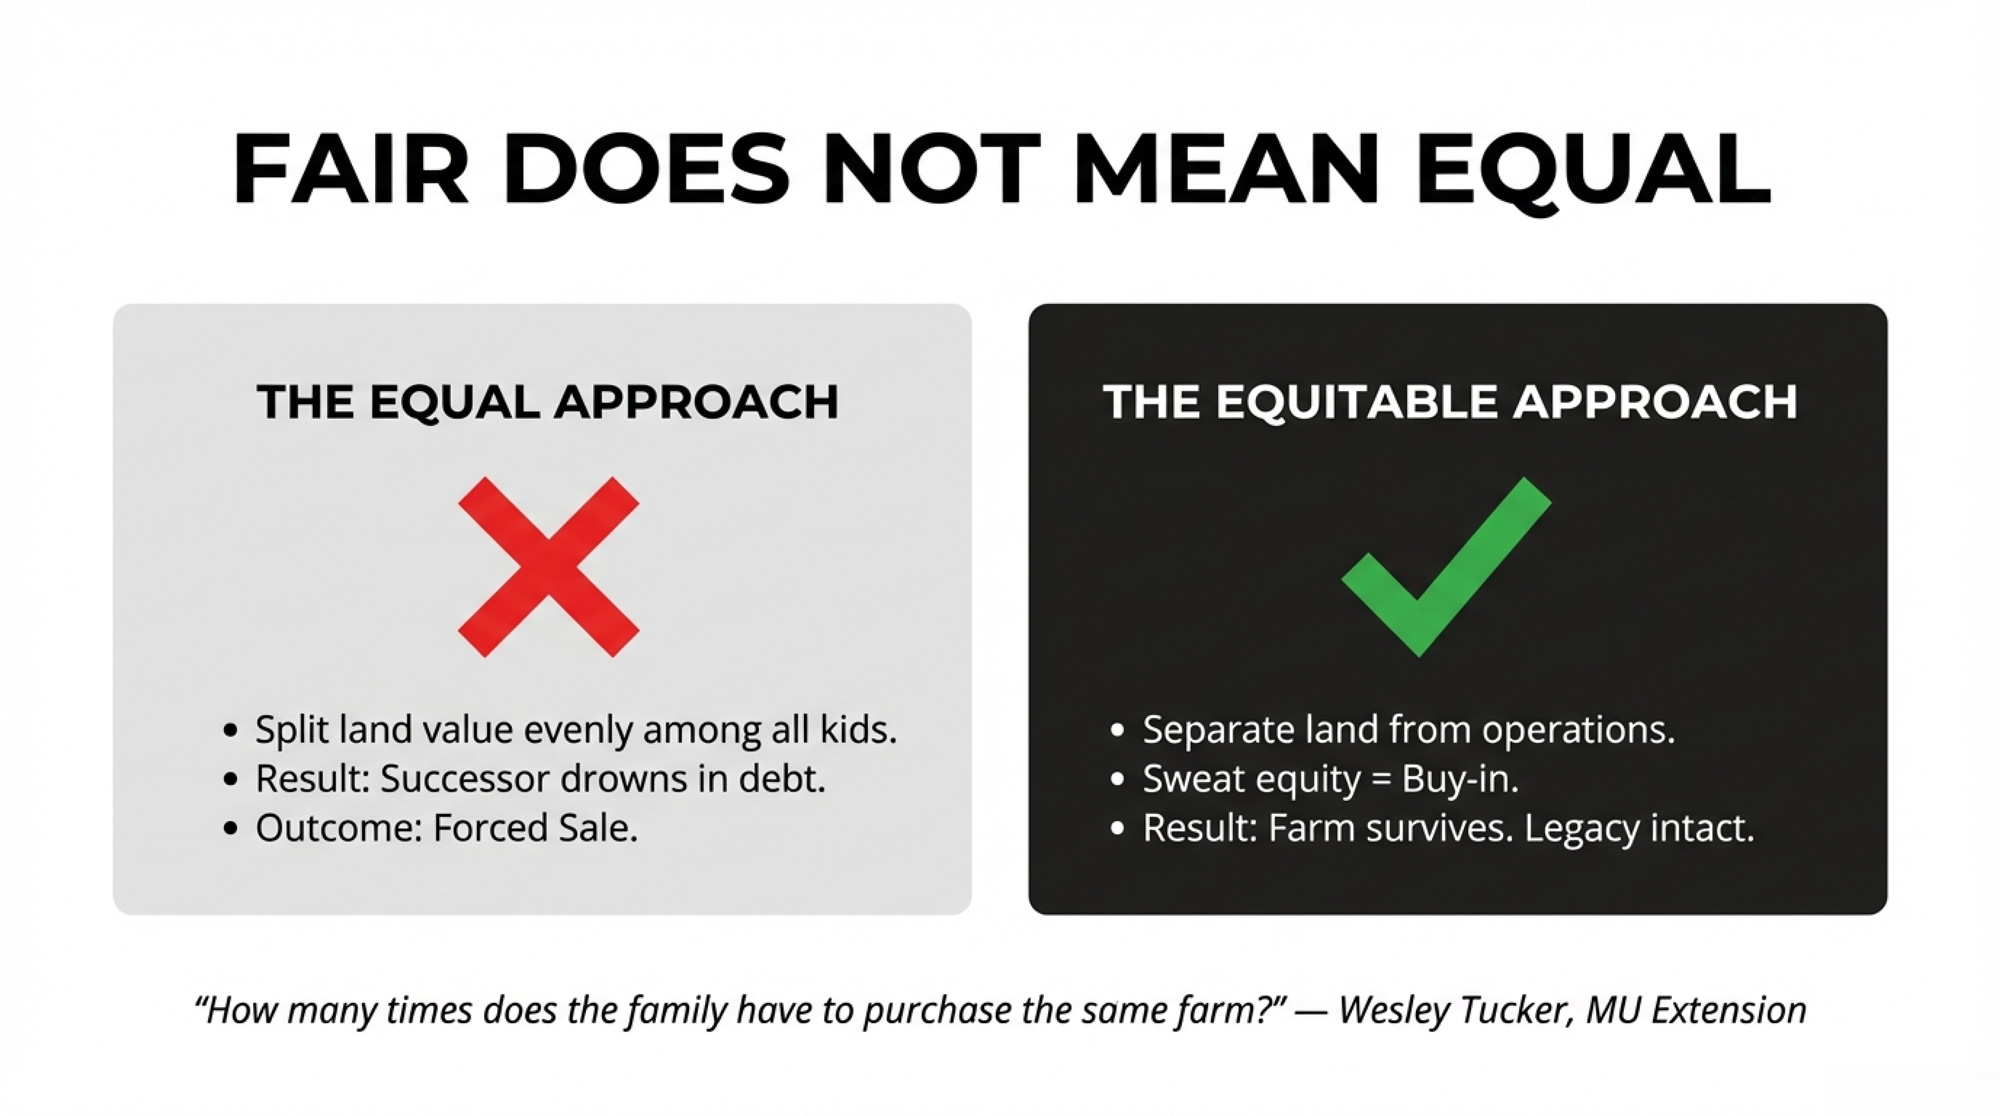
Most families default to “equal.” Split everything evenly among the kids. It feels right. It isn’t. Here’s how the two approaches play out:
| The “Equal” Approach | The “Equitable” Approach | |
| Land & Assets | Divide the total land value by the number of children. Each gets an equal dollar share | Separate operational assets from land ownership using distinct entities. Farming heir acquires the operation; land held separately |
| Sibling Buyout | Farming heir must buy out siblings at full fair market value — $2.9M+ on a 500-acre operation at $5,830/acre | Use long-term leases, gradual equity earn-in, or infrastructure investment counted as buy-in. As Wesley Tucker asks: “How many times does the family have to purchase the same farm?” |
| Documentation | Reliance on handshake agreements and family goodwill — exactly the approach the Metske court rejected | Written, witnessed, and bank-vetted contracts with independent legal advice for both parties |
| Debt Load | Successor likely exceeds the 4:1 debt-to-EBITDA threshold and fails the 1.25 term debt coverage minimum before day one | Debt sized to what milk actually generates — $592/cow — with payments structured to maintain viability |
| Typical Outcome | Forced sale or bankruptcy. The Metske family got $31,700 after six years. | Multi-generational continuity. The Heusinkveld family just passed 150 years. |
The families that survive figure out something the rest don’t: the “inheritance fairness” problem and the “business continuity” problem are two separate challenges that need two separate solutions. Blending them together is what kills the farm.
How to Structure It So the Farm Survives
Hilding’s advice provides a practical starting framework:
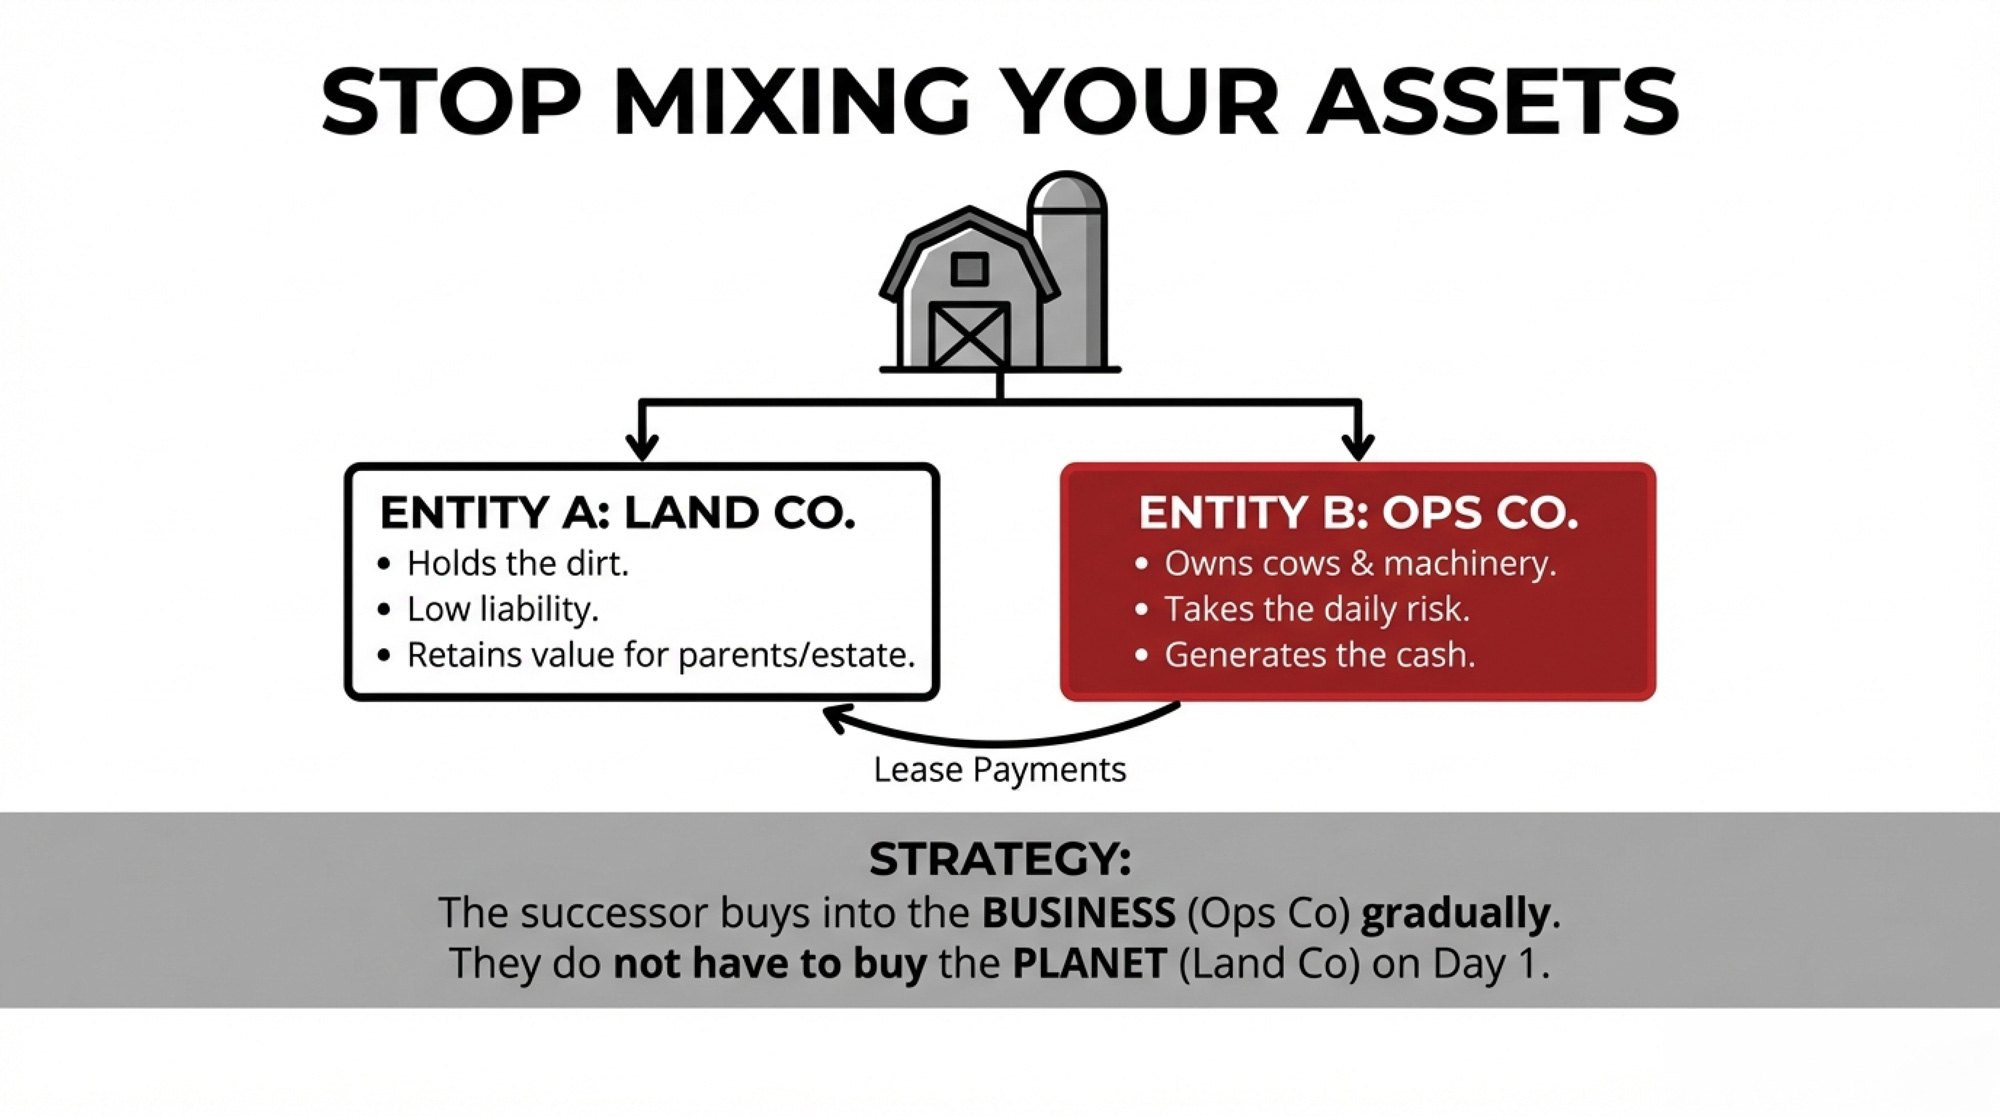
Separate operations from real estate. Establish one entity for the dairy operation and another to hold the real estate. “The real estate is a key investment you want to be separate from your liability, your employees, and the risk factors you have in your operation,” Hilding said. An incoming generation can’t afford to buy everything at once. Separating the assets gives everyone room to work. One trade-off to flag: entity separation adds legal and accounting overhead, and if structured carelessly, it can trigger tax consequences. Get advice specific to your province or state before you file anything.
Get the base documents done. A will or trust is the foundation. “No matter your age or amount of assets, having who you want in charge in writing makes a big difference,” Hilding advised.
Start the financial transparency early. The biggest misstep Hilding sees: the older generation withholding too much information, usually because they’re afraid of losing control. His advice — involve farming heirs in regular financial meetings and discussions with the lender. “Just because we do something on paper doesn’t mean you’re not showing up and aren’t part of the farm”.
Reagan Bluel, MU Extension dairy specialist, wrote in August 2025 that there’s another angle worth considering: treat infrastructure reinvestment as “buy-in”. When the incoming generation invests in a new parlor or freestall expansion that improves net income for everyone, that investment should count toward their stake. “When you include the purchase of the land in addition to a major piece of infrastructure, such as a parlor, the cash flow rarely works,” Bluel wrote.
Bluel sees this play out in real time across Missouri operations. “I recall hearing a prevailing statement by the older generation over and over when talking to farm families, ‘I didn’t have this farm given to me,'” she wrote. That pride is real — but so is the math. The assets needed for a dairy to succeed today are vastly different from 40 years ago, and Missouri land prices alone have increased an average of 6% annually over time.
What the Metske Ruling Teaches About Documentation
The Lerners LLP analysis of the court decision reads like a checklist of what the Metske family should have done:
Kill the “agreement to agree.” An outline without price, payment schedule, or valuation mechanism leaves your successor exposed. The court specifically rejected the idea that ongoing negotiations equal binding commitments.
Document the journey, not just the destination. Incremental steps — such as sales, quota leases, and vendor-takeback loans — need to be recorded and cross-referenced to a future transfer agreement. A memorandum of understanding, supported by independent legal advice for both parties, bridges the gap between kitchen-table discussions and enforceable agreements.
Align financing with the plan from day one. Tim and Amanda’s inability to secure lending doomed the succession before it started. Bring the lender in early. Confirm serviceability. Match payments to what the operation actually generates.
Make any below-market terms explicit. If you genuinely intend to offer your kid favorable pricing, write it down. Promissory notes. Side agreements. Signed and witnessed. The court rejected the notion that general family generosity amounts to a binding commitment.
Ontario producers have a free resource most haven’t opened: Publication 70, the Ministry of Agriculture’s Farm Succession Planning Guide — 120 pages covering business organization options, operating agreements, ownership transfer methods, and taxation implications.
| Factor | Documented Succession Plan | Undocumented (Metske Case) |
| Written Agreement | Signed purchase agreement with price, terms, timeline, and independent legal advice | None—”agreement to agree” rejected by court |
| Equity Recognition | Years of sweat equity and capital improvements credited toward purchase price or ownership stake | $33,700 in improvements reduced to $31,700 net after damages |
| Bank Involvement | Lender pre-approves financing structure; cash-flow viability confirmed before transfer | Bank refused 10-year quota financing in 2013—plan was already dead |
| Parental Intent | Donative intent (below-market terms) explicitly documented and tax-structured | Business plans showed FMV purchase—no proof of gifting intent |
| Dispute Resolution | Binding arbitration or mediation clauses; clear exit terms if plan changes | Six years of litigation; family relationships destroyed |
| Legal Outcome | Enforceable ownership transfer; successor builds generational wealth | Trial award of $405,000 overturned to $31,700 on appeal |
| Multi-Gen Continuity | Farm survives to generation three (12% club) | Farm lost; 88% attrition statistic |
Why “Eventually” Is the Most Dangerous Word in Succession
Hanson told Brownfield Ag News that this is exactly what families avoid. “To someday admit that I may not be on my farm, or I may not be operating or managing my farm, is very hard for a lot of farm producers,” he said. FCC’s transition resources don’t sugarcoat it: “Farm transition planning that starts at a funeral is a worst-case scenario”. That’s why advisors recommend starting 10–15 years out — not because the paperwork takes that long, but because restructuring entities, transferring equity, and getting everyone comfortable with a plan that’s fair but not equal all take time you can’t manufacture in a crisis.
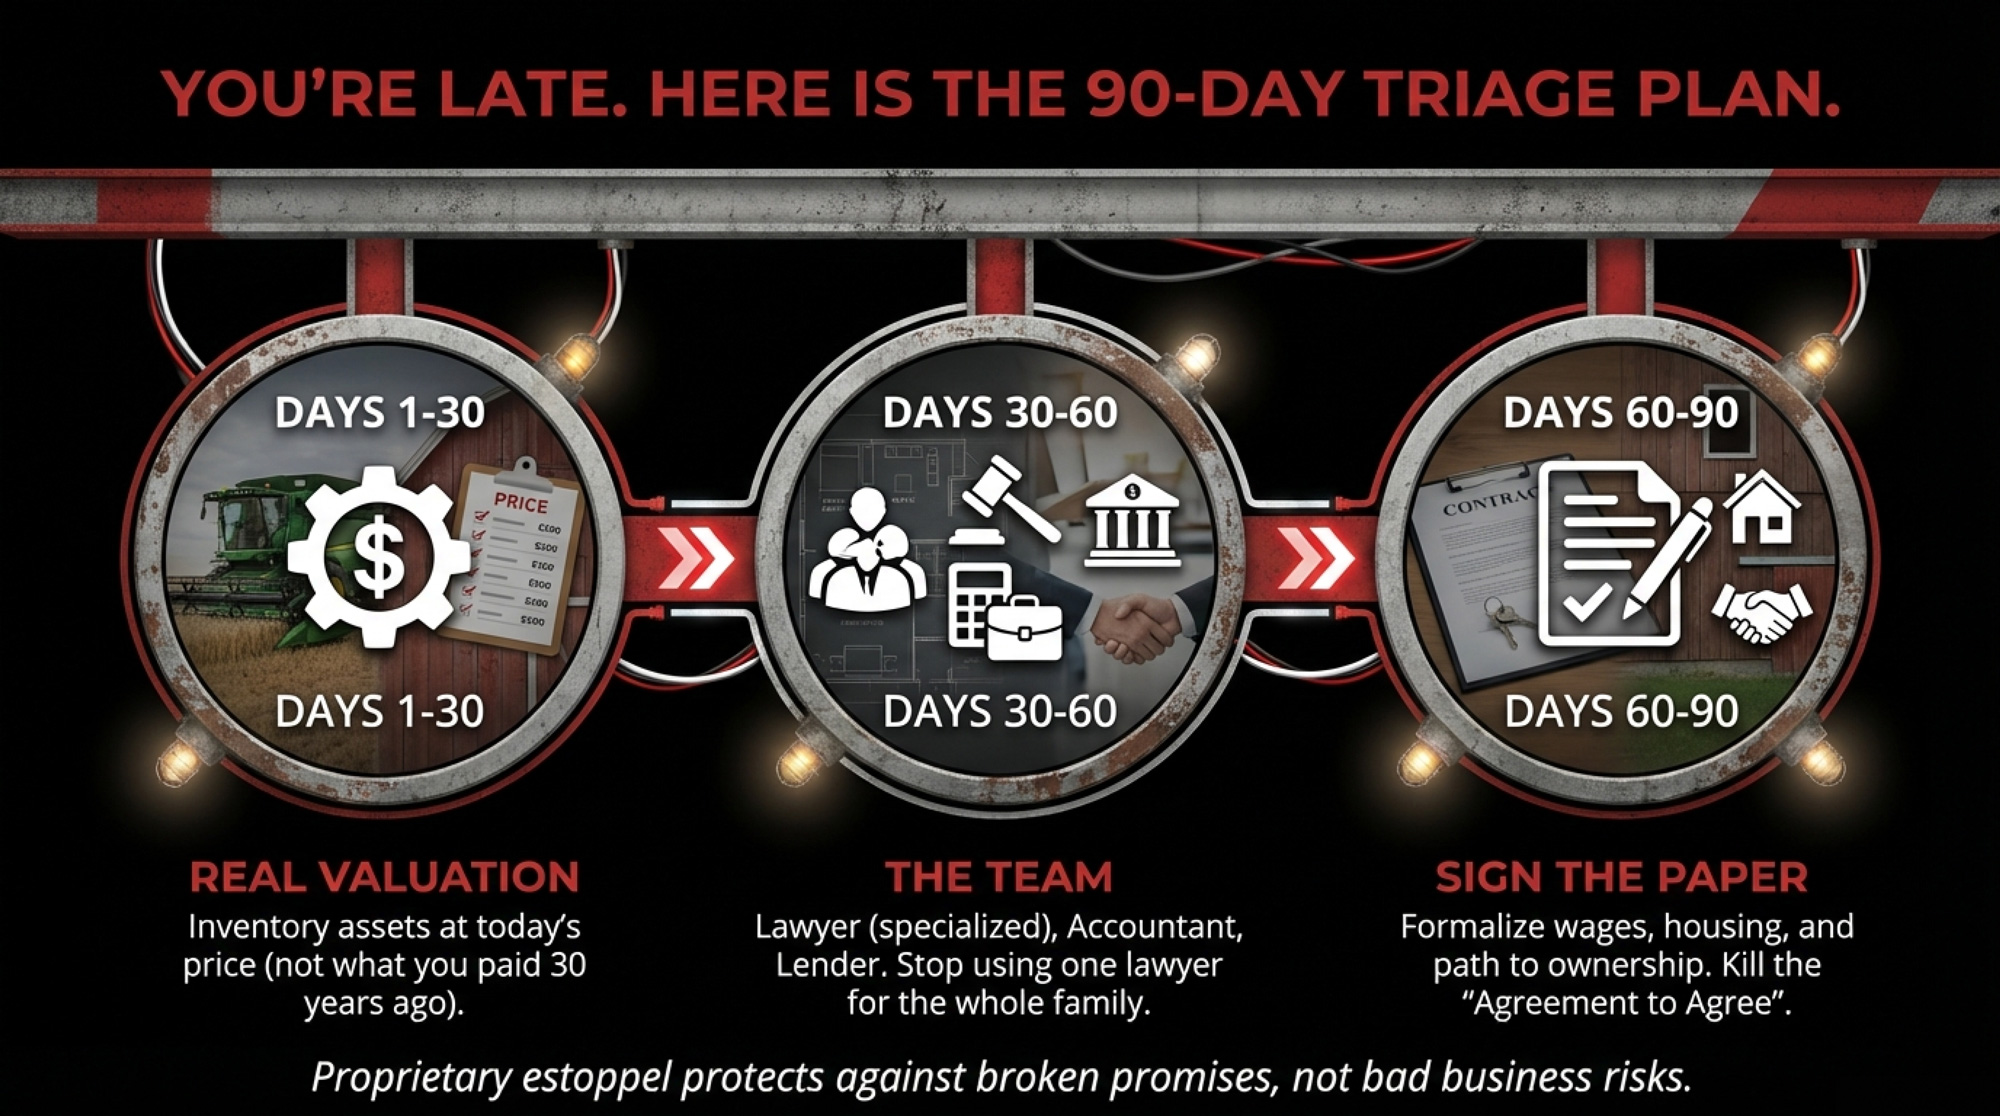
The 90-Day Triage: When You’re Already Behind
| Timeline | Core Task | Key Deliverables | Red Flags to Address |
| Days 1–30 | Asset inventory with real values | Land, cattle, equipment, quota, buildings valued at current market (not what you paid). Calculate debt-to-EBITDA ratio. | Debt-to-EBITDA above 4:1? Any succession plan that adds debt is dead. |
| Days 15–45 | Assemble advisory team | Attorney (farm succession specialist), accountant (ag tax treatment), lender (current FSA rates: 5.750% ownership, 4.625% operating). Get independent legal advice for all parties. | Using one family lawyer for everyone? Lerners LLP says that’s insufficient—parties need independent counsel. |
| Days 30–60 | First real family conversation | All stakeholders in room (off-farm siblings included). Schedule quarterly strategic meetings focused solely on transition. Create accountability for agenda portions. | FCC warns: unspoken expectations are “silent killers.” If you haven’t had this talk, you’re in the 88%. |
| Days 60–90 | Document current arrangements | Formalize terms TODAY: compensation, housing, vehicle use, decision authority, path to ownership. Write. Sign. Date. File with attorney. | Working without a written agreement? Metske court says sweat equity = $0 without documentation. |
| Days 90+ | Bank viability review | Lender confirms: 1.25+ term debt coverage ratio? Payments sized to $592/cow income reality? If no, restructure before transfer. | Penn State: below 1.25 coverage ratio, lenders won’t even look at your plan. |
If you’re 5–7 years from transition with nothing documented, here’s how to stop the bleeding:
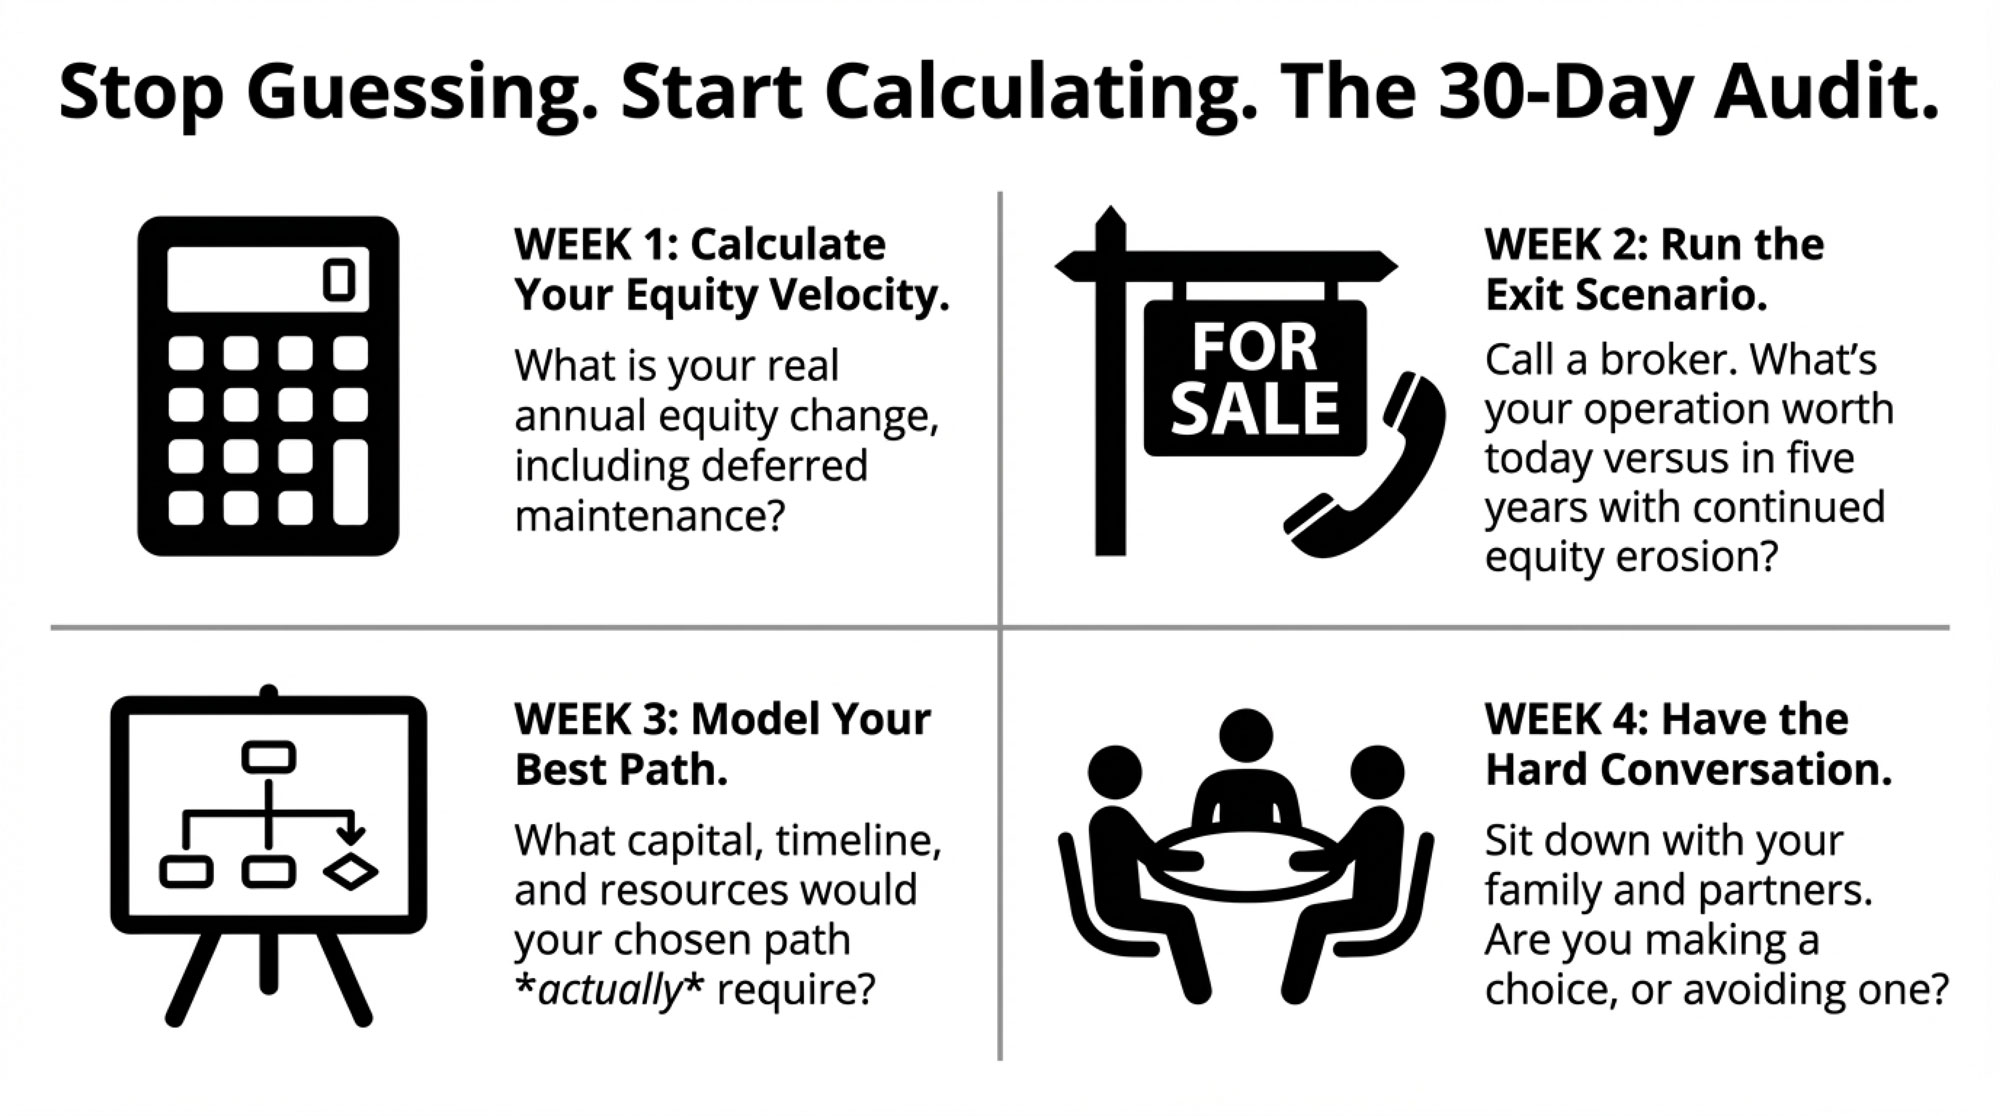
Days 1–30: Asset inventory with real values. Land, cattle, equipment, quota, buildings — what’s it worth today? Not what you paid. Not what you hope. What a buyer would actually pay. With U.S. cropland averaging $5,830 per acre and climbing 4.7% year-over-year, and Canadian farmland up 6.0% in just the first half of 2025, every month you wait makes the math harder for your successor. Then run your debt-to-EBITDA ratio. If you’re above 4-to-1, any succession plan that adds more debt is dead on arrival.
Days 15–45: Assemble your advisory team. Attorney with farm succession experience. Accountant who understands agricultural tax treatment. Lender who knows your operation. Current USDA Farm Service Agency direct ownership loans sit at 5.750%, with operating loans at 4.625% as of February 2026, and the Federal Reserve Bank of Chicago reported that ag credit conditions weakened in Q2 2025, with loan repayment rates falling and banks demanding more collateral. Your successor needs to know what lending actually looks like right now, not what it looked like when you last borrowed. The Lerners analysis recommends independent legal advice for all parties, not having one family lawyer serve everyone.
Days 30–60: First real family conversation. All stakeholders in the room — off-farm siblings included. FCC recommends scheduling quarterly strategic meetings focused solely on transition, with everyone accountable for a portion of the agenda. Day-to-day operations will overshadow long-term planning unless you carve out dedicated time.
Days 60–90: Document current arrangements. If your kid is already working on the operation, formalize the terms today. Compensation, housing, vehicle use, decision authority, and path to ownership. Write it down. Sign it. Date it.
What This Means for Your Operation
- Your farming heir already knows you haven’t planned this. Every year, without a formalized agreement, they’re calculating whether they’re building equity or providing cheap labor for a promise that might not survive a family disagreement. FCC calls unspoken expectations “the silent killers of transition plans”. They’re right.
- The Metske ruling is a legal precedent, not just a cautionary tale. Ontario’s Court of Appeal stated explicitly that vague family assurances, parental generosity, and years of labor don’t create property rights. Your kid’s sweat equity is worth $0 without documentation.
- The asset gap is widening faster than earnings can close it. U.S. farmland doubled in value since 2010. Analysts reported an average net earnings per cow of $592 in 2024. Penn State Extension says you need at least a 1.25 term debt coverage ratio for a lender to even look at your plan. Does your succession math clear that bar?
- “Fair” and “equal” aren’t the same thing — and treating them as synonyms is what kills the farm. As Hilding puts it: farms have to transfer in a fashion that’s not equal” to survive. Separate the inheritance question from the business continuity question, and solve each one with the right tools.
Key Takeaways
The 12% of family farms that reach generation three started earlier. They formalized arrangements when things were good, not when a crisis forced their hand.
Size transition payments to what milk can actually carry. If your plan requires the successor to service debt, the operation can’t cash-flow — as Tim Metske discovered when the bank demanded a 10-year amortization on the quota — you don’t have a succession plan. You have a countdown. Stay below 4-to-1 debt-to-EBITDA. Insist on at least 1.25 term debt coverage. If you can’t hit those numbers, restructure before you transfer.
Separate the land from the operation. Hilding’s advice to create distinct entities for real estate and operations isn’t just good lawyering — it’s the only way most families can make the math work for everyone.
Document everything. Today. The distance between $31,700 and a successful transition isn’t luck or family harmony. It’s paper. Signed, dated, witnessed paper.
The Bottom Line
In Fillmore County, Minnesota, Lucas Heusinkveld milks cows beside his dad, just like Nate once milked beside Jeff. “I am ready whenever they are,” Lucas says. He can say that because somebody — in every generation — made sure the next one was prepared before the crisis arrived.
Don’t let your legacy be a court docket number. Pick up the phone tomorrow. Call the accountant first, then the lawyer. Your kids are waiting for a plan, not a promise.
Complete references and supporting documentation are available upon request by contacting the editorial team at editor@thebullvine.com.
Learn More
- Who Really Owns Your Dairy? Three Ways to Stop Divorce and Succession Turning Unpaid Spousal Work into a Land Sale – Arms you with a practical playbook to quantify “invisible” farm labor. You’ll gain a risk-management strategy to protect your land titles from sudden legal shocks, ensuring unpaid contributions don’t trigger an unplanned liquidation.
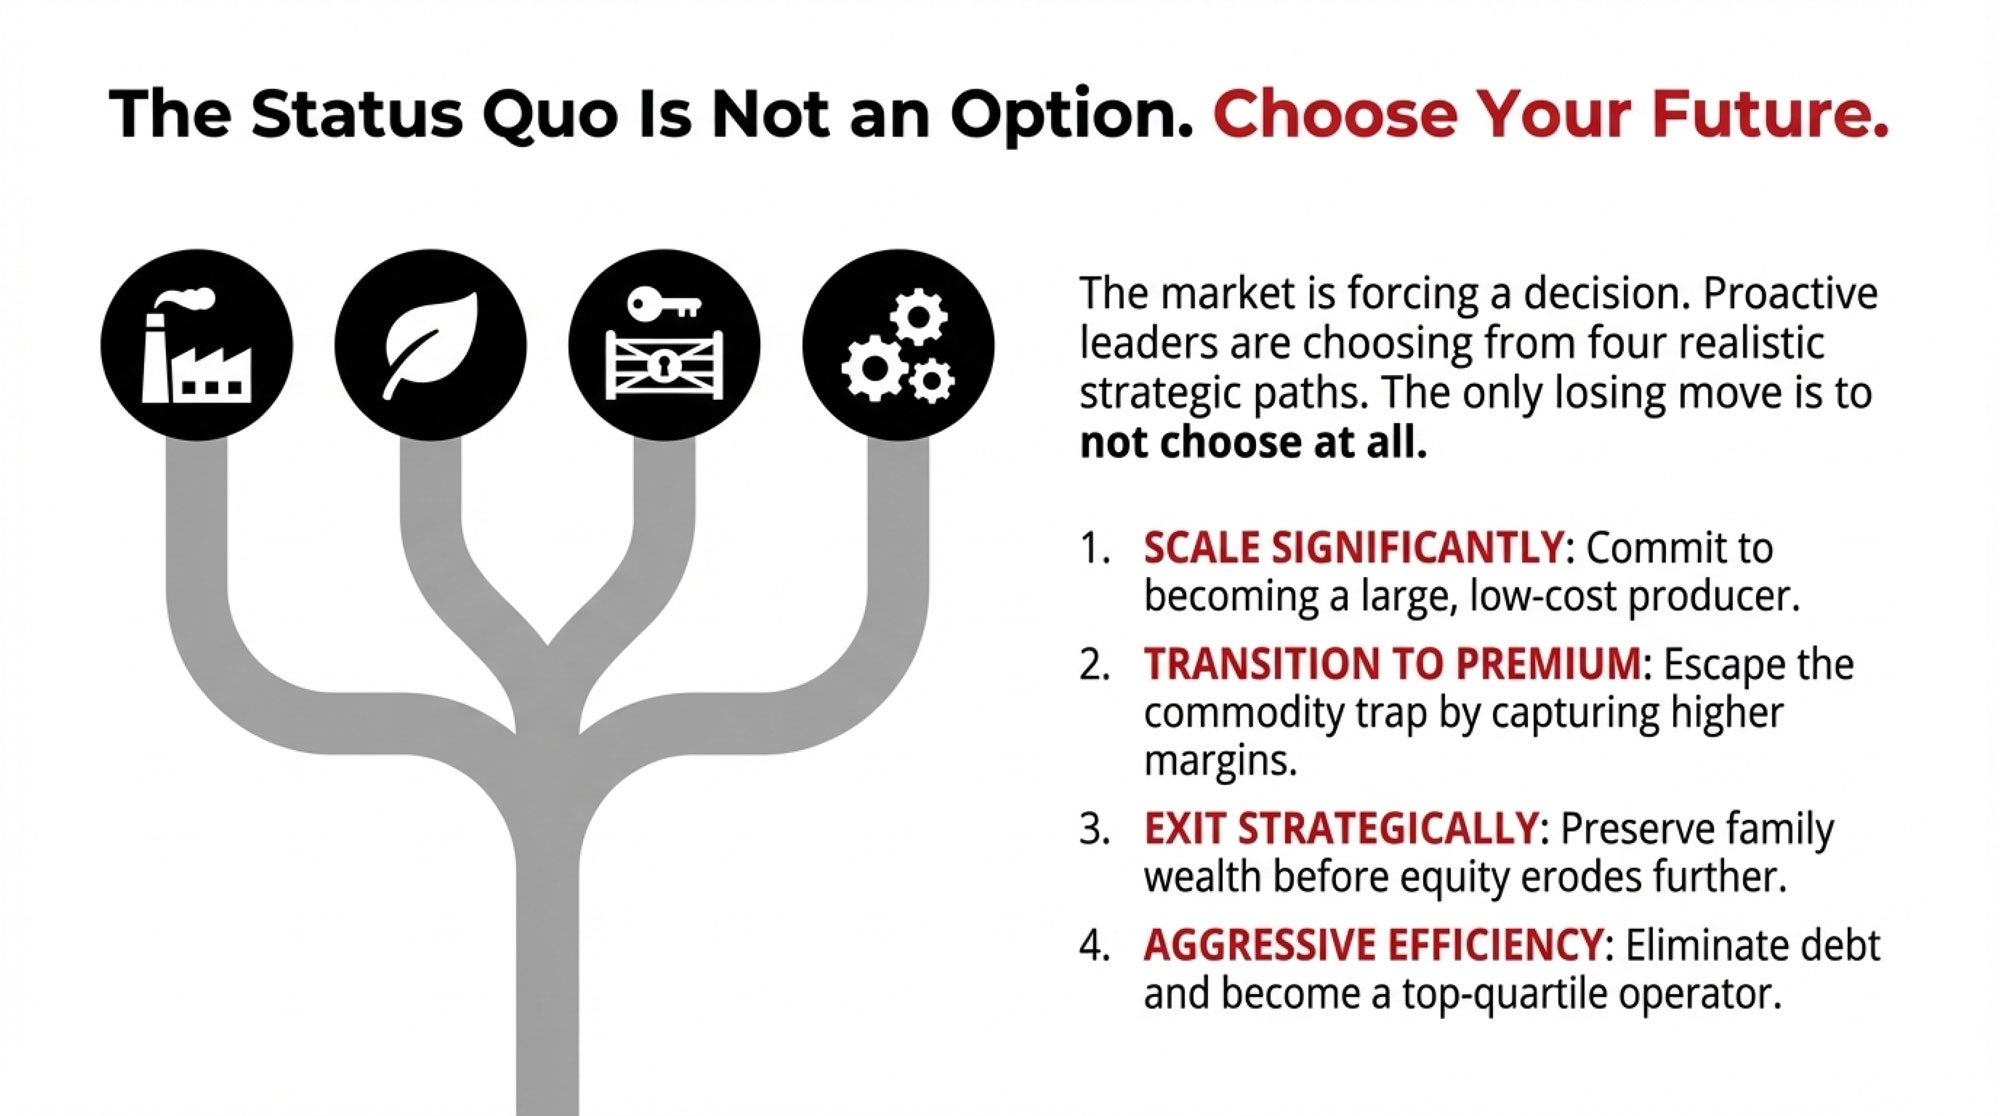
- The Bullvine Dairy Curve: 15,000 U.S. Farms by 2035 and Under 10,000 by 2050 – Who’s Still Milking? – Exposes the structural shifts driving the “15,000-herd limit” by 2035. This analysis reveals how mid-size operations can reclaim their competitive advantage by moving beyond the “get big or get out” mantra that is currently failing.
- How Holstein USA’s Million-Cow Study Should Change Your Linear Type Strategy – Breaks down the $2,678-per-cow gap between top and bottom conformation. This massive study reveals how precision breeding for structural durability, rather than just production, creates a significant long-term cash-flow advantage in robotic and parlor systems.
 The Sunday Read Dairy Professionals Don’t Skip.
 The Sunday Read Dairy Professionals Don’t Skip.
Every week, thousands of producers, breeders, and industry insiders open Bullvine Weekly for genetics insights, market shifts, and profit strategies they won’t find anywhere else. One email. Five minutes. Smarter decisions all week.