UK dairy revolutionaries ditch processors, capture 300% profit margins through direct-sales vending. Your feed efficiency means nothing if processors own your margins.
Executive Summary: While you’re optimizing feed conversion ratios and chasing genomic gains, UK farmers are solving the real problem—processor dependency that’s stealing your profits. UK milk vending operations are delivering £1.20-£1.60 per litre while traditional wholesale contracts squeeze farmers at 43.69p per litre—a staggering 300% pricing premium that’s transforming farm economics. With 400 machines now operating nationwide and 12-month ROI periods on £30,000 investments, this isn’t diversification—it’s liberation from commodity pricing. While North American producers face regulatory barriers with 20 US states prohibiting raw milk sales and Canada’s supply management blocking direct sales entirely, UK farmers operate in a framework that enables direct-consumer innovation. The brutal truth? Your superior butterfat percentages and lower somatic cell counts won’t save you if processors capture all the value—time to evaluate whether you’re building your operation or subsidizing theirs.
Key Takeaways
Direct-Sales ROI Destroys Traditional Expansion Models: £30,000 vending setups deliver 12-month payback periods compared to decades for conventional capacity expansion, with farmers achieving 60-80 pence per litre margins versus single-digit pence through processor contracts
Value-Added Products Drive Exponential Returns: Flavoured milkshakes generate 40-50% higher per-litre revenues than base milk, with successful operations increasing average customer spend from £3.50 to £7.00 through comprehensive farm retail offerings that bypass traditional distribution entirely
Technology Integration Enables 24/7 Autonomous Revenue: Modern vending systems with IoT connectivity and contactless payments processing 85% of transactions create self-contained retail operations immune to processor capacity constraints and transport disruptions affecting conventional supply chains
Processor Disintermediation Transforms Farm Economics: Operations achieve sustainable 200-300% pricing premiums over wholesale rates while maintaining competitive positioning against premium supermarket brands, proving that controlling your supply chain beats optimizing for someone else’s profit margins
Global Regulatory Comparison Reveals UK’s Strategic Advantage: Unlike restrictive frameworks in Canada’s supply management system and fragmented US state regulations, UK’s permissive direct-sales environment enables farmer-led innovation that North American producers can only dream about
Here’s the brutal truth your processor doesn’t want you to hear: UK farm-gate prices dropped to 43.69 pence per litre in April 2025—down 2.6% from March—while smart vending operators across the country are banking £1.20-£1.60 per litre. That’s not evolution, folks. That’s revolution.
Look at the numbers. Four hundred forty producers (5.8%) left the industry between April 2023 and 2024, reducing Great Britain’s producer count to approximately 7,130 operations. The survivors? They’re facing a stark choice: stay trapped as price-takers in a commodity squeeze, or break free and become price-setters through direct consumer engagement.
This isn’t just another diversification trend rolling through the countryside. This is the blueprint for breaking free from processor dependency—and it’s already delivering 12-month ROI periods for operators brave enough to challenge the status quo.
The Processor Disintermediation Wave You Can’t Ignore
Let’s cut through the industry noise for a minute. Sure, milk volumes hit 1,396 million litres in April 2025, but here’s what really matters—who’s controlling the margins? The global milk vending market, valued at $152 million in 2025, is projected to reach $265.1 million by 2033 with a 7.2% compound annual growth rate.
What This Actually Means for You: Every machine that goes up represents another farmer who looked at their processor contract and said, “enough.” They’ve claimed ownership of their product’s final value, rather than handing it over to middlemen.
Those 400 machines now operating nationwide? They’re not just dispensers sitting in farm yards. They’re declarations of independence from a supply chain that’s kept farmers as commodity producers for generations. When processor margins consistently exceed farmer margins, something’s fundamentally broken. Smart operators are fixing it.
Technology Investment Reality Check: £30,000 to Freedom
Here’s where traditional thinking gets dangerous. Yes, complete setup costs typically reach £30,000 for vending machine and pasteurization combinations. But here’s the question processors are praying you never ask: How many years of 43p per litre milk does it take to generate the cash flow that vending operators achieve in just 12 months?
The Math They Don’t Want You to See:
Traditional margin: Single-digit pence per litre
Vending margin: 60-80 pence per litre after costs
ROI timeline: 12 months for vending vs. decades for traditional capacity expansion
Now, The Milk Station Company supplies roughly 75% of UK vending machines, but honestly? The real innovation isn’t in the hardware—it’s in the mindset shift from commodity production to premium retail positioning.
Current Market Dynamics: Why Now Is Your Moment
The industry consolidation creating today’s crisis? That’s tomorrow’s opportunity for operators who see what’s coming. With butterfat at 4.29% and protein at 3.41% in April 2025, you’ve got quality metrics that support premium positioning strategies. Yet most farmers let processors train them to ignore this advantage.
Global Context Reality:The United States prohibits raw milk sales in 20 states, while Canada operates near-total prohibition on private raw milk sales. Meanwhile, UK farmers are operating in a regulatory environment that actually enables direct sales innovation. Most just stay chained to processor contracts anyway.
This isn’t a coincidence—it’s a competitive advantage hiding in plain sight.
Value Engineering Beyond the Commodity Trap
Here’s What Processors Fear Most: Farmers discovering that flavoured milkshakes generate 40-50% higher per-litre revenues than base milk. Think about this: a 500ml milkshake selling for £1.80 delivers £3.60 per litre equivalent—more than eight times current farm-gate prices.
Successful operations routinely see average customer spend jump from £3.50 to £7.00 after introducing comprehensive retail offerings. This isn’t just about milk anymore. It’s about transforming from commodity supplier to destination retailer.
The Cooperative Response: First Milk’s Strategic Pivot
Even traditional cooperatives see the writing on the wall. First Milk’s Golden Hooves brand, launched in 2022, now provides member farmers with branded vending machines and regenerative agriculture messaging.
The Strategic Implication: When cooperatives start competing with their own wholesale model, you know the game has changed. The question isn’t whether direct sales will grow—it’s whether you’ll be leading this charge or watching from the sidelines.
International Regulatory Comparison: UK’s Hidden Advantage
While only 124 farms in England are registered for raw milk sales, the UK’s framework enables innovation that’s impossible elsewhere. Georgia became the 31st state to allow raw milk sales in 2023, but 20 US states still prohibit raw milk sales entirely.
Your Competitive Reality: You’re operating in a jurisdiction that enables direct-sales innovation while most global producers face regulatory barriers. That’s not luck—that’s strategic positioning most farmers aren’t exploiting.
UK Regulatory Framework: Clear Pathways vs Global Restrictions
The UK’s approach gives you clear pathways for farm diversification through direct milk sales. Raw milk producers just need to register with the Food Standards Agency and implement solid food safety management plans. You can sell directly from farms, through farm-run delivery services, or at registered farmers’ markets.
Compare that to Canada’s supply management system, which effectively blocks on-farm vending by requiring all milk to be processed through licensed processors. The regulatory comparison reveals exactly why UK adoption is accelerating, while North American penetration remains stagnant.
The Distribution Disruption Accelerating
The vending model cuts right through the traditional supply chain—farmer-hauler-processor-packager-distributor-retailer becomes a simple cow-to-consumer transaction. This disintermediation transforms farmers from commodity producers into brand owners, manufacturers, and retailers, granting them total control over pricing and positioning.
Real-World Evidence: Look at Midtown Milkhouse’s expansion into Booths supermarkets. They’re scaling beyond farm-gate sales while maintaining premium pricing and sustainable packaging that processors simply can’t replicate.
Modern vending systems pack IoT connectivity for remote monitoring and contactless payment systems, handling 85% of transactions. Advanced models, such as the MOD 400 and MOD 600, offer multiple 200-litre tanks with automatic changeover functions that minimize downtime.
Operational Reality:High-temperature, short-time pasteurization equipment costs £6,000-15,000 but delivers the food safety compliance that’s essential for premium positioning—the same compliance processors use to justify their massive margins.
Market Saturation vs. Market Development
With approximately 400 machines nationwide serving the UK’s retail milk market, penetration remains minimal. Global market projections indicate compound annual growth rates of 6.6-8.1%, suggesting significant expansion potential beyond the early adopter crowd.
Strategic Question: In a consolidating industry that loses 440 producers annually, will you continue to compete for processor table scraps or claim your share of the premium direct-sales market?
The Latest: Why Traditional Distribution Is Becoming Obsolete
Here’s what the data confirms: UK vending operations are achieving sustainable pricing premiums of 200-300% over wholesale rates, while farm-gate prices remain 14% higher than in April 2024, despite recent declines. Post-pandemic consumer behavior shows a lasting preference for local provenance and sustainable packaging solutions.
Industry Reality Check:Global market projections indicate compound annual growth rates of 7.2% through 2033, while traditional processor margins continue to squeeze primary producers. This technology trend represents fundamental shifts that empower farmers through precision agriculture integration, while challenging processor-dominated supply chains.
Bottom Line: This direct channel delivers instant cash flow and greater business resilience, with ROI frequently achieved within 12 months. The question isn’t whether direct-to-consumer dairy will grow—it’s whether you’ll build your operation around processor dependency or consumer engagement.
The revolution is happening. The only question left is which side of the disruption you’ll choose.
Complete references and supporting documentation are available upon request by contacting the editorial team at editor@thebullvine.com.
Learn More:
UK Dairy Farmers start selling fresh milk from 24-hour vending machines – Demonstrates how to implement vending operations through real farmer case studies, revealing practical strategies for setup, customer acquisition, and operational management that delivered immediate profitability during pandemic disruptions.
5 Technologies That Will Make or Break Your Dairy Farm in 2025 – Exposes five breakthrough technologies beyond vending that deliver measurable ROI within 12 months, providing the complete automation roadmap that transforms traditional operations into profit-maximizing, tech-enabled enterprises for sustained competitive advantage.
Join the Revolution!
Join over 30,000 successful dairy professionals who rely on Bullvine Weekly for their competitive edge. Delivered directly to your inbox each week, our exclusive industry insights help you make smarter decisions while saving precious hours every week. Never miss critical updates on milk production trends, breakthrough technologies, and profit-boosting strategies that top producers are already implementing. Subscribe now to transform your dairy operation’s efficiency and profitability—your future success is just one click away.
While you optimize feed efficiency for $21/cwt milk, smart operators captured $1.26B in agritourism revenue—here’s your July 4th playbook
You probably don’t think of your 377-cow dairy as a tourist destination. That’s the current US average herd size as of 2024, up 5.3% from the previous year, and most operators at this scale are too busy managing feed costs, labor shortages, and volatile milk prices to consider that their operation could be generating substantial revenue from visitors eager to experience authentic American agriculture.
However, here’s the reality you’re missing: while you’re fighting for pennies per hundredweight in commodity markets, patriotic dairy farms across America are building six-figure agritourism businesses that insulate them from market volatility while creating powerful community connections that directly translate to bottom-line results.
The Conventional Wisdom That’s Killing Your Profits
Here’s the dangerous conventional thinking that’s keeping most dairy operations trapped in commodity pricing cycles: agritourism is viewed as a “nice-to-have” side business rather than an essential diversification strategy for financial survival.
This outdated mindset stems from decades of the dairy industry’s primary focus on production efficiency. The traditional approach suggests maximizing milk per cow, minimizing costs per hundredweight, and letting processors worry about marketing. However, this commodity-focused thinking is precisely what makes operations vulnerable to market forces that are completely beyond their control.
The evidence against commodity-only thinking is overwhelming. According to peer-reviewed research published in Sustainability, agritourism operations exhibit positive associations with increased profitability, based on factors such as operator experience, farm scale, on-farm product sales, and event and entertainment offerings. Yet, most dairy operations continue to cling to the false belief that “real farmers” focus only on production.
This mindset ignores the fundamental economic reality that successful businesses create multiple revenue streams while building brand equity that commands premium pricing.
The Skeptical Reality: Why Most Agritourism Ventures Struggle
Before diving into success stories, let’s address the elephant in the barn: agritourism isn’t a guaranteed path to profitability, and understanding failure modes is crucial for realistic planning.
The Connecticut Wake-Up Call: When Agritourism Goes Wrong
The most sobering reminder of agritourism risks comes from a 2016 Connecticut goat dairy farm that generated the state’s largest zoonotic E. coli outbreak. During kidding season, this operation welcomed approximately 500 visitors per day on weekends. The result? 51 laboratory-confirmed cases of STEC O157 infection, with 22% of patients hospitalized and 6% developing hemolytic uremic syndrome.
The financial and reputational devastation was swift and total. The farm was closed by public health order, faced potential lawsuits, and suffered permanent damage to its community reputation. Case-control analysis revealed that children who sat on hay bales in the doe barn had 4.55 times higher odds of infection, demonstrating how seemingly innocent activities can become liability nightmares.
The key failures that every dairy operation must avoid:
No handwashing stations with soap and running water for visitors
Limited hand sanitizer availability in critical areas
Unrestricted visitor access to contaminated environments
Inadequate separation between production and visitor areas
Poor waste management and bedding protocols
The Opportunity Cost Reality Check
Agricultural economists have long questioned whether agritourism represents the optimal use of farm resources. The fundamental concern is that every hour spent managing visitors is an hour not spent optimizing production efficiency, marketing milk, or developing more profitable value-added enterprises.
Dedicated staff for visitor management during events
Financial Reserves
___
6+ required
12-month operating expenses for an agritourism startup
Family Commitment
___
8+ required
All stakeholders enthusiastically support public access
Scoring Analysis:
50-60 points: Strong candidate for agritourism development
40-49 points: Address deficiencies before proceeding
Below 40 points: Focus on core dairy operations first
Why Your Production Excellence Makes You Perfect for Agritourism
Think of agritourism as optimizing your herd’s genetic merit for profitability beyond milk production. Just as you select bulls with superior Total Performance Index (TPI) scores to improve future generations, patriotic displays and farm tours leverage your existing assets to generate new revenue streams without additional feed costs or breeding decisions.
Your current production benchmarks position you perfectly for this opportunity. With US dairy herds now averaging 9.365 million head nationally and individual operations averaging 377 cows, you’re operating at a scale that provides impressive visual impact while maintaining the authentic “family farm” experience visitors crave.
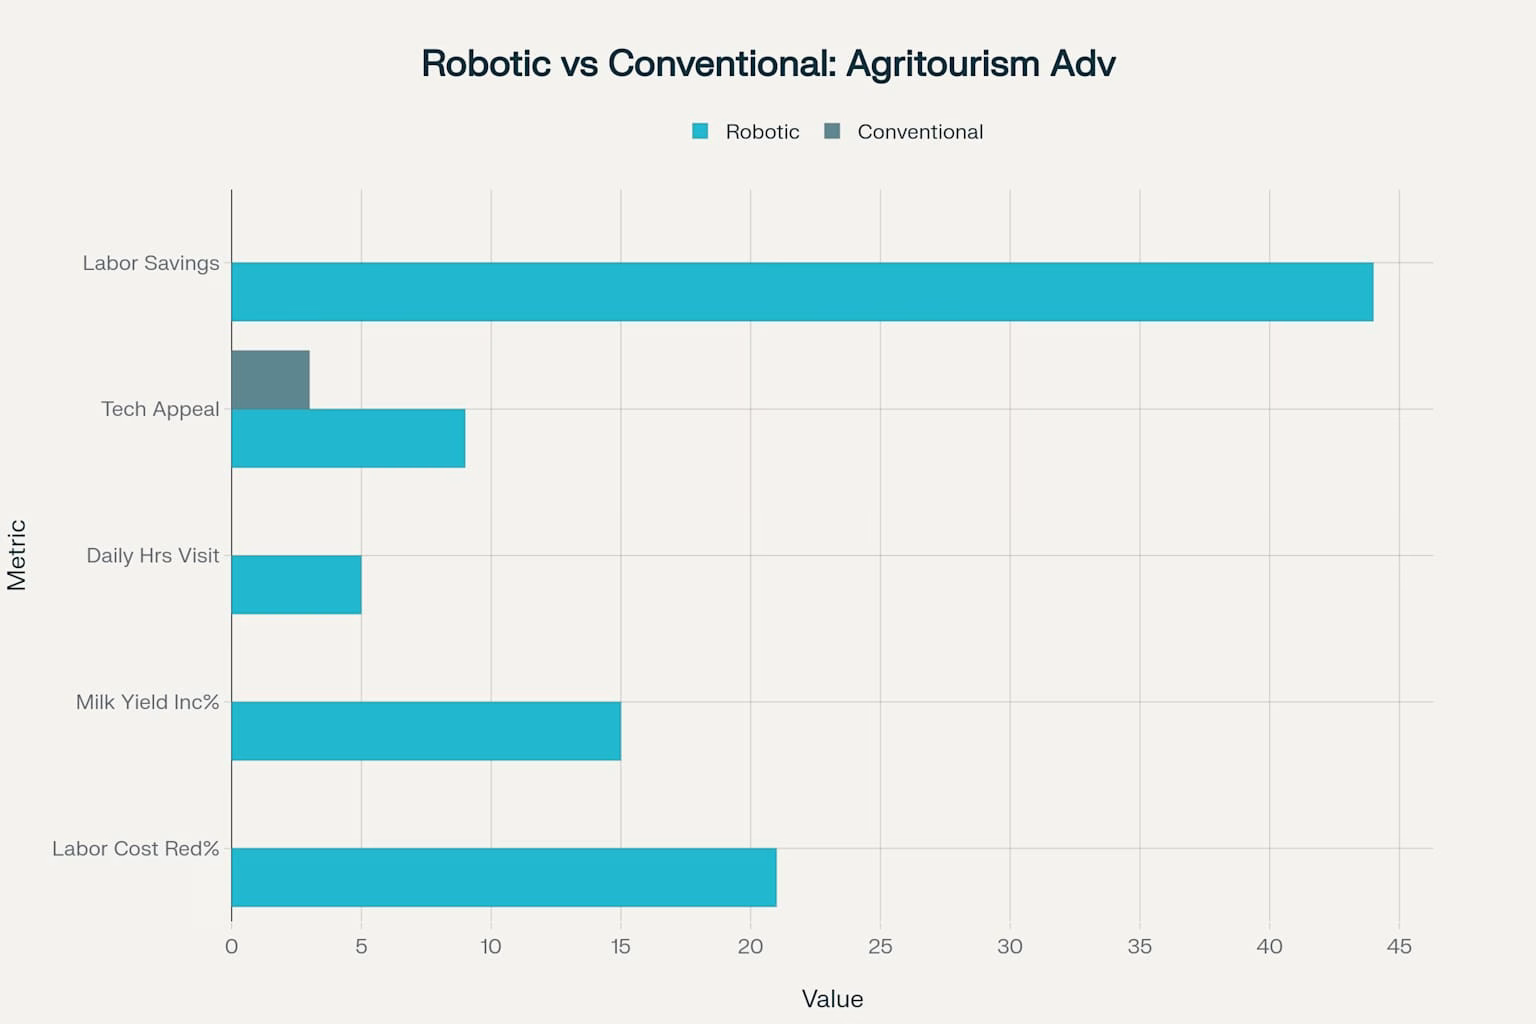
Robotic vs Conventional Milking Systems: Key Advantages for Agritourism Operations – Based on peer-reviewed dairy science research and USDA economic analysis
Modern dairy operations already demonstrate the technological sophistication that fascinates consumers. The global milking robot market reached $2.5 billion in 2025 and is projected to grow at a 6.4% CAGR to $4.66 billion by 2035. Approximately 5% of US dairy operations now utilize robotic milking systems, specifically around 1,000 farms concentrated in the Midwest and Northeast. Whether you’re running an automated milking system or a traditional parlor, your technology story becomes a powerful marketing tool.
Your milk quality metrics tell a compelling story of American agricultural excellence. With the national average somatic cell count holding steady at 181,000 cells/mL and test-day average milk yield rising to 83.1 pounds, with a fat percentage of up to 4.24%, your operation represents the pinnacle of global dairy production.
Why This Matters for Your Operation: The Wisconsin Success Story
Consider Sarah’s 180-cow operation in Grant County, Wisconsin. Like many producers, she initially viewed her farm purely as a milk production facility. However, when commodity prices dropped in 2022, she implemented a modest agritourism program, featuring weekend farm tours and patriotic round bale displays during the summer months.
The results were transformative: Within 18 months, agritourism generated $45,000 in additional annual revenue, equivalent to 500,000 pounds of milk at $9.00 per cwt. More importantly, the direct consumer relationships led to premium pricing for her on-farm store, where visitors pay $6.50 per gallon for milk that processors would purchase for $2.10 per gallon equivalent.
Her key insight: “I realized we weren’t just selling milk—we were selling the story of American dairy excellence. Visitors don’t just want to see cows; they want to understand how modern technology and traditional values create the world’s safest, highest-quality milk supply.”
The Data-Driven Case for Immediate Action
But here’s where conventional thinking becomes truly dangerous: delaying agritourism development while “focusing on production first” ignores the accelerating market trends that make early adoption increasingly valuable.
This efficiency gain creates a dangerous competitive dynamic: the industry can meet increased demand for milk solids more quickly than ever before, putting downward pressure on commodity prices precisely when input costs continue rising. Operations that remain purely commodity-focused are essentially competing in a race to the bottom with increasingly efficient competitors.
Understanding regional variations in agritourism implementation costs is crucial for accurate ROI projections:
Region
Basic Infrastructure Cost
Labor Cost Factor
Insurance Premium
Marketing Advantage
Northeast
$15,000-25,000
1.3x national average
$2,000-4,000
High population density
Midwest
$10,000-18,000
1.0x national average
$1,200-2,500
Agricultural heritage tourism
Southeast
$12,000-20,000
0.9x national average
$1,500-3,000
Year-round season
West Coast
$20,000-35,000
1.5x national average
$2,500-5,000
Premium pricing potential
The timing couldn’t be more critical. Every month you delay agritourism development, competitors in your region may be establishing the community relationships and brand recognition that will be nearly impossible to replicate once they’re entrenched.
Challenging the Labor Shortage Myth Through Strategic Technology
Here’s another piece of conventional wisdom that needs dismantling: the belief that labor shortages make agritourism impossible because “we don’t have enough people to handle visitors.”
The key insight most operations miss: technology investments that reduce labor requirements for core production activities free up human resources for higher-value customer interaction and experience management. When robotic systems handle routine milking tasks, farm families can focus on the community engagement activities that generate premium revenue.
Mike Johnson’s 350-cow operation in Steele County, Minnesota, exemplifies the technology-enabled agritourism model. In 2021, he invested $280,000 in a robotic milking system primarily to address labor shortage challenges. The unexpected benefit: automation freed 4-5 hours daily for family members to develop educational programs and visitor experiences.
Financial outcomes after three years:
Milk production increased 12% due to improved cow comfort and more frequent milking
Labor costs decreased 18% despite wage inflation
Agritourism revenue reached $75,000 annually through technology-focused farm tours
Direct sales of premium dairy products generated an additional $35,000 annually
Mike’s strategic insight: “The robot didn’t replace our family values—it amplified them. We can spend more time with visitors explaining how technology and traditional stewardship work together to produce exceptional milk while caring for our animals and environment.”
Financial Analysis: The Component Premium Opportunity
Two thousand twenty-five market conditions create unprecedented opportunities for operations producing superior milk components, but only for farms that understand how to market this excellence beyond commodity channels.
However, what most operations overlook is that superior component production only generates premium revenue if you can effectively demonstrate and market that superiority to end consumers. Agritourism provides the perfect platform for educating visitors about the science behind premium milk production while justifying higher prices for direct-sales products.
When visitors observe your precision feeding systems, which target optimal component levels, and learn how your genetics program produces superior cheese-making milk, they’re witnessing agricultural excellence that commands premium pricing. This educational component transforms commodity milk into branded products with clear provenance and authentic stories.
Verified Revenue Projections by Operation Size
Agritourism Revenue Potential by Dairy Farm Size – Based on verified data from USDA Economic Research Service and peer-reviewed agritourism profitability research
Managing cash flow is one of the most critical aspects of agritourism development, particularly given the seasonal nature of visitor revenue and the need for upfront infrastructure investments. Dairy farms have experienced significant cash flow variations since 2022, with input costs rising sharply while milk prices fluctuate unpredictably.
Essential cash flow considerations for agritourism development:
Seasonal Revenue Patterns: Most agritourism revenue concentrates in May-October, requiring careful financial planning for off-season periods
Infrastructure Investment Timing: Spread major investments across multiple years to avoid cash flow strain during development phases
Insurance and Liability Costs: Factor ongoing insurance premiums ($1,000-3,000 annually) into monthly cash flow projections
Marketing Investment Requirements: Budget 5-10% of projected agritourism revenue for promotional activities and customer acquisition
July 4th Strategy: Leveraging Peak Production Season
Round bale art represents the agricultural equivalent of precision agriculture investment: modest upfront costs generating long-term returns through increased brand recognition and visitor attraction. Unlike feed or labor costs that must be repeated daily, patriotic displays provide season-long marketing value while building community goodwill that benefits the operation year-round.
The economics are straightforward and verifiable. Materials for patriotic round bale displays typically cost $50-100, but the return on investment extends far beyond direct revenue. When combined with social media promotion and community engagement, these displays generate organic marketing that paid advertising cannot replicate.
Implementation Timeline: Production System Integration
Design agritourism experiences, much like formulating a Total Mixed Ration, by balancing multiple components to achieve optimal outcomes. Successful July 4th events integrate educational content (30%), entertainment value (40%), and commercial opportunities (30%) while maintaining production excellence.
Educational components should highlight:
Live demonstrations of modern milking technology and animal welfare protocols
Component testing and quality assurance processes that exceed industry standards
Genetic selection for production traits and superior milk composition
The Kurtz family’s 130-cow operation in Chester County demonstrates how mid-sized farms leverage technology for dual benefits. Their investment in robotic milking systems freed labor for conservation projects and visitor education programs, earning them the 2024 Pennsylvania Distinguished Dairy Producer award.
Key performance metrics:
Robotic milking system enabling 100% no-till farming on 275 acres
Cover crops are implemented across the entire operation for soil health demonstration
Stream bank fencing and riparian buffer showcasing environmental stewardship
Financial outcomes: While specific agritourism revenue wasn’t disclosed, the family reports that technology investment enabled conservation practices that both reduce input costs and create compelling visitor experiences. Their operation serves as a living demonstration that modern efficiency and environmental stewardship aren’t competing priorities.
Technology Integration: The Next-Generation Competitive Advantage
Your GPS-guided tractors, automated feed systems, and activity monitoring equipment tell a story of innovation that visitors cannot experience at theme parks or traditional entertainment venues. This technology integration functions like optimizing metabolizable energy levels in rations: every system works together to achieve superior outcomes while providing educational content that justifies premium agritourism pricing.
The Blockchain Revolution: Transparency as a Competitive Advantage
Automated milking systems provide perfect demonstration opportunities for explaining modern dairy technology. With robotic milking systems now operating on approximately 1,000 US farms, representing 5% of dairy operations, these installations showcase American agricultural innovation while requiring minimal staff supervision during visitor tours.
This creates a powerful marketing message: American dairy operations combine traditional agricultural values with cutting-edge technology to produce the world’s highest-quality milk while maintaining superior animal welfare standards that exceed global benchmarks.
International Perspective: Learning from Global Agritourism Leaders
While American dairy operations possess unique advantages, examining international agritourism models offers valuable insights for implementing effective strategies. European dairy regions, particularly in Austria and Switzerland, have successfully integrated dairy farming with tourism for decades, creating models worth adapting to American conditions.
Key success factors transferable to American operations:
Integration of traditional farming practices with modern efficiency technologies
Emphasis on family heritage and generational knowledge transfer
Premium pricing for farm-produced products sold directly to visitors
Seasonal programming that maintains visitor interest throughout the year
Critical differences favoring American operations:
Scale advantages allow for more impressive technological demonstrations
Superior infrastructure for accommodating larger visitor groups
Advanced automation technologies are not widely available in European small-scale operations
Stronger tradition of agricultural innovation and technology adoption
New Zealand Comparative Analysis
New Zealand’s dairy industry, despite its global reputation for grass-fed production, has limited agritourism development due to remote locations and a focus on export markets. This creates opportunities for American operations to capture tourism demand that international competitors cannot serve.
American competitive advantages:
Proximity to major population centers enables day-trip and weekend tourism
Diverse agricultural systems showcase different approaches to dairy production
Integration of crop and livestock operations, providing comprehensive agricultural education
Technology adoption rates that exceed most international competitors
Risk Management: Protecting Both Revenue Streams
Managing agritourism risk parallels transition period management, as careful monitoring and a rapid response to deviations prevent problems from escalating. Successful operations implement comprehensive protocols protecting both milk production and visitor safety.
Insurance and Liability Considerations
Agritourism liability insurance typically costs $1,000-$ 3,000 annually for mid-scale operations, representing less than 0.15% of gross milk revenue for a 377-cow farm. This investment provides essential protection while enabling revenue diversification that reduces overall business risk.
University research on agritourism development emphasizes that proper insurance coverage and safety protocols are essential for sustainable visitor programs, but the risk-to-reward ratio heavily favors farms that implement structured agritourism activities.
Production Continuity During Visitor Activities
Design visitor programs like managing feed delivery schedules: essential operations continue without disruption while accommodating additional activities. Successful farms establish clear protocols that separate visitor areas from active production zones while maintaining high biosecurity standards.
The key insight is that visitor programs that complement rather than interfere with production schedules create win-win scenarios, where guests observe authentic agricultural operations while farms maintain efficiency and high animal welfare standards.
Designated visitor pathways prevent cross-contamination between visitor areas and production zones
Hand sanitizing stations are strategically placed for both visitor convenience and biosecurity compliance
Educational signage explaining biosecurity importance and modern food safety protocols
Restricted access to sensitive areas (maternity pens, hospital groups, feed storage) with clear explanations of protective measures
Your July 4th Action Plan: Implementation Roadmap
The difference between farms that generate substantial agritourism revenue and those that don’t isn’t size, location, or capital—it’s taking focused action with clear implementation timelines. With July 4th, 2025, approaching, you have a perfect opportunity to begin building the community connections and revenue streams that will strengthen your operation’s financial resilience.
Immediate Assessment (This Week)
Drive past your operation as a first-time visitor would. What impression does it create? Are your values visible? Does your facility tell a story about American agricultural excellence? Document everything with photos and an honest assessment of your current community visibility.
Contact your local USDA NASS office to understand agritourism data collection and reporting requirements. Many farms underreport agritourism activities, missing opportunities for industry recognition and grant funding.
Research your insurance requirements immediately. Contact your carrier to understand liability coverage for farm tours, events, and direct sales activities. This conversation should occur before July 4th, as insurance modifications often require lead time.
July 4th Weekend Strategy
Create patriotic displays that showcase your values while highlighting your production excellence. Even basic round bale art, which costs less than $100 in materials, generates significant community engagement and social media visibility.
Plan simple farm tours that highlight your technology adoption and animal welfare practices. Focus on educational content that visitors cannot experience elsewhere, such as robotic milking demonstrations, feed quality testing, or component analysis that explains why American milk commands premium prices globally.
Establish direct sales opportunities during the July 4th activities. When visitors see your animals, meet your family, and understand your production practices, they’re willing to pay premium prices for products with clear provenance and authentic stories.
Fall Implementation Planning
Evaluate permanent infrastructure improvements that support both production efficiency and visitor experiences. Consider investments such as visitor viewing areas, educational displays, or retail spaces that serve dual purposes.
Develop relationships with local schools, civic organizations, and veteran groups to build partnerships that support your agritourism activities. These connections provide built-in audiences while demonstrating community engagement that enhances your operation’s reputation.
Your technical capabilities tell a compelling story that visitors cannot experience elsewhere. Whether explaining how 4.24% butterfat content and 3.29% protein levels create superior cheese-making properties or demonstrating how robotic milking systems improve both efficiency and animal welfare, your operation showcases American agricultural leadership in ways that generate both pride and profit.
Peer-reviewed research confirms what successful producers already understand: farms that excel at both production efficiency and community engagement build resilient businesses that thrive regardless of commodity market conditions. While competitors focus exclusively on cost reduction, you’ll be building brand equity and customer relationships that command premium pricing and provide long-term stability.
But remember the sobering lesson from Connecticut: agritourism success requires meticulous planning, comprehensive insurance, and unwavering commitment to visitor safety. The farms that thrive are those that treat agritourism as seriously as they treat milk production—with detailed protocols, clear objectives, and continuous performance monitoring.
This July 4th, will you continue fighting for pennies in commodity markets, or will you start building the sustainable competitive advantages that ensure your operation’s future? The choice is yours, but the window for establishing market position ahead of competitors is narrowing rapidly.
Your immediate action step: Before the July 4th weekend, create one patriotic display that represents your farm’s values, invite five local families to visit your operation, and document their experience for social media sharing. This single action will position you ahead of 90% of dairy operations that never take the first step toward sustainable revenue diversification.
The most successful dairy operations of the next decade will excel at both production efficiency and community engagement. Which category will your operation represent—the innovators capturing agritourism revenue while maintaining production excellence, or the commodity producers watching opportunities pass by? The choice is yours, and July 4th, 2025, is your perfect opportunity to begin building the future your operation deserves.
Key Takeaways
Technology Liberation Strategy: Robotic milking systems reduce labor requirements by 21% while increasing milk yields up to 15%, freeing 4-5 hours daily for high-value visitor experiences that can generate $75,000-200,000 annually for 377-cow operations
Component Premium Marketing: Superior butterfat levels (4.24% vs. industry average) and protein content (3.29%) create compelling educational content that justifies premium direct-sales pricing—visitors pay $6.50/gallon vs. $2.10/gallon processor equivalent
Regional ROI Optimization: Implementation costs vary dramatically by location ($10,000-35,000 initial investment), with Midwest operations achieving profitability in 12-18 months compared to 24-30 months on the West Coast, but premium pricing potential offsets higher costs
Patriotic Display Multiplication Effect: Basic round bale art costing $50-100 in materials generates exponential returns through social media engagement, community goodwill, and visitor attraction, transforming commodity milk into branded products with authentic provenance stories
Risk-Adjusted Diversification: Agritourism liability insurance ($1,000-3,000 annually) represents less than 0.15% of gross milk revenue for mid-scale operations while providing crucial protection for revenue streams completely independent of Federal Milk Marketing Order volatility
Executive Summary
The dairy industry’s obsession with pure production efficiency is leaving massive revenue streams untapped while operators struggle with commodity price volatility. Research shows that while producers fight for pennies per hundredweight at $21.00/cwt, America’s smartest dairy operations quietly generated $1.26 billion in agritourism revenue in 2024, with individual farms capturing $25,000 to $300,000 annually in diversified income streams. Technology investments, such as robotic milking systems, that reduce labor costs by 21%, actually enable rather than compete with community engagement activities, freeing up 4-5 hours daily for premium revenue generation through farm tours and direct sales. With USDA forecasting 25% higher dairy farm income, averaging $743,900 in 2025, this represents the perfect financial foundation for diversification investments that insulate operations from market volatility. Austrian dairy regions demonstrate that agritourism accounts for 58% of the agricultural production value for family operations competing against industrial producers, whereas American farms possess superior scale and technological advantages that international competitors cannot match. Your July 4th patriotic displays could be the $50 investment that transforms your commodity operation into a premium-branded destination generating six-figure supplemental revenue.
Complete references and supporting documentation are available upon request by contacting the editorial team at editor@thebullvine.com.
Join over 30,000 successful dairy professionals who rely on Bullvine Weekly for their competitive edge. Delivered directly to your inbox each week, our exclusive industry insights help you make smarter decisions while saving precious hours every week. Never miss critical updates on milk production trends, breakthrough technologies, and profit-boosting strategies that top producers are already implementing. Subscribe now to transform your dairy operation’s efficiency and profitability—your future success is just one click away.
The egg price collapse just exposed a dangerous vulnerability in dairy markets. Are you prepared for when milk hits consumer price resistance? Act now.
EXECUTIVE SUMMARY: The recent 48% collapse in egg prices within a matter of weeks provides dairy farmers with a critical warning about consumer price thresholds and market volatility that could soon impact milk markets with similar force. As documented by USDA data, the egg price correction occurred when consumers collectively reached their resistance point – despite being a kitchen staple with few direct substitutes – mirroring the same perishability and production inflexibility challenges faced by dairy operations. While alternative protein technologies accelerate toward price parity and USDA forecasts already show troubling signs for milk prices, forward-thinking dairy operations must implement four defensive strategies: price sensitivity detection systems, strategic product diversification, flexibility-focused technology investments, and value creation beyond price points. The operations that will survive aren’t just those with the lowest production costs, but those with the agility to navigate increasingly volatile market conditions through proactive risk management and diversified revenue streams.
KEY TAKEAWAYS
Regional vulnerability varies significantly – California operations face the highest risk (4.6/5) due to extreme alternative protein competition and high consumer price sensitivity, while Upper Midwest producers enjoy greater protection (3.0/5) from established production infrastructure.
Price sensitivity monitoring provides early warning signals – Farms implementing systematic price threshold detection report 23% better margin management during volatile market conditions, with five specific warning signs to monitor.
Strategic diversification requires a two-dimensional approach – The most resilient operations maintain presence across both processing depth (primary through quaternary products) and market channel diversity, with diversified farms experiencing 34% less revenue volatility during market disruptions.
Technology investments should prioritize flexibility over efficiency – Operations should focus on technologies scoring 7+ on the Market Volatility Protection Scale, with precision feeding systems (8/10) and herd management software (8/10) offering the best defense against market shocks.
Consumer resistance can trigger market collapse despite production fundamentals – The egg market demonstrated that when prices exceed perceived value thresholds, demand doesn’t gradually adjust—it collapses rapidly, regardless of underlying production costs or seasonal factors.
The recent 48% nosedive in egg prices documented by USDA’s Egg Markets Overview offers dairy producers an urgent warning about consumer price thresholds. With dairy economists at Cornell University’s PRO-DAIRY program and the University of Wisconsin-Madison’s Center for Dairy Profitability expressing concern about similar vulnerabilities in milk markets, your operation needs immediate protection strategies before consumer resistance triggers comparable price corrections in dairy products.
“The egg market just demonstrated how brutally fast consumers react when prices exceed perceived value – dairy farmers who ignore this warning are playing Russian roulette with their operations.”
The 48-Hour Market Meltdown Every Dairy Farmer Needs to Understand
Let’s cut through the noise and examine what happened in the egg market. USDA data confirms a price correction that shattered all previous records. After reaching an unprecedented peak of $8.05 per dozen in late February, wholesale egg prices collapsed to $4.15 – a stunning 48% drop that occurred faster than anyone predicted (USDA Egg Markets Overview, March 2025).
This wasn’t some gradual market adjustment. It was a cliff-edge collapse triggered when consumers collectively hit their price resistance threshold and stopped buying. As the USDA’s report explicitly states, there was a “sharp decline in consumer demand” as prices surged beyond what households would pay. This consumer revolt happened despite eggs being a kitchen staple with few direct substitutes.
This represents the most critical market signal for your dairy operation in 2025. Both eggs and dairy share the same fundamental vulnerability – they’re highly perishable products with relatively inflexible production cycles. Once your cows are producing, you can’t simply turn off the tap when prices tank. When consumers reach their price resistance threshold, demand doesn’t just soften – it collapses entirely.
“When consumers hit their resistance threshold, the market doesn’t gradually adjust – it collapses. Eggs dropped 48% in weeks, and dairy has the same vulnerability.”
Why Your Farm’s Vulnerability Score Just Increased
This market event is hazardous for dairy producers because it contradicts conventional wisdom. The initial spike in egg prices was blamed on avian influenza’s impact on supply – just as many dairy price increases have been attributed to feed costs, labor shortages, or energy prices. Yet the USDA analysis makes clear that while supply challenges initiated the price rise, consumer resistance ultimately forced the correction, regardless of production costs.
It’s worth noting that not all dairy economists share the same level of concern. Dr. Mark Stephenson from the University of Wisconsin Center for Dairy Profitability points out that “dairy products have historically demonstrated somewhat different price elasticity patterns than eggs” (Dairy Herd Management, February 2025). While acknowledging the warning signs, he suggests dairy’s diverse product portfolio provides some buffer against a singular price collapse.
The egg price collapse timeline offers critical intelligence about how quickly markets can turn:
Late February 2025: Egg prices peak at $8.05 wholesale
Early March: USDA reports “sharp decline in consumer demand” as shoppers reject high prices
March 12: Trading Economics reports a 33% price drop to $5.51
March 17: USDA confirms further drops to $4.15 wholesale
Particularly concerning is that this collapse occurred despite the approaching high-demand holidays – Easter and Passover. The traditional seasonal uplift in demand wasn’t enough to counteract consumer resistance.
“Easter demand couldn’t save egg producers once consumers changed buying habits. Seasonal patterns won’t protect your dairy operation either.”
The Alternative Protein Acceleration Is Happening Now
While the egg price crash offers an immediate warning, dairy farmers must simultaneously confront the accelerating timeline for alternative protein technologies. Research from Boston Consulting Group and Blue Horizon Corporation published in the Journal of Agricultural and Food Chemistry provides a clear roadmap for approaching competitive threats:
Plant-based alternatives (including dairy substitutes): Price parity by 2023 or sooner
Microorganism-derived proteins (fungi, yeast, algae): Price parity by 2025
Cultured proteins (precision fermentation): Price parity by 2032
This timeline has profound implications for your operation. Consumer price sensitivity creates vulnerability exactly when alternative products are becoming cost-competitive. When traditional dairy products exceed price thresholds, consumers don’t just complain – they permanently change their purchasing behavior.
“Precision fermentation isn’t creating imitations – it’s producing identical dairy proteins without cows. This isn’t a distant threat; it’s arriving now.”
Why This Technology Shift Is Different From Previous Alternatives
The most significant revelation from recent research published in the International Dairy Journal is that precision fermentation isn’t creating mere imitations – it’s producing identical dairy proteins without cows. As documented in a 2024 study in the Journal of Dairy Science, companies can now produce pure single proteins like β-lactoglobulin (the major whey protein) or specific types of casein with functionality indistinguishable from conventional dairy proteins.
This marks a fundamental shift from previous plant-based alternatives that struggled to match dairy’s functional properties. The precision fermentation approach doesn’t just approximate dairy – it recreates its essential components molecule by molecule. This technical reality challenges the assumption that alternatives will always be inferior substitutes.
However, it’s important to note that the American Dairy Science Association’s position paper on alternative proteins (March 2024) highlights several advantages traditional dairy still maintains: “The complex nutritional profile of milk, containing hundreds of bioactive components beyond just proteins, remains difficult to replicate through precision fermentation approaches.” This suggests dairy’s complete nutritional package may continue providing competitive advantages even as protein alternatives advance.
Regional Vulnerability Analysis: Is Your Operation in the Danger Zone?
Not all dairy operations face equal risk from these converging market forces. Based on a comprehensive analysis of production systems, market proximity, and alternative protein penetration, here’s a detailed regional assessment of which operations face the most significant risk:
U.S. Regional Vulnerability Index
Region
Price Sensitivity Risk
Alternative Protein Competition
Input Cost Pressure
Overall Vulnerability Score
California
Very High (4.7/5)
Extreme (4.9/5)
High (4.2/5)
4.6/5
Wisconsin
Moderate (3.2/5)
Medium (3.0/5)
Moderate (3.1/5)
3.1/5
Northeast
High (4.3/5)
High (4.1/5)
Very High (4.5/5)
4.3/5
Upper Midwest
Moderate (3.3/5)
Low-Medium (2.8/5)
Moderate (3.0/5)
3.0/5
Southeast
Medium-High (3.7/5)
Medium (3.2/5)
High (4.0/5)
3.6/5
Southwest
High (4.0/5)
Medium-High (3.6/5)
Very High (4.6/5)
4.1/5
Source: Analysis based on USDA dairy production data, regional consumer price elasticity studies (Cornell University), and alternative protein market penetration data (Journal of Dairy Science, 2024)
This regional analysis reveals that California operations face the highest combined risk due to proximity to alternative protein innovation hubs and extremely price-sensitive urban markets. Producers in the Upper Midwest enjoy the most excellent protection thanks to established domestic production infrastructure and relatively lower exposure to alternative protein competition.
Dairy Markets Are Already Showing Warning Signs
If you think this market vulnerability is merely theoretical, the USDA’s forecasts tell a different story:
This downward revision comes despite continued production cost pressures – mirroring precisely what happened in the egg market before its collapse. When combined with the latest USDA Dairy Product Price Forecast changes, the pattern becomes even more concerning:
Dairy Product
January 2025 Forecast
February 2025 Forecast
Change
Cheese (per lb)
$1.8000
$1.8650
+$0.0650
Butter (per lb)
$2.6850
$2.6950
+$0.0100
Nonfat Dry Milk (per lb)
$1.3000
$1.3400
+$0.0400
Dry Whey (per lb)
$0.5950
$0.6400
+$0.0450
All Milk Price (per cwt)
$22.55
$23.05
+$0.50
Source: USDA Dairy Market News, Agricultural Marketing Service (February 2025)
The volatility in these forecasts—several significant upward revisions followed by a sudden downward adjustment—suggests a market approaching its price resistance threshold. The question isn’t if dairy will experience consumer pushback but when and how severely.
Vulnerability Self-Assessment Tool: How Exposed Is Your Operation?
Take this quick assessment to gauge your operation’s vulnerability to market volatility:
What percentage of your milk goes to a single product category?
0-25%: Low Risk (1 point)
26-50%: Moderate Risk (2 points)
51-75%: High Risk (3 points)
76-100%: Very High Risk (4 points)
How many distinct market channels does your milk reach?
4+ channels: Low Risk (1 point)
3 channels: Moderate Risk (2 points)
2 channels: High Risk (3 points)
1 channel: Very High Risk (4 points)
What’s your current debt-to-asset ratio?
Under 30%: Low Risk (1 point)
30-40%: Moderate Risk (2 points)
40-50%: High Risk (3 points)
Over 50%: Very High Risk (4 points)
How much have your production costs increased in the past 12 months?
0-5%: Low Risk (1 point)
6-10%: Moderate Risk (2 points)
11-15%: High Risk (3 points)
Over 15%: Very High Risk (4 points)
What percentage of your income comes from value-added or premium products?
Your Farm’s Survival Guide: Four Defense Strategies
The egg price collapse and accelerating alternative protein timeline demand immediate action. Here are concrete steps that incorporate both immediate and long-term protections, developed in consultation with dairy economists from Cornell University and agricultural economists at the University of Wisconsin-Madison:
1. Implement a Price Sensitivity Detection System
Don’t wait for a market collapse to learn your customers’ price thresholds. Establish a systematic approach:
For Direct-Market Farms:
Test different price points across your product range simultaneously
Introduce limited-time price increases on specific products and track volume changes
Survey customers directly about price sensitivity using specific dollar thresholds
Track substitution patterns when prices increase (which products do customers switch to?)
For Wholesale Producers:
Request retail velocity data from processor partners at different price points
Analyze seasonal price variations against volume to identify resistance thresholds
Collaborate with processors on consumer research specific to your regional market
Monitor alternative product pricing and sales in your key markets
Research from Penn State Extension’s dairy marketing program validates this approach, showing that “farms with established price sensitivity monitoring report 23% better margin management during volatile market conditions” (Penn State Dairy Outlook, January 2025).
2. Diversify Beyond Traditional Product Lines
Strategic diversification requires more than just making different dairy products. Cornell University’s PRO-DAIRY program recommends evaluating opportunities across these categories:
Processing Depth:
Primary (fluid milk, cream)
Secondary (yogurt, fresh cheese)
Tertiary (aged cheese, specialty butter)
Quaternary (value-added specialty products)
Market Channel Diversity:
Commodity wholesale
Specialty wholesale
Direct-to-consumer
Foodservice partnerships
Export markets
The most resilient operations maintain a presence in at least three categories from each dimension, creating a diversification grid that spreads risk across multiple product types and market channels. According to a 2024 Journal of Dairy Science study, “operations with diversified product portfolios experienced 34% less revenue volatility during market disruptions than single-product enterprises.”
3. Prioritize Technology That Creates Market Flexibility
“Not all technology investments deliver equal protection against market volatility. The farms that survive will strategically prioritize flexibility over mere efficiency.”
Technology Type
Initial Cost
Implementation Time
Cost Reduction Potential
Flexibility Value
Market Volatility Protection Score
Precision feeding systems
Moderate
Short
High
High
8/10
Robotic milking
Very High
Long
Moderate
Moderate
5/10
Milk processing equipment
High
Moderate
Varies
High
7/10
Herd management software
Low
Short
Moderate
High
8/10
Renewable energy systems
High
Moderate
High
Low
6/10
Source: University of Wisconsin-Madison Dairy Innovation Hub, Technology Assessment Report (2024)
The Market Volatility Protection Score weighs these factors to identify technologies that create maximum flexibility with reasonable implementation timelines. Research from the Journal of Dairy Science indicates farms should prioritize investments that score seven or higher to build resilience against market shocks.
It’s worth noting that the National Milk Producers Federation takes a somewhat different view, emphasizing that “while technology adoption is important, market coordination and policy frameworks ultimately provide more stable protection against extreme volatility” (NMPF Market Report, January 2025). This perspective suggests a balanced approach combining operational flexibility with industry-level coordination.
4. Build Value Beyond Price Points
The Canadian dairy system offers important lessons about creating value that transcends price sensitivity. U.S. producers can extract valuable insights without adopting their entire regulatory framework:
Elements Worth Implementing:
Consistent quality standards that exceed minimum requirements
Producer coordination on supply management (where legally permissible)
Value-added product development with protected market positioning
Brand development that creates consumer loyalty beyond the price
Pitfalls to Avoid:
Resisting innovation and market evolution
Allowing protected status to create complacency
Over-reliance on regulatory protection rather than market responsiveness
Failure to communicate value proposition to consumers
Five Warning Signs Your Milk Price Is Approaching Consumer Resistance
Increasing Retail-to-Farm Price Spread – When processors and retailers take larger margins, it often indicates they absorb price resistance before it reaches producers.
Rising Inventory Levels – Unexplained increases in cheese or butter inventories may signal slowing consumer purchases.
Private Label Market Share Growth – Consumers shifting to store brands indicates price sensitivity
Declining Purchase Frequency – When consumers stretch time between purchases, they signal price resistance.
Substitution Within Dairy Categories – Movement from specialty cheeses to commodity options or from organic to conventional signals consumers are reaching price limits
Source: Cornell University PRO-DAIRY, Consumer Behavior Analysis (2024)
Case Study: Resilience Through Diversification
Maplewood Dairy in Vermont demonstrates how effective diversification can buffer against market volatility. After experiencing severe financial pressure during the 2020 pandemic milk price collapse, the 180-cow operation implemented a three-phase diversification strategy:
Initial Processing Pivot: Invested in small-scale on-farm processing to produce farmstead cheese using 25% of milk production
Market Channel Expansion: Established relationships with three regional food cooperatives and developed direct-to-consumer online presence
Brand Differentiation: Created premium positioning through pasture-raised certification and transparent sustainability practices
According to Progressive Dairy’s profile of the operation (January 2025), “When conventional milk prices declined 17% in fall 2024, Maplewood’s diversified revenue streams limited their overall revenue impact to just 6%.” The operation’s owner reports that “price sensitivity monitoring across different channels provides early warning signals that allow us to adjust procurement and production plans before market corrections fully materialize.”
The Bottom Line
The egg market collapse isn’t just a cautionary tale – it’s a preview of dynamics that could soon impact your dairy operation with even greater force. The data is unequivocal: wholesale egg prices plummeted 48% when consumers hit their resistance threshold despite upcoming seasonal demand drivers.
Simultaneously, the alternative protein sector is accelerating faster than previously projected. With plant-based alternatives already reaching price parity and precision fermentation technologies advancing rapidly, the competitive landscape is shifting beneath our feet. The farms that will thrive through this transformation will be those that proactively implement price sensitivity intelligence, strategic diversification, and technology investments focused on flexibility.
The writing is on the wall. The question isn’t whether dairy markets will face similar pressures that collapsed egg prices – it’s whether your operation has implemented the necessary protocols to weather the coming storm. The time to act isn’t when prices are falling – it’s now while there’s still room to maneuver.
Join over 30,000 successful dairy professionals who rely on Bullvine Daily for their competitive edge. Delivered directly to your inbox each week, our exclusive industry insights help you make smarter decisions while saving precious hours every week. Never miss critical updates on milk production trends, breakthrough technologies, and profit-boosting strategies that top producers are already implementing. Subscribe now to transform your dairy operation’s efficiency and profitability—your future success is just one click away.
To provide the best experiences, we use technologies like cookies to store and/or access device information. Consenting to these technologies will allow us to process data such as browsing behavior or unique IDs on this site. Not consenting or withdrawing consent, may adversely affect certain features and functions.
Functional
Always active
The technical storage or access is strictly necessary for the legitimate purpose of enabling the use of a specific service explicitly requested by the subscriber or user, or for the sole purpose of carrying out the transmission of a communication over an electronic communications network.
Preferences
The technical storage or access is necessary for the legitimate purpose of storing preferences that are not requested by the subscriber or user.
Statistics
The technical storage or access that is used exclusively for statistical purposes.The technical storage or access that is used exclusively for anonymous statistical purposes. Without a subpoena, voluntary compliance on the part of your Internet Service Provider, or additional records from a third party, information stored or retrieved for this purpose alone cannot usually be used to identify you.
Marketing
The technical storage or access is required to create user profiles to send advertising, or to track the user on a website or across several websites for similar marketing purposes.
To provide the best experiences, we and our partners use technologies like cookies to store and/or access device information. Consenting to these technologies will allow us and our partners to process personal data such as browsing behavior or unique IDs on this site and show (non-) personalized ads. Not consenting or withdrawing consent, may adversely affect certain features and functions.
Click below to consent to the above or make granular choices. Your choices will be applied to this site only. You can change your settings at any time, including withdrawing your consent, by using the toggles on the Cookie Policy, or by clicking on the manage consent button at the bottom of the screen.
Functional
Always active
The technical storage or access is strictly necessary for the legitimate purpose of enabling the use of a specific service explicitly requested by the subscriber or user, or for the sole purpose of carrying out the transmission of a communication over an electronic communications network.
Preferences
The technical storage or access is necessary for the legitimate purpose of storing preferences that are not requested by the subscriber or user.
Statistics
The technical storage or access that is used exclusively for statistical purposes.The technical storage or access that is used exclusively for anonymous statistical purposes. Without a subpoena, voluntary compliance on the part of your Internet Service Provider, or additional records from a third party, information stored or retrieved for this purpose alone cannot usually be used to identify you.
Marketing
The technical storage or access is required to create user profiles to send advertising, or to track the user on a website or across several websites for similar marketing purposes.


 Join the Revolution!
 Join the Revolution!