Archive for dairy efficiency

H5N1 and Raw Milk Cheese: What the Science Actually Shows About Risk, Testing, and Your Operation

New research reveals surprising gaps between laboratory findings and real-world data, offering practical insights for navigating regulatory requirements while managing actual contamination risks

Executive Summary: The disconnect between H5N1 lab research and marketplace reality is costing cheese producers millions in unnecessary recalls. While Cornell’s October study found the virus can survive 120 days in experimental cheese, the same researchers discovered ferrets eating that cheese didn’t get infected—and FDA surveillance detected zero viable virus in 110+ retail cheese samples nationwide. The culprit? PCR testing that can’t distinguish between infectious virus and harmless RNA fragments, yet triggers $10+ million recall costs when it finds genetic debris. Wisconsin’s 19,000 milk samples with zero detections prove systematic surveillance works, but California’s 233 affected herds show real risk exists regionally. Smart risk management means sourcing from tested negative herds, considering pH optimization for natural protection, and avoiding voluntary testing that creates massive liability for what marketplace data suggests is minimal actual risk.

dairy profitability

You know how sometimes the headlines tell one story, but when you dig into the actual numbers, you find something entirely different? That’s exactly what’s been happening with H5N1 in cheese.

I was talking with a group of producers the other day, and one of them said something that really stuck with me: “The lab research had us all worried, but our test results keep coming back clean. What’s going on here?” It’s a fair question—and as it turns out, there’s a fascinating answer emerging from the data.

Here’s what’s interesting: We’re now at 442 affected dairy herds nationwide, according to USDA’s latest October count, with California bearing the brunt at 233 farms. Those are real numbers. But for those of us in the cheese business—especially raw milk cheese—the story gets more complex when you compare what laboratory experiments suggest could happen versus what’s actually showing up in marketplace testing.

What Cornell’s Research Really Found

So the Cornell team got this $1.15 million FDA grant last July to figure out if H5N1 could survive cheese aging. Makes sense, right? Their work, which appeared in Nature Medicine this October, involved making these tiny experimental cheeses—about 5 grams each—using milk deliberately spiked with a lab-grown virus.

Cornell’s research reveals a game-changing insight: acidification to pH 5.0 eliminates viable virus entirely. Your feta, chèvre, and fresh cheeses naturally provide protection through their production process—no additional intervention needed. Smart producers are already shifting product mix toward naturally protective varieties

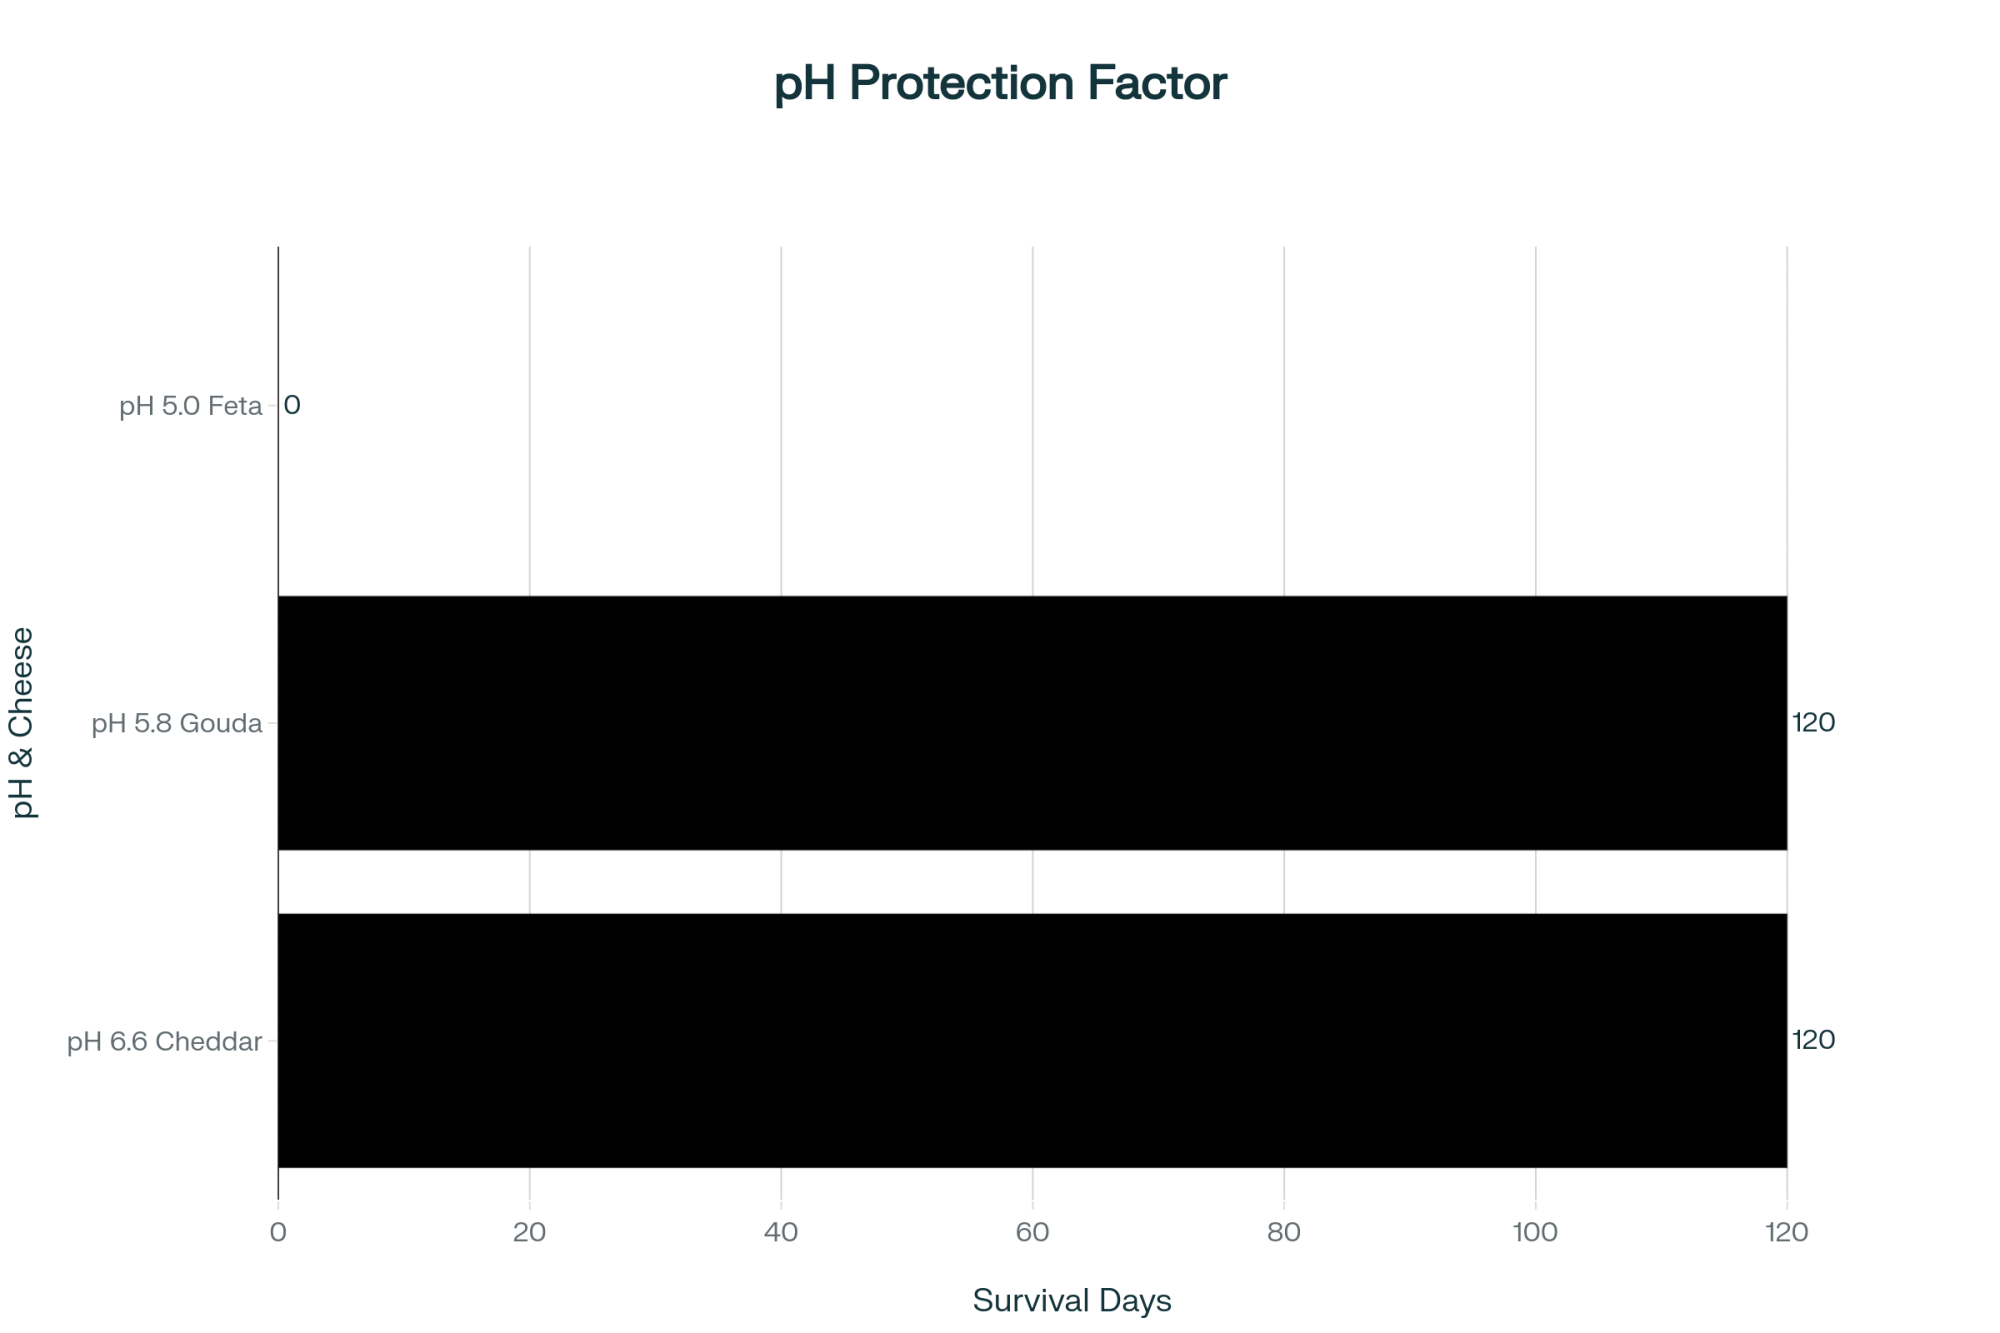
Here’s where it gets interesting, though. They tested three different pH levels, and the results were pretty clear-cut. At pH 6.6 and 5.8—that’s your typical aged cheddar or gouda range—the virus did persist through 120 days of aging. But at pH 5.0? Nothing. No viable virus at all. And you know what runs at pH 5.0? Your feta, your chèvre, most of your fresh cheeses.

But wait, it gets better. When the full paper came out (not just the preprint), it revealed something crucial: they fed this contaminated cheese to ferrets. Now, if you don’t know, ferrets are basically the canary in the coal mine for flu research—they’re incredibly susceptible. And guess what? Not a single ferret got infected from eating the cheese. Not one.

Meanwhile, some ferrets drinking contaminated raw milk did get sick. The researchers think—and this makes sense when you think about it—that the solid structure of cheese might trap the virus differently than liquid milk, where it’s just floating around freely. In cheese, you’ve got this protein matrix, salt everywhere, enzymes breaking things down… it’s actually a pretty hostile environment, even if the virus technically survives.

Understanding the Testing Game: PCR vs. Viability

What I’ve found is that most producers don’t really understand the difference between PCR testing and viability testing—and honestly, why would you? But it matters enormously.

FDA’s own data exposes the PCR paradox: 17% of samples test positive for viral RNA, but viability testing reveals zero infectious virus in 110+ retail cheese samples. This gap between detection and actual risk is costing producers millions in unnecessary recalls

Quick Reference: Testing Types and What They Mean

PCR Testing:

  • Detects as few as 5-10 viral RNA copies per microliter
  • Results in 3-7 days
  • Can’t distinguish between live and dead virus
  • Like finding footprints—proves something was there, not that it’s still dangerous

Viability Testing:

  • Uses egg inoculation to grow the virus
  • Takes up to 30 days for results
  • Confirms if the virus can actually cause infection
  • The only way to know if there’s a real risk

PCR is incredibly sensitive. According to research published in the Journal of Virological Methods this September, we’re talking about detecting as few as 5 to 10 copies of viral RNA per microliter. That’s… well, that’s basically nothing. It’s like being able to find a single grain of salt in a swimming pool.

But here’s the thing—and this is crucial—PCR can’t tell you if what it’s finding is alive or dead. It’s just finding genetic material. Think of it like finding footprints in your barn. Those footprints tell you something was there, but they don’t tell you when, or if it’s still around, or if it was even a threat to begin with.

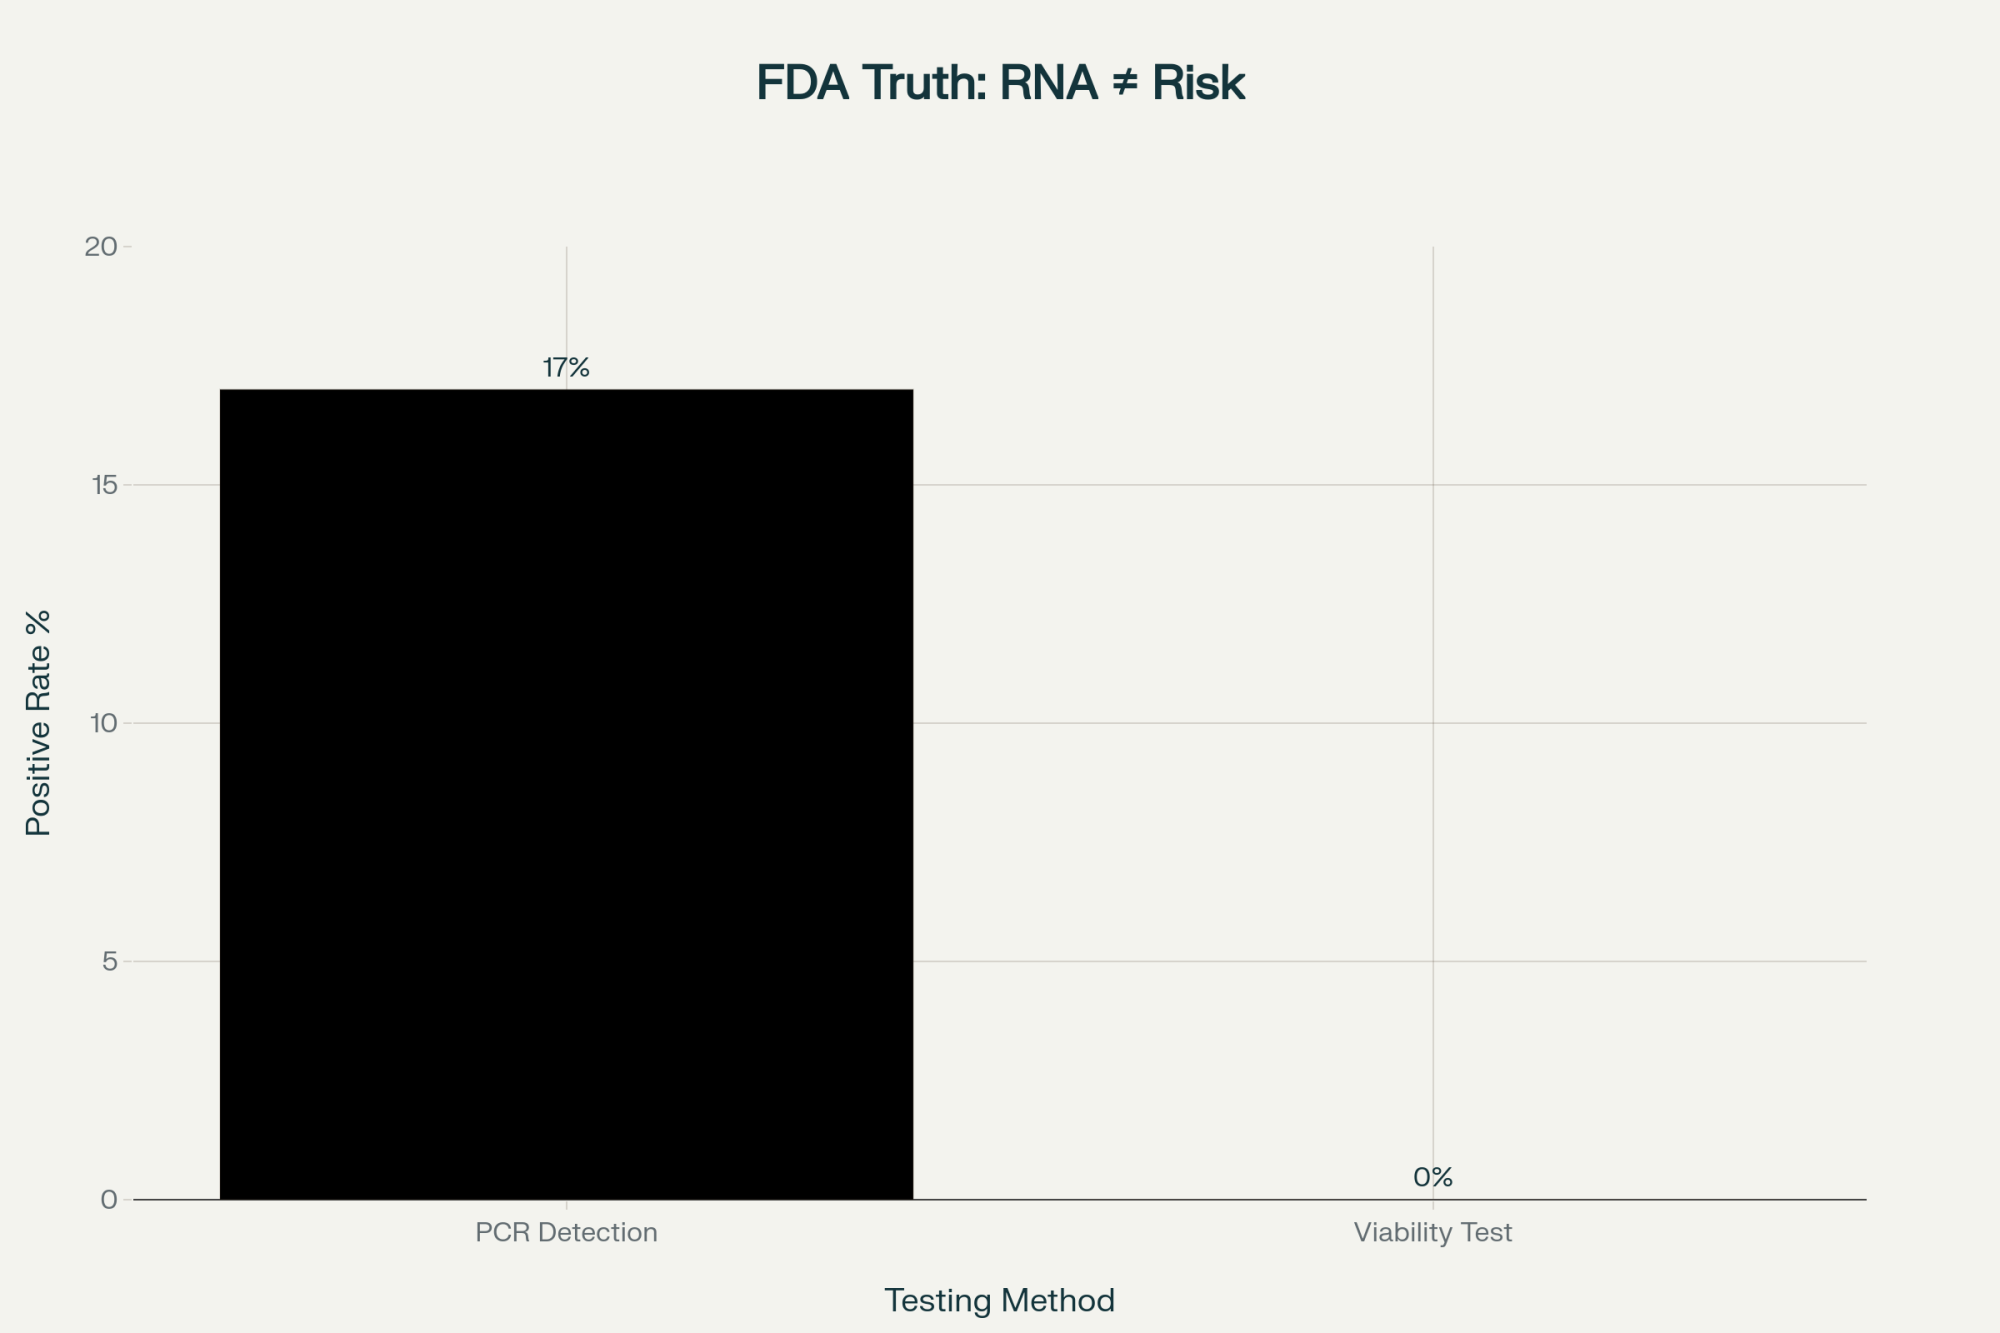
Now, the FDA has been running this massive surveillance program, and its March update revealed something really eye-opening. They found viral RNA fragments in about 17% of some dairy products they tested. Sounds scary, right? But then they took those same positive samples and did viability testing—that’s where you actually try to grow the virus in chicken eggs to see if it’s infectious—and every single sample came back negative. Every one. No viable virus.

Why does this matter? Well, Food Safety Magazine’s analysis puts the average food recall at over $10 million in direct costs alone. So if you’re destroying product based on PCR positives that turn out to be just RNA fragments… you can see the problem.

State Strategies: From Wisconsin’s Testing Blitz to California’s Realities

California’s dairy outbreak concentration reveals why risk management strategies must be regional, not national. While California battles 233 affected herds, Wisconsin’s 19,000 tested samples show zero detections—proving surveillance works and geography matters more than headlines suggest

What’s fascinating to me is how differently states are handling this. Wisconsin—and you’ve got to hand it to them—they’ve gone all-in on testing. They’re processing over 5,000 milk samples every month through their state lab. The result? As of October, they’ve tested more than 19,000 samples with zero H5N1 detections. Zero. That’s not luck, that’s systematic surveillance working.

Pennsylvania took a more measured approach. Their State Veterinarian, Dr. Hamberg, caught some flak back in March when he basically said, “Let’s wait for the full peer-reviewed study before we panic.” Looking back now? Smart move. Pennsylvania has maintained what USDA calls Stage 4 status—that is, no H5N1 present—with over 100 dairy herds. They’re actually the only state with that many herds to achieve that status.

Then there’s California. Different story entirely. With 233 of the 442 affected herds nationally—we’re talking over half the outbreak—they’re dealing with real contamination. I was talking with a Central Valley producer recently who put it this way: “We’re not worried about theoretical risk here. We’ve got affected herds all around us. Our testing is about survival, not compliance.”

And what about operations in the Southeast or Mountain West? They’re watching all this unfold, implementing practical measures based on their regional risk. A Georgia operation I heard about is focusing testing at their processing facility rather than individual farms—makes sense given their smaller dairy sector and limited resources.

The Raw Farm Story: A Cautionary Tale

The Raw Farm situation from last November and December really shows how this all plays out in real time. Santa Clara County found influenza A virus through routine PCR testing on November 24th, right before Thanksgiving—couldn’t be worse timing. This triggered recalls of everything produced after November 9th.

Now here’s what’s important: Despite multiple PCR-positive results across different products, California’s health department confirmed on December 3rd that not a single person got sick. Not one. But the damage was done—holiday sales season shot, product destroyed, consumer confidence shaken.

While Raw Farm hasn’t released exact figures, industry standards indicate that recalls of this scope typically exceed $10 million in direct costs alone. That’s before you factor in lost sales, brand damage, all of that. And remember, this happened during the peak holiday season when specialty cheese sales traditionally surge.

The Economics Nobody Talks About

Let’s get real about the numbers here. Research from the Journal of Dairy Science shows that aging facility costs range from $0.25 to $0.27 per pound for the entire aging period. So if you’ve got 10,000 pounds aging for 120 days—pretty standard for a mid-sized operation—you’re looking at $90,000 to $130,000 in product value, plus another $10,000 or so in aging costs you’ve already paid.

Key Financial Considerations for Producers

  • Aging costs: $0.25-0.27 per pound for the entire aging period
  • Product Contamination Insurance: $1,000-$20,000 annually (varies by size)
  • Voluntary testing: $50-$150 per sample
  • Average recall cost: $10+ million in direct expenses
  • Viability testing wait: Up to 30 days (during which the product is quarantined)

And insurance? Don’t get me started. Agricultural insurance data shows that Product Contamination Insurance ranges from $1,000 to $20,000 a year, depending on your size. But—and this is the kicker—standard policies usually exclude most recall costs. You need special coverage, and good luck affording it after any claims.

What’s really tough is how this hits different sized operations. If you’re running 500 cows and making commodity cheese, you can spread these costs across volume. But if you’re a 50-cow farmstead operation? These compliance costs can wipe out your entire margin.

I’ve been hearing from a lot of smaller producers who are rethinking voluntary testing. University labs charge $50 to $150 per sample—seems reasonable, right? But if you test voluntarily and get a PCR-positive result —even if it’s just dead virus fragments —you’re often required to report it. That can trigger recalls before anyone even checks whether there’s an actual infectious virus. And that viability testing? Takes up to 30 days. By then, you’re already destroyed.

Some cooperatives are starting to pool resources for testing—spreading costs across multiple small operations. It’s one way smaller producers are adapting, though it’s not yet available everywhere. The Wisconsin Cheese Makers Association has been particularly active in helping members navigate these challenges—they’re a good resource if you’re looking for guidance.

What’s Actually Working Out There

So what approaches are proving effective? From what I’m seeing across the industry, a few things stand out.

First, source control is absolutely critical now. With the USDA’s National Milk Testing Strategy mandatory since December 6th, systematic bulk tank surveillance is underway. If you’re working exclusively with tested, negative herds, you’ve got documentation and significantly lower risk.

pH management is proving to be another practical tool. The Cornell findings that pH 5.0 is protective align with what many of us have long known about acidification. I know several Vermont operations that have shifted toward more acidic varieties—their chèvre naturally hits pH 4.6, which, according to this research, provides inherent protection through normal production.

But here’s something that might surprise you: voluntary finished product testing might actually increase your risk rather than reduce it. Legal guidance emerging in trade publications suggests really thinking twice before implementing voluntary testing unless customers demand it. The liability exposure from triggering costly recalls due to RNA fragments… it’s just not worth it for many operations.

The Market Reality

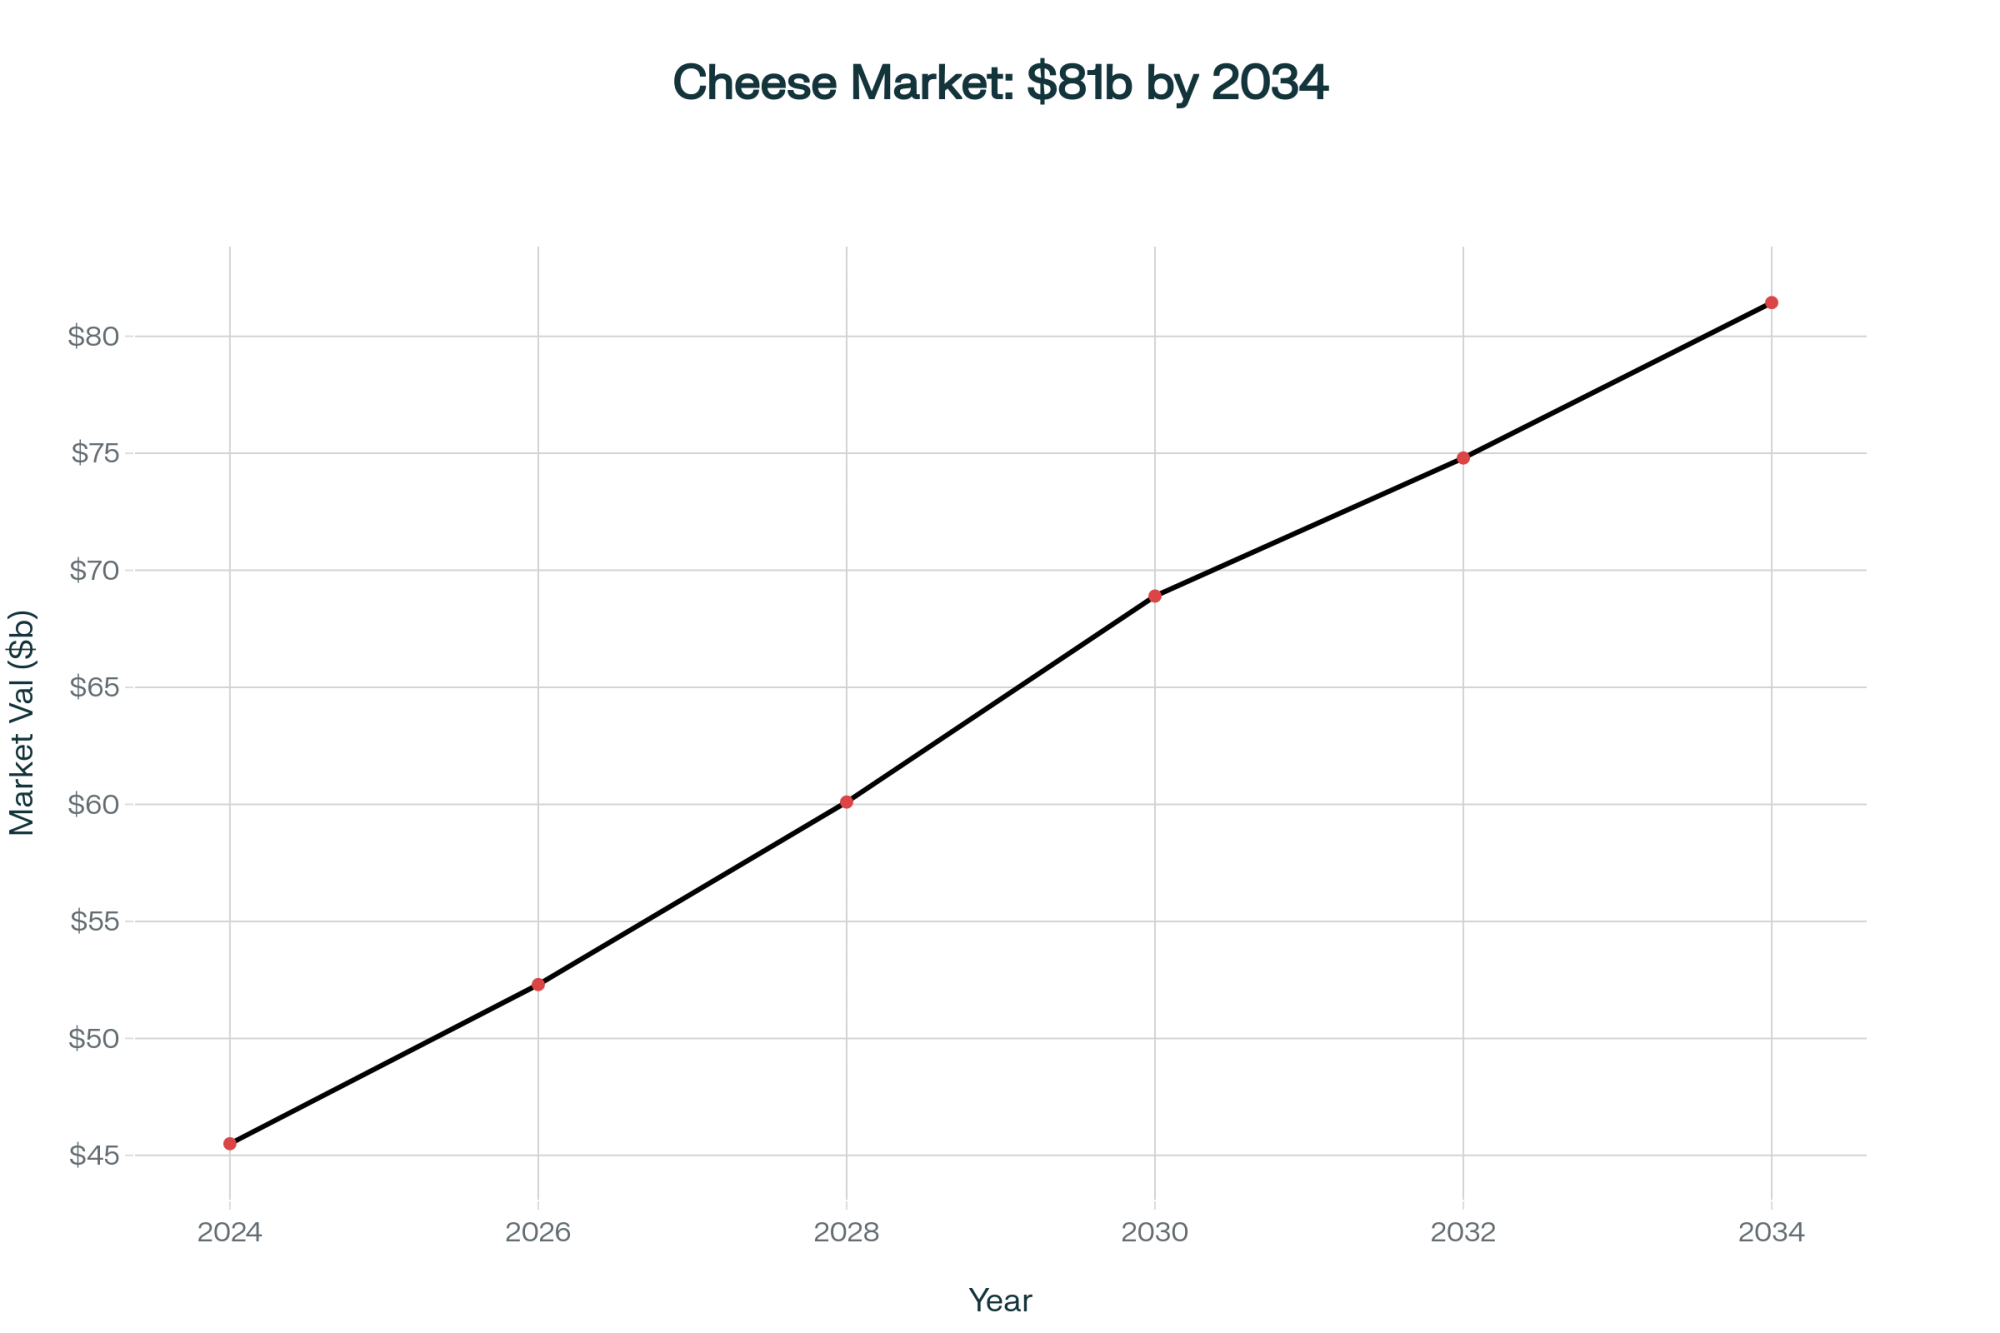
Here’s what’s encouraging: Grand View Research projects that the specialty cheese market will reach $81.44 billion by 2034. Consumer demand isn’t going away. University of Vermont research from this August shows buyers will still pay good premiums for local, artisanal, traditional methods.

But—and this is important—H5N1 testing as a marketing point doesn’t work. Trade publications have been reporting that producers who try advertising their H5N1 testing actually see sales drop. It introduces a concern customers hadn’t even considered. It’s like putting “arsenic-free” on bottled water—suddenly everyone’s worried about arsenic.

Despite H5N1 headlines, specialty cheese market projections remain bullish with $81.44 billion expected by 2034. Smart producers who master risk management today position themselves for tomorrow’s premium-paying consumers who still value traditional, artisanal methods

What Europe’s Doing Differently

The European approach is worth noting. Their Food Safety Authority concluded in June that H5N1 trade risks are, quote, “a lesser concern” compared to migratory birds. They require demonstrating that actual risk exceeds thresholds before restricting traditional products.

The UK’s surveillance data backs this up. Food Standards Agency testing of 629 raw milk cheese samples found that 82% met satisfactory standards, and zero human infections were reported in their 2024 summary. They’re monitoring, not prohibiting. Different philosophy entirely.

Where This Leaves Us

After looking at all this—the research, the surveillance data, what producers are experiencing—a few things become clear.

The science suggests aged cheese poses minimal real-world risk. Cornell’s ferrets stayed healthy eating contaminated cheese. The FDA found zero viable virus in over 110 retail cheese samples. Wisconsin’s 19,000 tests came back clean. At some point, you have to acknowledge what that’s telling us.

But regulatory frameworks don’t pivot quickly. FDA’s March guidance still says aging “may not be effective,” despite their own surveillance data. That’s just how these systems work—once precautionary measures are in place, they rarely get walked back.

For those of us actually making cheese, this means developing strategies based on real risk assessment, not just regulatory compliance. Source from tested herds—that’s foundational now. Consider pH optimization where it makes sense for your products. Carry adequate insurance, but understand what it actually covers. And think very carefully about voluntary testing that could trigger massive recalls for what might be harmless RNA fragments.

Your geographic location matters enormously here. Operating in Wisconsin or Pennsylvania with comprehensive surveillance and zero detections is fundamentally different from operating in California, where outbreaks are ongoing. Know your state’s status and plan accordingly.

And if you’re a smaller operation—under 50 cows—the economics are completely different. You might need to explore cooperative testing approaches to reduce testing costs, focus on direct sales where relationships matter more than paperwork, and maintain product diversity to spread risk.

The Bottom Line

You know, the specialty cheese market’s going to keep growing. Consumer demand for quality, artisanal products isn’t disappearing. What we’re learning is that producers who understand both the science and the regulatory landscape—who can implement practical risk management based on actual rather than theoretical threats—they’re finding ways forward.

Understanding the difference between finding viral RNA and finding infectious virus, knowing what your state’s surveillance shows, making informed decisions for your specific operation—that’s what gets you through this.

The gap between laboratory worst-case scenarios and what we’re actually seeing in the field tells us something important. While it’s appropriate to be cautious with new threats, there’s a point where precaution becomes… well, maybe overcautious.

This situation’s going to keep evolving. What we know today builds on yesterday, and tomorrow will probably bring new insights. But armed with good science, awareness of regional differences, and practical approaches, we can navigate this while protecting both public health and our operations.

Every producer meeting I attend, every conversation at the co-op, we’re all trying to figure this out together. And that’s actually encouraging—we’re not just reacting anymore, we’re understanding. That’s real progress.

Key Takeaways

  • PCR’s $10 million problem: Testing detects harmless RNA fragments but can’t identify actual infection risk—triggering massive recalls for dead virus that FDA surveillance shows doesn’t exist in retail cheese
  • The data is reassuring: Cornell’s infected ferrets stayed healthy eating contaminated cheese, Wisconsin tested 19,000 samples with zero detections, and the FDA found zero viable virus in 110+ retail samples nationwide
  • Geography drives strategy: California’s 233 affected herds require aggressive risk management, while Wisconsin and Pennsylvania’s comprehensive surveillance with zero detections means regulatory compliance matters more than contamination risk
  • Your three-point action plan: Source exclusively from tested negative herds (non-negotiable), optimize toward pH 5.0 or below for natural viral inactivation, and avoid voluntary finished product testing unless customer-mandated—it creates $10M liability exposure for detecting fragments that pose no risk

Complete references and supporting documentation are available upon request by contacting the editorial team at editor@thebullvine.com.

Information current as of October 28, 2025. Regulations and surveillance data continue evolving. Always consult current USDA and FDA guidance, along with your state regulations, for the most up-to-date requirements. For more information on navigating these challenges, the Wisconsin Cheese Makers Association (www.wischeesemakers.org) and your state dairy associations can provide valuable resources and support.

Learn More:

Join the Revolution!

Join over 30,000 successful dairy professionals who rely on Bullvine Weekly for their competitive edge. Delivered directly to your inbox each week, our exclusive industry insights help you make smarter decisions while saving precious hours every week. Never miss critical updates on milk production trends, breakthrough technologies, and profit-boosting strategies that top producers are already implementing. Subscribe now to transform your dairy operation’s efficiency and profitability—your future success is just one click away.

NewsSubscribe
First
Last
Consent

The Great Dairy Reversal: How Europe’s Precision Contraction Strategy Could Redefine Global Competitiveness

EU’s 8.7% herd crash + 15.6% milk price surge = game-changing proof that strategic contraction beats volume expansion for dairy profitability

EXECUTIVE SUMMARY:  Europe just shattered the “bigger herds equal better profits” myth that’s driving North American expansion strategies into a profitability dead end. While U.S. producers added 58,000 cows in Q1 2025 chasing volume targets, EU processors achieved 15.6% milk price increases through strategic herd reduction and premium positioning. The data is undeniable: EU dairy cow numbers crashed 3.4% to 19.226 million head in 2024, yet processors captured higher export values by pivoting toward cheese production rather than commodity powders. New Zealand proves the efficiency model works—despite a 3.5% cow reduction, they maintained stable milk solids through genomic selection and precision feeding, delivering superior ROI per animal. Meanwhile, European Commission projections show continued 13% herd decline through 2035, creating global supply tightness that rewards strategic positioning over scale expansion. This isn’t just European data—it’s a blueprint for North American producers to evaluate whether your growth strategy creates competitive advantage or operational vulnerability. Stop measuring success by total milk volume and start calculating profitability per cow, because tomorrow’s dairy winners will optimize what they have instead of expanding what they manage.

KEY TAKEAWAYS

  • Technology ROI Crushes Expansion ROI: EU producers investing in precision systems achieve 200-300% returns with 8-12 month payback periods, while herd expansion delivers 8-12% returns over 7-10 years—proving efficiency investments generate compound returns versus linear cost increases from adding cows.
  • Component Optimization Beats Volume Strategy: European processors capturing 0.4% annual export value growth despite 0.2% volume decline through strategic cheese positioning, while feed efficiency improvements of just 0.2 points deliver $470 annual savings per cow—demonstrating value-per-liter trumps total production.
  • Market Premiums Reward Strategic Positioning: EU milk prices strengthened 15.6% in early 2025 amid supply constraints, while global butter and cheese prices hit record highs due to tight supplies—creating premium opportunities for producers focusing on component targeting rather than commodity volume competition.
  • Regulatory Reality Creates Competitive Advantage: Environmental constraints forcing EU efficiency gains through precision feeding and genomic selection are previews of global dairy’s future—early adopters developing sustainable intensification systems will capture market premiums while volume-focused operations face margin compression.
  • Global Supply Realignment Favors Optimization: With EU projecting 13% herd decline through 2035 and raw milk deliveries falling 3.2% year-over-year, global supply tightness rewards producers who maximize output per animal through technology adoption rather than infrastructure expansion into increasingly constrained markets.
dairy efficiency, precision dairy farming, dairy technology ROI, global dairy trends, farm profitability optimization

Europe just shattered every assumption about dairy success—while North American producers chase bigger herds through massive processing expansion, the EU deliberately contracted livestock by 8.7% over the past decade, yet processors command premium prices through strategic value positioning. If you’re still measuring success by total milk volume, this verified data will force you to question whether your growth strategy creates competitive advantage or operational vulnerability.

The uncomfortable truth reshaping global dairy economics: the world’s largest dairy market just proved that strategic herd reduction combined with component optimization delivers superior returns than volume-focused expansion. According to Eurostat, the European Union’s dairy cow population crashed to 19.226 million head in December 2024—a devastating 3.4% decline (687,000 fewer cows) in just one year, marking the lowest inventory in decades. Yet EU average raw milk prices reached 53.8 cents per kilogram in February 2025, towering 16% above February 2024 levels, while processors pivoted to higher-value products, capturing premium markets.

That grinding sound you hear? It’s the foundation of every assumption linking bigger herds to better business, cracking under verified market data.

Challenging the Growth Gospel: Why Bigger Isn’t Better Anymore

Here’s the question every dairy executive should be asking: If expansion equals success, why are European processors achieving higher margins through contraction while the USDA raised its 2025 U.S. milk production forecast to 227.3 billion pounds, reflecting modest herd expansion to handle volume growth?

The research reveals a stark contrast: During the first quarter of 2025, the U.S. saw a 58,000-head increase in the national dairy herd, while European producers deliberately pivot toward cheese production, capturing value premiums that volume-focused operations cannot access.

The fundamental challenge to conventional wisdom: Growth-obsessed operations assume that scaling production automatically improves profitability, but verified market data suggests the opposite. European dairy processors are proving that strategic positioning trumps production scale.

Evidence-Based Alternative: Consider New Zealand’s efficiency model. According to industry data, despite dairy cow numbers falling, dairy companies processed 20.5 billion litres of milk containing 1.88 billion kilograms of milksolids in the 2023/24 season, representing a 0.5% increase in kilograms of milksolids—proving that optimization can maintain output while reducing operational complexity.

The Numbers That Demolish Expansion-Only Logic

Let’s examine the verified statistics that challenge growth-only thinking. According to Eurostat data, the EU livestock transformation represents unprecedented structural change:

Verified EU Livestock Contraction (2014-2024):

  • Bovine animals: Down 8.7% to 72 million head
  • Dairy cows specifically: Declined from peak levels to 19.226 million (December 2024)
  • Pigs: Fell 8.1% to 132 million
  • Sheep: Declined 9.4% to 57 million
  • Goats: Crashed 16.3% to 10 million

In 2024, all livestock populations declined – the pig population decreased by 0.5%, bovines by 2.8%, sheep by 1.7% and goats by 1.6%.

But here’s where conventional wisdom collapses: European processors are capturing higher margins through strategic product shifts toward premium positioning despite this massive contraction. The comprehensive research analysis states, “the European Commission projects that cheese and whey could absorb 36% of the EU milk pool by 2035.”

Major Players Leading Strategic Repositioning

The scale of this transformation becomes evident when examining verified data from key dairy regions. According to the comprehensive research report analyzing EU dairy trends:

Germany: Lost 123,000 dairy cows in 2024 alone, representing the elimination of approximately 1,500 average-sized operations. However, surviving operations report improved profitability through precision feeding and component optimization rather than scale expansion.

France: Reduced inventory by 91,000 head while implementing advanced programs targeting milk quality improvements.

Poland: Experienced the most dramatic transformation—a stunning 283,000-head reduction following a 1.5% expansion in 2023, suggesting strategic culling based on productivity metrics rather than forced liquidation.

Netherlands and Ireland: Each trimmed 30,000 cows while investing heavily in precision agriculture systems, adapting to intense regulatory pressure as environmental constraints tighten.

Technology ROI: Precision Investment Framework

Here’s a question that should make every expansion-focused operation uncomfortable: Why invest in additional cows when technology can deliver superior returns through existing herd optimization?

Verified Technology Returns (2025 Data)

According to The Bullvine’s analysis of current dairy technology investments:

Milk Predictive Analytics: 8-month payback period with +$0.30/cwt milk premium

Feed Efficiency AI: 7-10 month payback with 5-10% feed cost reduction

Data Integration Platforms: 12-month payback with 5.8:1 ROI ratio on 1,000-cow dairies

Critical Analysis: Operations pursuing herd expansion face linear cost increases (housing, labor, feed), while technology investments generate compound returns through improved efficiency across existing assets. Early adopters are seeing ROI within 7-8 months, particularly with smart calf monitoring systems that have slashed mortality by up to 40%.

Implementation Framework: 30-60-90 Day Action Plan

30-Day Assessment Phase

Week 1-2: Baseline Establishment

  • Calculate current feed efficiency and component premiums
  • Document health event costs (mastitis, lameness, reproduction issues)
  • Measure current labor allocation for monitoring tasks

Week 3-4: Technology Evaluation

  • Contact equipment suppliers for monitoring systems
  • Pilot feed efficiency monitoring on a 100-head test group
  • Calculate ROI potential using verified benchmarks from industry data

60-Day Pilot Implementation

Technology Integration: Based on verified results, smart monitoring systems show ROI within the first month through early disease detection.

Cost-Benefit Analysis:

90-Day Strategic Positioning

Market Positioning Evaluation:

  • Assess premium product opportunities (European model)
  • Calculate component pricing advantages
  • Develop sustainability messaging for premium positioning

Global Competitive Realignment: The Data Doesn’t Lie

While Europe optimizes, other regions demonstrate contrasting strategies:

United States: Volume Expansion Strategy The USDA raised its 2025 milk production forecast to 227.3 billion pounds, up 0.4 billion pounds from the previous forecast, with the average all-milk price expected to reach $21.60 per hundredweight.

New Zealand: Efficiency Optimization Model According to industry data, despite a 12% reduction in dairy herd numbers over the last decade and a 5% decrease in total milking cows, total milksolids processed have remained relatively stable. Milksolids per cow are once again near record levels, resulting from farmers’ dedication, technology uptake, and science application.

The Strategic Question: Are U.S. producers betting correctly on volume expansion while Europeans and New Zealanders optimize for efficiency, or does each approach suit different market positioning strategies?

Market Volatility Rewards Strategic Positioning

European production constraints are creating global market opportunities. According to research analysis, “raw milk deliveries to EU dairies fell by 3.2% during January-March 2025 compared to the previous year.”

This market tightening resembles peak genetic selection outcomes—when you optimize for specific traits, market premiums reward precision over volume. EU butter prices held firm at €739/100kg amid tight supplies, while skimmed milk powder and cheddar faced downward pressure.

Verified Market Impact: The strategic shift shows 0.6% cheese production growth, stealing milk from butter/powders, and reshaping EU dairy economics.

The Consumer Revolution Driving Strategic Shifts

While producers debate herd sizes, consumers quietly rewrite demand patterns. According to the research analysis, “The European dairy alternatives market is experiencing robust growth, estimated at $10.84 billion in 2025 and projected to nearly double to $21.48 billion by 2030, with a Compound Annual Growth Rate (CAGR) of 14.65%.”

Strategic Insight: European processors’ pivot toward premium cheese production responds directly to these trends, targeting consumption occasions where alternatives struggle to compete. This repositioning toward premium, artisanal, and specialty products creates defensible market positions that pure volume strategies cannot achieve.

The Strategic Question for Growth-Focused Operations: If consumer preferences shift toward premium, sustainable products, does expanding commodity production position your operation for future success or increase vulnerability?

Economic Framework: Precision vs. Expansion ROI

Expansion Strategy Costs (500-Cow Addition)

  • Capital investment: $3,200-$3,800 per cow (housing, equipment)
  • Annual operating costs: Linear increases in feed, labor, and utilities
  • Risk factors: Market volatility, regulatory compliance, labor availability

Optimization Strategy Returns (Existing 500-Cow Herd)

Technology Investment: $60,000-$80,000 total

Payback Period: 8-12 months based on verified industry results

Why This Matters for Your Operation: Economic Reality Check

Stop measuring success by herd size alone. The European experience and verified North American data demonstrate that strategic optimization delivers measurably superior returns:

Profitability Analysis (verified data):

Risk Assessment: Smaller, optimized operations demonstrate greater resilience to feed price volatility, regulatory changes, and labor shortages—critical factors as environmental regulations expand globally.

Strategic Options Comparison

Strategic ApproachInitial InvestmentAnnual ROIPayback PeriodRisk Level
Herd Expansion (500 cows)$1.6-1.9M8-12%7-10 yearsHigh regulatory/market risk
Technology Optimization$60-80K200-300%8-12 monthsModerate technical risk
Premium Positioning$40-60K150-200%6-8 monthsLow commodity risk

Implementation Barriers and Solutions

Technology Adoption Challenges

Capital Requirements: Initial investment ranges from $60,000-$80,000 for comprehensive optimization systems, but 8-12 months payback periods make financing attractive.

Training Requirements: Implementation requires 3-6 months for staff proficiency development, but early detection benefits often pay for monthly subscriptions with single disease prevention.

Proven Success Factors

According to industry analysis, successful implementation requires:

  • Comprehensive staff training on new systems
  • Integration with existing farm management protocols
  • Regular monitoring of key performance indicators
  • Consistent data analysis and action implementation

Expert Perspectives on Strategic Transformation

Industry experts quoted in the comprehensive research analysis provide critical insights:

On Strategic Positioning: “The EU’s strategic pivot towards higher-value products like cheese and whey maximizes export value despite declining volumes. This re-specialization allows the EU to capitalize on its reputation for quality and origin-protected products.”

On Efficiency vs. Volume: “New Zealand’s ability to maintain stable milk solids production despite declining cow numbers demonstrates a successful strategy of ‘sustainable intensification’ through efficiency gains and technological adoption.”

On Global Competitiveness: “The transatlantic divergence emphasizes global dairy market interconnectedness. Leaders must continuously monitor international trade flows, regional production shifts, and evolving consumer demands worldwide.”

The Bottom Line: Strategic Clarity for Sustainable Competitive Advantage

Europe’s 8.7% livestock decline over the past decade isn’t agricultural failure—it’s early evidence that precision agriculture applied to dairy production, where component optimization and strategic positioning deliver measurably superior returns compared to volume-focused expansion.

Three Verified Strategic Imperatives for 2025:

  1. Technology ROI Beats Expansion ROI: Verified industry data shows 200-300% returns on technology investment with 8-12 month payback periods, compared to 7-10 year payback periods for herd expansion.
  2. Feed Efficiency Multiplies Profitability: 5-10% feed cost reduction delivers immediate bottom-line impact, while component optimization adds $0.30/cwt premium through predictive analytics.
  3. Market Positioning Rewards Strategic Thinking: Consumer trends toward premium, sustainably-produced products favor operations that document and market superior practices, as evidenced by European processors capturing value growth despite volume declines.

Your Strategic Implementation Plan:

Immediate Action (Next 30 Days):

  1. Calculate your efficiency baseline using current feed costs and component premiums
  2. Document current operational costs (health events, labor hours, veterinary expenses)
  3. Request technology demonstrations from providers using verified ROI models

Technology Pilot (60 Days):

  1. Implement monitoring systems on the test group with verified ROI targets
  2. Measure efficiency improvements using industry benchmarks
  3. Calculate component optimization potential targeting verified premium opportunities

Strategic Positioning (90 Days):

  1. Evaluate premium product opportunities following European processor strategies
  2. Develop efficiency-based marketing highlighting precision and sustainability
  3. Plan technology expansion using verified payback calculations

The competitive divide is accelerating. Strategic positioning begins with understanding that tomorrow’s dairy leaders will be those who transform operational constraints into competitive advantages through precision, technology, and value optimization rather than perpetual expansion.

Stop betting everything on bigger herds. Start investing in smarter systems. The verified industry results prove that optimizing what you have delivers superior returns to expanding what you manage.

Complete references and supporting documentation are available upon request by contacting the editorial team at editor@thebullvine.com.

Learn More:

Join the Revolution!

Join over 30,000 successful dairy professionals who rely on Bullvine Weekly for their competitive edge. Delivered directly to your inbox each week, our exclusive industry insights help you make smarter decisions while saving precious hours every week. Never miss critical updates on milk production trends, breakthrough technologies, and profit-boosting strategies that top producers are already implementing. Subscribe now to transform your dairy operation’s efficiency and profitability—your future success is just one click away.

NewsSubscribe
First
Last
Consent
Send this to a friend