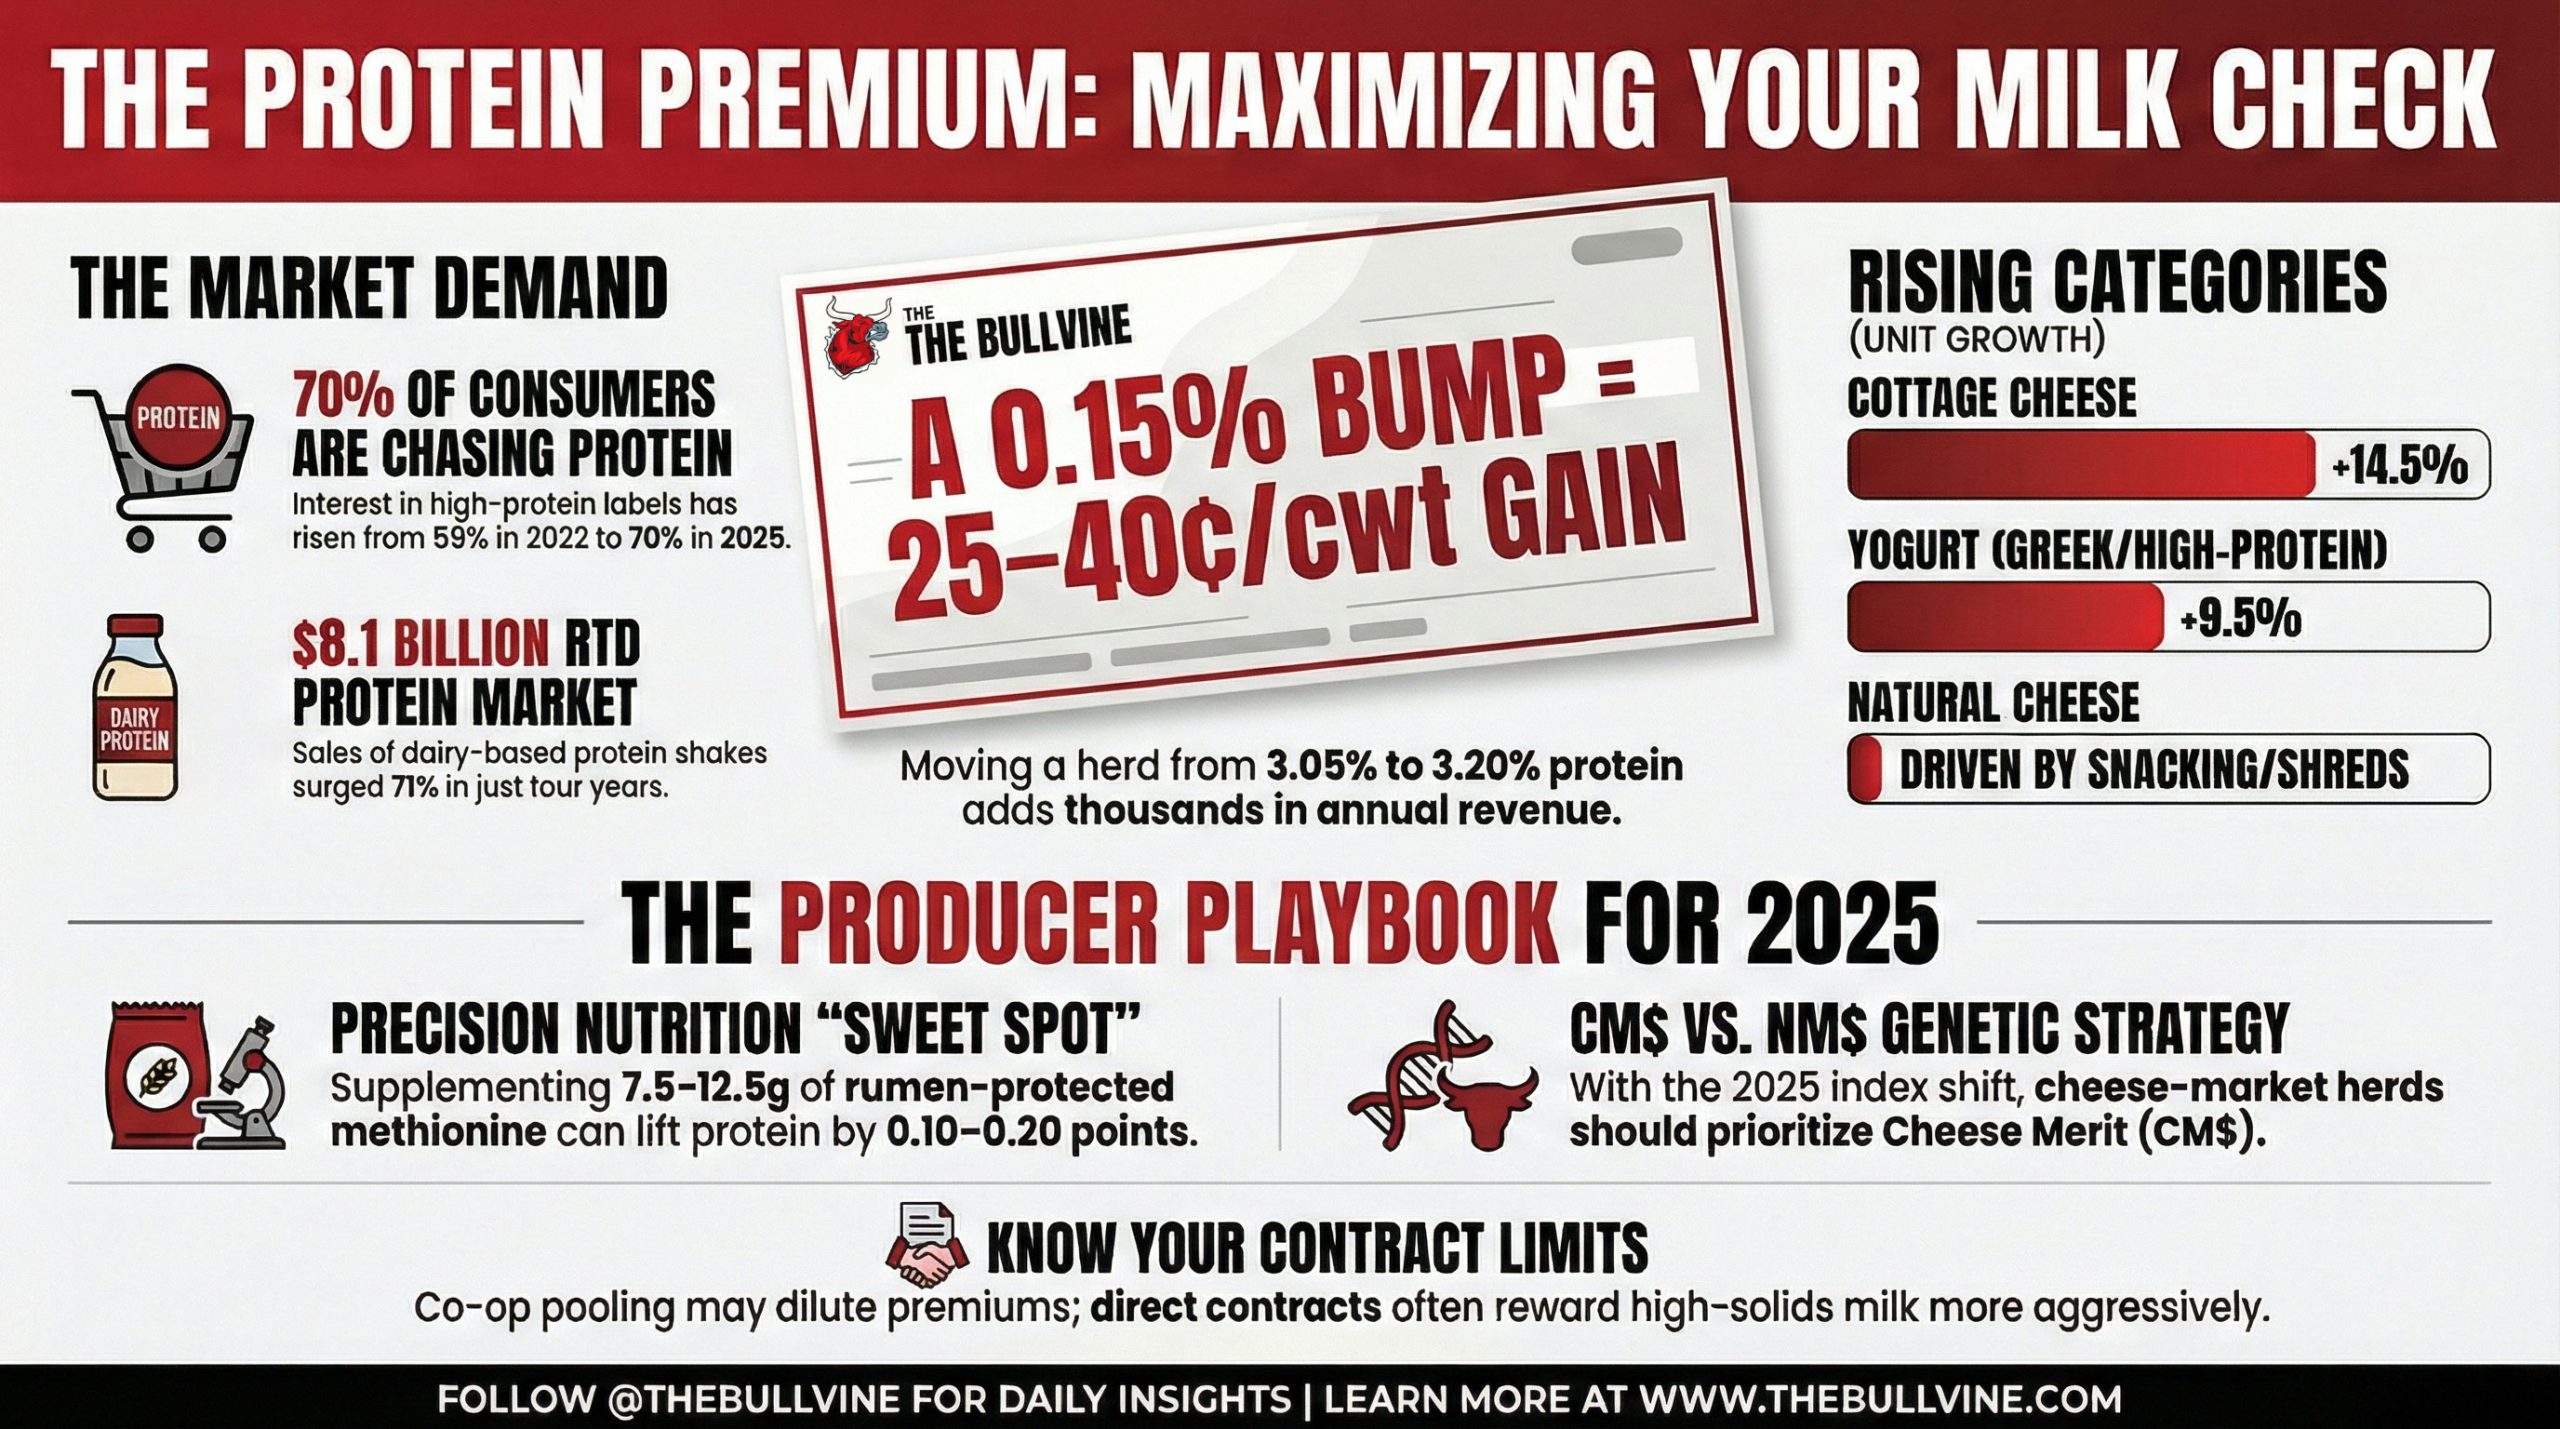
A 0.15% protein bump can be worth 25–40¢/cwt. The real question is: does your contract let any of it reach your milk check?

Executive Summary: Protein has quietly become dairy’s growth engine, as IFIC surveys, new 2025–2030 U.S. dietary guidelines, and GLP‑1 usage all push consumers toward higher‑protein foods and drinks. Circana and CoBank data show where the money is going: strong unit growth in high‑protein yogurt and cottage cheese, and RTD dairy‑based protein shakes surging from about $4.7B to $8.1B in four years. Processors have responded with billions in cheese, whey, yogurt, and cultured plant investments, which means they increasingly want “right milk”—high‑component milk that hits yield and margin targets without expensive ingredient protein. For many herds on Class III‑based component grids, a roughly 0.15‑point protein gain can be worth 25–40¢/cwt, but co‑op pooling vs direct, solids‑driven contracts largely determines how much of that ever reaches your milk check. On‑farm, the article shows how solid forage and fresh cow management, followed by smart amino acid balancing, can realistically add 0.10–0.20 points of protein, while the April 2025 NM$/TPI changes mean cheese‑market herds should rethink index choices and sire filters. A 90‑day playbook walks you through nailing your baseline, grilling your nutrition and milk pricing, updating your sire plan, and then deciding—based on your plant map and contracts—whether protein should be a major strategic lever or a secondary priority.
If you just stare at Class prices and milk production reports, it still feels like the same old dairy story. Flat or drifting‑down fluid, a few wild price spikes, a lot of noise. But here’s what’s really going on underneath that: a growing share of your customers are quietly reorganizing their diets around protein, processors are pouring billions into plants built around solids, and the indexes we use to pick bulls have already shifted toward that new reality.
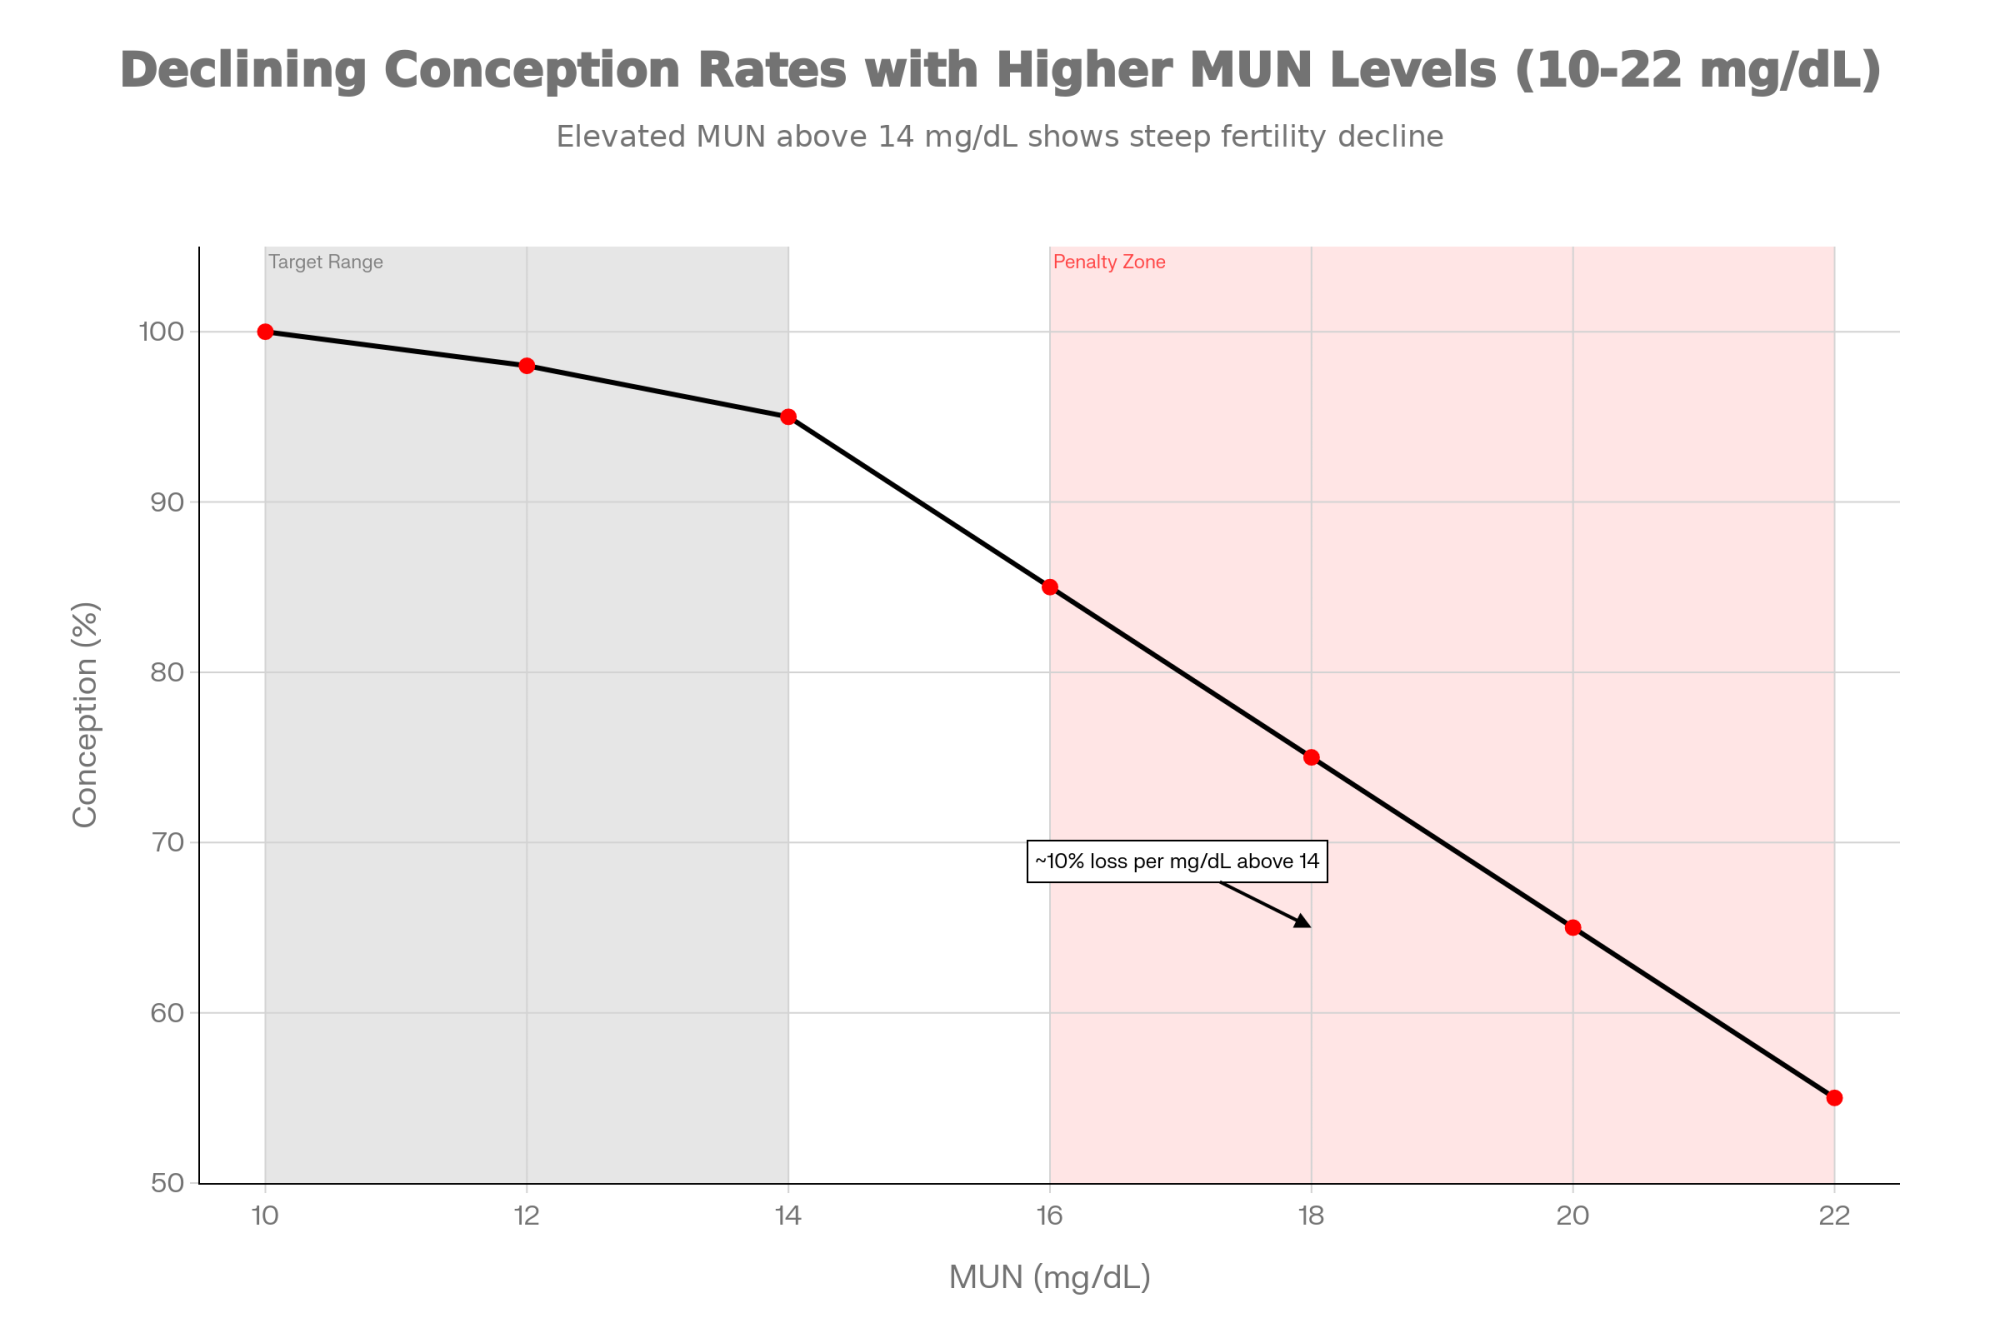
On a typical Class III‑based component grid in the Upper Midwest, moving a herd from roughly 3.05% true protein to 3.20% at 80 pounds of milk per cow per day can easily be worth 25–40 cents per cwt on the protein line alone, before you factor in cheese yield bonuses. That’s a few thousand dollars a year on a 100‑cow herd, and tens of thousands on a 1,000‑cow operation, if your market actually rewards those components. The catch—the part most folks skip—is that not every plant, co‑op, or region passes that value back the same way.
Let’s walk through this the way we’d talk about it at your kitchen table: what’s changed with consumers, what the retail and plant numbers actually say, where nutrition and genetics can realistically move the needle, how co‑ops and contracts change who keeps the premium, and then a 90‑day plan you can use to decide how hard to chase protein in your own herd.
Looking at the Protein Trend from the Consumer’s Side
Looking at this trend from the consumer side first makes the rest of the story make a lot more sense.
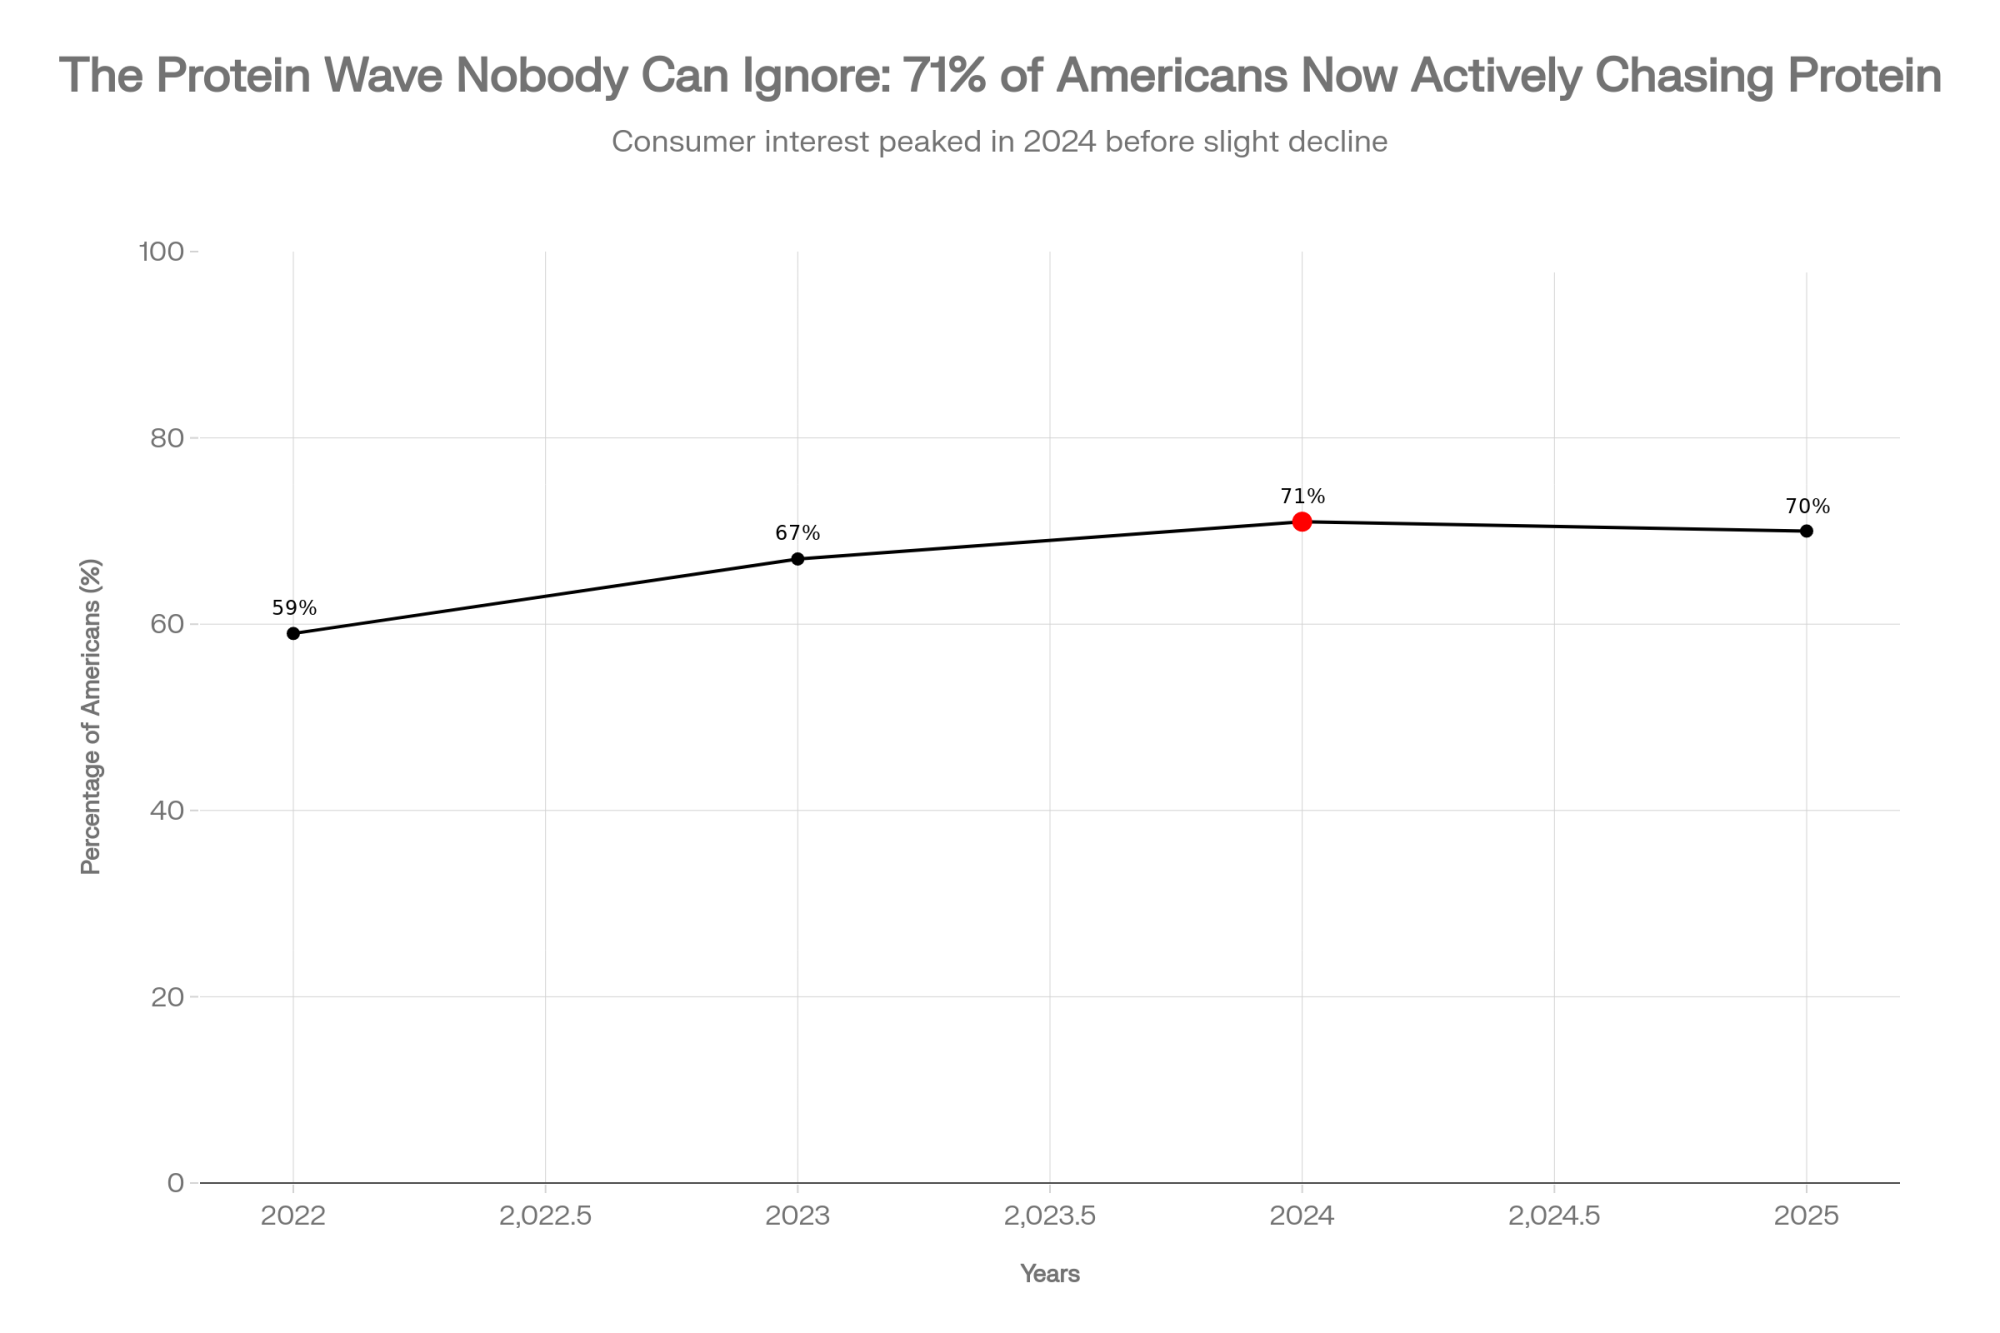
The International Food Information Council (IFIC) has been running its Food & Health Survey for over twenty years. In their protein‑focused work from 2022–2025, they found that 59% of Americans said they were trying to consume protein in 2022, 67% in 2023, and 71% in 2024, with the 2025 survey showing interest holding at 70%. Those numbers come from nationally representative online samples of 1,000–3,000 adults each year, weighted for age, gender, and region, not just some fitness‑blog poll. IFIC’s July 2025 “Protein Spotlight” also notes that when these people say they care about protein, the most common thing they look for on labels is the grams of protein per serving.
Analysis of IFIC’s findings noted that roughly a quarter of Americans admit they don’t know how much protein they actually need. They’re chasing “high protein,” but they’re a bit foggy on the math. That confusion is important because it means simple, high‑protein messages on dairy labels can carry a lot of weight.
On the nutrition science side, several reviews over the last decade—published in journals like Nutrients and Applied Physiology, Nutrition, and Metabolism—have argued that the old adult RDA of 0.8 grams of protein per kilogram of body weight per day is probably too low for many older adults who want to maintain muscle and function. Those reviews generally support intakes of 1.0–1.2 g/kg/day for healthy older adults and 1.2–1.6 g/kg/day for those aiming to optimize muscle and metabolic health. When the 2025–2030 Dietary Guidelines for Americans were released in late 2025, coverage from Harvard’s School of Public Health and ag media highlighted that the new guidelines lean much more into higher‑protein patterns for older adults and explicitly recognize dairy as one of the key high‑quality protein sources.
Then there’s the GLP‑1 wave. A July 2024 JAMA article using KFF survey data reported that about one in eight U.S. adults had used a GLP‑1 drug like Ozempic or Wegovy, and KFF’s November 2025 polling found that roughly 12% of adults said they were currently taking a GLP‑1 medication for weight loss, diabetes, or related conditions. CoBank’s 2026 “Dairy Poised to Help Meet Consumers’ Growing Demand for Protein” report connects that to food choices: GLP‑1 users are eating fewer sugary, low‑protein snacks, but they still want foods and drinks that deliver satiety and protect lean mass. That has pushed many of them toward high‑protein yogurts, cottage cheese, and ready‑to‑drink protein shakes—many of which are dairy‑based.
So, putting that together:
- More people are consciously chasing protein than even a few years ago.
- Official guidelines are finally catching up and telling older adults to eat more protein.
- A growing group of GLP‑1 users has fewer calories to “spend” and is steering more of them toward protein‑dense foods and drinks.
- Dairy protein is complete, familiar, and easy for processors to formulate with.
The demand signal is there. The question is: where is that money actually showing up in the dairy case, and how does it flow back to your farm?
Where the Protein Money Is Showing Up in Retail
When you stop obsessing over fluid charts and look at scanner data, the protein story jumps off the page.
Analysis of retail performance for the 52 weeks ending November 2025 shows that across the entire grocery store, four dairy categories land in the top ten for unit growth:
- Yogurt, led by Greek and other high‑protein styles, is second overall, with unit sales up 9.5%.
- Natural cheese is third in unit growth, driven by snacking and shredded formats.
- Cottage cheese is sixth, with a 14.5% jump in units—a big comeback story fuelled by high‑protein positioning.
- Dairy creamers are tenth, with unit sales up 31.9%.
Its important to emphasize that these are unit increases, not just inflation. They also spell out that this data doesn’t include most of the ready‑to‑drink protein shake aisle, because those products are usually categorized under beverages or sports nutrition rather than traditional dairy.

| Year | RTD High-Protein Shake Sales (USD Billions) | Growth Rate |
|---|---|---|
| 2022 | 4.7 | — |
| 2023 | 5.9 | +25.5% YoY |
| 2024 | 7.0 | +18.6% YoY |
| 2025 | 8.1 | +15.7% YoY |
CoBank fills in that gap. Their January 2026 analysis, based on Circana retail data, reports that U.S. RTD high‑protein shakes grew from $4.7 billion in annual sales to $8.1 billion over four years—about 71% growth. The report makes it very clear that the majority of that protein is dairy‑derived: whey protein concentrates and isolates, milk protein concentrate, and micellar casein. These products often sit near energy drinks or health foods, not in the milk case, but the protein in them is coming out of our cows.
So the retail reality looks like this:
- High‑protein yogurts and cottage cheeses are growing solidly inside the dairy case.
- Dairy creamers—many of them higher in added fats and flavors—are booming.
- A multi‑billion‑dollar RTD protein market built largely on dairy ingredients is exploding just beyond the dairy aisle.
The dollars are chasing dairy protein, not just white milk.
The $2.8 Billion Processor Bet on “Right Milk.”
Now let’s sit where the processor sits for a minute.

2026 outlook estimates that roughly $2.8 billion has been invested in yogurt and cultured product plants in recent years, much of it in New York. Those plants are designed to handle high‑solids milk and turn it into Greek, skyr, cultured drinks, and other protein‑focused products. When you add in expansions at cheese and whey plants, fluid milk plants, and yogurt/cultured facilities, these categories account for just over 80% of new and expanded U.S. dairy processing capacity.
CoBank and Cheese Reporter coverage point to about $8 billion in total new or expanded U.S. dairy processing projects through 2026, with roughly half of that aimed at cheese and whey. Wisconsin and neighboring states have seen significant expansions in cheese and whey production. Idaho and other Western states have invested in cheese, skim milk powder, and nonfat dry milk plants, partly geared toward export markets. Texas and the southern Plains have attracted new large‑scale plants built around big herds, solids, and export‑oriented products.
Here’s the problem processors are running into—and it ties straight back to what’s in your bulk tank.
| Category | Investment (USD Billions) | Percentage of Total | Focus |
|---|---|---|---|
| Cheese & Whey Plants | 4.0 | 50% | Solids-driven |
| Yogurt & Cultured | 2.8 | 35% | High-protein products |
| Fluid & Powder | 1.2 | 15% | Solids standardization |
| Total | $8.0B | 100% | — |
Over the last decade, U.S. Holstein genetics have pushed butterfat up fast. CDCB has documented that butterfat gains over the last base period have been impressive. Many American‑style cheese plants now receive milk with more butterfat than their vats can handle; they have to skim cream and standardize to target fat levels. If protein doesn’t rise in step with fat, the plant either:
- Accepts a lower cheese yield per hundredweight than its business model assumed.
- Buys milk protein concentrate or ultrafiltered milk to bring protein up.
- Starts paying more attention to which farms deliver higher‑protein milk and looks for ways to reward that.
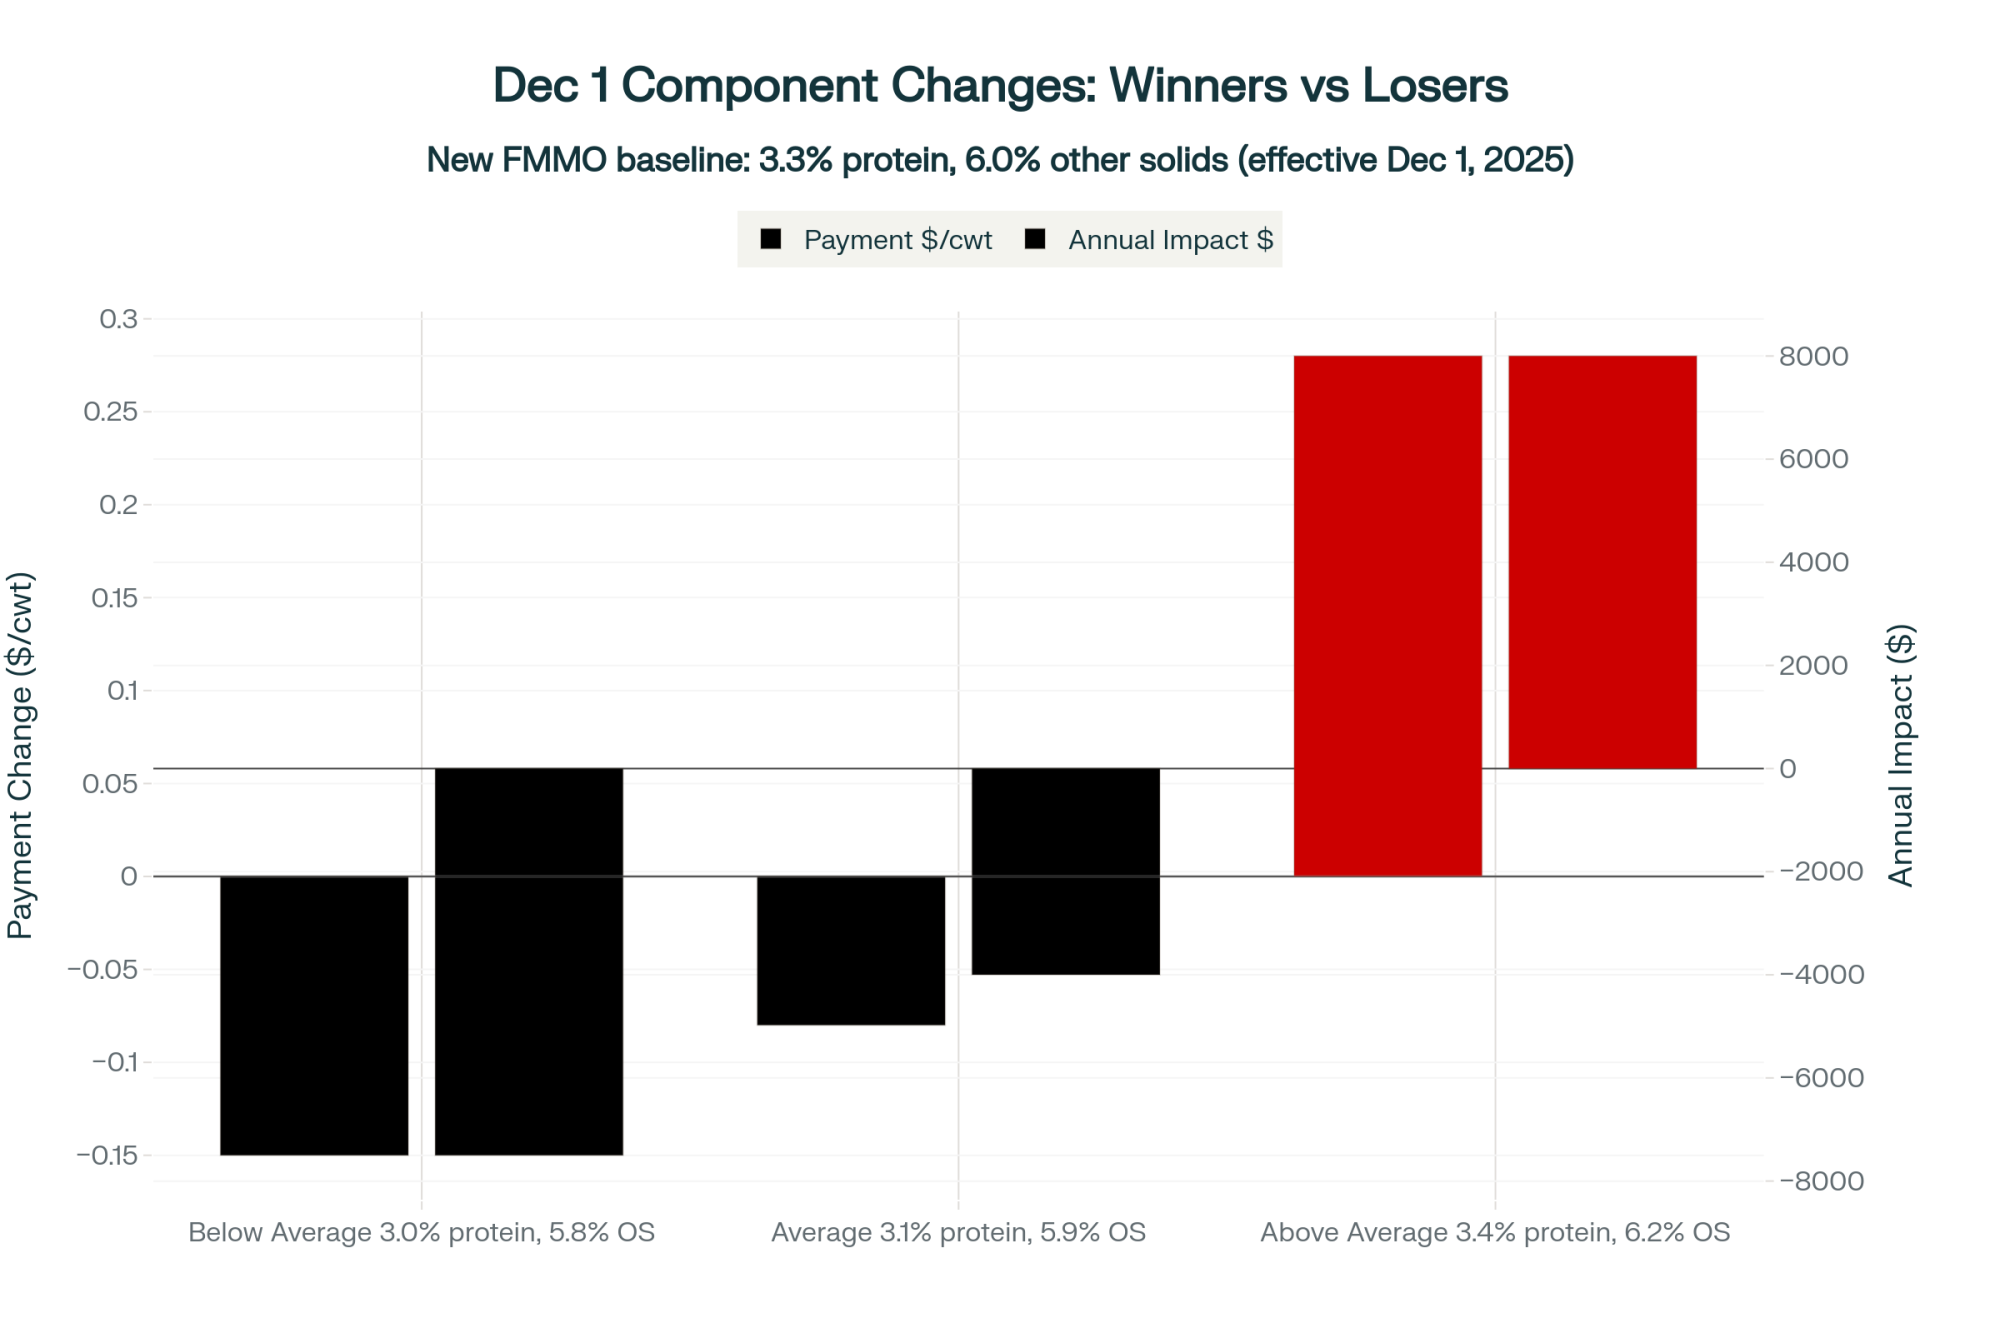
If a plant’s financial model is built around a milk pool averaging 3.3–3.4% true protein and the actual pool is closer to 3.1%, that gap is painful—especially at millions of pounds per day. More and more plant managers are saying, quietly but firmly, that they want “the right milk” rather than just “more milk.” In 2025, “right milk” often means higher solids, especially protein.
What Producers Are Really Seeing in the Ration
So what does it look like on your farm when you try to move protein in a way that actually pays and doesn’t wreck the ration?
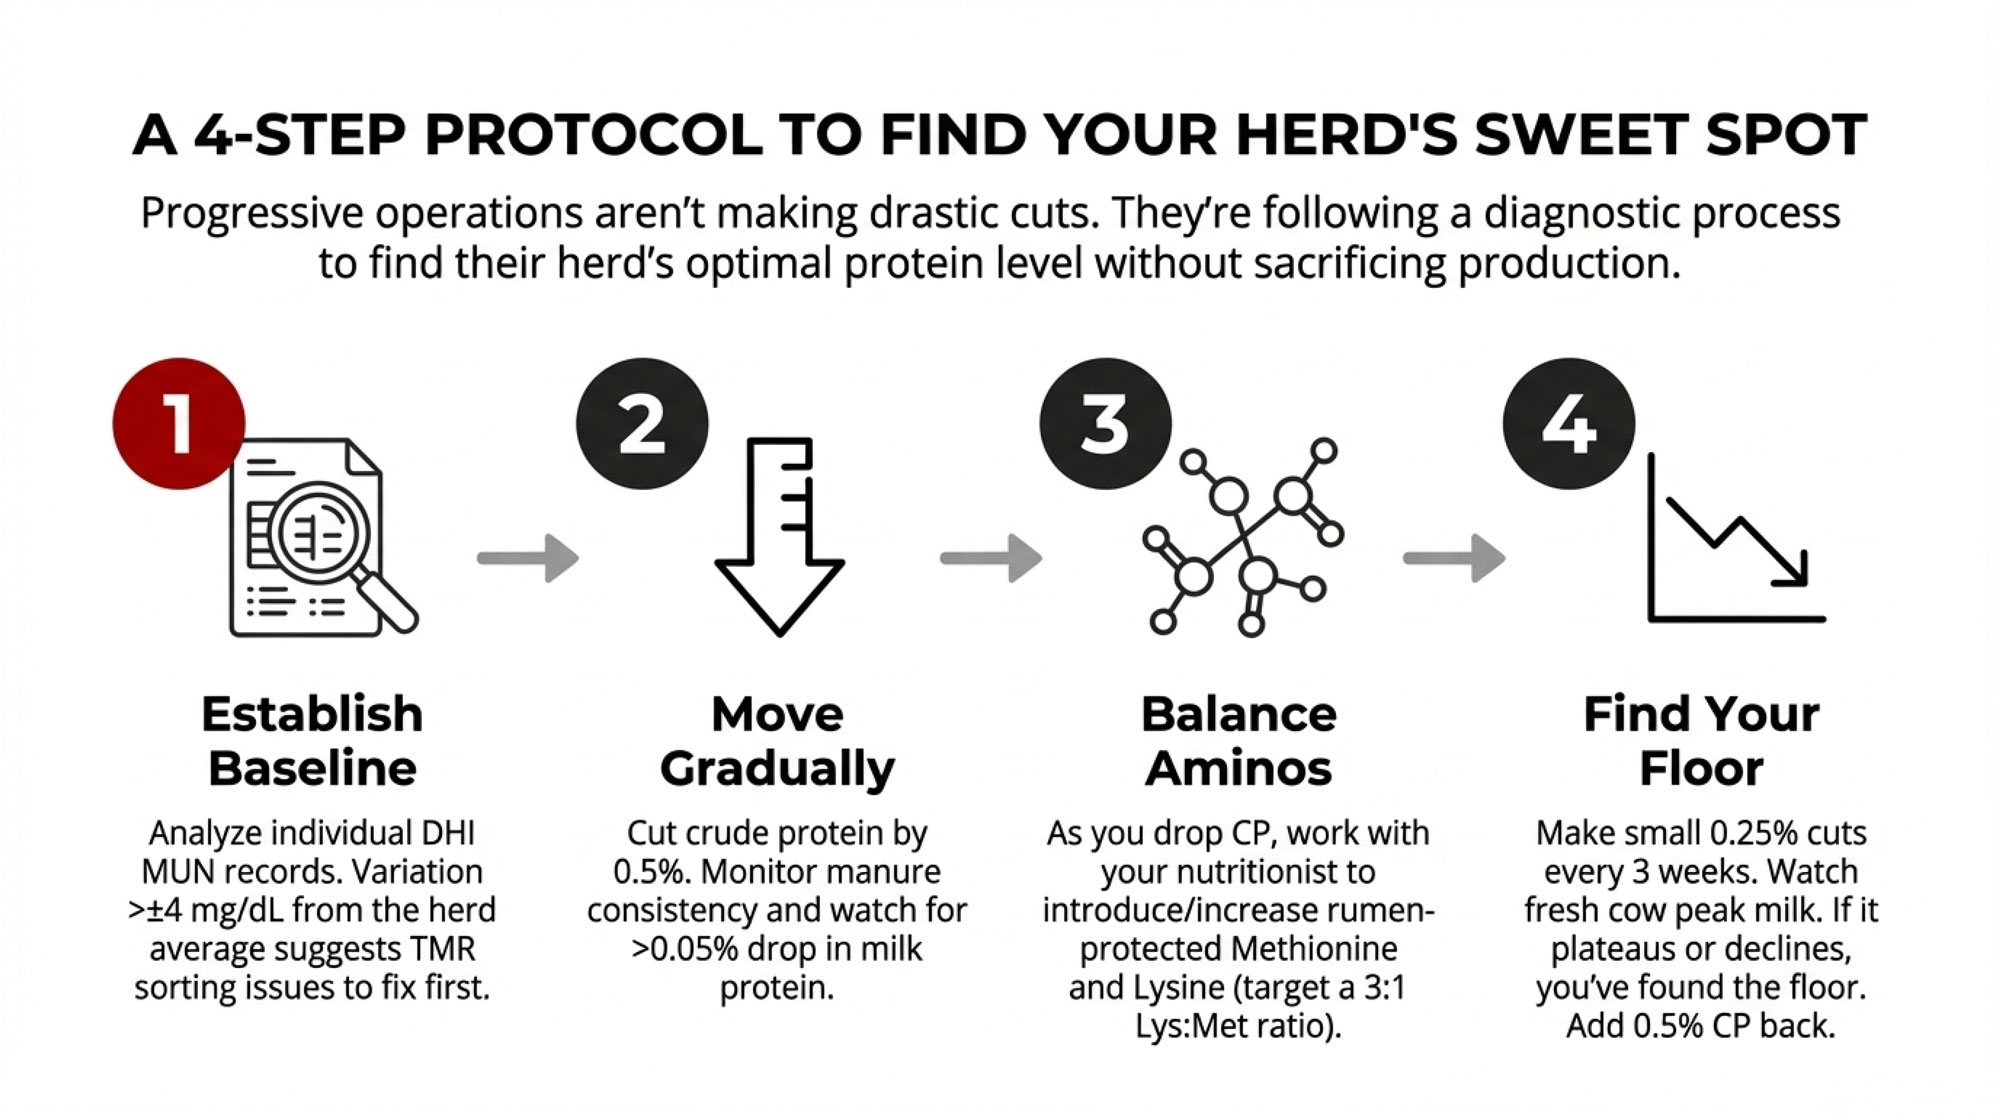
What nutritionists and producers are finding is that the herds consistently making progress on protein don’t treat it as a one‑product miracle cure. They treat it as a fine‑tuning opportunity on top of good basics:
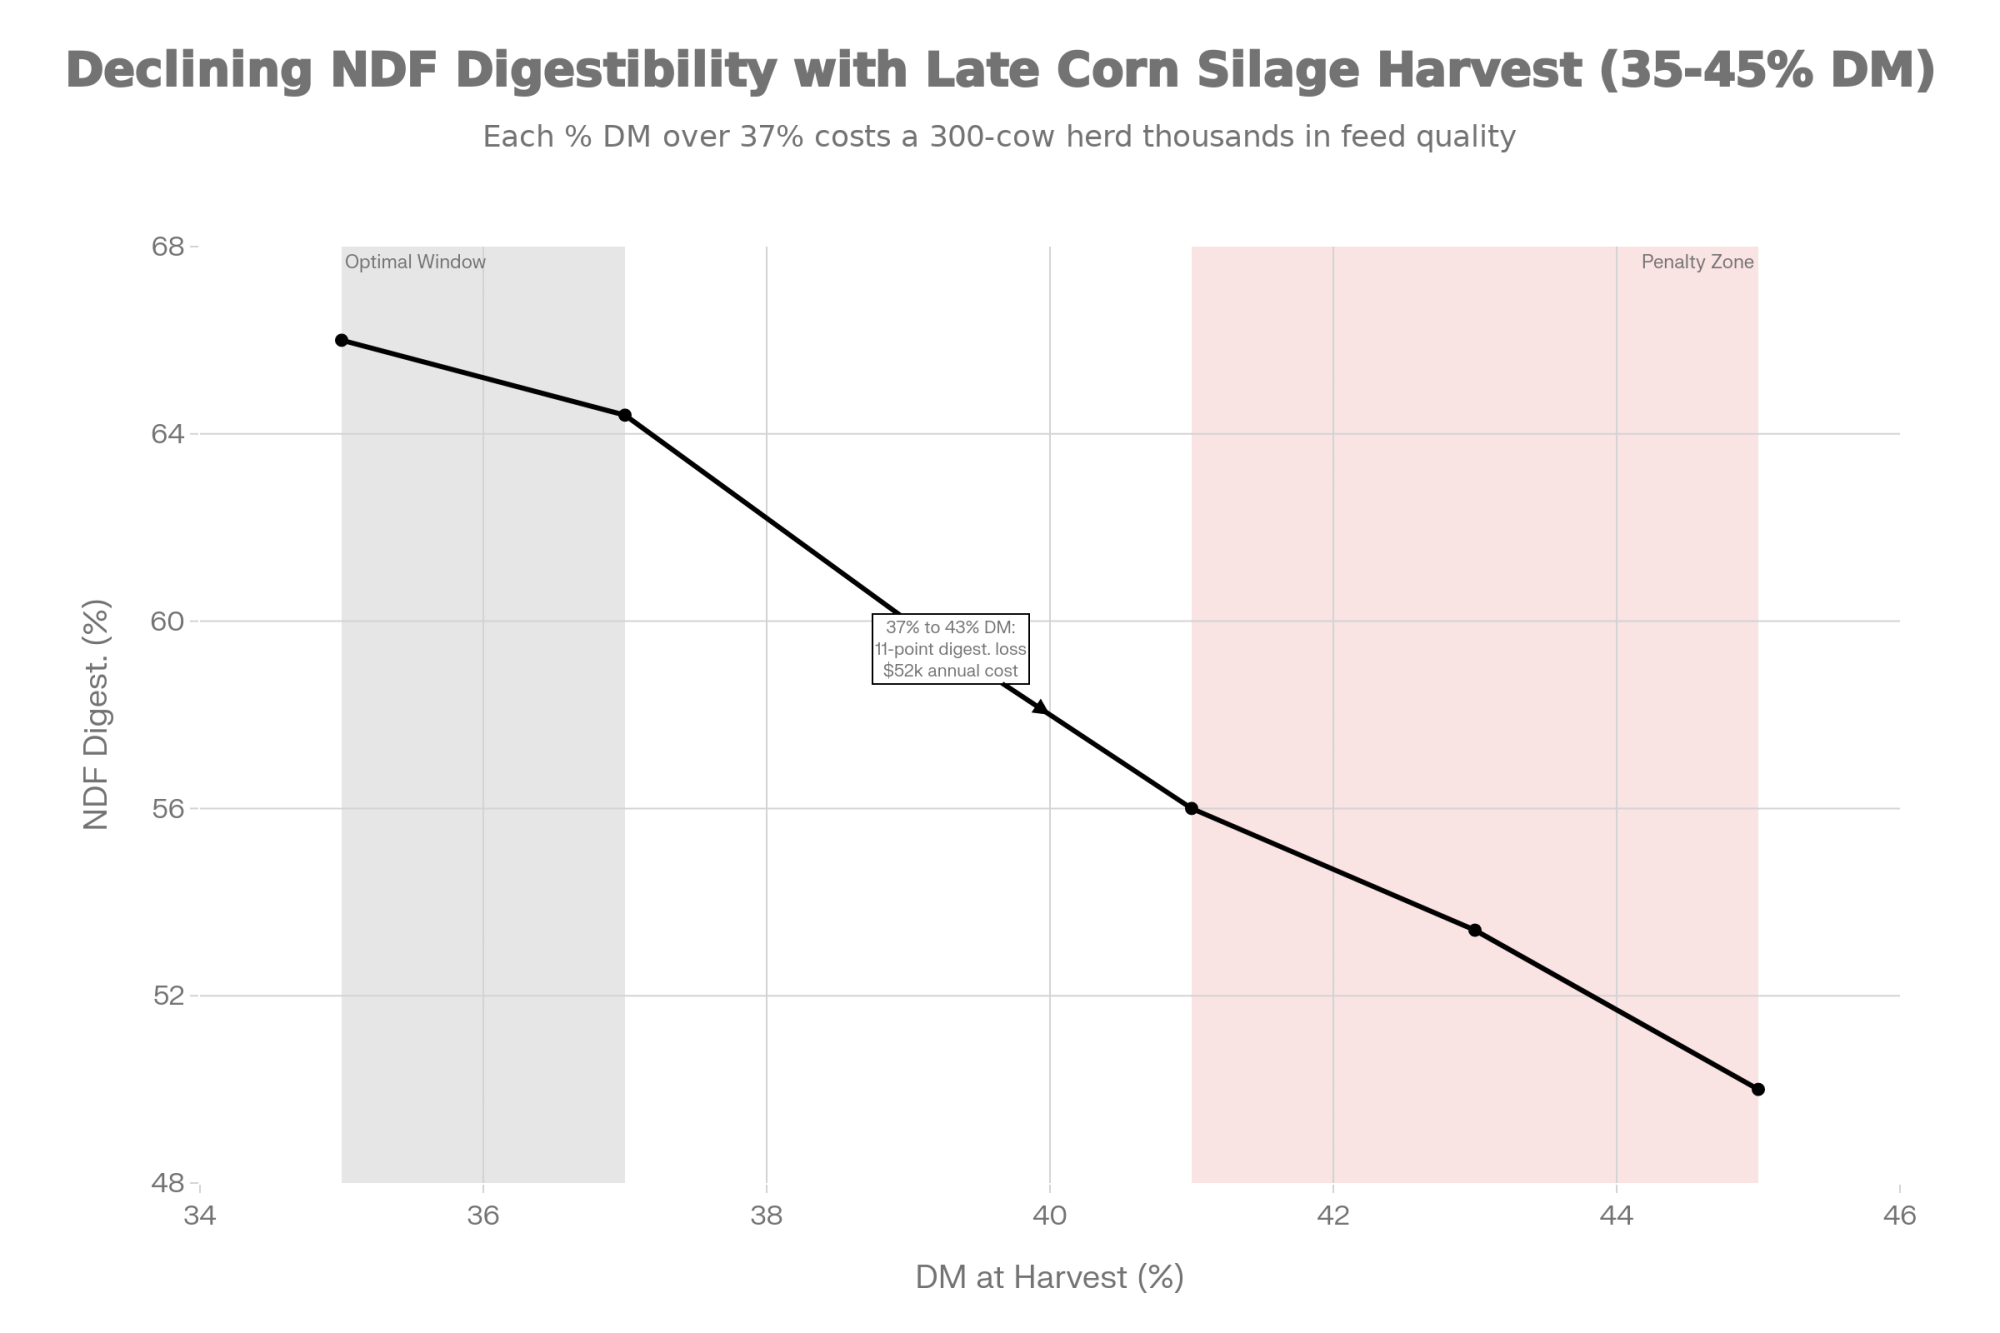
- Strong forage quality and tight dry matter control.
- Rumen‑friendly feeding with minimal sorting and consistent TMR delivery.
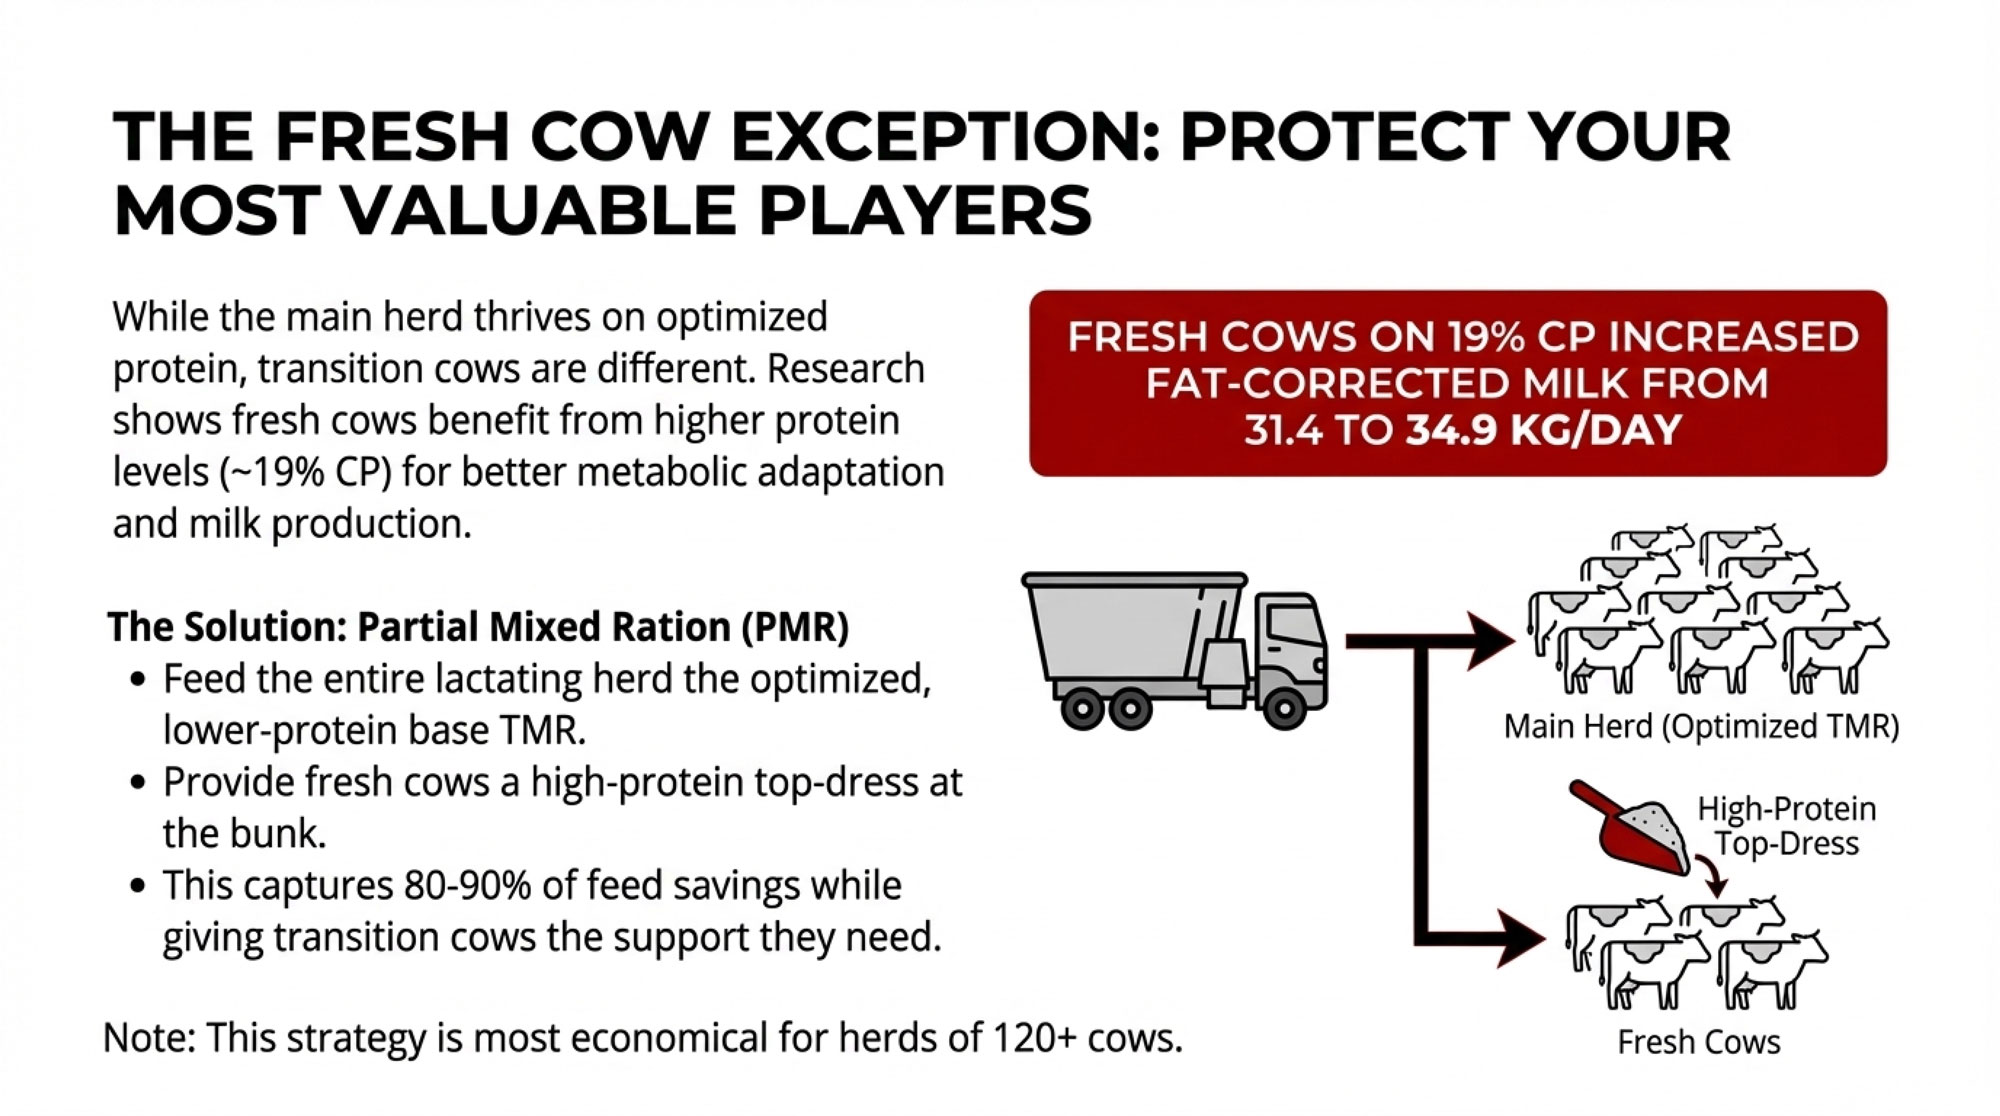
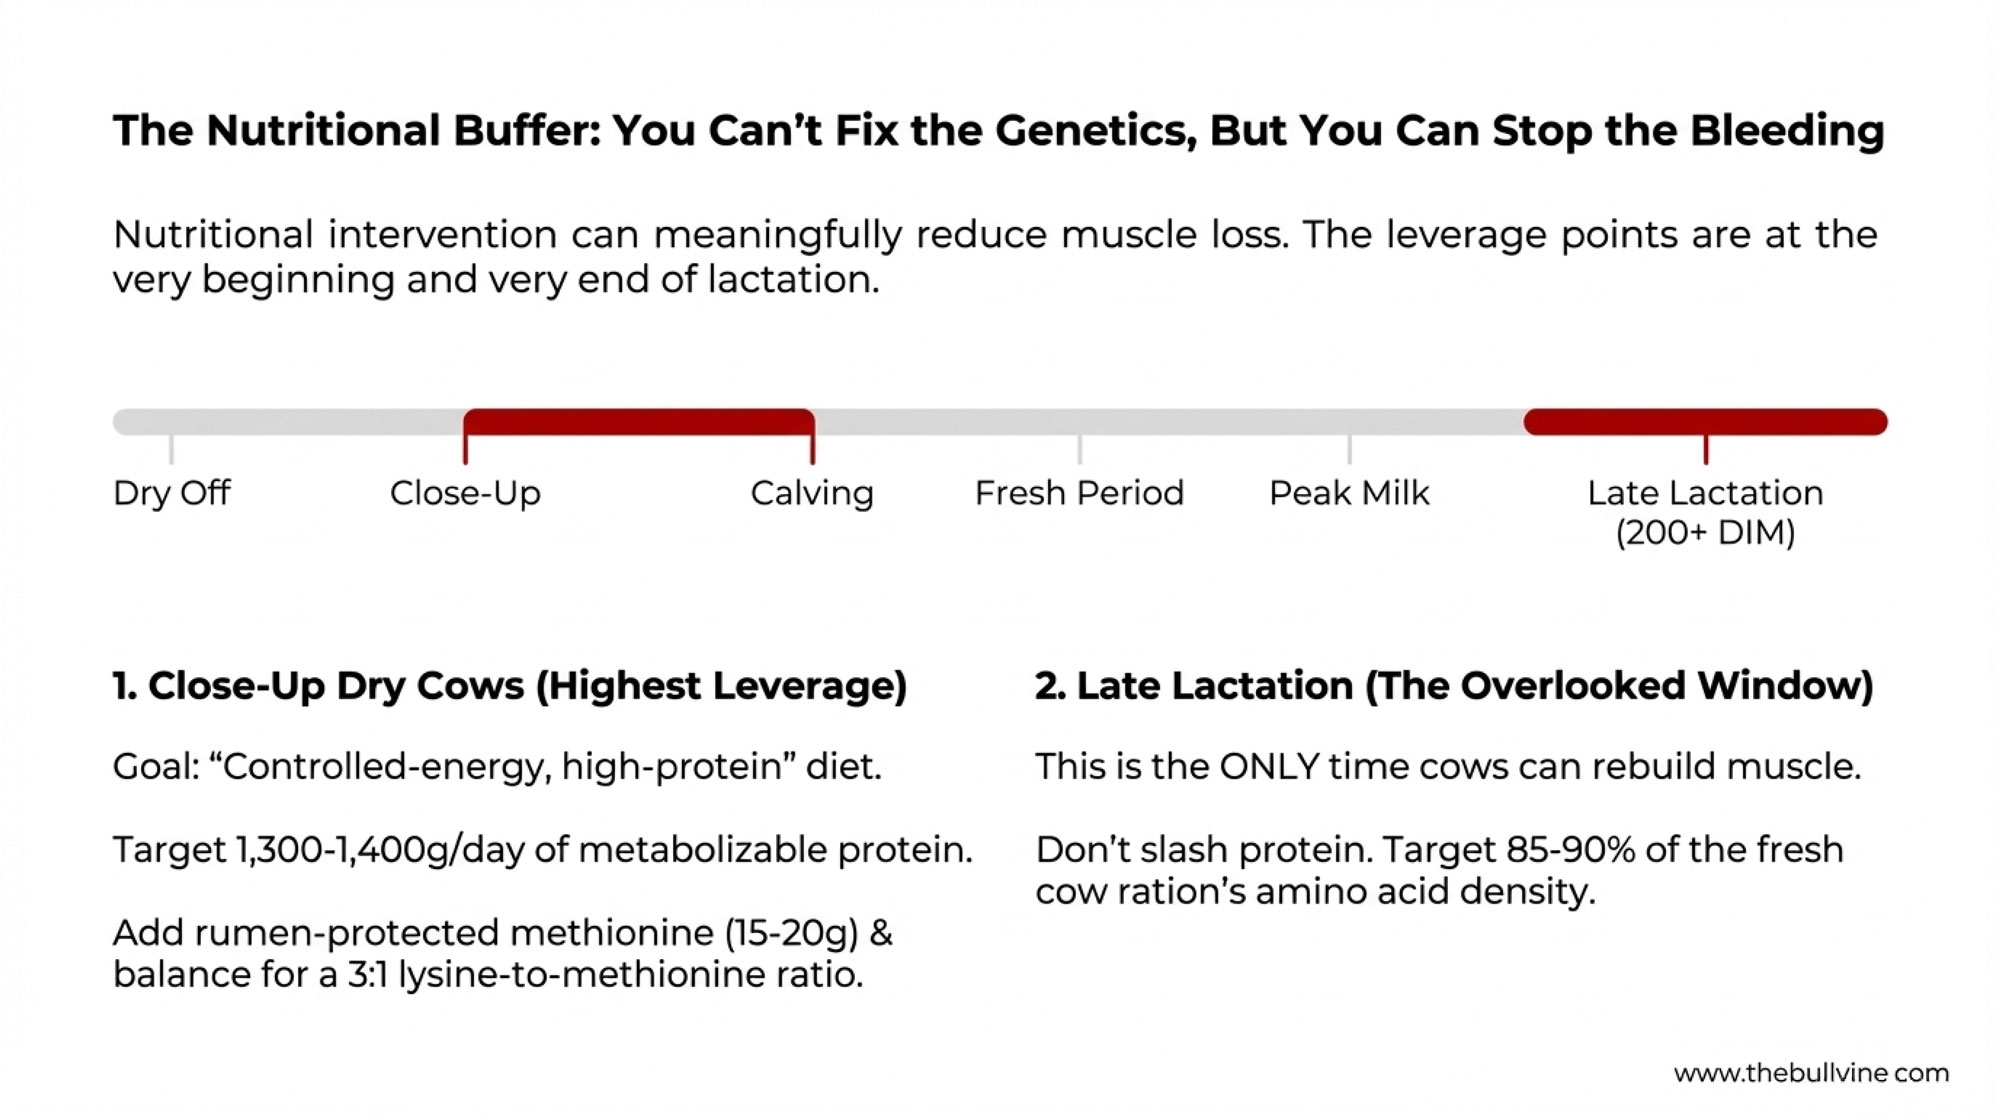
- Solid fresh cow management in the transition period, so cows actually peak and don’t crash.
Once those pillars are in place, amino acid balancing starts to make sense.
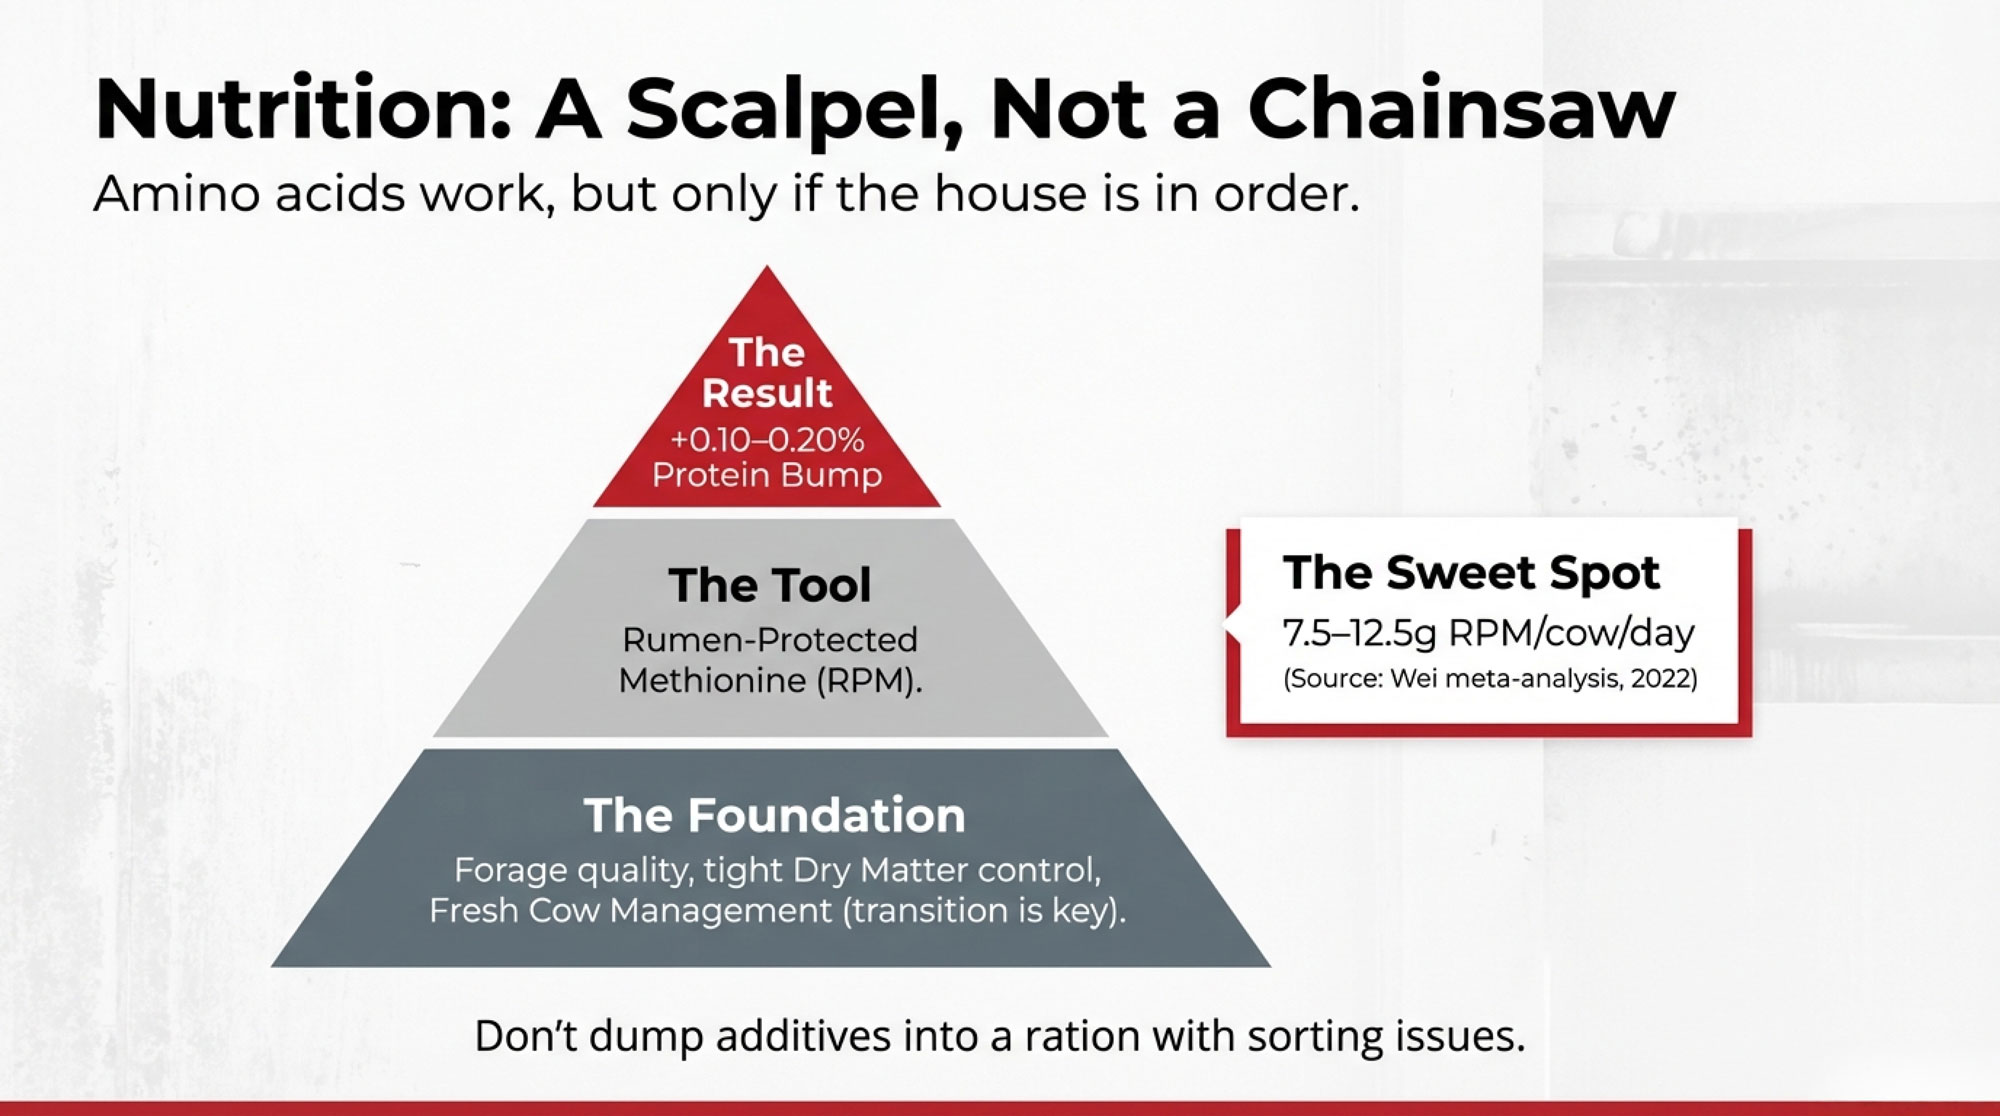
A 2022 meta‑analysis by Chunbo Wei and co‑authors in the MDPI journal Animals compiled data from rumen‑protected methionine (RPM) trials conducted between 2010 and 2022. Their conclusion: when methionine is limiting in the diet, supplementing RPM doesn’t always push total milk volume higher, but it does significantly increase milk protein percentage and milk fat percentage, especially in high‑producing cows on well‑balanced rations. Using dose‑response models, they identified a sweet spot around 7.5–12.5 grams of RPM per cow per day for maximizing protein and fat percentages without wasting product.
Other work in Animals and the Journal of Dairy Science has shown similar patterns: microencapsulated methionine and newer methionine dipeptide products can raise milk protein yield and improve nitrogen efficiency when the rest of the ration is dialed in.
On the ground, nutritionists in Wisconsin, New York, Ontario, and Idaho describe results that match that research:
- In well‑managed herds already producing 80–90 lb with decent butterfat performance, adding RPM and balancing methionine and lysine often nudges protein up by 0.10–0.20 points over 60–90 days, with small bumps in butterfat.
- After confirming the response, some rations can safely trim crude protein—usually by reducing soybean meal or other expensive protein sources—while keeping or even lowering the ration cost per cwt and improving component levels.
Honestly, this is where most herds get tripped up. They hear about a neighbor’s protein bump, throw RPM into a ration built on variable corn silage and stressed fresh cows, and then complain when nothing happens. The Wei meta‑analysis and university work are clear: RPM is a scalpel, not a chainsaw. It works best on top of a good system, not instead of one.
If you’re thinking about amino acids, here’s a practical way to frame the conversation with your nutritionist:
- Given our forage tests, butterfat performance, and current production, do you genuinely think methionine is limiting in our diet? Show me where you see that.
- If we add, say, 10 g/cow/day of RPM, exactly which ingredient or crude protein level can we cut back on to make this a trade‑off, not just an extra cost?
- In herds similar to ours—320‑cow freestall in Wisconsin, 80‑cow tie‑stall in Quebec, 900‑cow dry lot in Idaho—what milk protein and butterfat responses have you actually seen, and over what timeline?
Then, track components weekly for at least two to three months after changes. Don’t just go on gut feel.
Genetics: How the April 2025 Changes Repriced Protein
Nutrition is the short game. Genetics is the long game. And the rules of that long game shifted in April 2025.

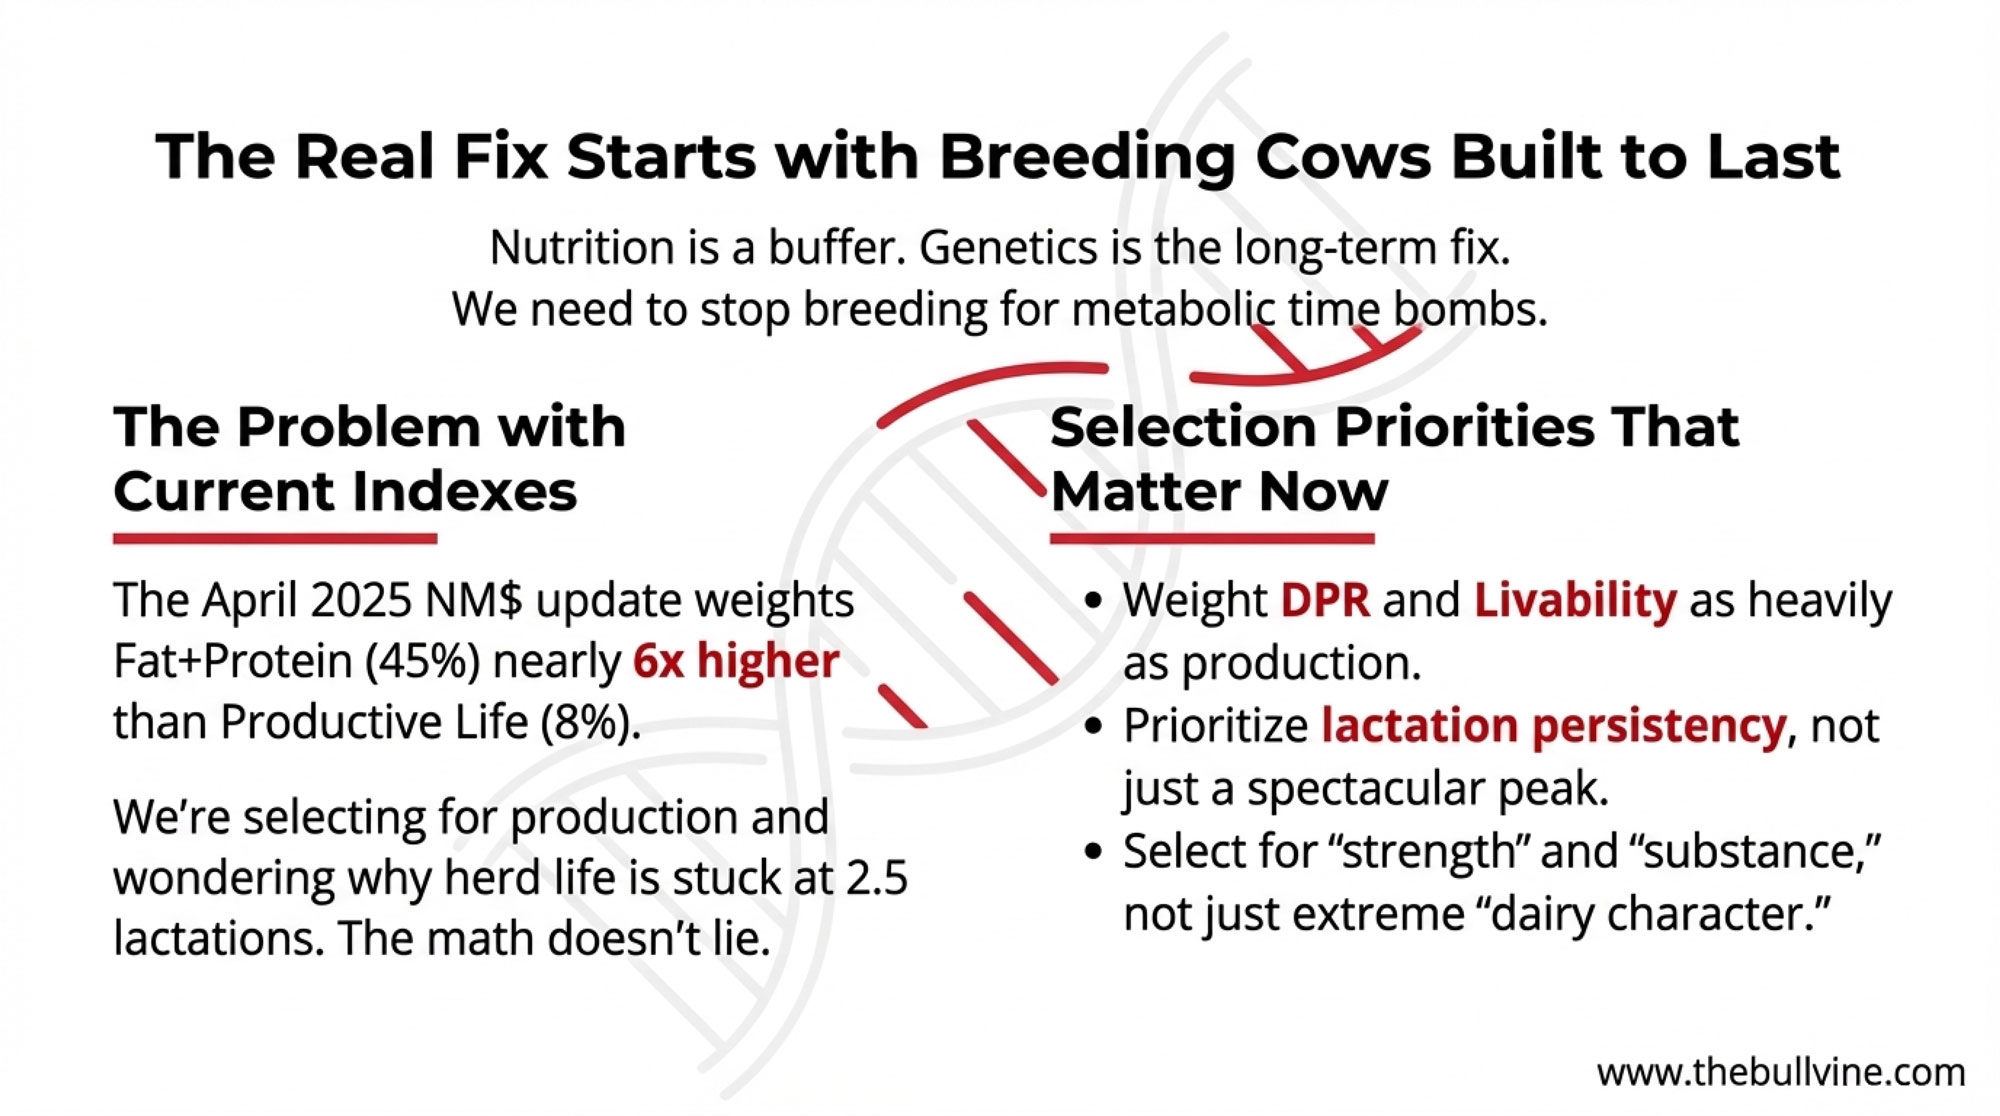
USDA’s Animal Genomics and Improvement Laboratory (AGIL) and the Council on Dairy Cattle Breeding (CDCB) rolled out a major revision to Net Merit $ (NM$) in April 2025. According to the official AGIL report, the economic weights changed as follows:
- Protein’s weight dropped from 19.6% to 13%.
- Fat’s weight increased from 28.6% to 31.8%.
- Milk volume’s weight rose from 0.3% to 3.2%.
- Residual Feed Intake (as a feed efficiency trait) sits at about –6.8%.
- Health, fertility, and longevity together account for just over 30% of the index.
AGIL explains that this shift reflects recent trends in U.S. markets: butterfat prices have been strong, and producers care more than ever about feed efficiency. Brownfield Ag News noted that the correlation between the old and new NM$ formulas is 0.992, meaning the reweighting doesn’t scramble the sire rankings—but it does send a message: fat is king right now in NM$, and protein has been dialed back.
| Trait | Pre-April 2025 Weight | Post-April 2025 Weight | Change (points) | Interpretation |
|---|---|---|---|---|
| Protein | 19.6% | 13.0% | –6.6 | De-prioritized in NM$ formula |
| Fat | 28.6% | 31.8% | +3.2 | Elevated; now top-weighted trait |
| Milk Volume | 0.3% | 3.2% | +2.9 | Newly valued; reflects market preference |
| Feed Efficiency (RFI) | — | –6.8% | — | Penalty weight; cost-conscious trait |
| Health & Fertility | ~30% combined | ~30% combined | Stable | Consistent importance |
On the TPI side, Holstein Association USA’s formula continues to place significant weight on both fat and protein, with production traits still accounting for a large share of the index. In the Feed Efficiency $ (FE$) component, the formula is:
FE$ = $1.86 × PTA Fat + $1.75 × PTA Protein + $0.13 × Feed Saved
So both fat and protein are strongly valued, with fat currently worth slightly more per pound in that equation. Cheese Merit $ (CM$) also continues to place heavier emphasis on protein and cheese solids than NM$, making it a better index for herds shipping mainly to cheese plants.
At the same time, the April 2025 base change shifted the reference point from 2015‑born cows to 2020‑born cows. CDCB documents show that the average Holstein PTA dropped by roughly 45 lb fat and 30 lb protein at the base reset, reflecting the genetic gains made over the previous five years. Brownfield’s coverage called this out explicitly and reminded producers that a lower PTA number doesn’t mean bulls got worse overnight; it means the average moved up.
From a practical standpoint, here’s what this means for your sire list:
- If you’re shipping mainly into cheese markets, blindly chasing NM$ might not match your plant’s actual economics anymore. You probably want to look more at CM$ or create a custom index that boosts protein weight without overvaluing milk volume.
- In those cheese markets, bulls with strong protein percentage deviations (+0.08% and higher) and good protein pounds fit the economics better than bulls that just add volume with flat or negative protein %.
- If you’re in a more fluid‑oriented or heavily pooled market, you still care about protein pounds to maximize solids shipped, but you may not need to push percentage as hard—so long as you hold butterfat and health traits where they need to be.
ABS Global’s December 2025 sire summary basically spells this out, saying they’ve adjusted their sire lineup to “balance the scale with protein because of the significant improvements made in fat.” That’s a diplomatic way of saying: “We bred fat so hard for a decade that if we don’t deliberately select for protein now, we’ll drift off balance.”
If you’re still using the same sire selection rules you had before April 2025—circling the top NM$ list and calling it good—it’s worth asking yourself whether those rules still match how your milk is being paid in your market in 2025.
Co‑ops, Contracts, and Who Actually Keeps the Protein Premium
Now we come to the nerve point: even if you move your herd from 3.05% to 3.25% protein, who actually pockets that extra value?
In most of the Northeast and Upper Midwest, and everywhere in Canada, co‑ops and pooling dominate. Co‑ops do important work—balancing markets, managing risk, and giving farms a home for their milk when plants are full. But the way many co‑ops are structured, they also smooth out component and plant‑specific value across a broad membership.
2026 outlook hints at this when it explains how strong performance at yogurt and cheese plants in the Northeast flows back through co‑op pooling. Some of the value from high‑component milk going into those plants gets spread across all members, according to policy, rather than being laser‑targeted to the highest‑protein herds.

So if you push your herd’s protein from 3.10% to 3.25% and your neighbor sits at 2.95%, you’ll see some advantage through the pay grid and herd‑level quality bonuses, but you may not see the full premium that the plant is willing to pay for high‑protein milk.
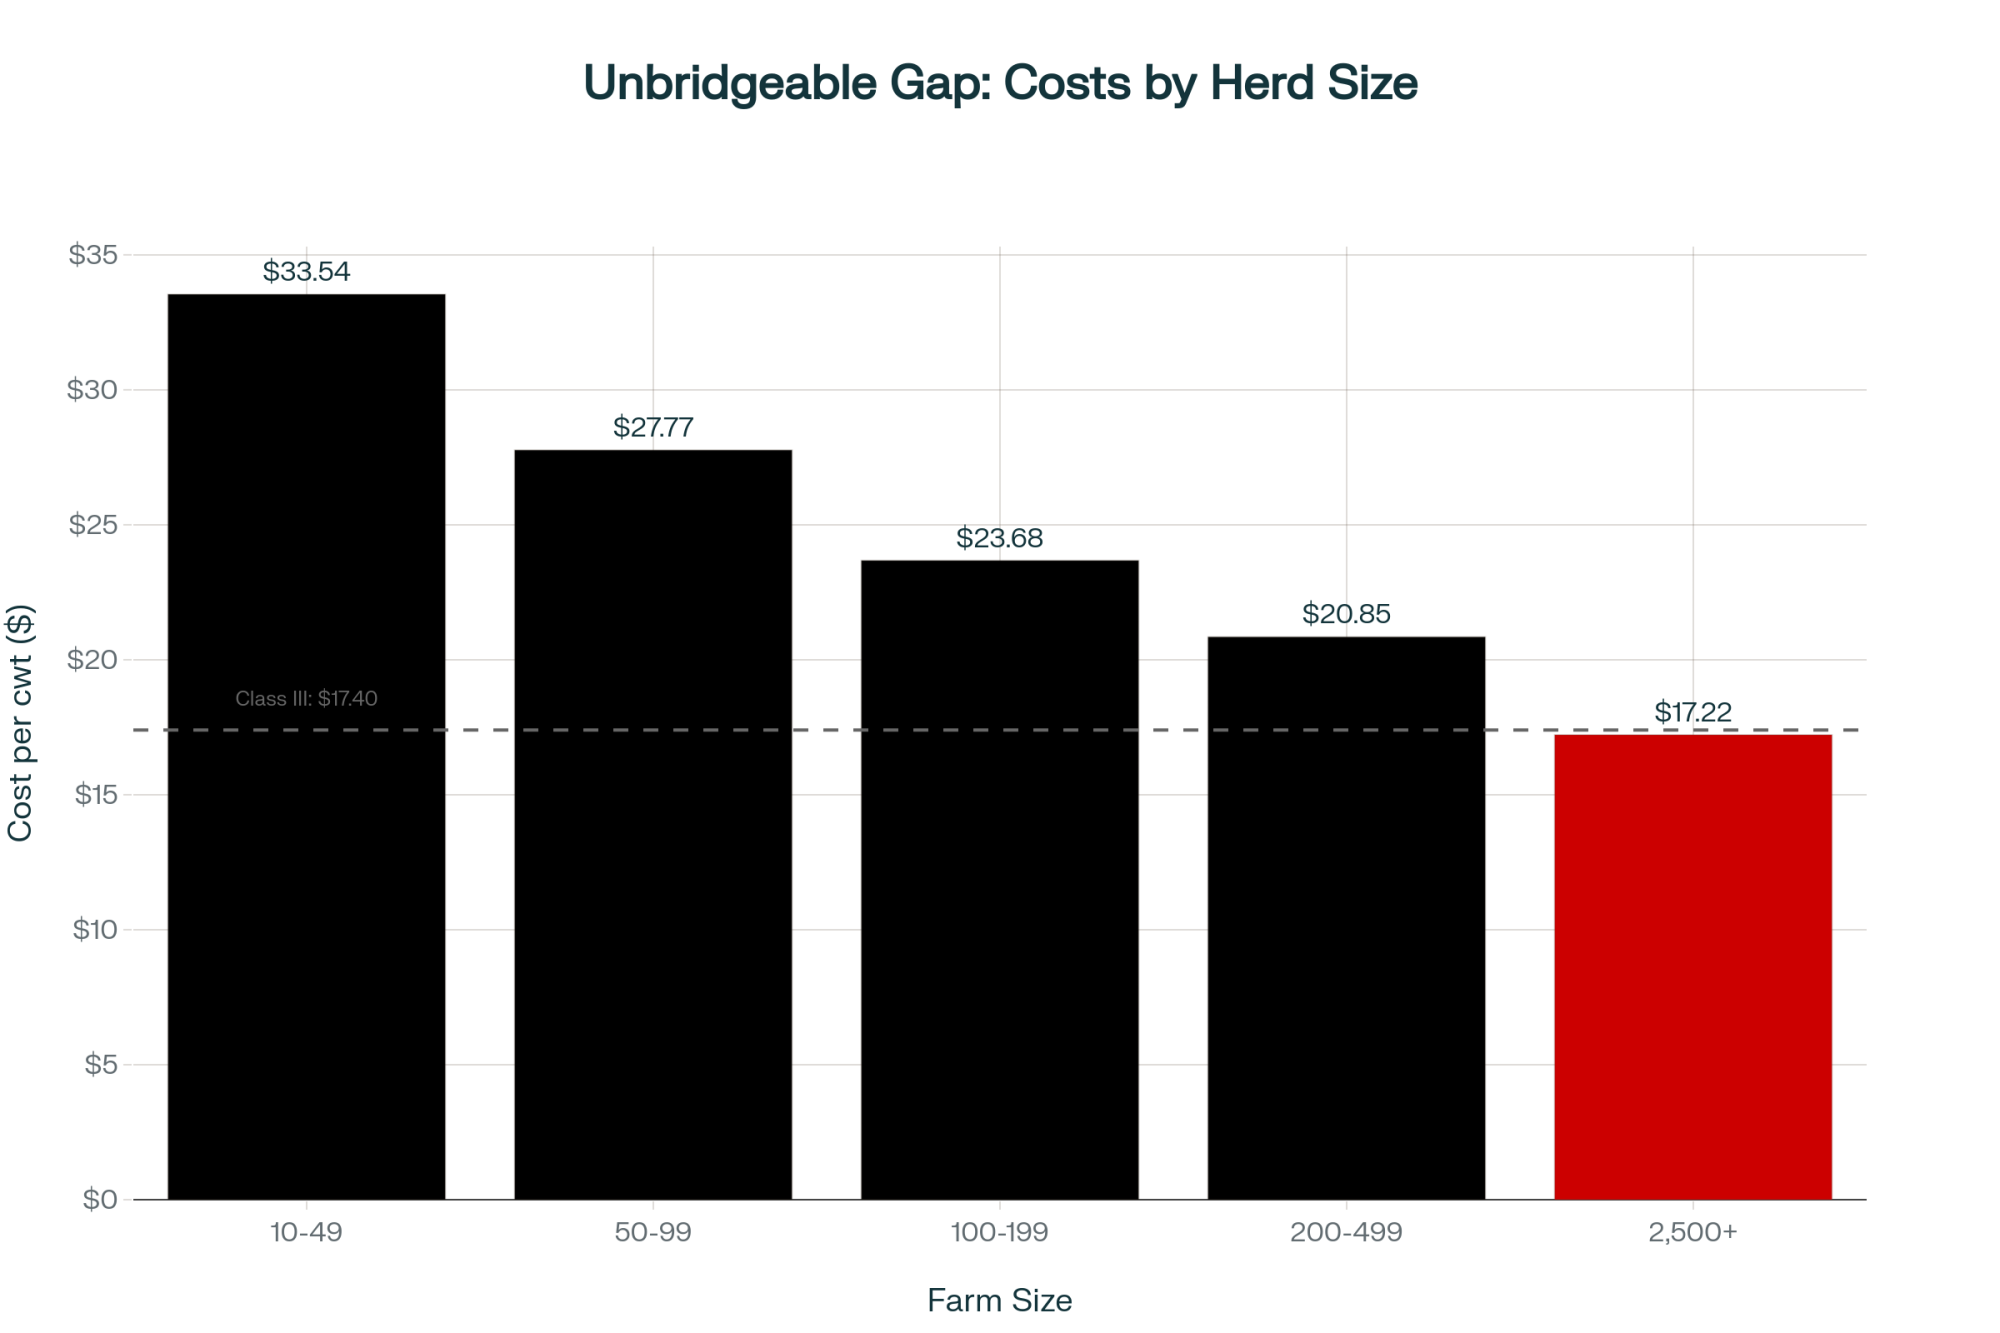
On the flip side, CoBank has documented an increase in direct supply contracts in central New York, western Michigan, parts of Idaho, California, and Texas. In those systems, large herds ship directly to cheese plants, yogurt processors, or RTD beverage plants under contracts that specify:
- A base price (usually tied to Class III or a blend).
- Detailed component premiums and penalties, including quality.
- Volume, consistency, and sometimes animal welfare or sustainability expectations.
In that setup, if a 2,500‑cow dairy lifts its protein 0.15–0.20 points, more of that value is likely to show up in their own milk check, because the contract spells out how components are rewarded. The trade‑off is that you’re tied more tightly to one buyer’s fortunes and performance metrics.
The point isn’t that co‑ops are bad and private contracts are good. It’s that the route your milk takes from the tank to the market that determines how much of the protein premium you keep.
A very practical exercise is to sit down with your milk statements and, if possible, your co‑op rep or buyer, and walk through:
- How many dollars per cwt are you’re being paid for protein today at your current level.
- What that would that look like if you were 0.15 points higher, using your own plant’s published grid or contract.
- Whether there are specific programs—cheese pools, high solids tiers, quality alliances—you could realistically qualify for if you hit certain protein and butterfat levels.
If nobody can clearly show you how your extra protein would be paid, that’s your signal to start asking harder questions before you sink a lot of money into chasing it.
Geography: Your Hidden Advantage or Built‑In Handbrake
Another factor we don’t talk about enough when discussing components is geography. You can’t pick up your farm and move it closer to a better plant, but you can factor your location into how hard you push protein.
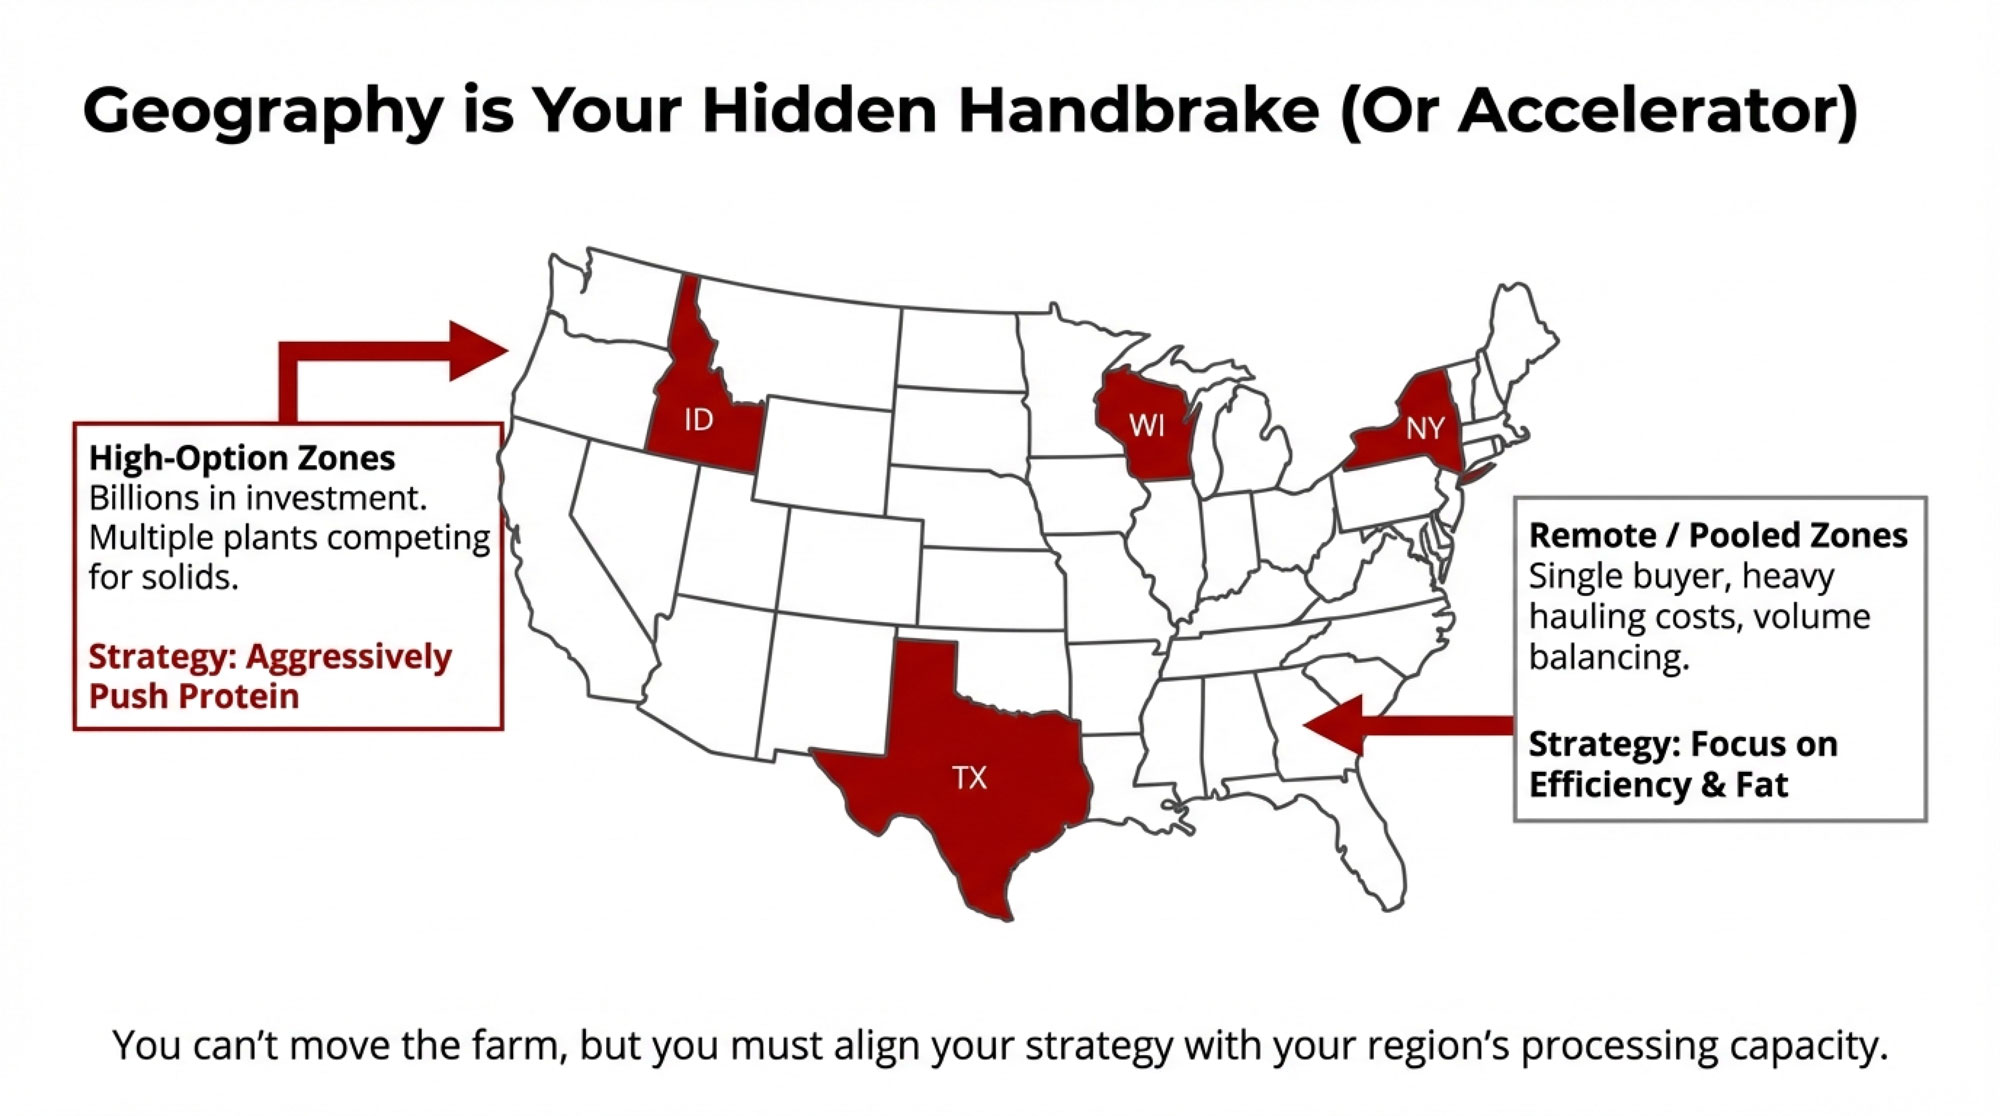
It is clear that New York is a prime example of a “high‑option” region: roughly $2.8 billion in yogurt and cultured investment, existing cheese plants, and multiple co‑ops and private buyers competing for milk. A 320‑cow freestall in central New York might be within an hour’s haul of several plants that value high‑solids milk, plus programs designed to reward it.
| Region / Scenario | Plant Density | Co-op / Pool Structure | Protein Premium (¢/cwt) | Contract Direct Premium (¢/cwt) | Competitive Intensity | Recommended Strategy |
|---|---|---|---|---|---|---|
| NY (Central/Western) | High (3–4 plants within 60 min) | Co-op + Direct options | 28–40 | 35–45 | Very High | Lean hard into protein |
| WI / Upper Midwest | High (2–3 cheese/whey plants) | Co-op dominant | 22–35 | 30–40 | High | Protein is a strong lever |
| Idaho / West | Medium (1–2 regional plants) | Mix of co-op/direct | 15–28 | 25–35 | Medium | Protein helpful, not essential |
| Remote / Single Plant | Low (1 plant, 90+ min haul) | Pool dominated | 8–12 | 18–25 | Low | Feed efficiency > protein |
| Canada (ON/QC) | Medium (regional plants + boards) | Quota/board + co-op | 18–30 | 28–38 | Medium | Protein + solids focus |
CoBank and Cheese Reporter highlight similar clusters:
- In Wisconsin and surrounding states, there’s ongoing expansion in cheese and whey capacity. High‑component milk fits those plants very well.
- In Idaho and the broader West, new cheese and powder plants have come online to serve export markets where solids are crucial.
- In Texas and the southern Plains, newer large plants are hungry for efficient, high‑solids milk from large herds.
In those zones, pushing protein has a clearer upside because multiple processors and programs value that milk and can compete for it.
Now compare that to a 450‑cow dry lot in a more remote Western area with one major plant 90 minutes away and heavy pooling. Hauling is expensive, options are thin, and the local pool may not pay enough extra for higher protein to justify an aggressive push, especially if the plant is more focused on balancing volume. For that operation, it may make more sense to:
- Keep protein in the competitive range for the pool.
- Put more emphasis on feed efficiency (components per pound of dry matter), reproductive performance, and cash flow.
- Make sure butterfat stays strong, since it still drives many checks.
In Canada, quota and provincial boards change the pricing math, but the plant reality is similar: processors still need solids to hit cheese and yogurt yields. A Quebec or Ontario herd close to major plants may have more incentive programs tied to solids than a more remote herd in a region with less processing.
The bottom line is that your plant map—distance, options, and growth trends—is just as important as your ration when you’re deciding how far to lean into protein.
Beyond the Dairy Case: Ingredient Markets and Snack Aisles
Another piece of the protein puzzle sits outside the traditional dairy section.
CoBank has reported on the growth of dairy protein ingredients—whey protein concentrate and isolate, milk protein concentrate, micellar casein—in everything from breakfast bars and cookies to “functional” beverages and meal replacements. Rising exports of U.S. whey products and skim milk powder/nonfat dry milk as global demand for high‑quality protein increases, especially in parts of Asia.
Research in Animal Frontiers and Nutrients has stressed that dairy proteins are high‑quality, complete proteins with excellent digestibility compared to many plant proteins. Those studies don’t ignore environmental concerns, but they reinforce dairy’s role in meeting protein needs, particularly for older adults and physically active people. Food companies read those papers and act on them.
So even when there’s no cow on the label, a big chunk of the protein in that “15 grams per serving” bar or drink may be coming from milk. That’s part of why you see whey plants being built and upgraded, and why processor and investor presentations keep coming back to “protein platforms” as a strategic focus.
Again, whether that shows up in your milk check depends on how your milk is pooled and priced. But the long‑term signal is that dairy protein demand isn’t fading away anytime soon.
What This Actually Means for Your Milk Check
So how does all this big‑picture stuff translate into dollars per cwt on your statement?
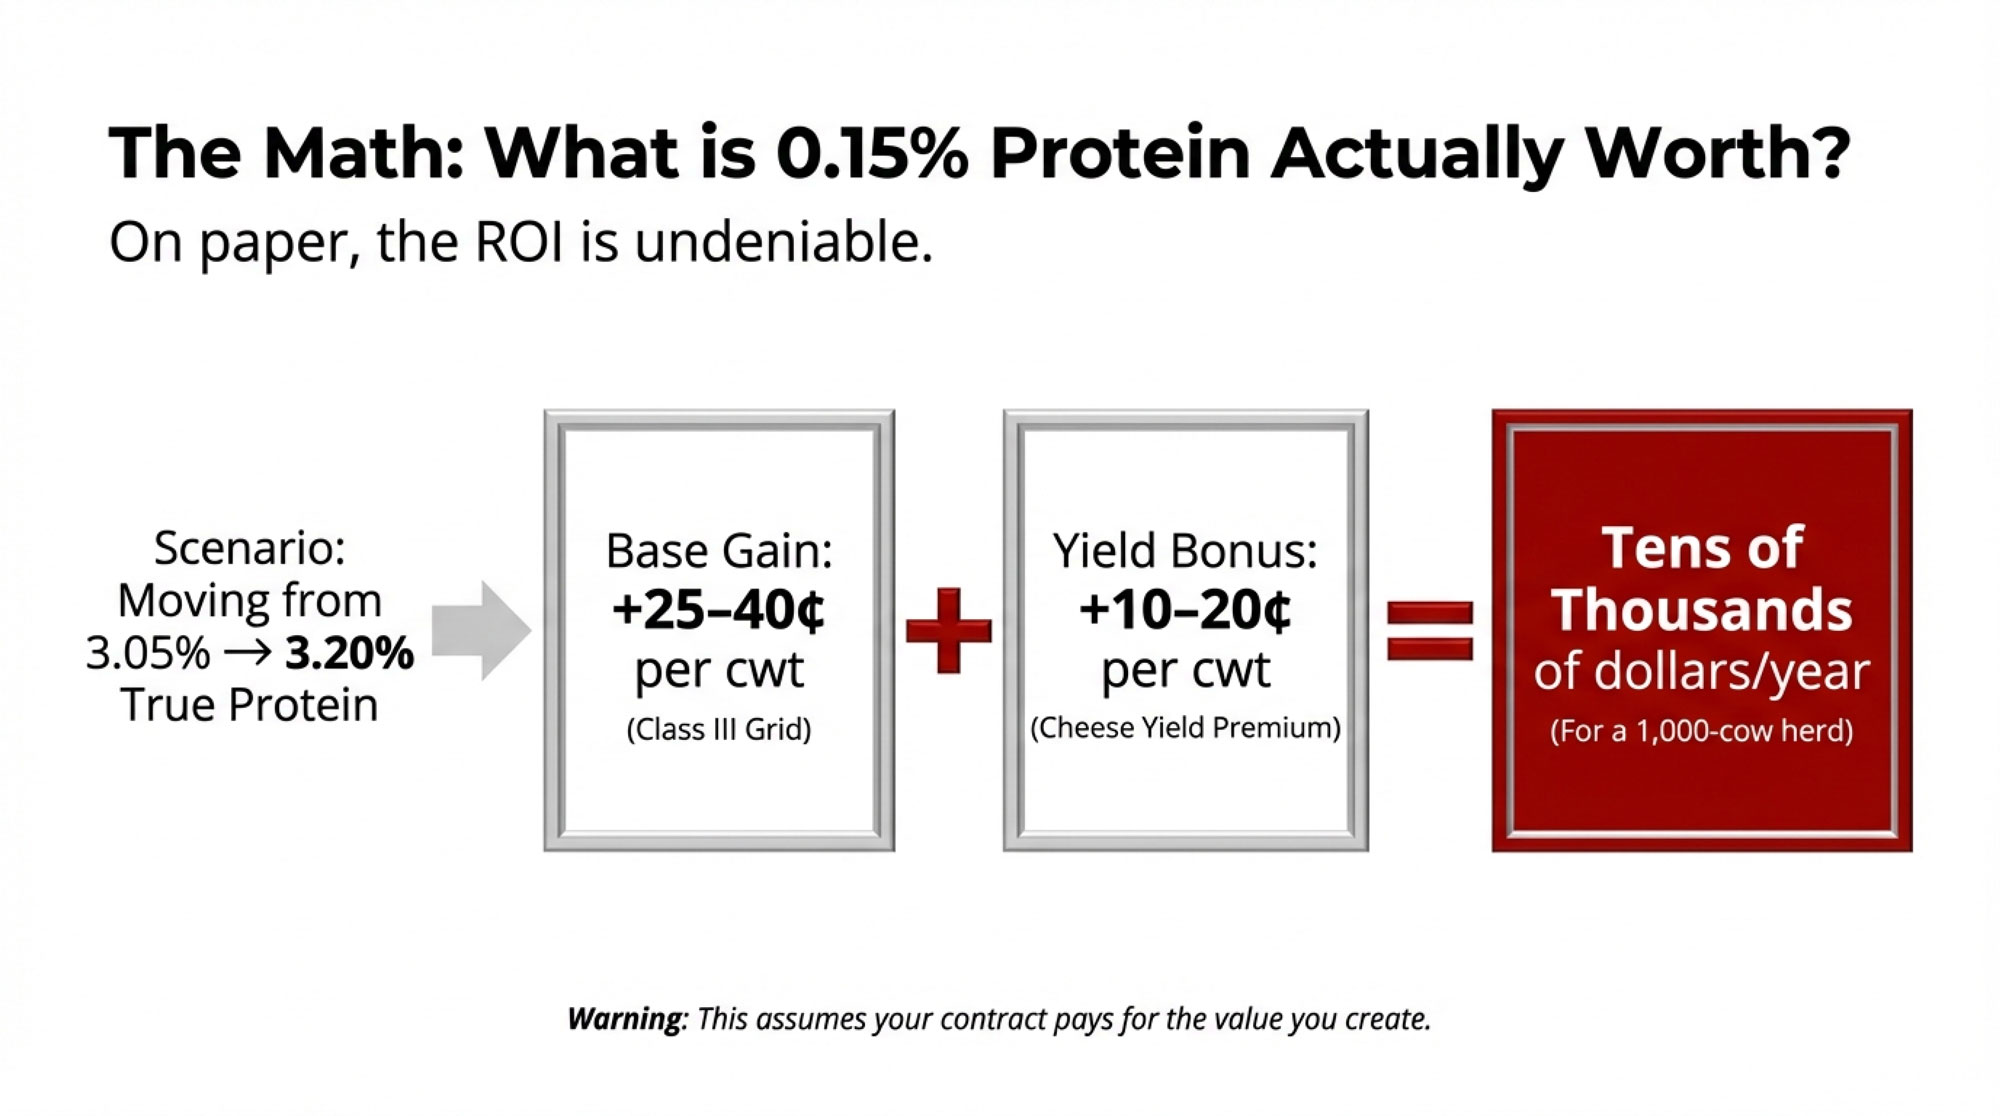
On a typical Upper Midwest Class III‑based component grid that pays for protein and butterfat directly, a move from roughly 3.05% to 3.20% true protein at 80 lb/cow/day can reasonably add 25–40 cents per cwt on the protein portion of the check, depending on the exact protein price that month. If you’re shipping to a plant that pays cheese yield bonuses based on both fat and protein, that higher protein percentage can also bump you into a better yield category worth another 10–20 cents per cwt.
| Herd Size | Current Protein % | Target Protein % | Protein Gain (points) | Protein Premium (¢/cwt) | Cheese Yield Bonus (¢/cwt) | Total Added Value (¢/cwt) | Annual Milk Volume (cwt) | Annual Revenue Gain (USD) |
|---|---|---|---|---|---|---|---|---|
| 100 cow | 3.05% | 3.20% | +0.15 | 28 | 8 | 36 | 8,000 | $2,880 |
| 320 cow | 3.08% | 3.23% | +0.15 | 30 | 10 | 40 | 25,600 | $10,240 |
| 1,000 cow | 3.10% | 3.25% | +0.15 | 32 | 12 | 44 | 80,000 | $35,200 |
On a 100‑cow herd shipping 8,000 cwt per year, that might be “only” a few thousand dollars—a nice improvement but not transformational. On a 1,000‑cow herd shipping 80,000 cwt, it can easily be tens of thousands of dollars per year if you actually capture it.
The big “if” is key:
- If you’re in a market or pool where much of that value is spread across a wide membership, your own milk check will only see part of that.
- If you’re in a direct contract or a plant‑specific program that pays explicitly for higher protein, you’re more likely to see the full impact.
That’s why it’s dangerous to talk about protein as if it’s automatically a gold mine for everyone. Where you are and how you’re paid matters as much as what your cows can do.
A 90‑Day Plan That Fits Real Herds
If you’re thinking, “We should at least know where we stand on this,” here’s a 90‑day plan that fits real life on a working dairy.
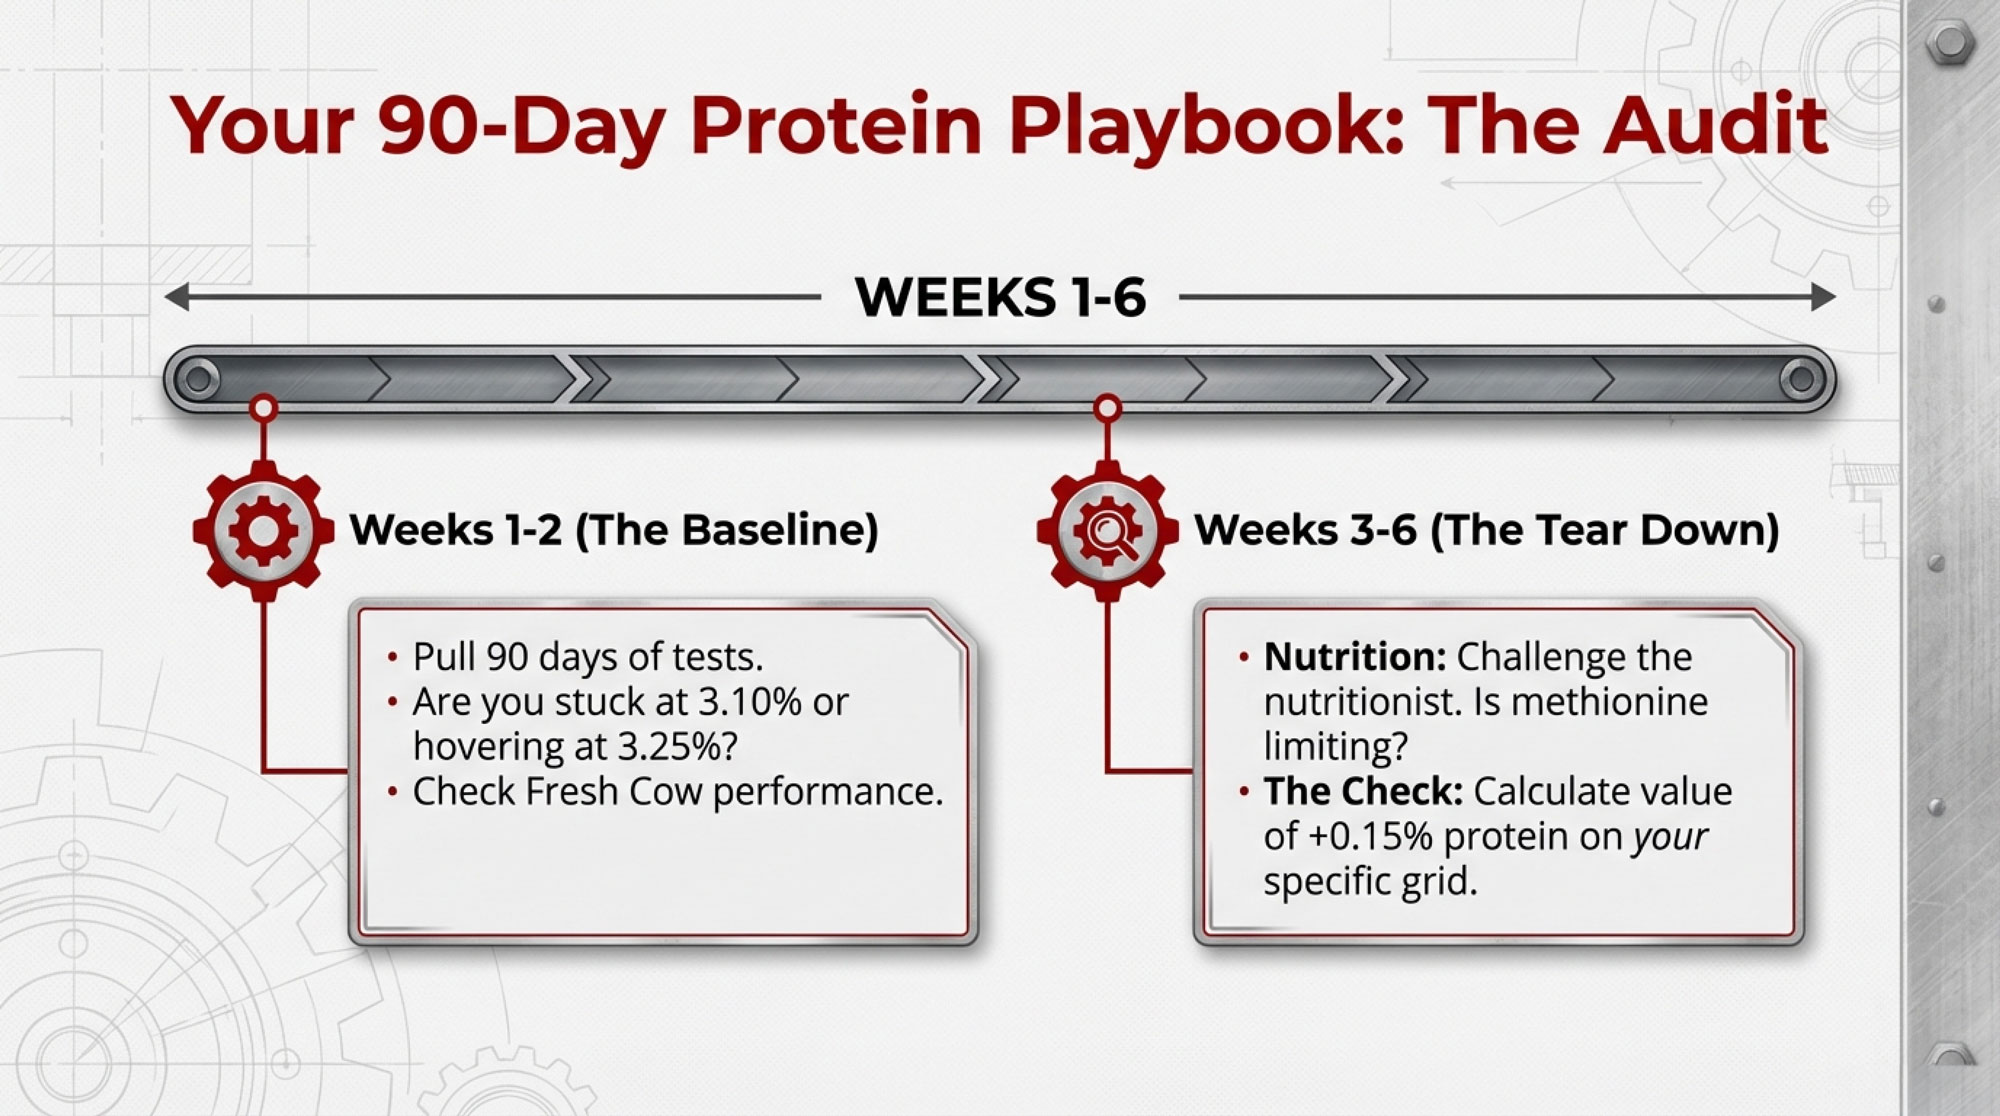
Step 1: Get Your Real Baseline (Weeks 1–2)
- Pull 60–90 days of milk testing reports.
- Write down your average true protein and butterfat, plus the range—don’t rely on memory.
- Note your herd’s average days in milk and pounds per cow over that period.
- Ask: are we consistently below 3.15–3.20% protein, or more in the 3.25–3.30% zone?
If you’re stuck under about 3.15% protein with unstable butterfat, that’s usually a forage and cow‑care issue before it’s an amino acid issue.
Step 2: Have a Focused Nutrition Strategy Session (Weeks 3–4)
Sit down with your nutritionist when neither of you is in a rush. Bring the numbers.
- Ask if they believe methionine is actually limiting in your current diet, based on your forage tests and production. Ask them to show you where in the model they see that.
- Discuss whether an RPM or methionine dipeptide product makes sense for your herd, referencing the published 7.5–12.5 g/cow/day “sweet spot” from the Wei meta‑analysis as a starting point—not a rule.
- Insist on specificity: if we add 10 g/cow/day of this product, what exactly are we pulling back on—soybean meal, canola, bypass protein—so ration cost per cwt is neutral or close to it?
Define success up front: for many herds, a realistic target is a 0.08–0.12 percentage point increase in protein in 60–90 days without hurting butterfat or cow health.
Step 3: Tear Down Your Milk Check (Weeks 4–6)
Get your latest milk statements and, if you can, invite your co‑op field rep or plant buyer to walk through them with you.
- Identify exactly how many dollars per cwt you’re currently earning from protein at your current level.
- Calculate what your check would look like if your true protein were 0.15 points higher, using your plant’s real grid or contract.
- Ask about plant‑specific programs: cheese pools, high‑solids tiers, or quality alliances that pay more for the kind of milk you could produce.
If the difference between your current protein and a realistic target is worth less than 10–15 cents per cwt under your structure, you may want to focus your next dollar somewhere else first. If it’s worth 25–40 cents per cwt and you’re within reach, protein should move up your priority list.

Step 4: Recalibrate Your Sire Strategy (Weeks 6–8)
Pull your current sire lineup and any bull proofs you’re using:
- Look at PTA Protein (lbs) and protein% deviation alongside PTA Fat and fat%.
- Check NM
, and health traits like SCS, DPR, and Productive Life (or their equivalents).
Then talk with your AI rep:
- Ask which bulls or mating strategies they’d recommend for a herd shipping mainly to cheese plants—or high‑protein yogurts—where protein percentage really matters.
- Ask which bulls make more sense for a pooled, volume‑oriented market where protein lbs matter but % may not be heavily rewarded.
- Ask how long it will realistically take for those genetic changes to show up in your bulk tank, given your culling and replacement rates.
If you’ve been breeding in “autopilot NM$” mode, this is the time to tweak your filters so you’re breeding for the pay formula you actually face, not the one you faced five years ago.
Step 5: Make a Conscious Strategic Call (Weeks 10–12)
By the end of 90 days, you should have:
- A clear picture of your current protein and butterfat performance.
- A grounded sense of what your herd can do with sensible nutrition and cow care.
- Hard numbers on what extra protein is worth under your specific milk pay structure.
- A refreshed sire plan that either leans into protein or deliberately doesn’t.
Then you make a conscious choice.
If you’re in a region with multiple solids‑focused plants, clear premiums, and a herd close to the thresholds, it probably makes sense to treat protein as a major strategic lever for the next three to five years.
If you’re in a single‑plant, heavily pooled environment where an extra 0.15 points of protein doesn’t move the needle much, you may decide to keep protein respectable but put more energy into feed efficiency, robot utilization, debt management, or labor—things that may offer a better return under your conditions.
There isn’t one right answer. But what’s become pretty obvious is that protein isn’t just a rounding error anymore. Consumers, guidelines, processors, and indexes have all moved. You can either let that movement happen to you, or you can decide where protein fits in your plan—with your plant map in one hand, your proofs and ration in the other, and your milk check right there on the table.
Key Takeaways
- Protein demand is surging: 70% of Americans are actively seeking protein (IFIC 2025), RTD dairy shakes have grown from $4.7B to $8.1B in 4 years (CoBank), and new dietary guidelines support higher intakes.
- Processors are rebuilding around solids: Billions have gone into U.S. cheese, whey, yogurt, and cultured plants—they want “right milk” that hits yield targets, not just volume.
- The milk check math is real but contract-dependent: A 0.15-point protein gain can add 25–40¢/cwt on Class III grids, but co-op pooling often dilutes it; know your pay formula before you invest.
- Nutrition works—if basics are solid first: Rumen-protected methionine at 7.5–12.5 g/cow/day can lift protein by 0.10–0.20 points, but only in herds with strong forage and fresh-cow management already in place.
- Genetics shifted in April 2025—adjust your sire filters: NM$ now weights fat more heavily; cheese-market herds should prioritize CM$ or custom indexes and look for bulls with strong protein % deviation alongside health traits.
Complete references and supporting documentation are available upon request by contacting the editorial team at editor@thebullvine.com.
Learn More
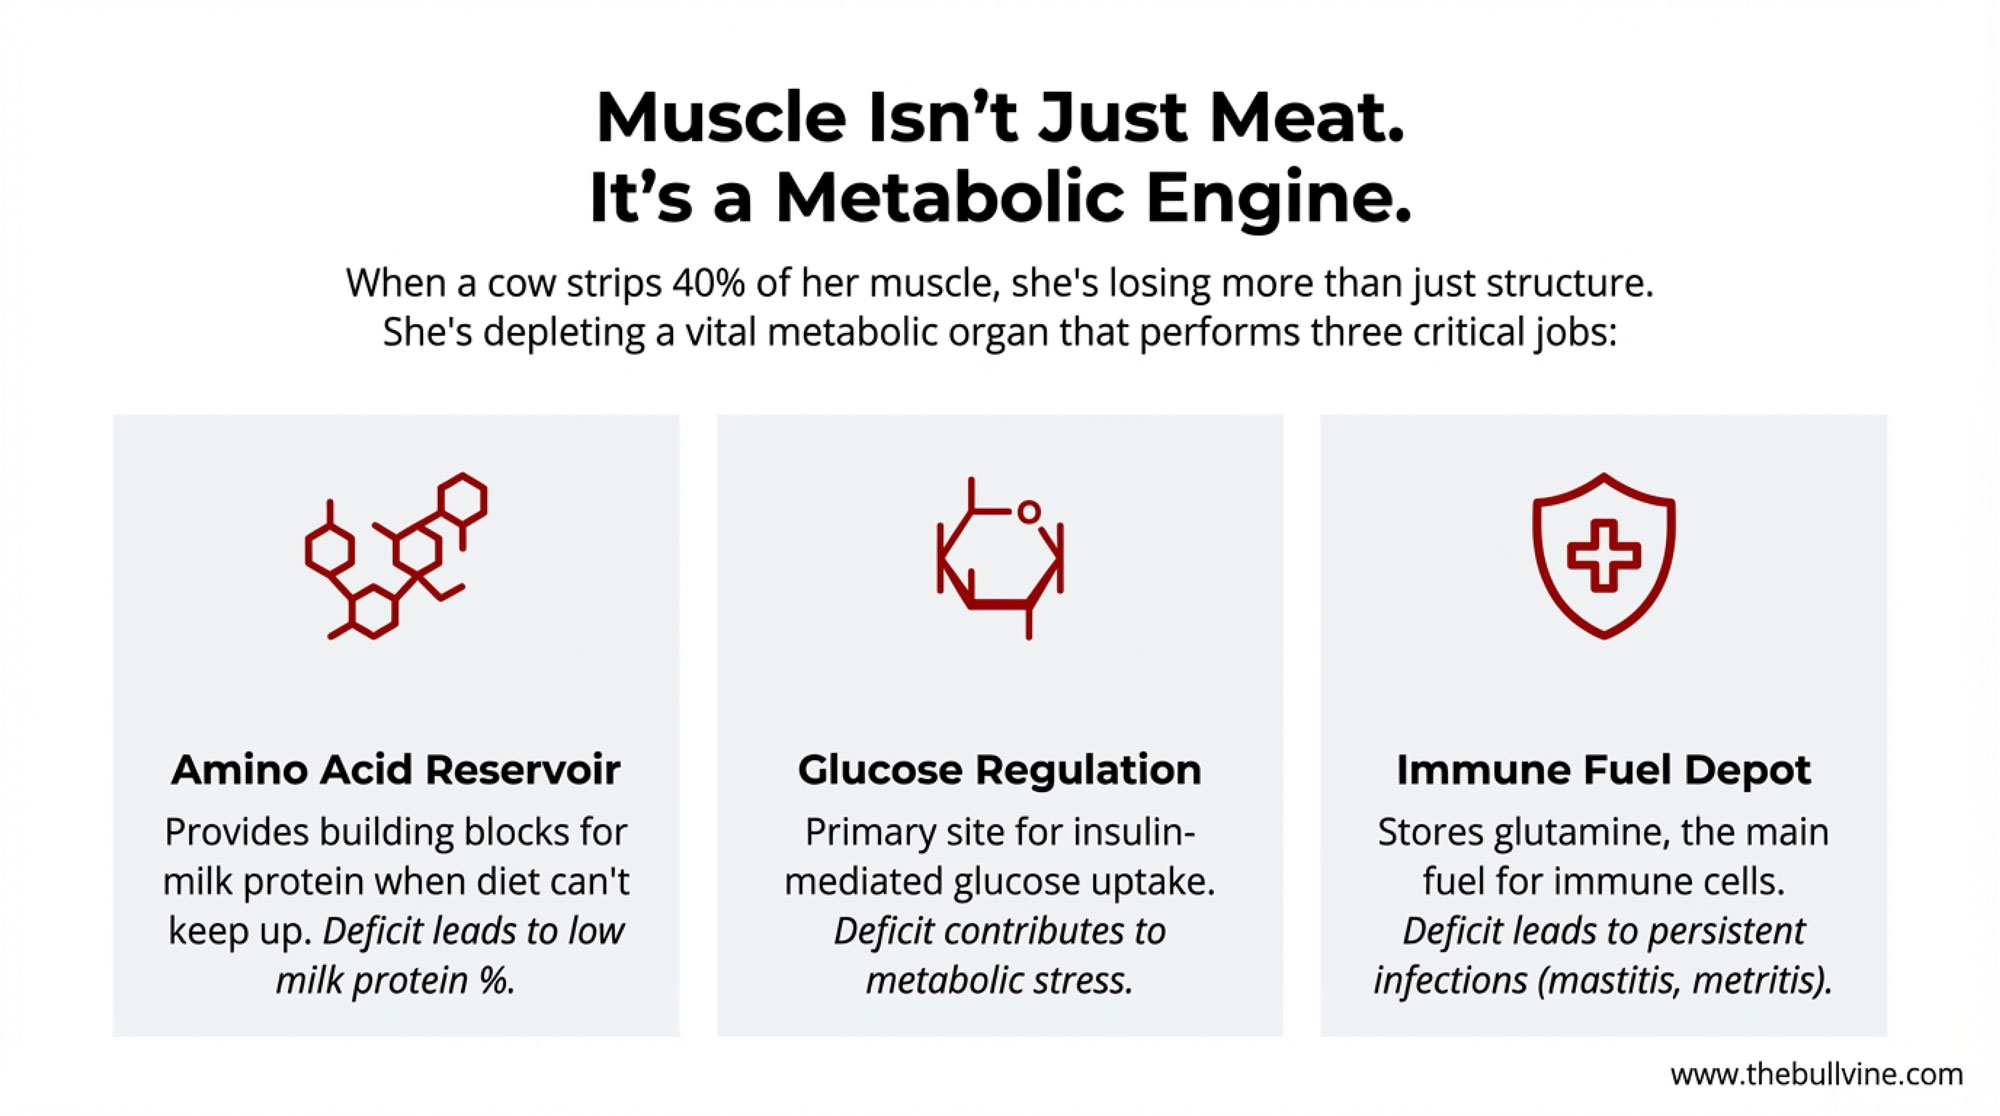
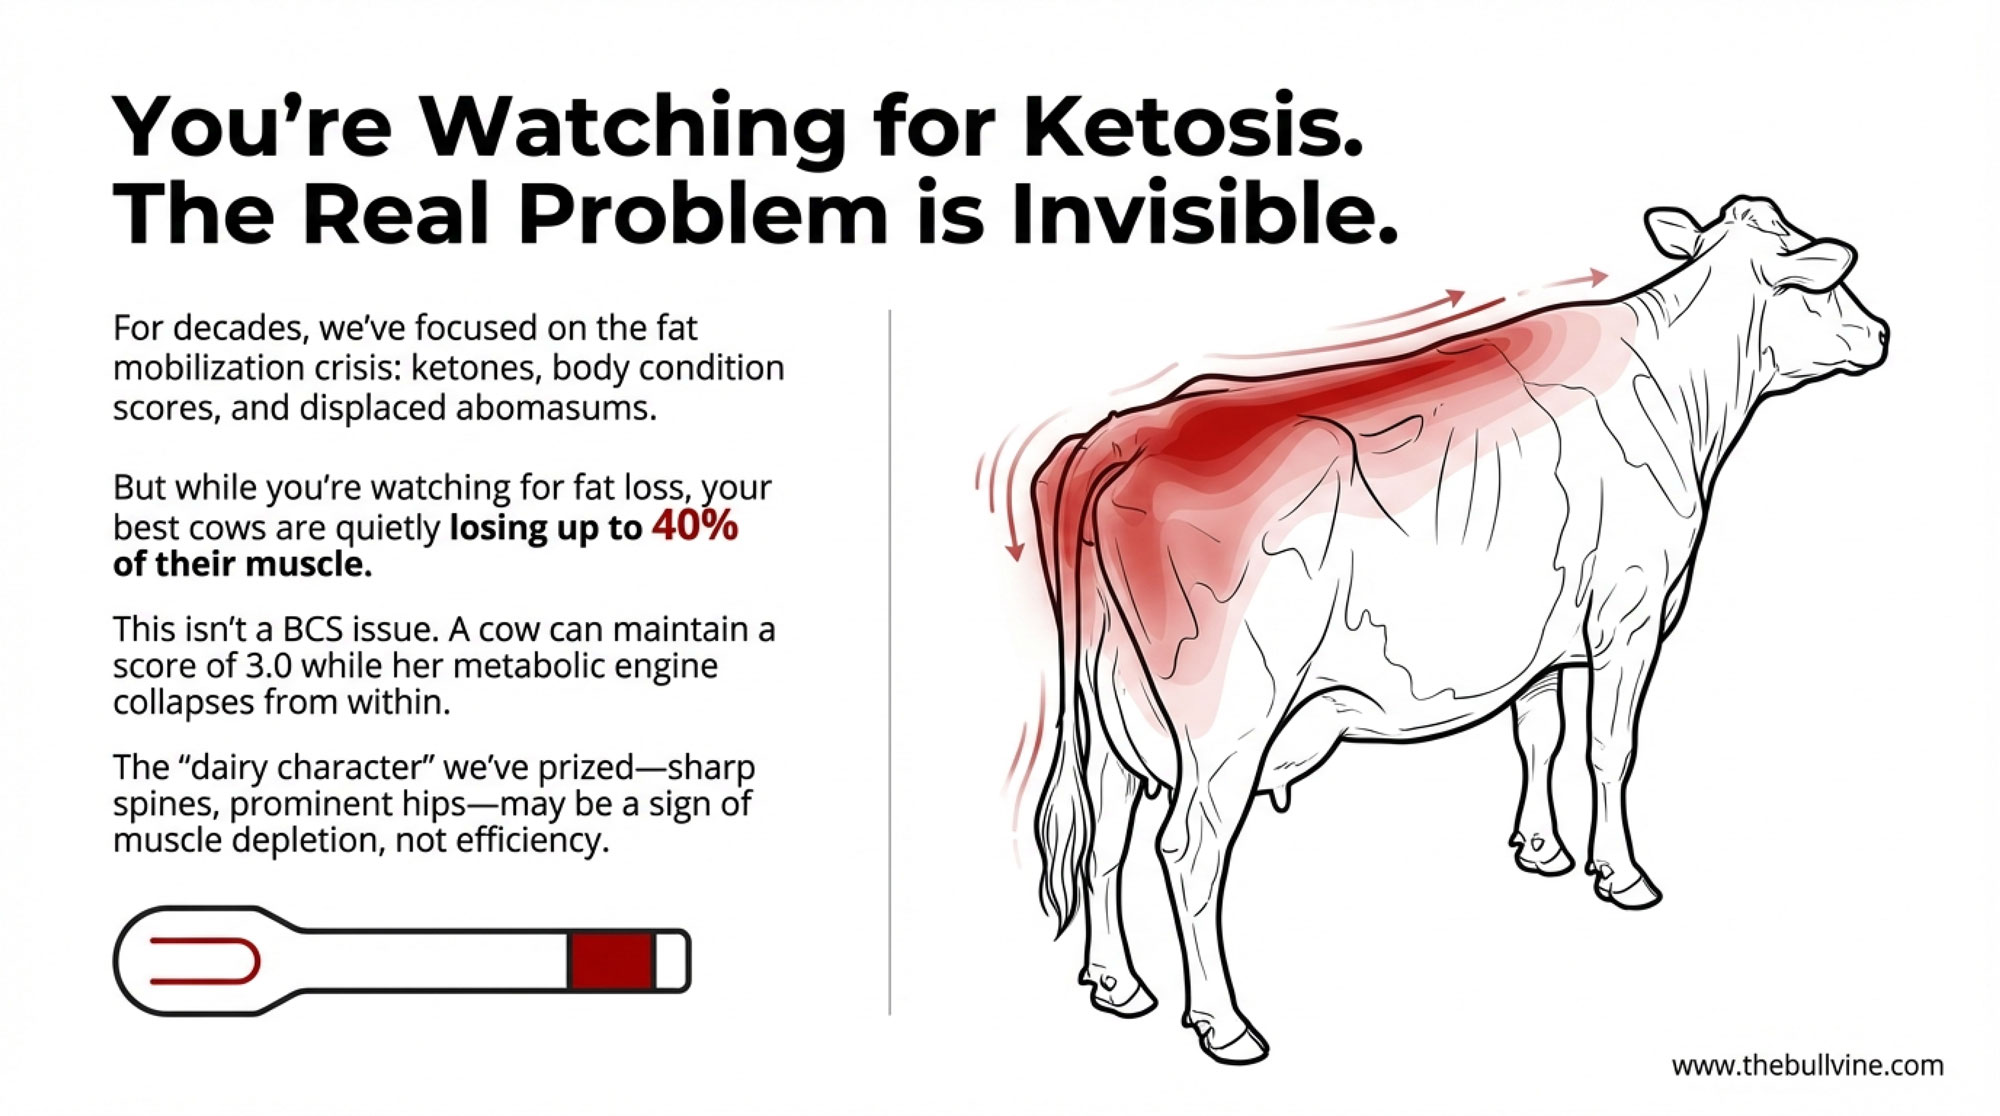
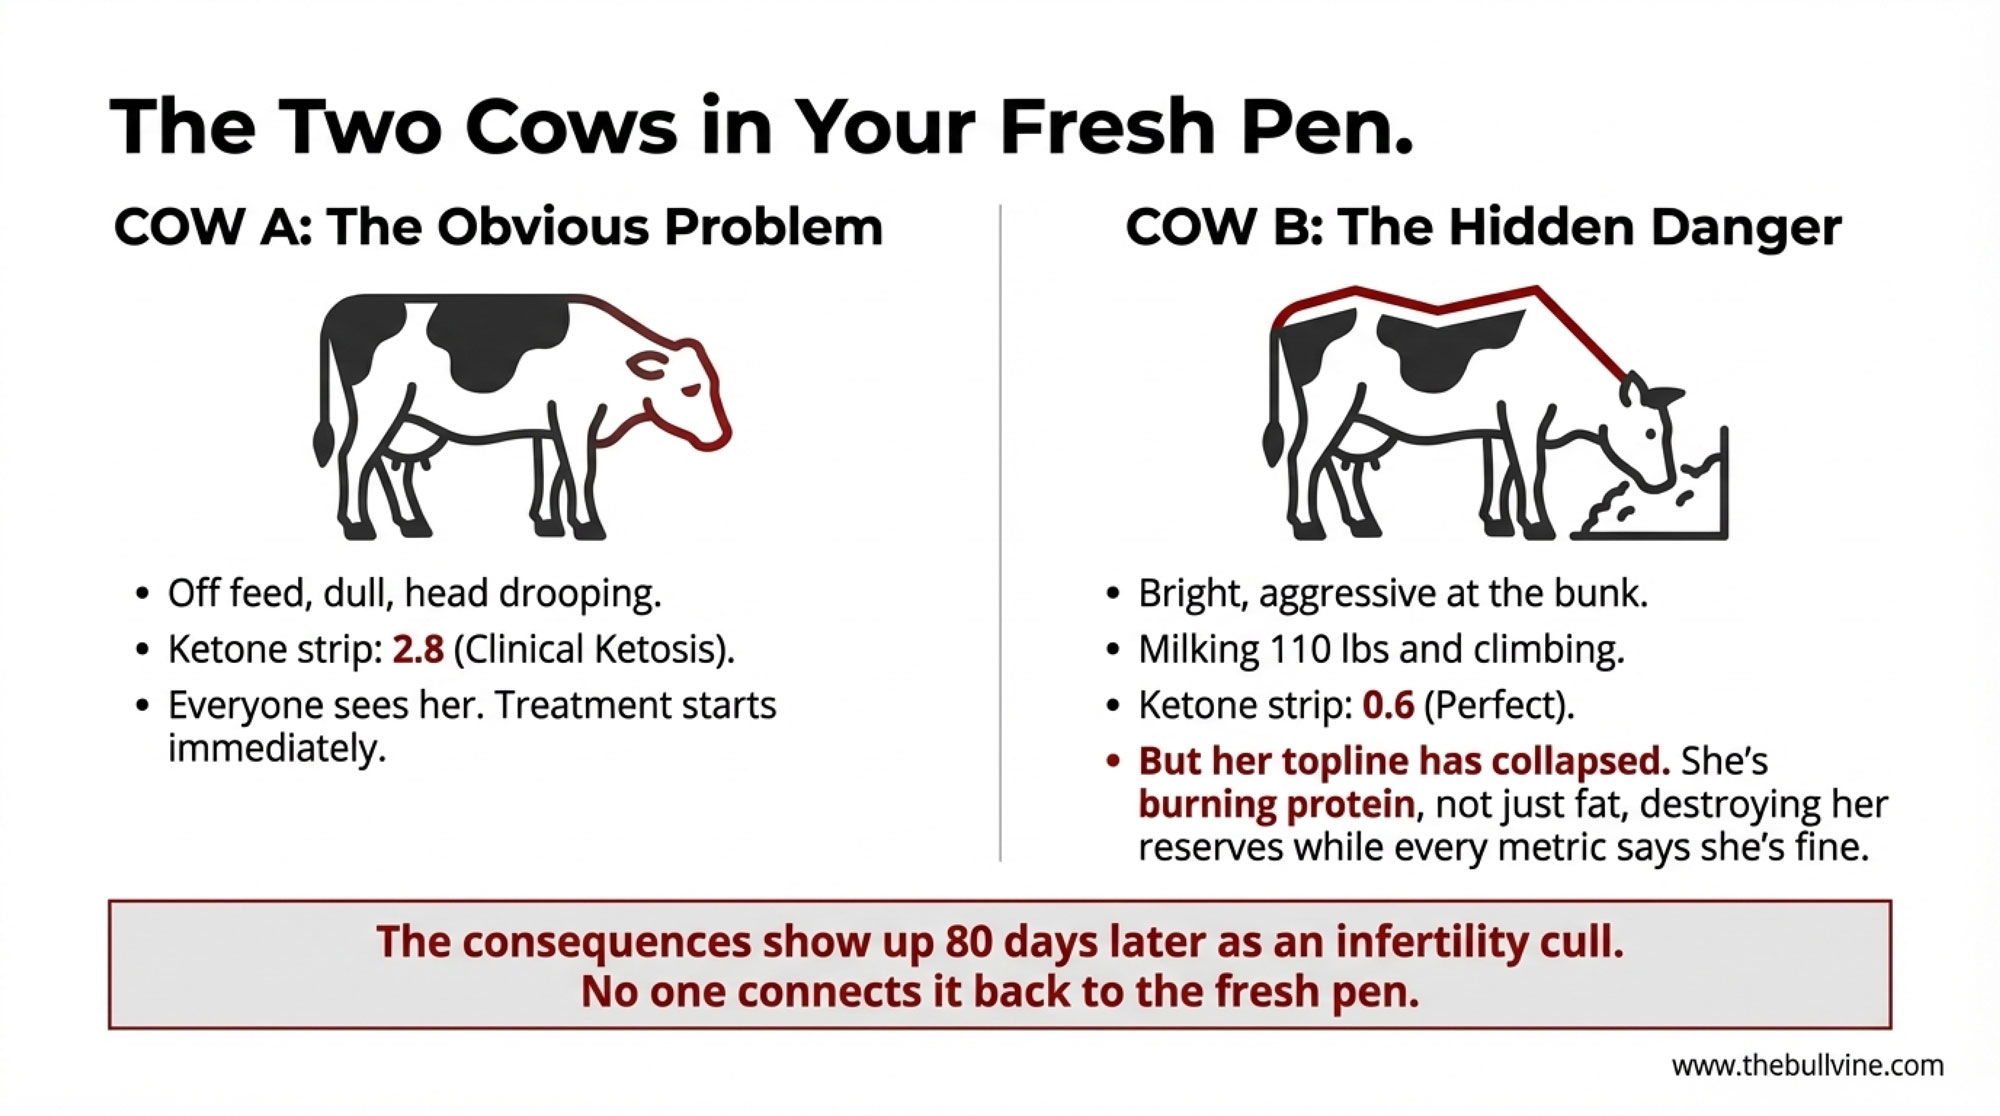
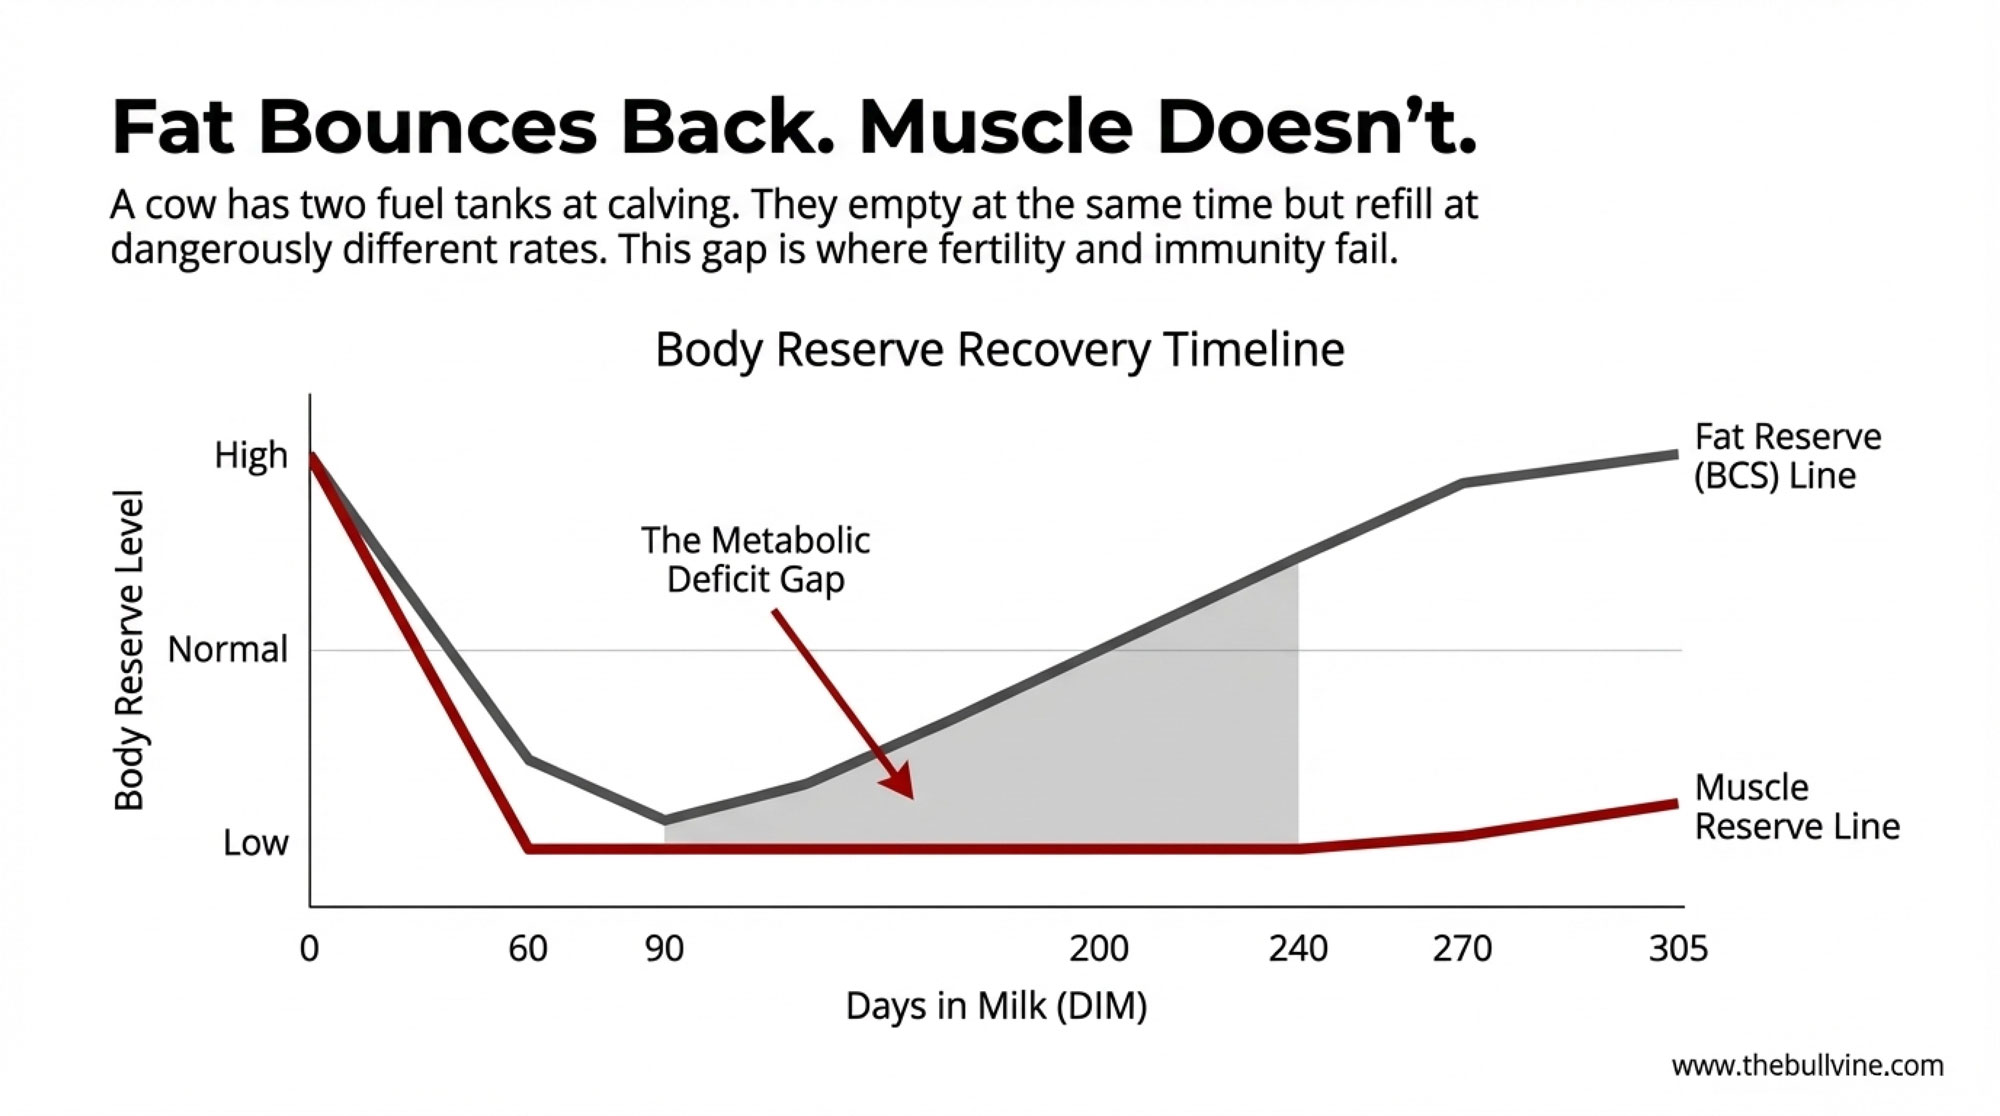
- How Your Ketosis Cut‑Point Is Leaking $25,000 a Year – And the Fresh Cow Playbook to Stop It – Capture an extra $25,000 by plugging subclinical ketosis leaks that erode protein potential. This playbook reveals how precision monitoring thresholds protect fresh cow peaks, ensuring your herd is metabolically ready to capture full amino acid value.
- $11 Billion Dairy Rush: Is Your Milk Cheque Telling You You’re in a Growth Corridor or a Dead Zone? – Identify whether your operation is positioned in a high-value growth corridor or a stagnant dead zone. This analysis exposes the impact of processor investment and basis shifts, arming you to make data-backed site and expansion decisions.
- Unlock $700 Per Cow: The Rumen Microbiome Strategy That Fixes Hidden Feed Efficiency Losses – Gain a massive competitive advantage by fixing hidden feed efficiency leaks through rumen microbiome mapping. This deep dive reveals how precision biology delivers up to $700 per cow in additional margin without increasing your forage inventory.
 The Sunday Read Dairy Professionals Don’t Skip.
Every week, thousands of producers, breeders, and industry insiders open Bullvine Weekly for genetics insights, market shifts, and profit strategies they won’t find anywhere else. One email. Five minutes. Smarter decisions all week.