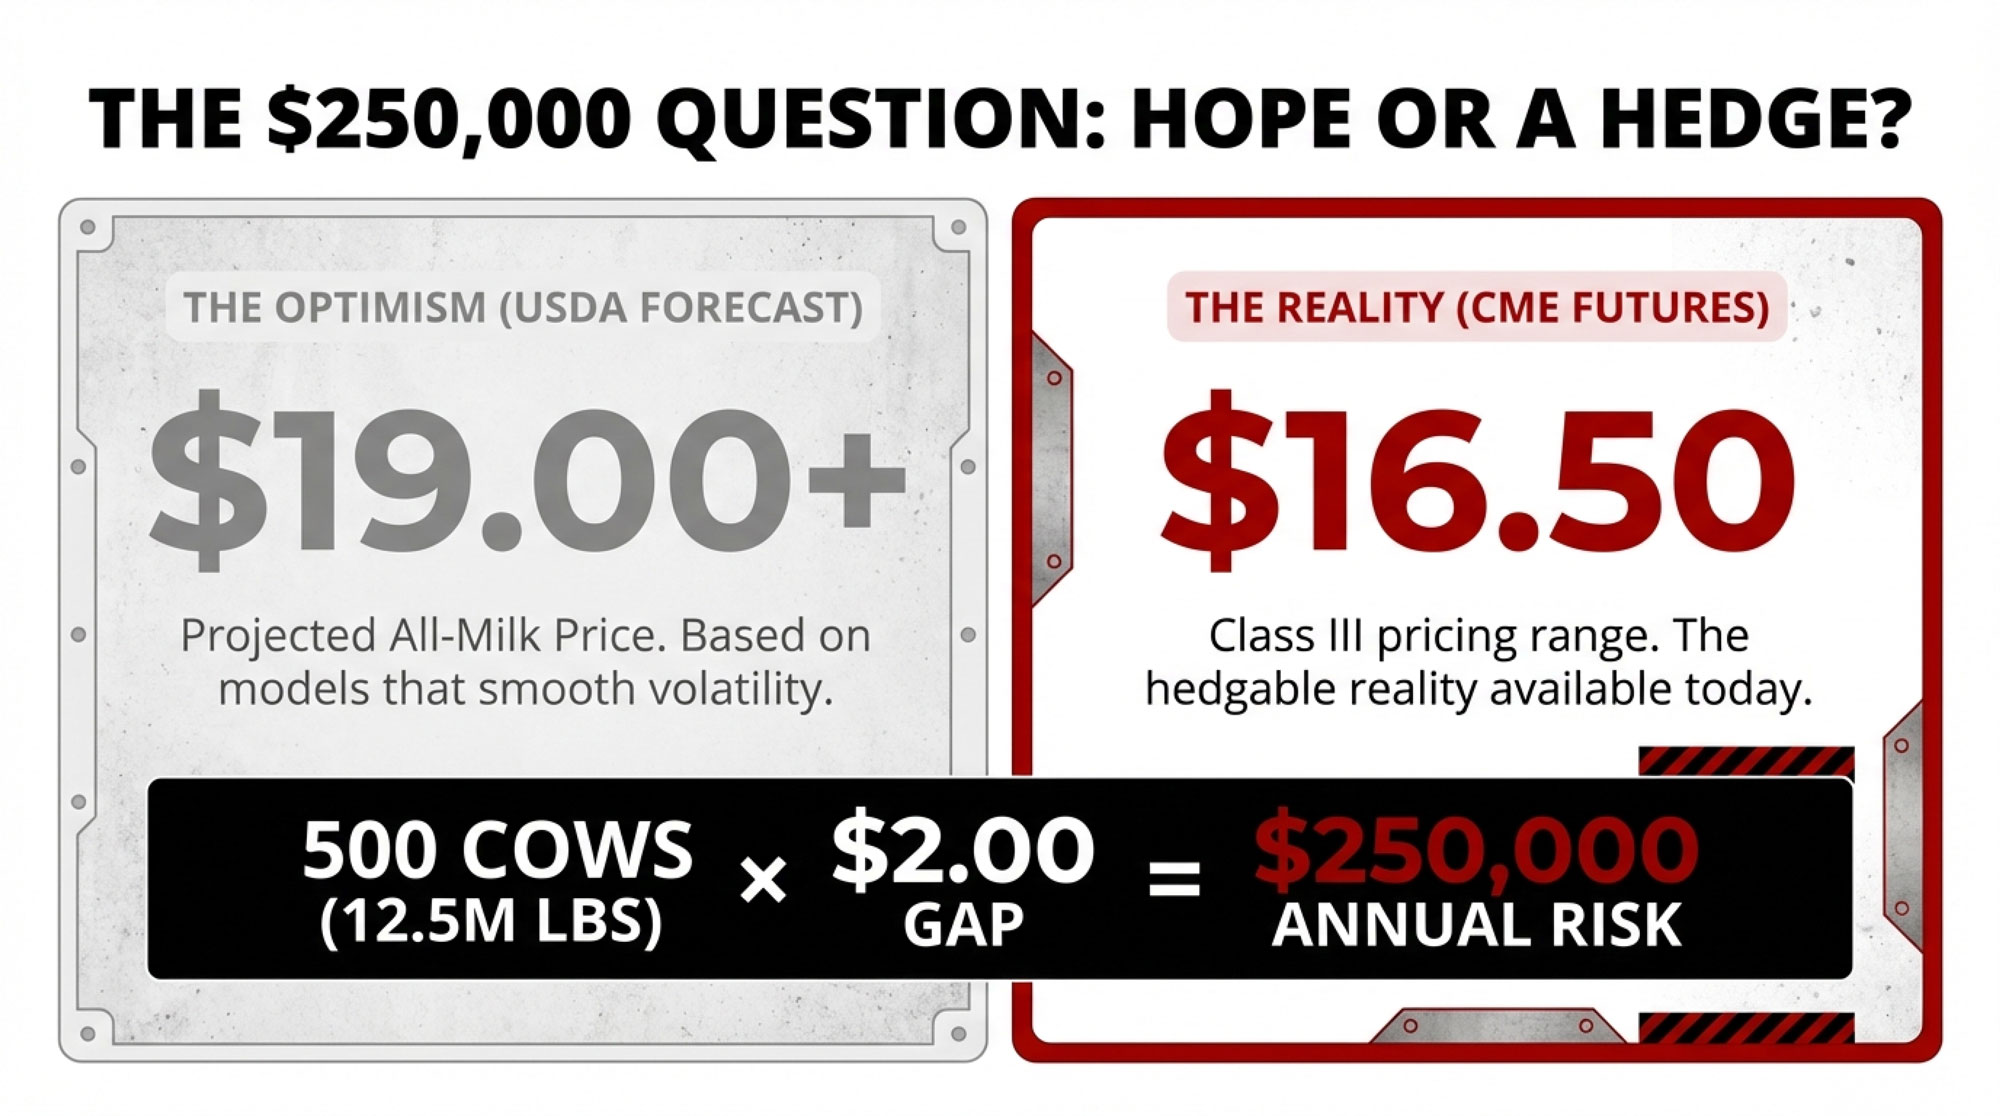
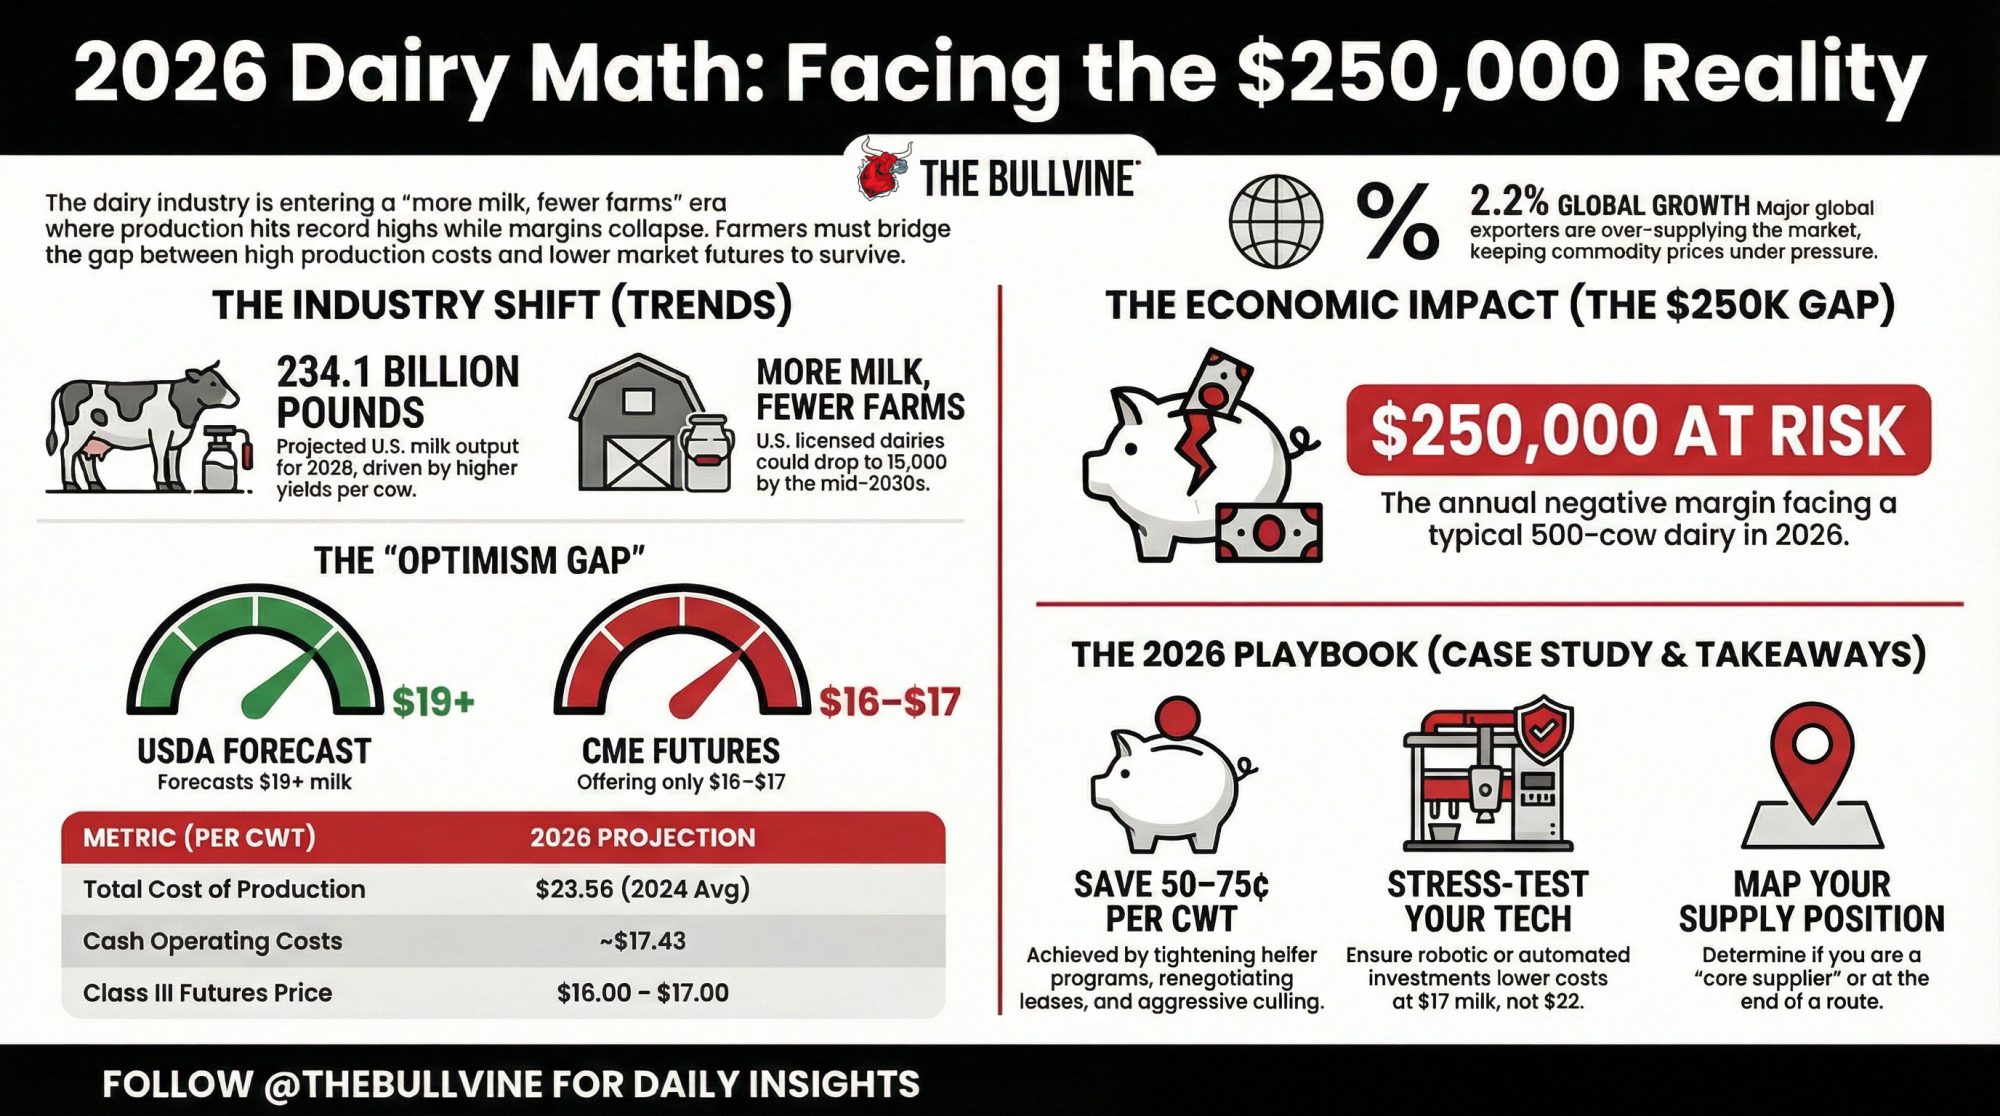
500-cow dairy. $17 Class III. $250,000 negative margin. That’s 2026 math for farms still budgeting at USDA’s $19 forecast. The gap is real. Is your plan?
Executive Summary: For 2026, the core math is brutal: many 500‑cow dairies face up to a $250,000 annual margin gap between their full cost of production and what 2026 Class III futures will actually pay. USDA projects U.S. milk output climbing to about 231.4 billion pounds in 2025 and 234.1 billion pounds in 2026, even as licensed dairy herds keep dropping, confirming we’re in a “more milk, fewer farms” era, not a supply crunch. Rabobank’s Q4 Big‑7 analysis shows global exporters finished 2025 around 2.2 percent ahead of 2024 on a milk‑solids basis, so the world is long on milk and short on comfortable margins. Using farmdoc’s detailed cost work, the article walks through how full costs in the low‑$20s per hundredweight collide with $16–17 futures and what that means in dollars per farm, not just theory. A 600‑cow Wisconsin case study then illustrates how tightening heifer programs, sharpening culling, and revisiting land and lease costs can pull breakeven closer to realistic price levels. The piece closes with a concrete 2026 playbook—know your true cost, map your position in your processor’s supply network, stress‑test technology and expansion plans, and decide whether to grow, hold, or exit before the market decides for you.

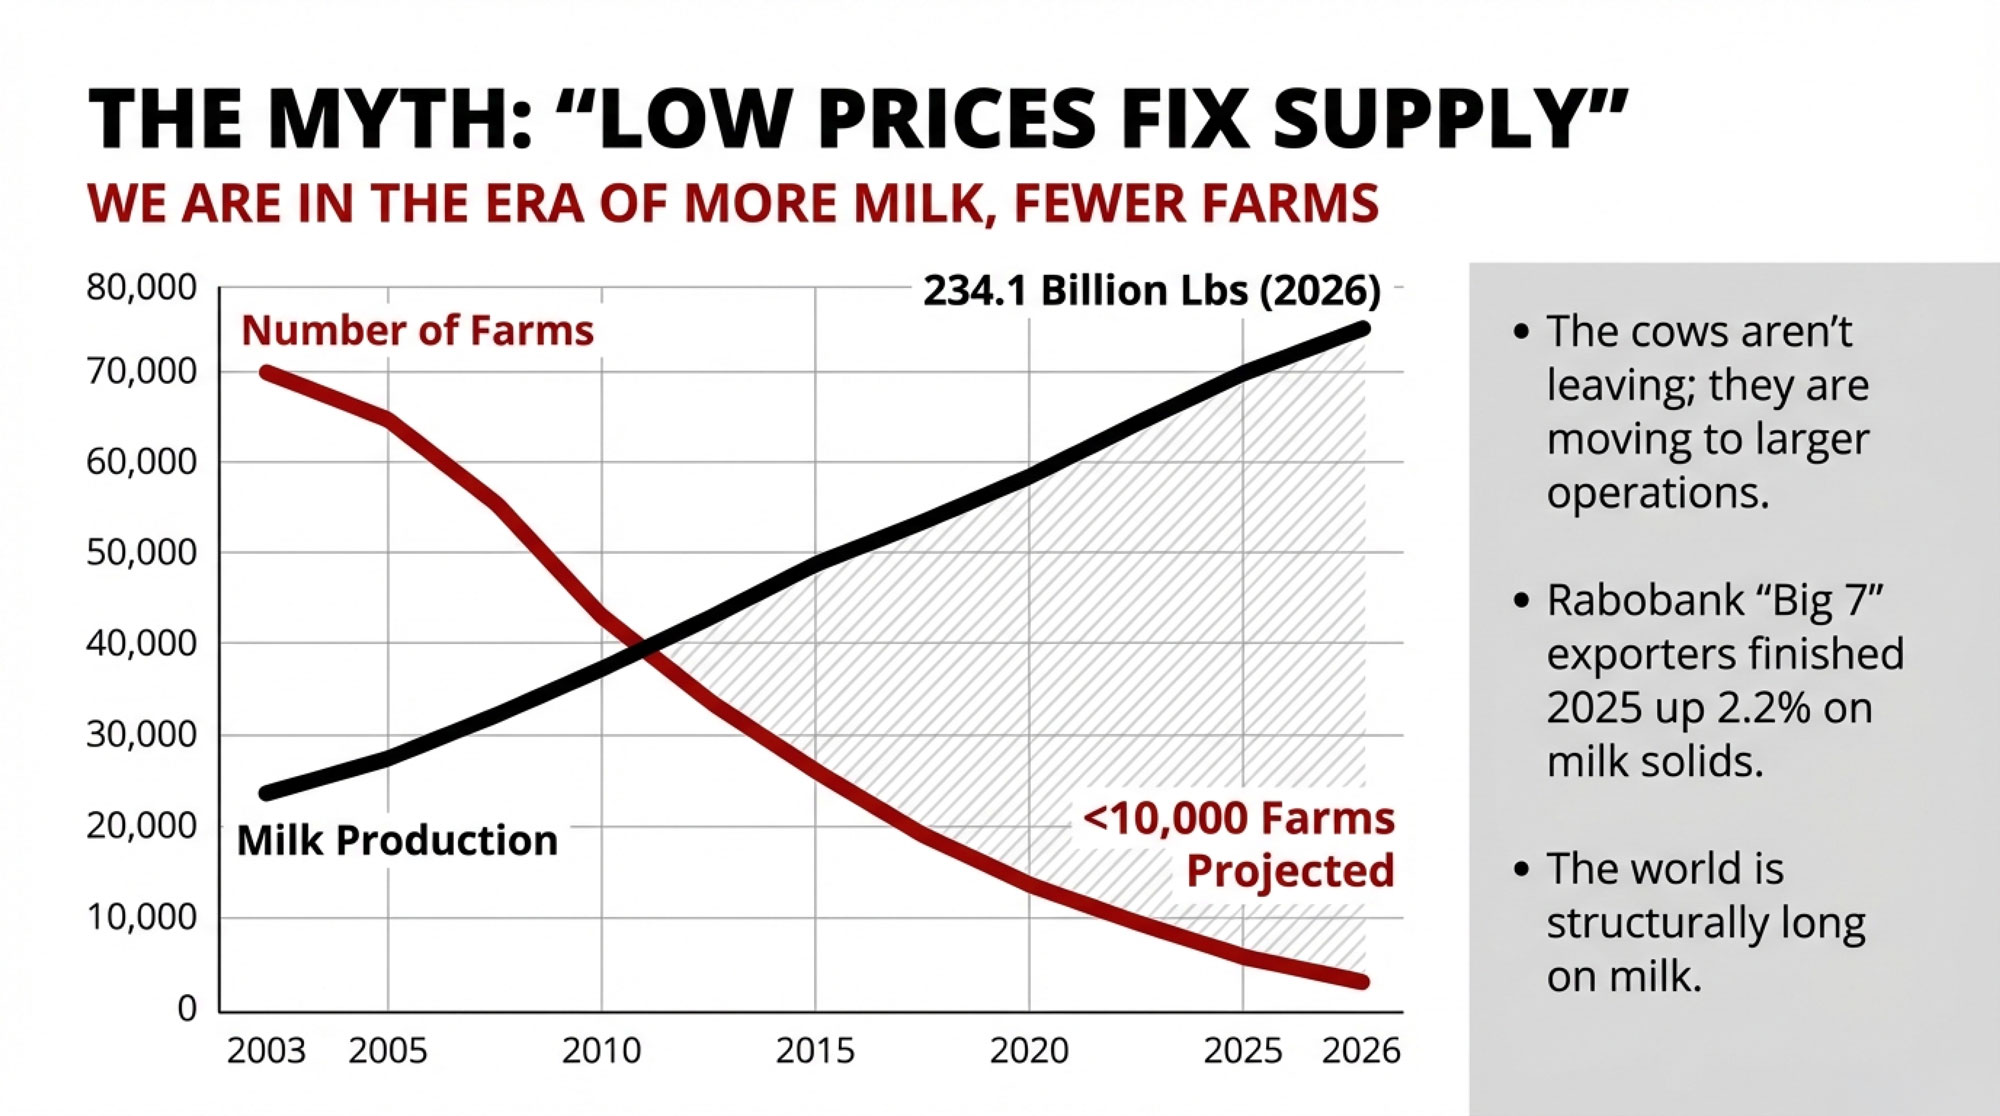
If you sit down with the latest milk report and a cup of coffee, one thing really jumps out: we’re producing more milk than ever, but fewer farms are doing the work. USDA’s latest Livestock, Dairy, and Poultry Outlook puts U.S. milk production at about 231.4 billion pounds in 2025 and roughly 234.1 billion pounds in 2026, driven by higher yields per cow and modest herd growth in key dairy regions like the Upper Midwest, High Plains, and West. It’s worth noting that these gains come on top of already high production, not a rebound from a crash.
What’s interesting is what happens when you overlay that with herd numbers. USDA and its Economic Research Service have shown that licensed U.S. dairy herds fell from just over 70,000 in 2003 to around 34,000 by 2019—a drop of more than 50 percent—while total milk output hit record levels. More recent compilations of USDA data suggest the national dairy herd still averaged about 9.34 million cows in 2024, very close to recent years. So the story isn’t “less milk.” It’s “fewer farms producing more milk.”
What farmers are finding is that 2026 isn’t just another down year in the usual cycle. It’s part of a broader reset in who produces milk, where it gets produced, and what kind of financial structure sits under the barns and dry lot systems that do the work. Let’s walk through that together, the way we’d talk it through at a producer meeting or over coffee at the kitchen table.
| Month | USDA Forecast | CME Class III Futures | $ Gap (500-cow herd @ 12.5M lbs/yr) |
|---|---|---|---|
| Jan 2025 | $21.50 | $17.25 | $259,375 |
| Apr 2025 | $21.00 | $16.75 | $265,625 |
| Jul 2025 | $20.50 | $16.50 | $250,000 |
| Oct 2025 | $19.75 | $16.25 | $218,750 |
| Jan 2026 | $19.25 | $17.00 | $140,625 |
| Apr 2026 | $19.00 | $16.75 | $156,250 |
| Jul 2026 | $18.75 | $16.50 | $140,625 |
| Oct 2026 | $18.50 | $16.25 | $140,625 |
Looking at This Trend: More Milk, Softer Prices, Heavier Surplus
Looking at this trend from altitude, the first thing to square is production versus price.
USDA’s economists, in their December 2025 and January 2026 outlooks, raised milk production forecasts but trimmed price expectations. Their latest numbers put the 2025 U.S. all‑milk price a little above $21 per hundredweight, and the 2026 all‑milk forecast in the high‑$19 range, after cutting it by more than a dollar from earlier in 2025 as production estimates came up. At the same time, CME markets have often priced 2026 Class III futures in the mid‑$16 to low‑$17 range, something that’s been highlighted in market columns and Bullvine analysis as a significant gap between what you can actually hedge and what older headline forecasts implied.
On the global side, Rabobank’s Q4 2025 dairy report—summarized by AHDB—estimated that combined milk production from the “Big 7” exporters (EU, UK, U.S., New Zealand, Australia, Brazil, and Argentina/Uruguay) finished 2025 about 2.2 percent ahead of 2024 on a milk solids basis. Rabobank’s analysts noted that all the major exporters were expected to remain in growth at least through early 2026, and that this strong supply, coupled with fragile demand in some markets, was likely to keep dairy commodity prices under pressure into 2026. Reports following the Global Dairy Trade auctions in late 2025 back this up, showing butter and powder prices struggling to sustain rallies whenever stock levels and new-season milk flow signal ample supply.
So the data suggests we’re not in a world where “there isn’t enough milk.” We’re in a world where there’s plenty of milk, and the question is who is producing it and at what margin.
Structurally, the long‑term pattern hasn’t changed. USDA’s consolidation work and independent reporting show licensed dairy herds cut roughly in half between 2003 and 2019, while national production increased. 2024 statistics, based on USDA numbers, put average cow numbers around 9.34 million head, confirming that cow numbers remain near recent levels while farm numbers keep sliding. The Bullvine’s own projection, simply extending those herd-loss trends forward, estimates the U.S. could be down to about 15,000 licensed dairies by the mid‑2030s and fewer than 10,000 by mid‑century if closure rates don’t slow. That’s our math, not USDA’s, but it aligns closely with the direction of the underlying data.
| Year | Licensed Dairies | Total Milk Production (B lbs) | Avg Herd Size (cows) |
|---|---|---|---|
| 2003 | 70,000 | 170 | 95 |
| 2008 | 52,000 | 191 | 147 |
| 2013 | 41,000 | 200 | 183 |
| 2019 | 34,000 | 215 | 250 |
| 2024 | ~16,500 | 231.4 | 1,400 |
| 2026 (proj) | ~15,000 | 234.1 | 1,560 |
The Expansion Squeeze: When Yesterday’s Good Plan Meets Today’s Math
Now let’s pull this down from the global and national level to something many of you have lived through: expansions that looked safe at $22–23 milk and 3–4 percent money.

In 2022, the U.S. all‑milk price averaged in the mid‑$25s per hundredweight, setting a new record and surpassing the previous peak from 2014. Butterfat performance was heavily rewarded in many pay programs, and farms with strong components were seeing exceptional checks. Feed costs were high, but by late 2023, USDA and market economists were already projecting some relief in corn and soybean meal prices as supply caught up.
So a lot of 300‑ to 700‑cow herds—especially in regions like Wisconsin, New York, Ontario, and parts of the West—made expansion decisions that looked very reasonable on paper:
- Grow from 300 to 500 or 600 cows by adding a new freestall barn or expanding a dry lot system.
- Install or update manure storage to match the new scale.
- Run the numbers at 25,000–26,000 pounds per cow per year, shipping 12–15 million pounds annually.
In many budgets, operating costs (feed, labor, vet and breeding, fuel, repairs, bedding, utilities) are penciled in at $12–13 per hundredweight, and term debt service at 3–4 percent, adding another $2–3 per hundredweight. At $22–23 milk, the pro formas left room for family living and reinvestment. Extension enterprise budgets from Midwestern and Northeastern universities show similar cost structures for well‑managed freestall herds in that size range.
Then the conditions moved.
USDA’s updated outlooks have since trimmed price expectations. All‑milk is now projected at a bit above $21 for 2025 and high‑$19s for 2026. Futures markets have often only offered $16–17 for Class III futures in 2026. And interest costs—the piece many of us took for granted when rates were near historical lows—have roughly doubled on new and repriced loans. Farm finance reports and Federal Reserve district surveys show a clear shift toward mid‑single- and even high-single-digit rates for operating lines and floating‑rate term loans.
The farmdoc daily “Economic Review of Milk Costs in 2024 and Projections for 2025 and 2026” is helpful here. That work found that:
- Average total costs of production in 2024—including feed, non‑feed, and ownership costs—ran about $23.56 per hundredweight, while average milk price received was $21.63, implying negative economic returns.
- Cash costs (feed plus non‑feed operating) alone were around $17.43 per hundredweight.
- Projections for 2025 and 2026 show lower milk prices and only modest cost relief, suggesting continuing pressure on margins.
So, in many cases, the full cost of production for mid‑size herds (including a realistic family draw and depreciation) lands somewhere in the upper‑teens to low‑20s per hundredweight. If your cost is, say, $18.50 and the futures market is offering $17, you’re looking at a $1.50 gap. On a 500‑cow herd shipping 12.5 million pounds a year (125,000 hundredweight), that’s roughly $187,500 in annual negative margin. At a $2 gap, it’s around $250,000.
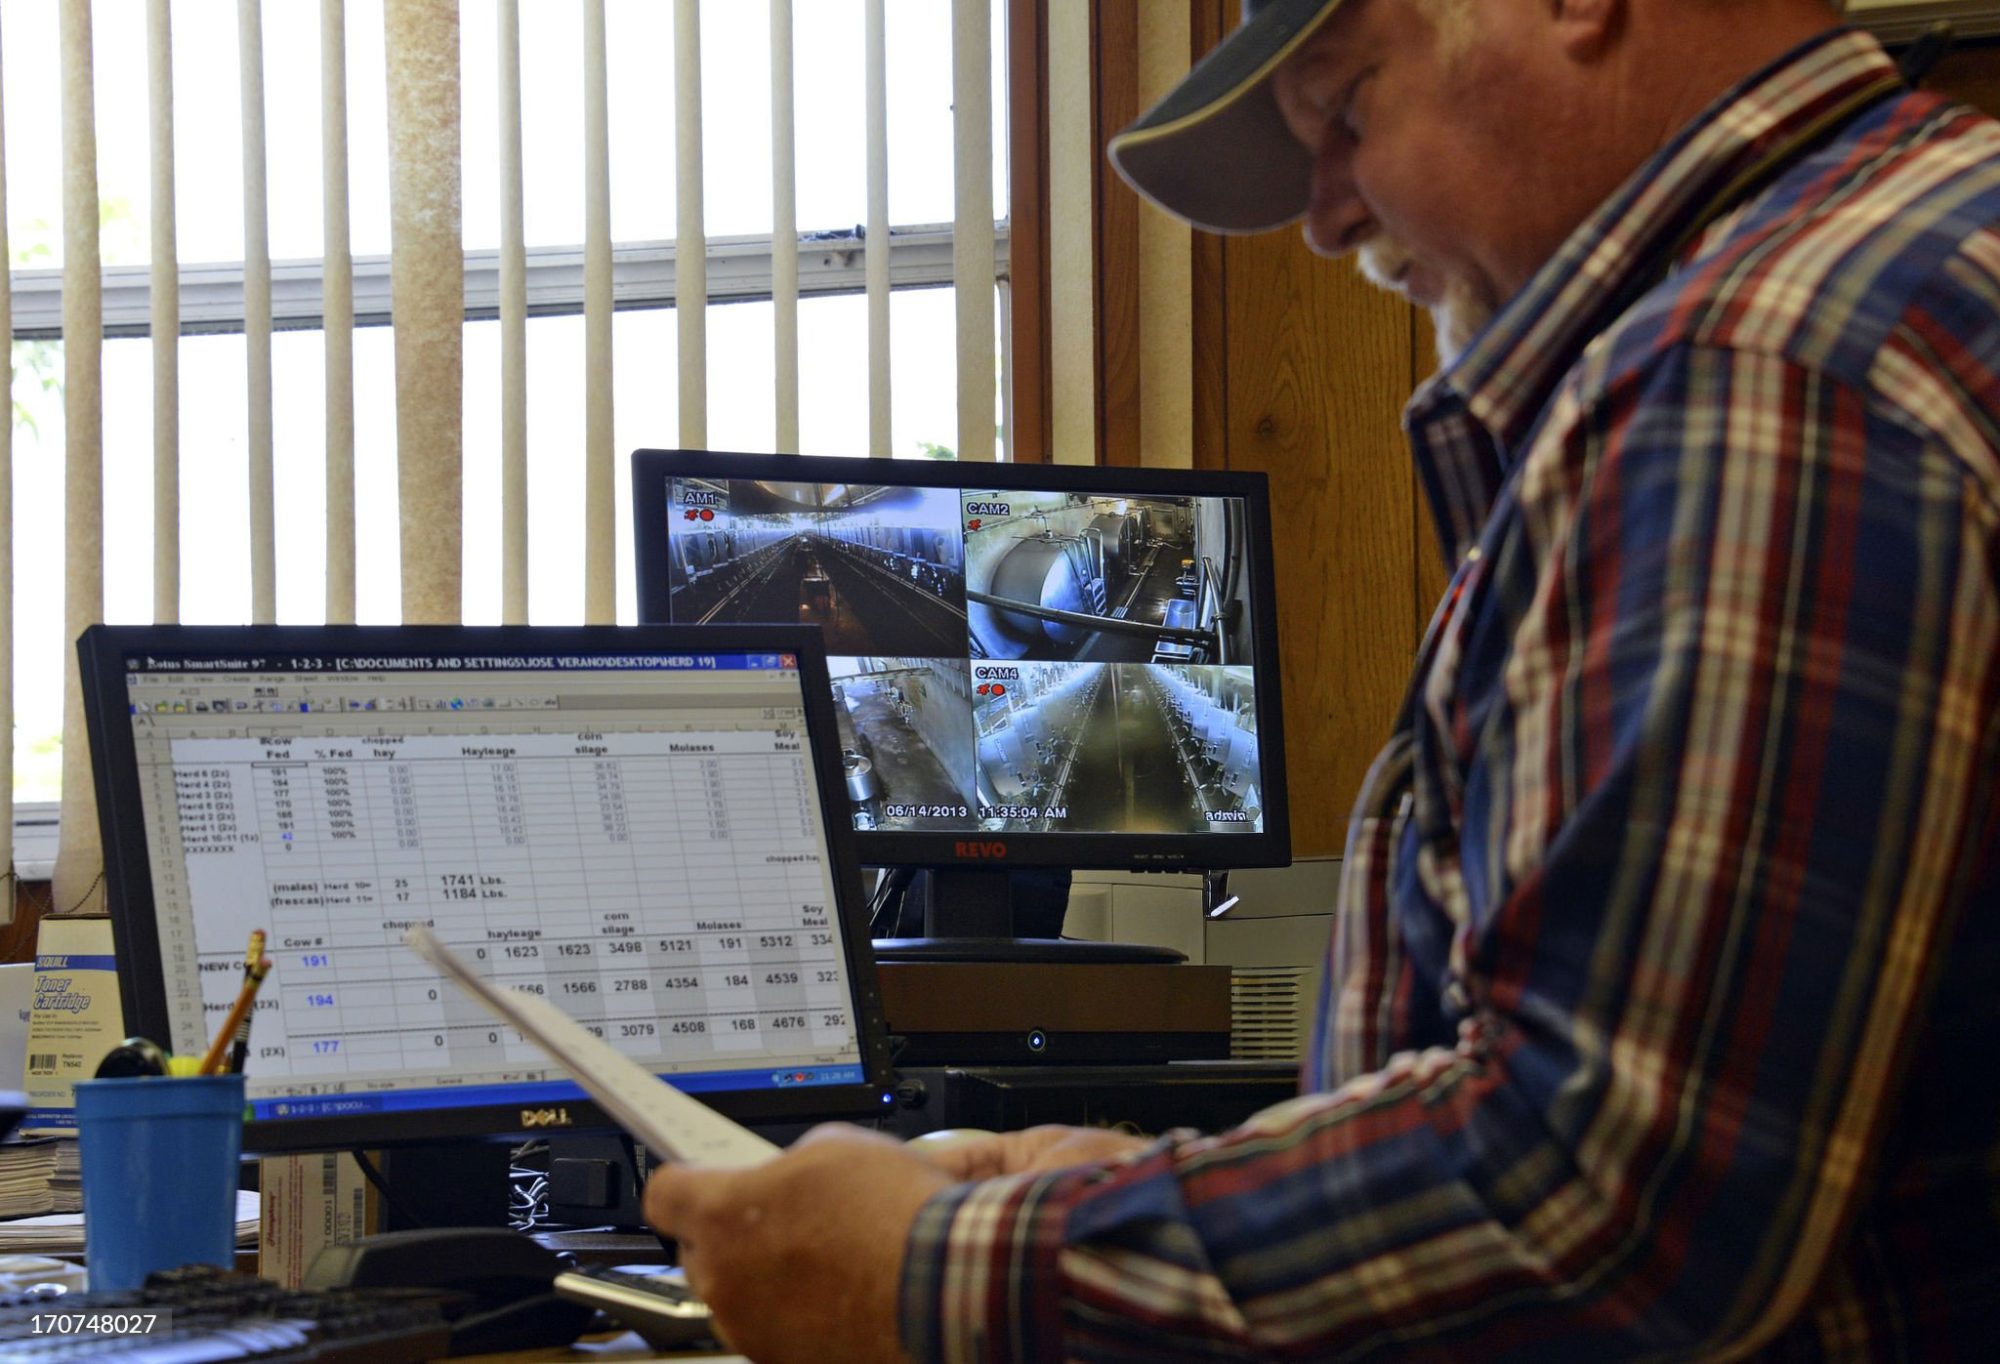
What I’ve noticed, visiting farms and looking at DHIA and processor data, is that in many barns, the cows are actually doing well. Butterfat performance is often better than it was a decade ago. Fresh cow management during the transition period has improved, with more consistent protocols and monitoring. Reproductive programs are tighter. The stress is coming from the financial side of the ledger, not a sudden collapse in cow performance.
When a Dairy Quits: Where Cows, Land, and Steel Actually End Up
| Asset | Primary Buyer | Secondary Market | Typical Recovery (% of replacement cost) |
|---|---|---|---|
| Dairy cows (top-end) | Larger regional herds (1,000–3,000 cows); growing dairies in ID, SD, TX | Dairy-beef cross, cull market | 85–95% (live animal value retained) |
| Dairy cows (lower-tier) | Livestock dealers, dairy-beef operations | Cull market | 40–65% (depends on age, health) |
| Land & forage acres | Neighboring dairies, crop farms, investor funds | Residential/commercial development (near urban areas) | 100–120% (farmland appreciation in many regions) |
| Infrastructure (parlor, barns, lagoons) | Limited—some buyers; mostly demolition/salvage | Scrap metal, reclaimed equipment dealers | 15–35% (substantial write-down; parlors rarely reused) |
| Equipment (TMR, tractors, loaders) | Used equipment dealers, export channels, neighboring farms | Online auctions (Machinery Values, etc.) | 50–75% (depends on age, condition) |
We don’t enjoy talking about dispersals, but if we’re honest, they show us where the industry is really going.
On the cow side, the pattern is pretty similar across regions:
- Larger neighboring herds—say 1,000–3,000 cows—often line up early to purchase the top end of the herd, either privately or on sale day. They’re after younger cows with strong components and healthy records, they can drop straight into their freestalls or dry lot systems.
- Growing areas like South Dakota, Idaho, western Kansas, and parts of Texas have been bringing in cows from other regions to fill new or expanded facilities. USDA‑NASS and trade coverage show double‑digit herd growth in some of these states over the past decade.
- Livestock dealers purchase whole herds, sort animals into different quality groups, and send better cows into herds that are still expanding while moving lower‑tier animals into dairy‑beef and cull markets.
Recent data from Wisconsin Extension indicates that total U.S. cow numbers have remained in the 9.3–9.5 million head range, even as herd numbers have continued to fall. That shows what many of us see: the cows are staying in the system, just on fewer farms.
On the land side:
- Neighboring dairies and crop farms frequently step in to buy ground for forage, grain, and manure application. This is especially common in the Upper Midwest, Ontario, and parts of the West, where land is still predominantly agricultural.
- In areas on the edge of urban growth—think parts of the Northeast, Ontario’s Golden Horseshoe, or near mid‑sized cities in the Midwest—developers sometimes buy former dairy land for residential or commercial use. Once that happens, that acreage is effectively gone from the production base.
- Farmland investment funds and family offices have become a notable presence, purchasing land and leasing it back to operators. Rabobank and USDA research on farmland markets have pointed out that institutional investors are attracted to farmland’s inflation‑hedging properties and targeted rental yields in the four to five percent range.
I’ve noticed a fairly consistent pattern in conversations: a family decides to exit, an investor group buys the land, and a larger local dairy leases it. The exiting family converts land equity into cash and steps out of day‑to‑day production; the remaining operator expands access to acres without tying up more capital.
The infrastructure—parlors, barns, lagoons—is often the hardest part to repurpose. Older parlors designed for 150–300 cows don’t always match the layout that a 2,000‑cow freestall or dry lot system wants today. Extension engineers and consultants sometimes point out that the salvage value is mainly in pumps, gates, and some steel, with much of the rest written down. Tractors, TMR mixers, loaders, and manure equipment generally move at a discount, but there’s more of a market for them, and export channels help in some cases.
So, in many cases, cows and land get absorbed into the next phase of the industry. The mid‑size dairy footprint doesn’t always.
What Farmers Are Finding About Processor and Co‑op Strategies
Looking at this trend from the processor side fills in the rest of the picture.
Over the last several years, we’ve seen significant new cheese and whey capacity come online or announced in states like Michigan, Texas, Kansas, Idaho, and South Dakota. Industry outlets and USDA outlooks describe these plants as handling very large daily intakes—often in the millions of pounds—with high levels of automation and the flexibility to switch product mix as markets move. They are typically located in areas with strong concentrations of large herds and room for further growth.
At the same time, smaller or older plants in areas with declining milk supplies or many small suppliers have been targets for rationalization, mergers, or closure. Examples have appeared in parts of the Northeast and Upper Midwest, as well as in the UK and Europe, where processors are consolidating into fewer, larger sites to improve efficiency.
From a cost standpoint, the logic is hard to argue:
- Hauling 200,000 pounds a day from a handful of large stops costs less than collecting the same volume from dozens of small herds.
- Plants closer to full capacity spread fixed costs over more pounds, improving processing margins.
- Regions with larger, more consolidated herds provide a more predictable supply.
USDA structural reports and co‑op communications both reflect the same reality: co‑ops and processors are losing farm suppliers faster than they’re losing milk volume. Many have said some version of “we’re losing members, but we’re not losing milk,” especially in boardroom and annual meeting contexts. The data backs that up.
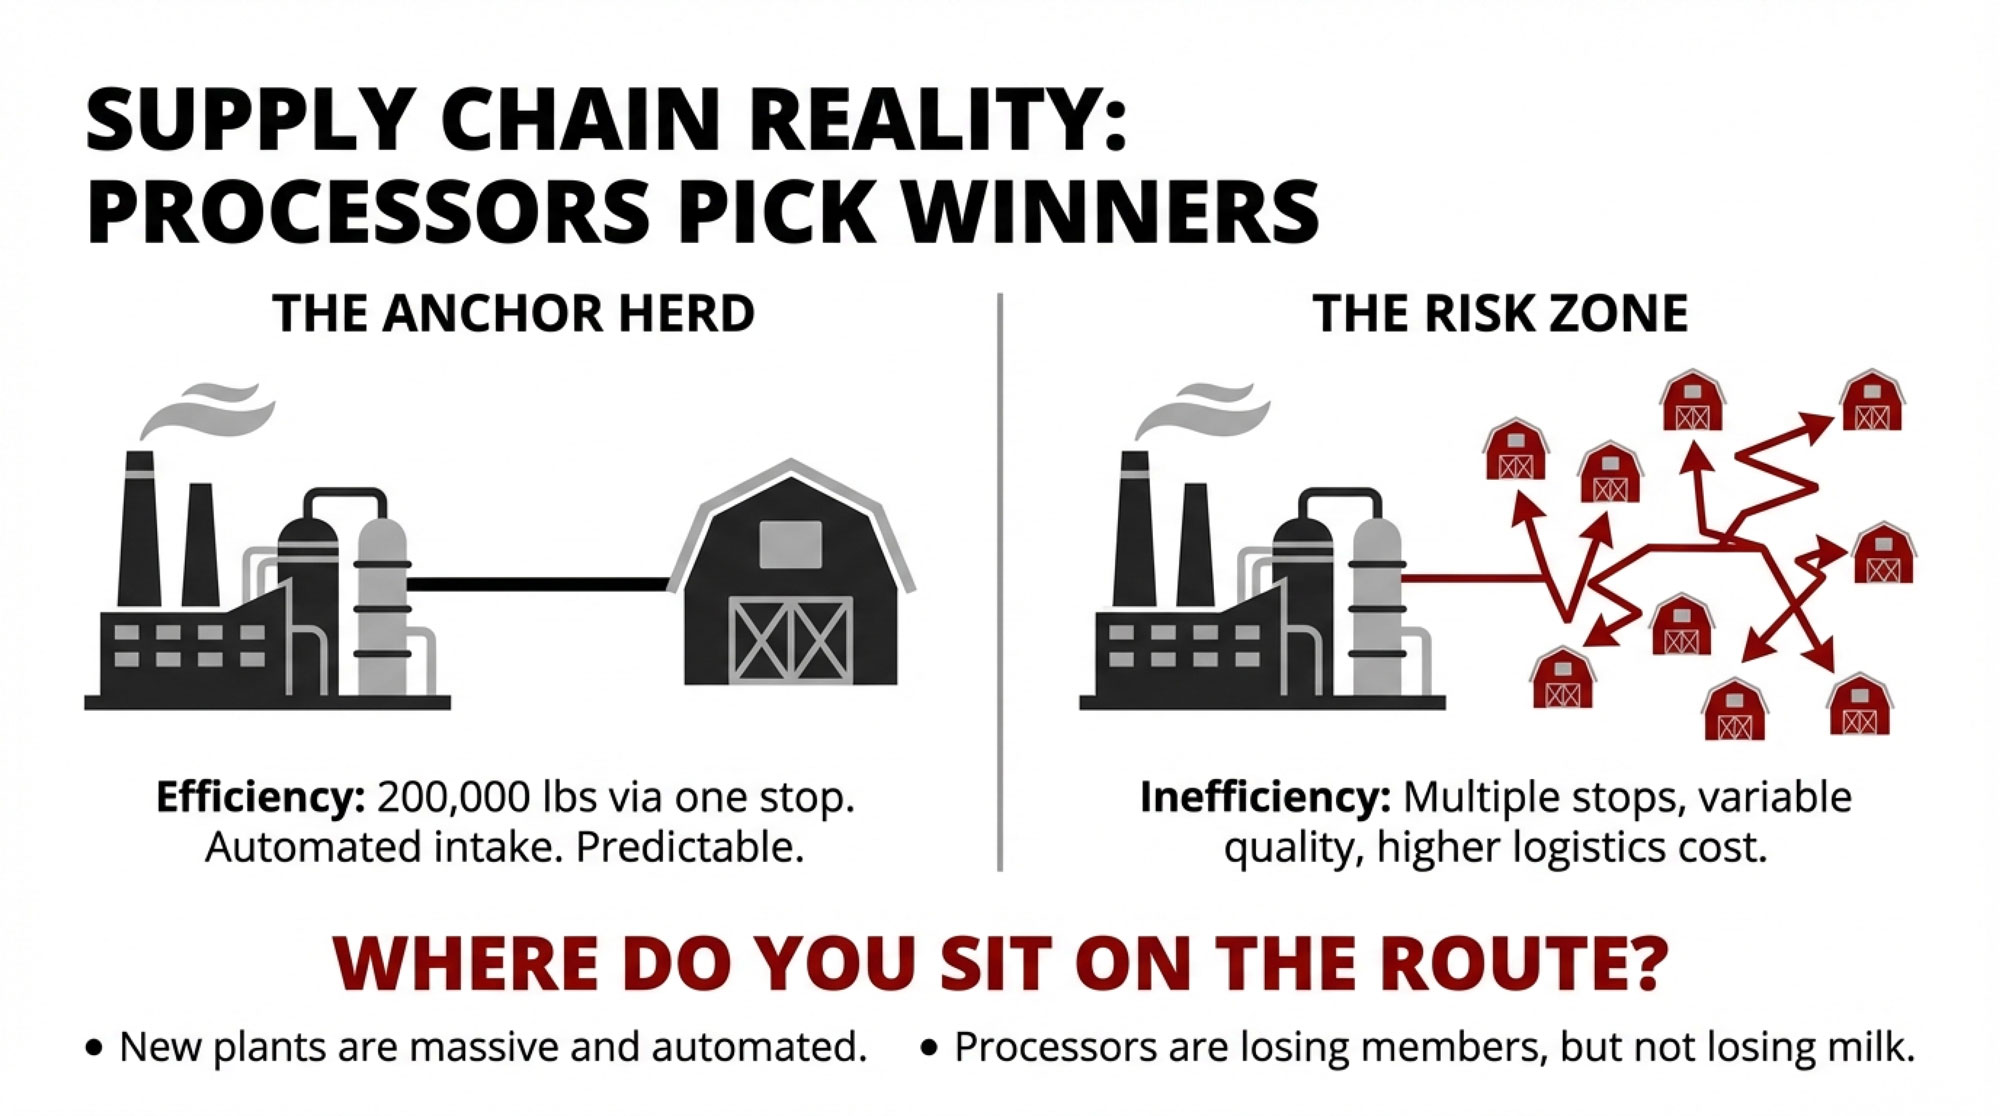
This development suggests that supply chains are being built around a smaller number of larger anchor herds, with smaller and mid‑size operations fitting in where they align with route plans, quality needs, and regional strategy. It doesn’t mean the end of 60‑ or 200‑cow farms—especially those tied to niche markets or local processing—but it does change the economic current they’re swimming against.
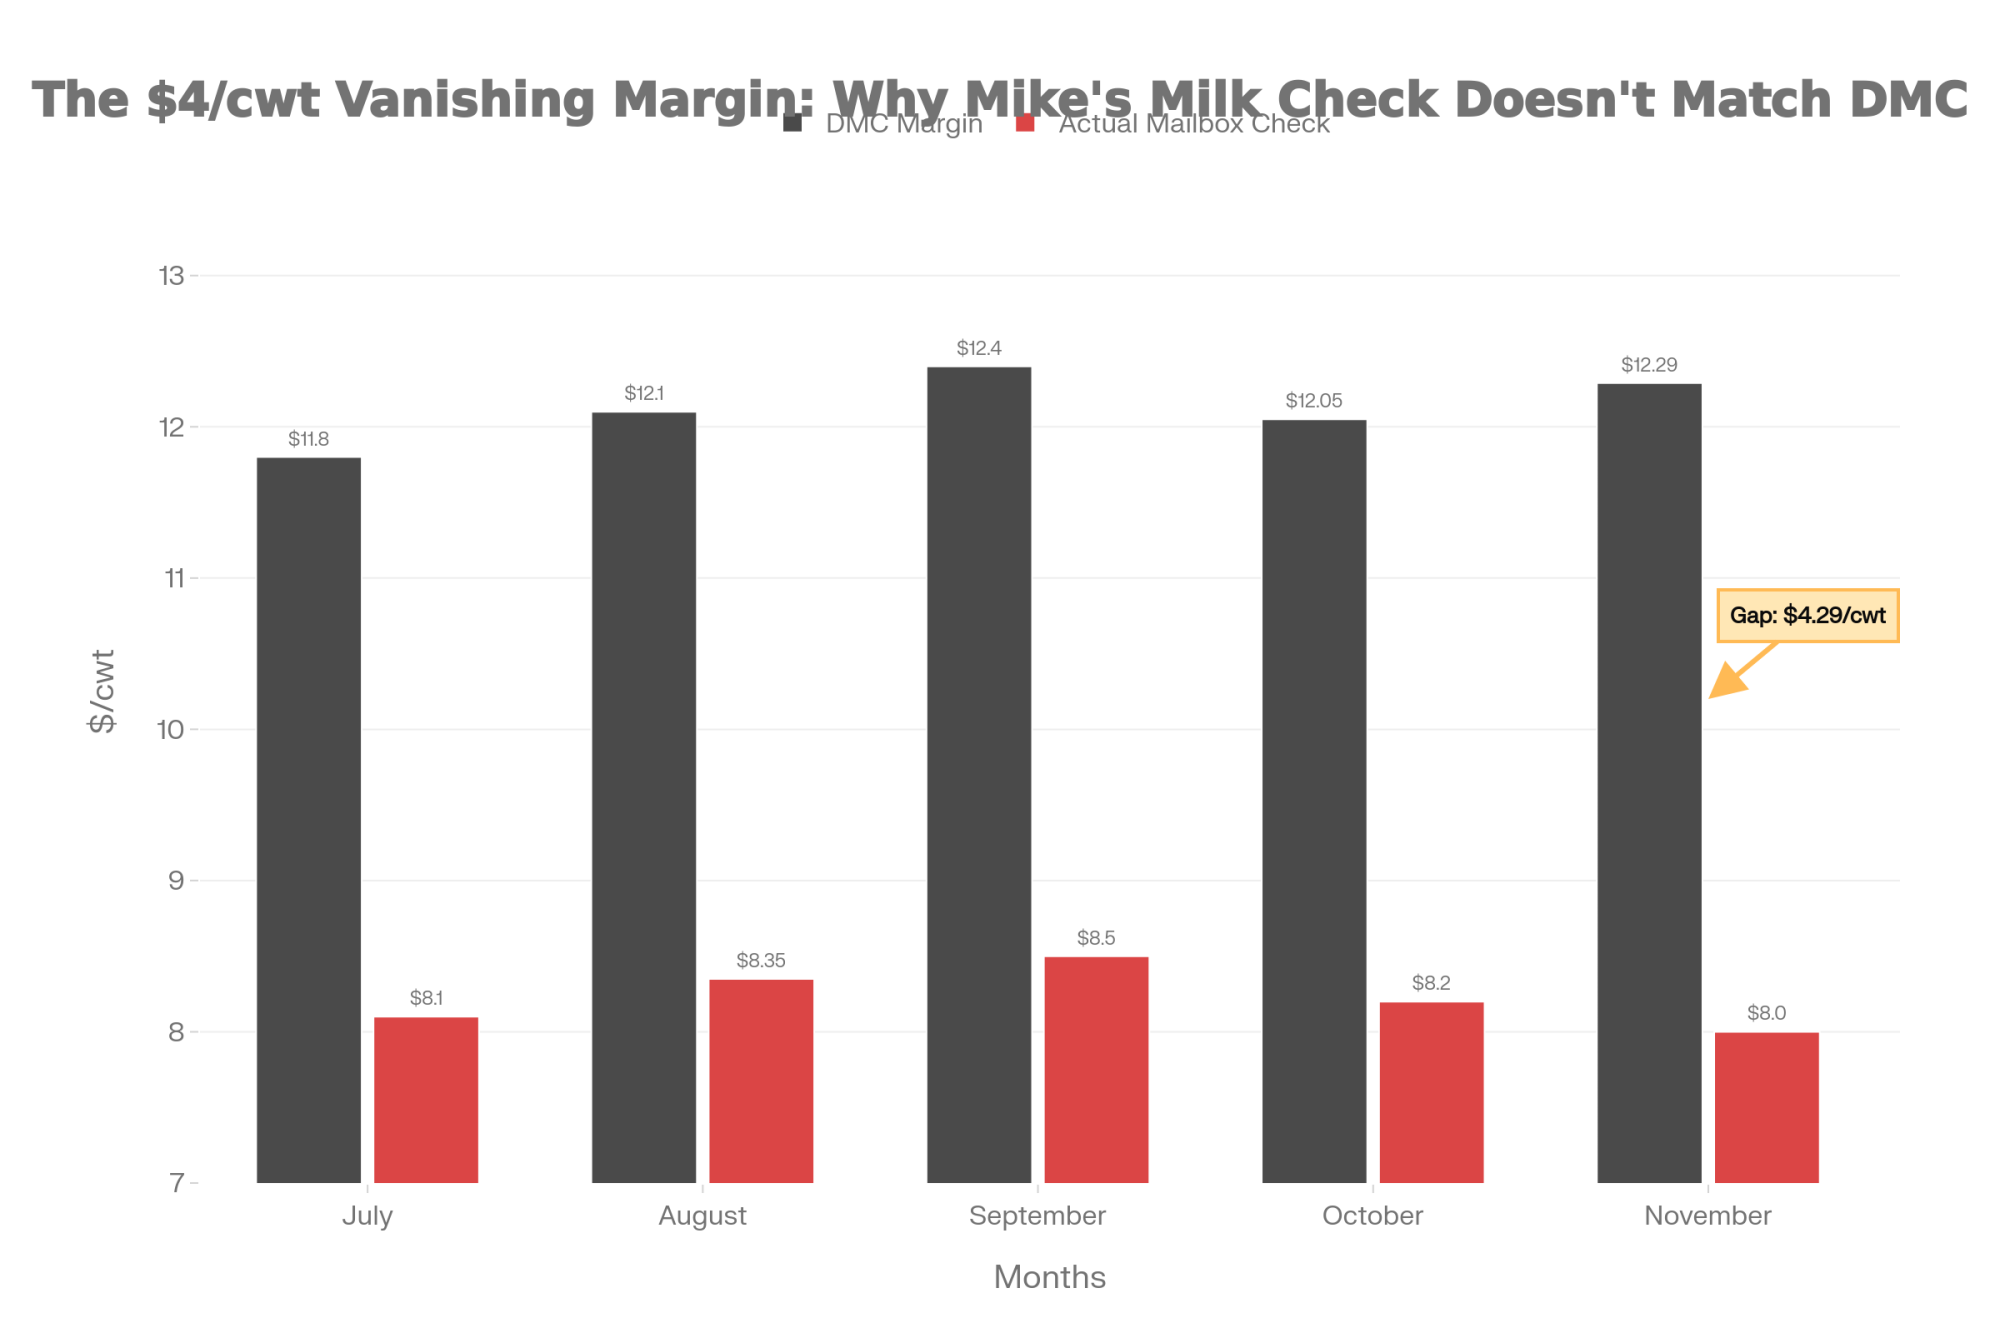
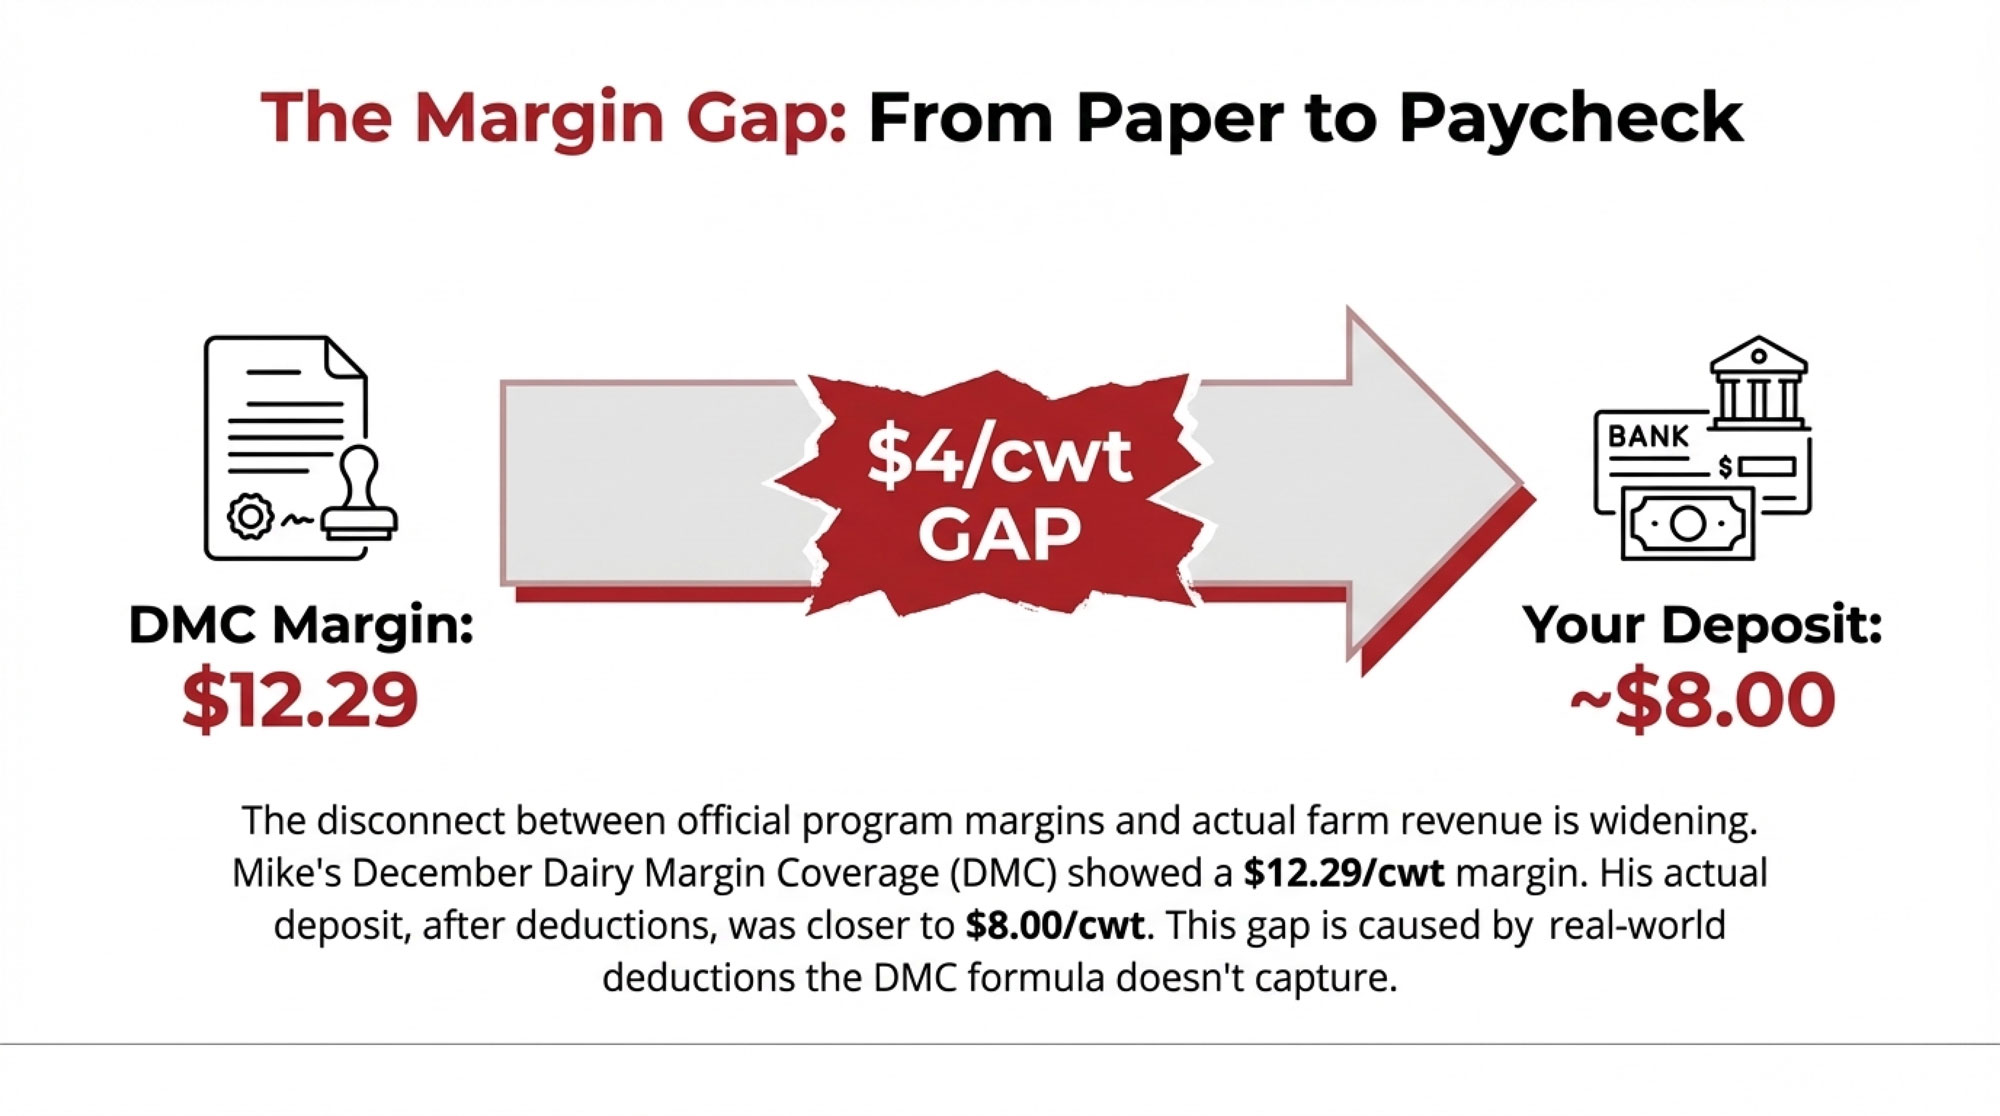
The “Optimism Gap”: USDA Forecasts vs. What You Can Actually Hedge
Now let’s look at something that quietly drives a lot of stress: the difference between official price forecasts and the numbers you can actually put on a hedge or forward contract.
USDA’s all‑milk price projections, as published in WASDE and the Livestock, Dairy, and Poultry Outlook, are built from models that connect anticipated production, stocks, exports, and domestic use. For late 2025 and into 2026, those projections cluster around $ 21+ in 2025 and the high $19s in 2026.
On the other side, the CME Class III futures curve has, for much of late 2025 and early 2026, priced many 2026 contracts in the mid‑$16 to low‑$17 band. Dairy market writers and analysts have noted that this is a substantial and persistent gap, especially as processors remain cautious about forward contracting at higher levels.
Economists at Cornell and Illinois who evaluate USDA forecast performance and farm-level decision tools have emphasized that futures prices tend to adjust more quickly to new information, while institutional forecasts can lag a bit or smooth volatility. In extension meetings, their message to producers has generally been: “Use USDA and co‑op forecasts as scenarios, but build your cash flow around what you can realistically hedge.”
That’s the essence of what The Bullvine highlighted in its own “USDA Says $18, Futures Say $16” analysis—if your plan assumes $19–20 milk but the market will only let you lock in $17, the difference on a 500‑ or 600‑cow herd is often $200,000–$250,000 a year in gross revenue. That can be the difference between staying ahead of your principal and tapping the operating line to get through the year.
So a practical approach for 2026 is to:
- Treat the hedgable futures price (plus your realistic basis and component premiums) as your conservative planning number.
- Use USDA all‑milk projections as higher‑price scenarios to test what happens if things break your way.
- Be honest about whether your current business model only works at the top of the range, or also works at the conservative end.
A 600‑Cow Wisconsin Case: Turning Data into Decisions
To make this less abstract, let’s look at a composite case based on several real herds in central Wisconsin.

This farm:
- Milks 600 Holsteins in a freestall setup with a double‑12 parlor.
- Averages around 26,000 pounds per cow per year.
- Maintains butterfat performance near 4.1 percent and protein about 3.2 percent, with strong emphasis on fresh cow management and the transition period.
- Expanded from 400 to 600 cows in 2022, financing a new barn and lagoon at just under 4 percent interest.
In late 2025, their lender suggested a “stress test” for 2026 and 2027, given the revised USDA forecasts and the futures strip. Working with a dairy business specialist from extension, they pulled their last two years of numbers and calculated:
- Cash cost per hundredweight (feed, labor—including unpaid family labor at a fair rate—vet and breeding, fuel, repairs, bedding, insurance, interest, property taxes).
- Full cost per hundredweight after adding depreciation and a realistic family living draw.
Their full cost landed in the high‑$18s per hundredweight, very close to the range highlighted by the farmdoc 2024 cost study for similar Midwestern herds.
Then they ran three simple price cases:
- Forecast case: all‑milk equivalent of about $19.25 per hundredweight.
- Market case: Class III‑based price of $17, adjusted for their herd’s typical basis and component premiums.
- Stress case: $16 milk for half the year, plus a 10 percent bump in purchased feed costs.
At $19.25, they could service debt, cover family living, and maintain a modest cash buffer. At $17, they were hovering near breakeven—some months slightly positive, some slightly negative—depending on how tight they ran repairs and how well cows performed. At $16 plus higher feed, they would burn through most of their working capital inside about 12–15 months if nothing changed.
Instead of ignoring that, they made several specific adjustments:
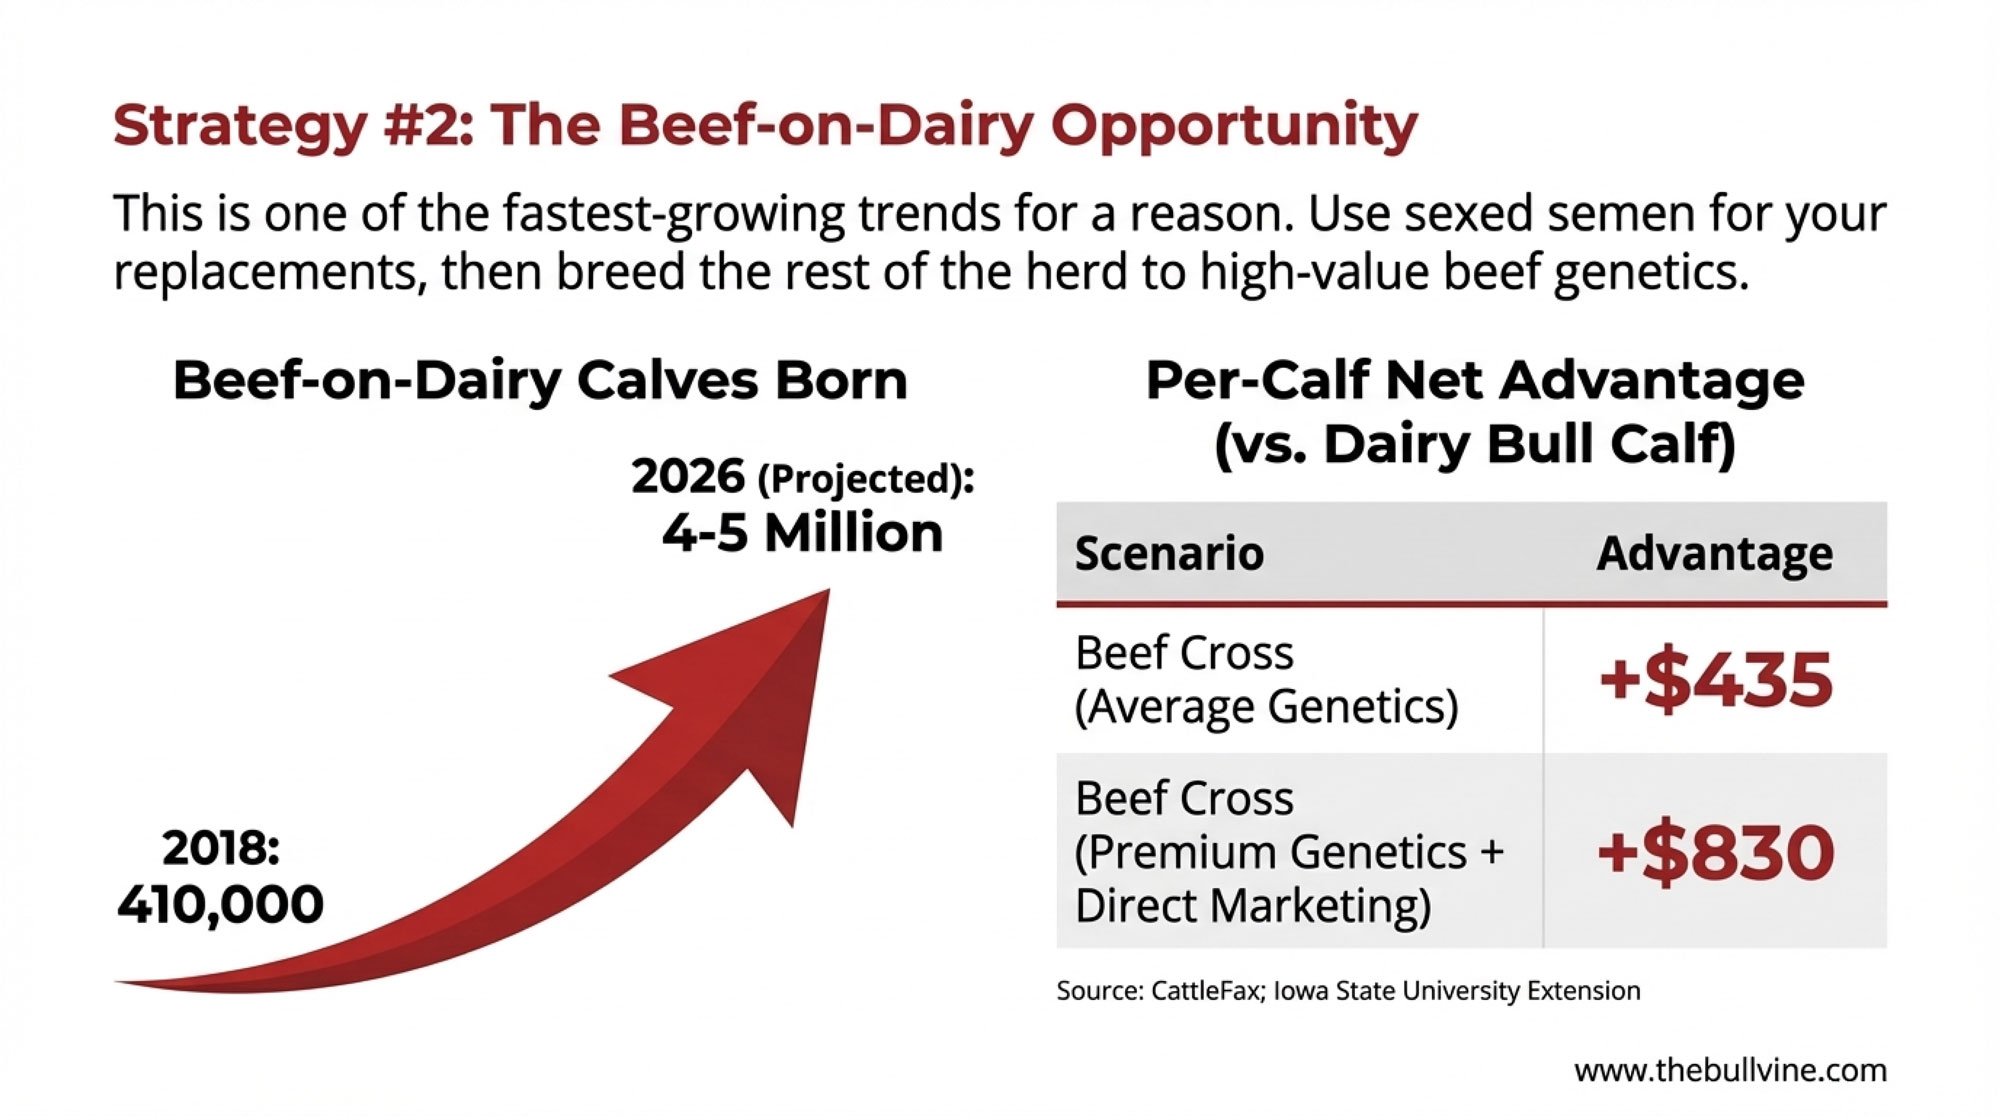
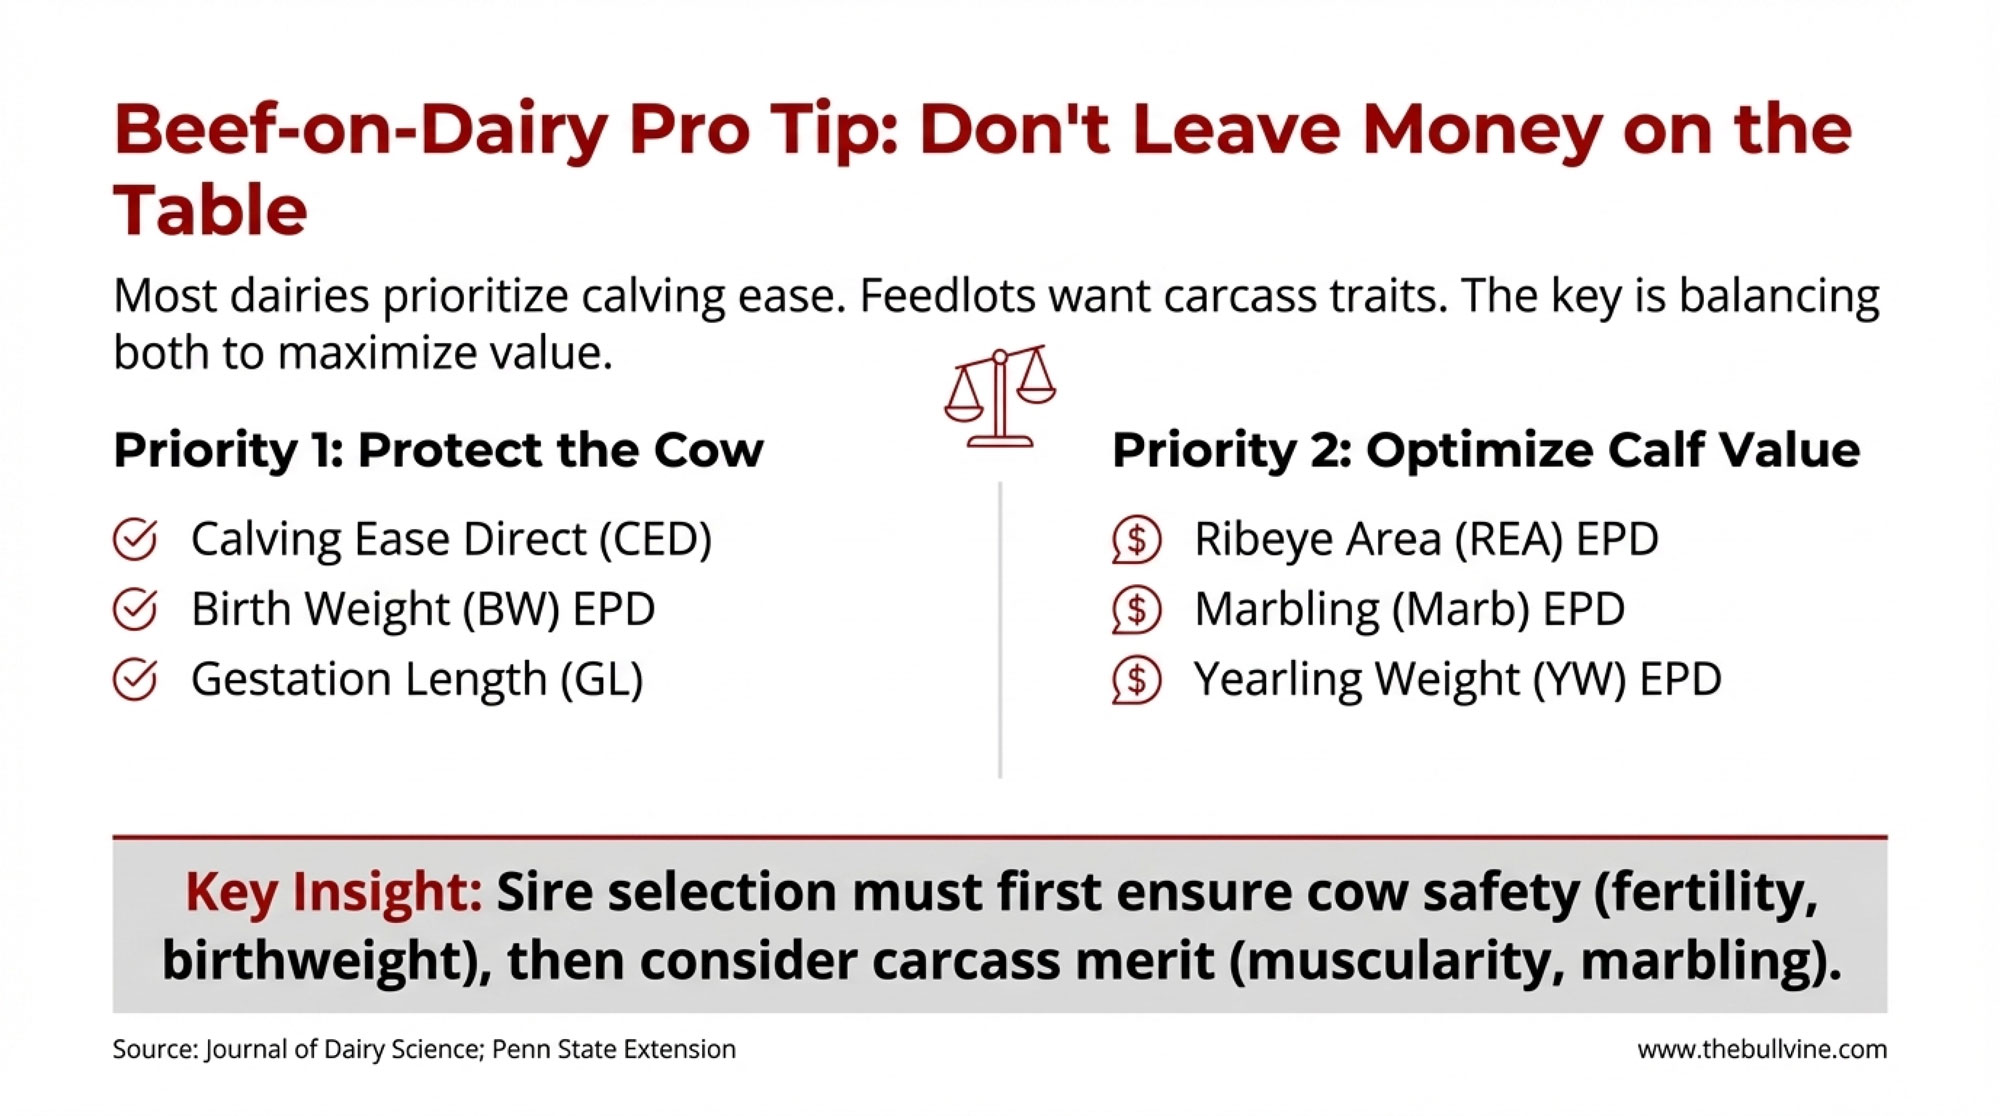
- Tightened their heifer program by raising fewer replacements and using more beef semen on lower‑tier cows, reducing heifer raising costs while capturing dairy‑beef value on calves.
- Renegotiated a high cash‑rent land lease, bringing it closer to local averages and lowering their per‑cwt land cost.
- Became more disciplined about culling cows with chronic health issues or consistent component underperformance, even if daily milk looked decent.
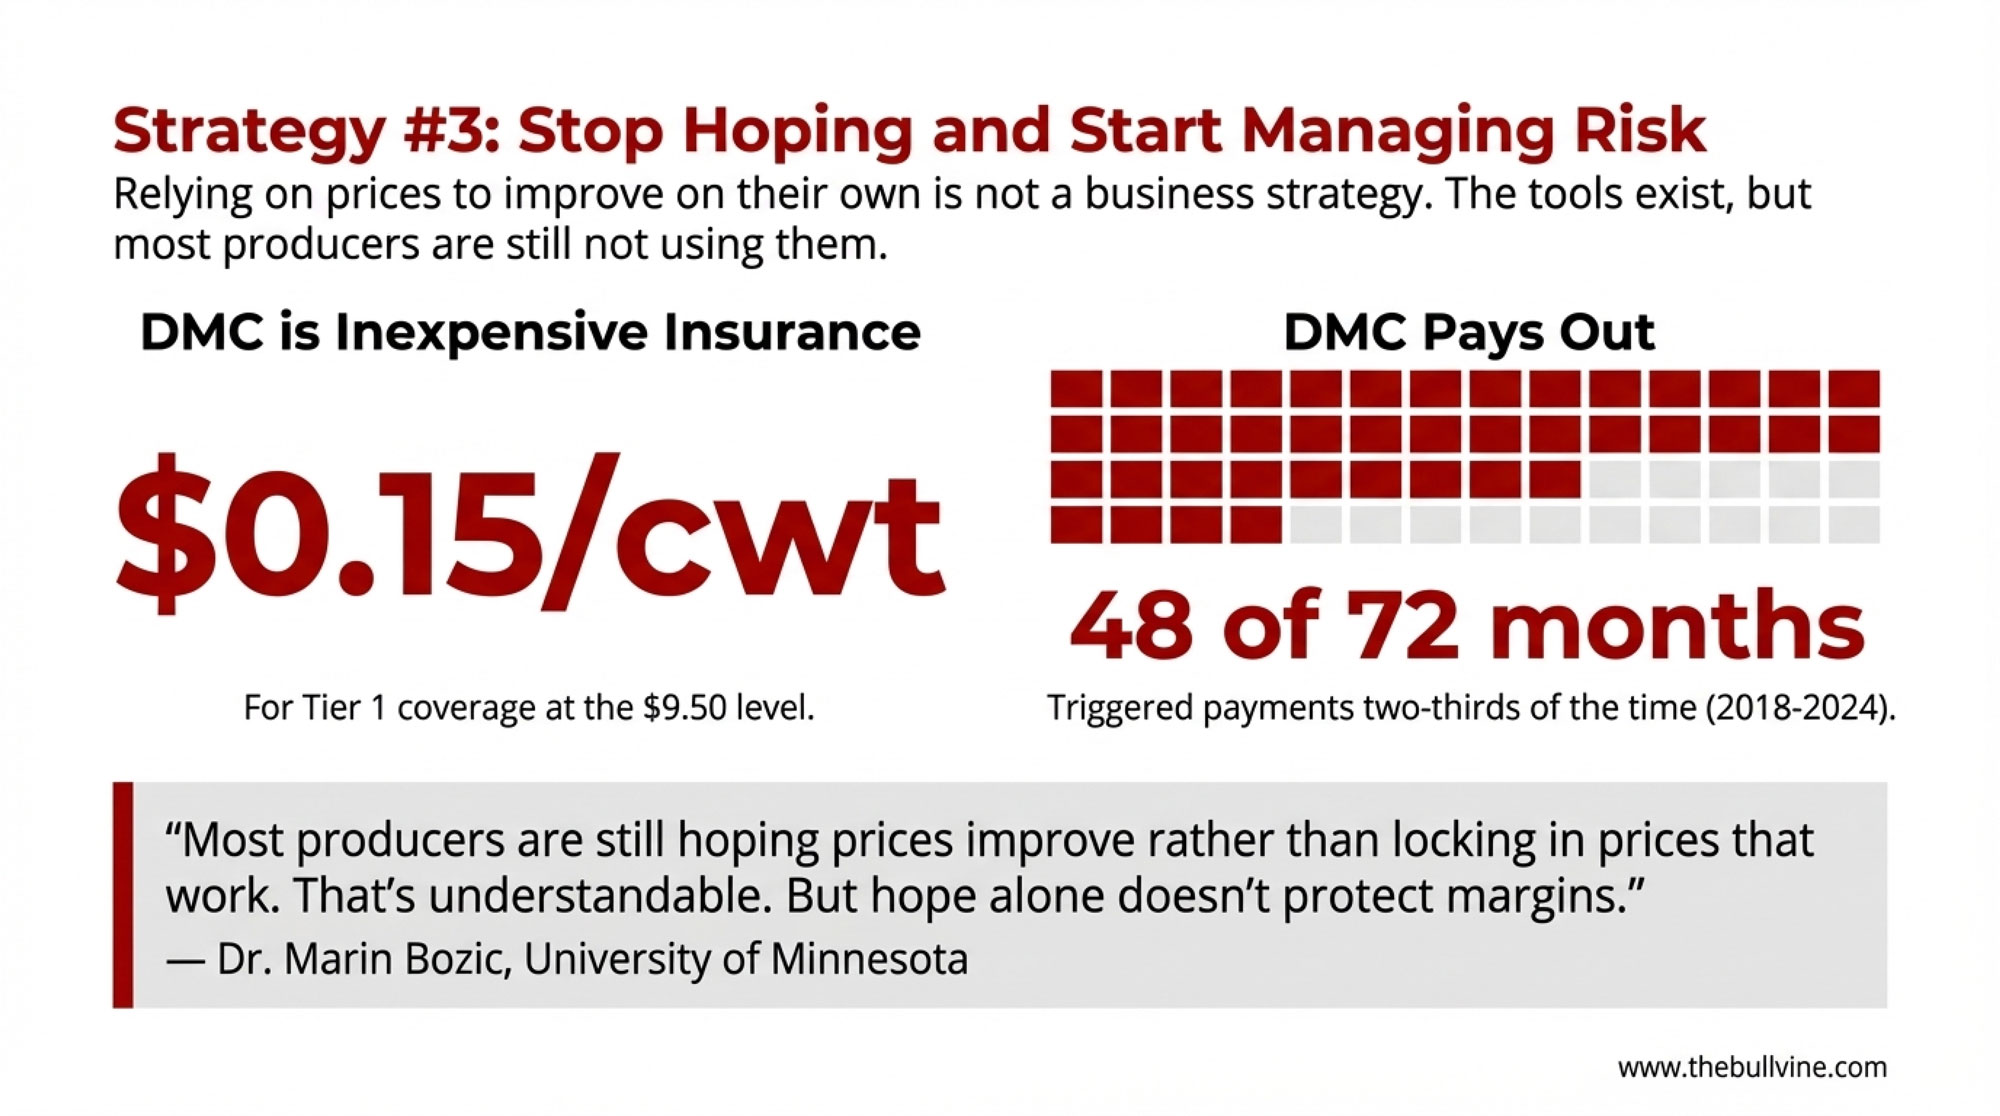
Those changes didn’t drop their cost by $3, but they shaved an estimated 50–75 cents per hundredweight. That pulled the $17 scenario from marginal into manageable. Their lender, seeing that they were budgeting off conservative price assumptions and actively adjusting, was more comfortable working with them on amortization and covenant flexibility.
The point isn’t that this particular mix of moves is right for every farm. It’s that using the numbers honestly can shift you from “hoping things turn” to actively managing risk.
Practical Questions for 2026: What to Ask Before You Decide Your Next Move
What farmers are finding is that the most important work in 2026 isn’t guessing the exact milk price—it’s asking the right questions about their own operations. Here are four sets of questions that keep coming up in conversations with producers, lenders, and advisors.
1. What’s our true cost of production—and where’s our red line?
You probably know this already, but in a tighter environment, it’s crucial to get beyond ballpark guesses:
- What is our cash cost per hundredweight?
- When we add depreciation and a realistic family living draw, what is our full cost per hundredweight?
- At what milk price do we cover all that? At what price do we start eroding equity, and how long can we keep doing so before we reach a level we’re not willing to cross?
Tools from land‑grant universities and farm business programs can help you calculate this accurately, drawing on your actual records rather than averages. Knowing that threshold doesn’t solve the problem, but it gives you a clear frame for every other decision.
2. Where do we sit in our regional supply network?
In California, a 1,500‑cow freestall near a major cheese or powder plant is in a very different situation than a 200‑cow tie‑stall in rural Vermont that’s at the end of a route. In eastern South Dakota or western Kansas, where new plants are coming online, and herd numbers have grown quickly, a 700‑cow herd might be seen as a stable core supplier. In other regions with shrinking cow numbers and plant closures, a similar herd might feel much more exposed.
Questions worth asking include:
- Are we one of the larger suppliers on our milk route, or one of the smallest?
- Has our pickup frequency changed in recent years, and what does that signal about our fit in the logistics plan?
- Are processors investing in our area, or consolidating capacity elsewhere and stretching routes to reach us?
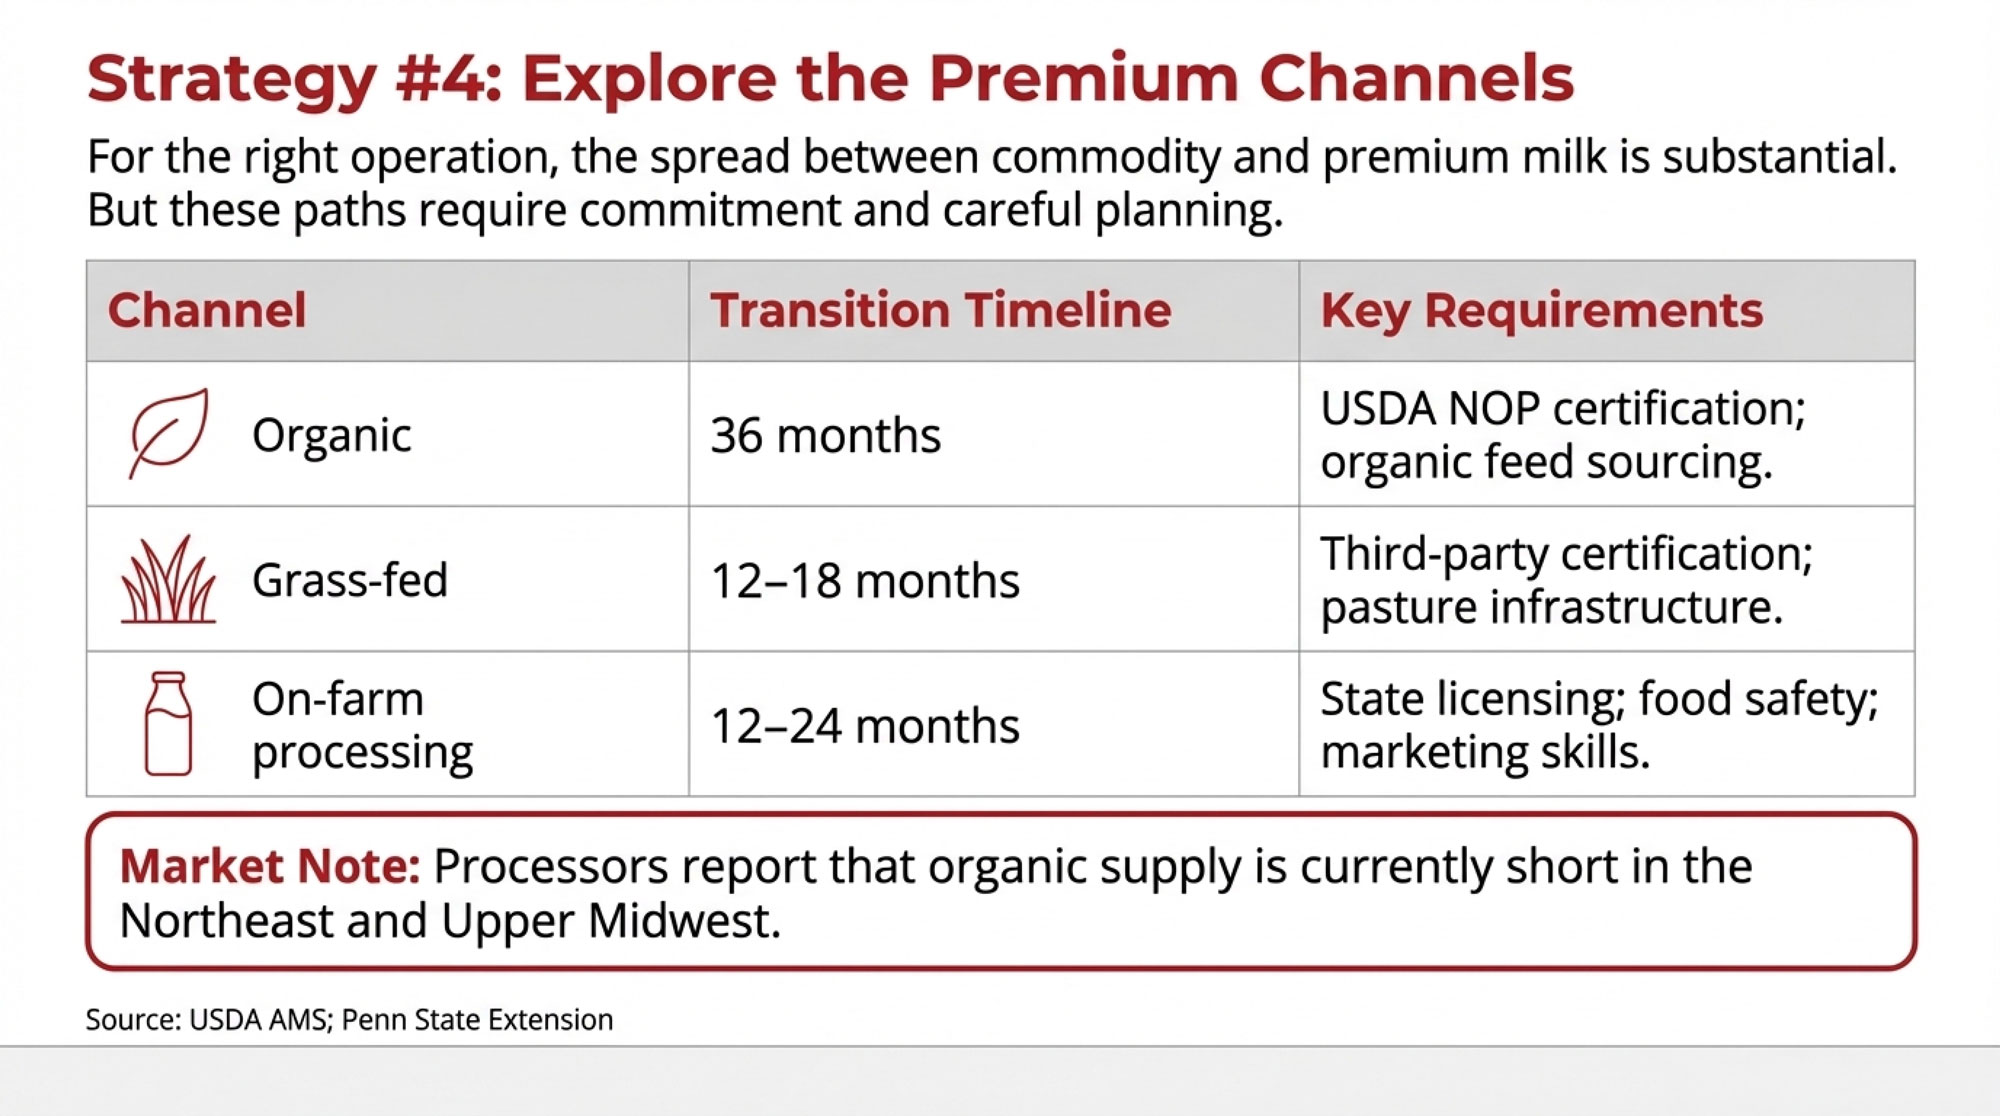
Understanding your position doesn’t force you into one path, but it should influence whether your strategic focus is on careful growth, diversification (like on‑farm processing or specialty components), or planning a transition while you still have strong equity.
3. How do we feel about partnerships and outside capital?
In recent years, more dairy families have explored models where they don’t own every acre and every building themselves. That might look like:
- Selling some or all land and leasing it back from an investor, freeing up capital while staying in production.
- Entering a joint venture with a processor, co‑op, or private investors to build new facilities, with the family managing cows and staff.
- Having the next generation step into a management role on a larger, investor‑backed freestall or dry lot operation with opportunities for equity over time.
Rabobank’s farmland and agribusiness work, and USDA financial analyses, note growing interest in these structures, especially in areas where land prices outpace what dairy cash flow alone can support. They are not right for everyone, but for some families, they offer a way to stay in dairy without carrying all the capital risk.
The key is to:
- Use advisors who understand both dairy and finance.
- Carefully review contracts (with ag‑savvy legal counsel) and model returns under conservative milk prices.
- Make sure everyone in the family understands what’s being traded: more external capital and potentially more stability, in exchange for sharing control.
4. Do our “efficiency” investments really reduce cost per cwt at today’s prices?
Robotic milking, automated feeding, in‑line sensors, and cow‑level health and activity monitors are becoming standard in many herds—from Ontario robotic barns to European pasture‑based systems. Research in journals like Frontiers in Veterinary Science and extension trials show that well‑managed robotic milking systems can maintain or improve milk yield, udder health, and cow longevity, and often reduce reliance on parlor labor.
What’s important is not whether the technology can work—it often does—but whether it lowers your cost of production under realistic price and herd-size scenarios.
Before committing to a major system, it’s wise to:
- Run a multi‑year partial budget with your lender and advisor, including capital cost, maintenance, software, and realistic labor savings.
- Test cost per cwt at $16–17 milk, not just at $20–22.
- Ask how the economics change if you end up milking fewer cows than planned or if labor markets ease.
If the numbers still work under those conditions, the investment can be a strategic advantage. If they only work under best‑case assumptions, it may be better to wait.
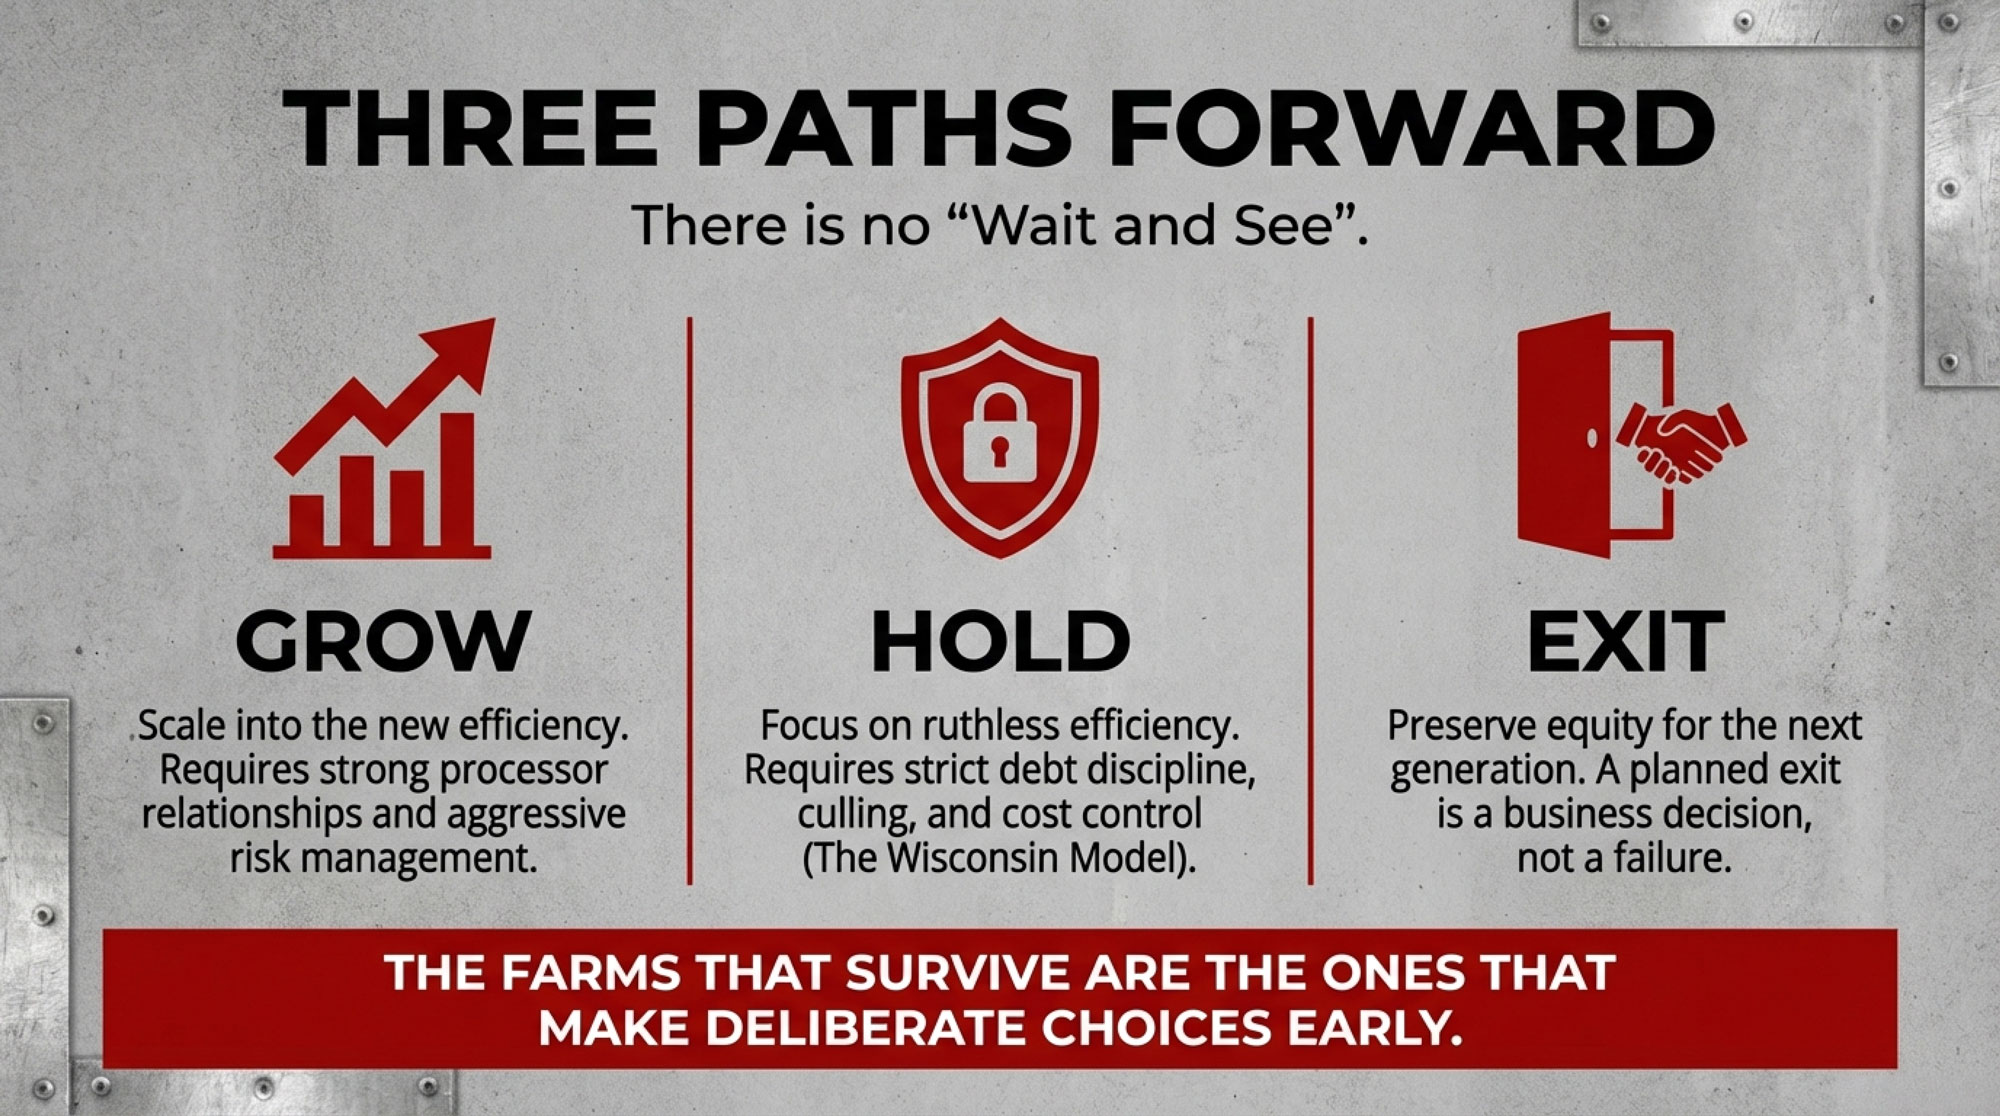
| Strategic Path | Best If… | Capital Required | Risk Level & Key Success Factors |
|---|---|---|---|
| GROW (Expand herd & facilities) | You’re already one of the larger suppliers on your route; processor/co-op signaled support; you have 1,500+ cows in mind; management is scalable | $3–5M for 300-cow addition (barns, parlor, lagoons); assume 4–5% interest | HIGH RISK — Requires lowest cost structure, strong operator-to-cow ratio, processor loyalty; vulnerable to price drops and refinancing pressure if rates stay elevated |
| HOLD (Stay at current size, tighten costs) | Your herd is 300–600 cows; you’re well-positioned on milk routes; you can cut 50–75¢/cwt via heifer & culling discipline; cash flow is adequate | Minimal capital(operational improvements only); $0–200K for facility upgrades | MODERATE RISK — Requires disciplined management, willingness to make tough culling/staffing decisions; protects equity while riding out cycle |
| EXIT (Planned dispersal, preserve equity) | Your debt is aging; you have young family members not joining the farm; land value is strong; you want to exit while equity is high | None (in fact, generates cash); selling costs ~5–8% of asset value | LOW CAPITAL RISK, HIGH EMOTIONAL RISK — Requires family alignment, tax planning, and post-farm vision; timing is critical (sooner better before margins compress further) |
| PIVOT (Niche/value-added, on-farm processing, or partnership model) | You’re in high-population area (Northeast, Ontario) with direct-to-consumer or specialty market access; or seeking joint venture with processor/investor | $500K–$2M (depends on model: direct-sales infrastructure vs. co-packing partnership) | MODERATE-HIGH RISK — Requires new skill sets (marketing, regulatory, finance), smaller volumes compensated by higher margins; longer payback window |
The Bottom Line: Choosing Your Path, Not Having It Chosen for You
So where does this leave you in 2026?
The data from USDA, Rabobank, and farm-level cost studies all point in the same direction: there’s plenty of milk in the system, both in the U.S. and globally. Production is expected to grow, even as farm numbers continue to decline. Futures markets are less optimistic about price than some earlier official forecasts, and interest costs remain a real weight on expansion-era debt. That combination creates real pressure, especially for mid‑size family operations that expanded in 2022–2023.
What’s encouraging is that the situation doesn’t dictate a single outcome. Some farms will choose to grow into the new scale with eyes wide open, focusing on cost control, strong relationships with processors, and careful use of risk‑management tools. Others will hold their size and trim costs and wait for clarity. Some will decide that an orderly exit, with strong equity preserved for the next generation—whether in dairy or another sector—is the right move.
What I’ve noticed, looking back over multiple cycles, is that the farms that come through in the best shape aren’t always the largest or the most automated. They’re the ones that:
- Know their true cost of production at realistic price levels.
- Understand their place in their regional supply chain.
- Are honest with themselves and their families about how much risk they’re willing to carry.
- And make deliberate choices early, rather than waiting for lenders, processors, or circumstances to make the choice for you.
As you think about the next 12–24 months, the most valuable step might not be a new piece of equipment or another pen of cows. It might be a quiet evening with your numbers, a futures chart, and a notepad—asking, “Where are we at $17 milk? How long can we live there? And what do we want our story to look like five years from now?”
That kind of clarity won’t make 2026 easy. But it can make it yours.
KEY TAKEAWAYS
- $250,000 margin gap: USDA forecasts $19+ milk; futures offer $16–17. For a 500-cow dairy, that’s a quarter-million dollars a year on the line.
- More milk, fewer farms: U.S. output heads toward 234 billion pounds in 2026. The cows aren’t leaving; the farms are.
- Many breakevens are already underwater: Farmdoc’s 2024 analysis shows full costs in the low-$20s/cwt. At $17 Class III, that’s negative margin math.
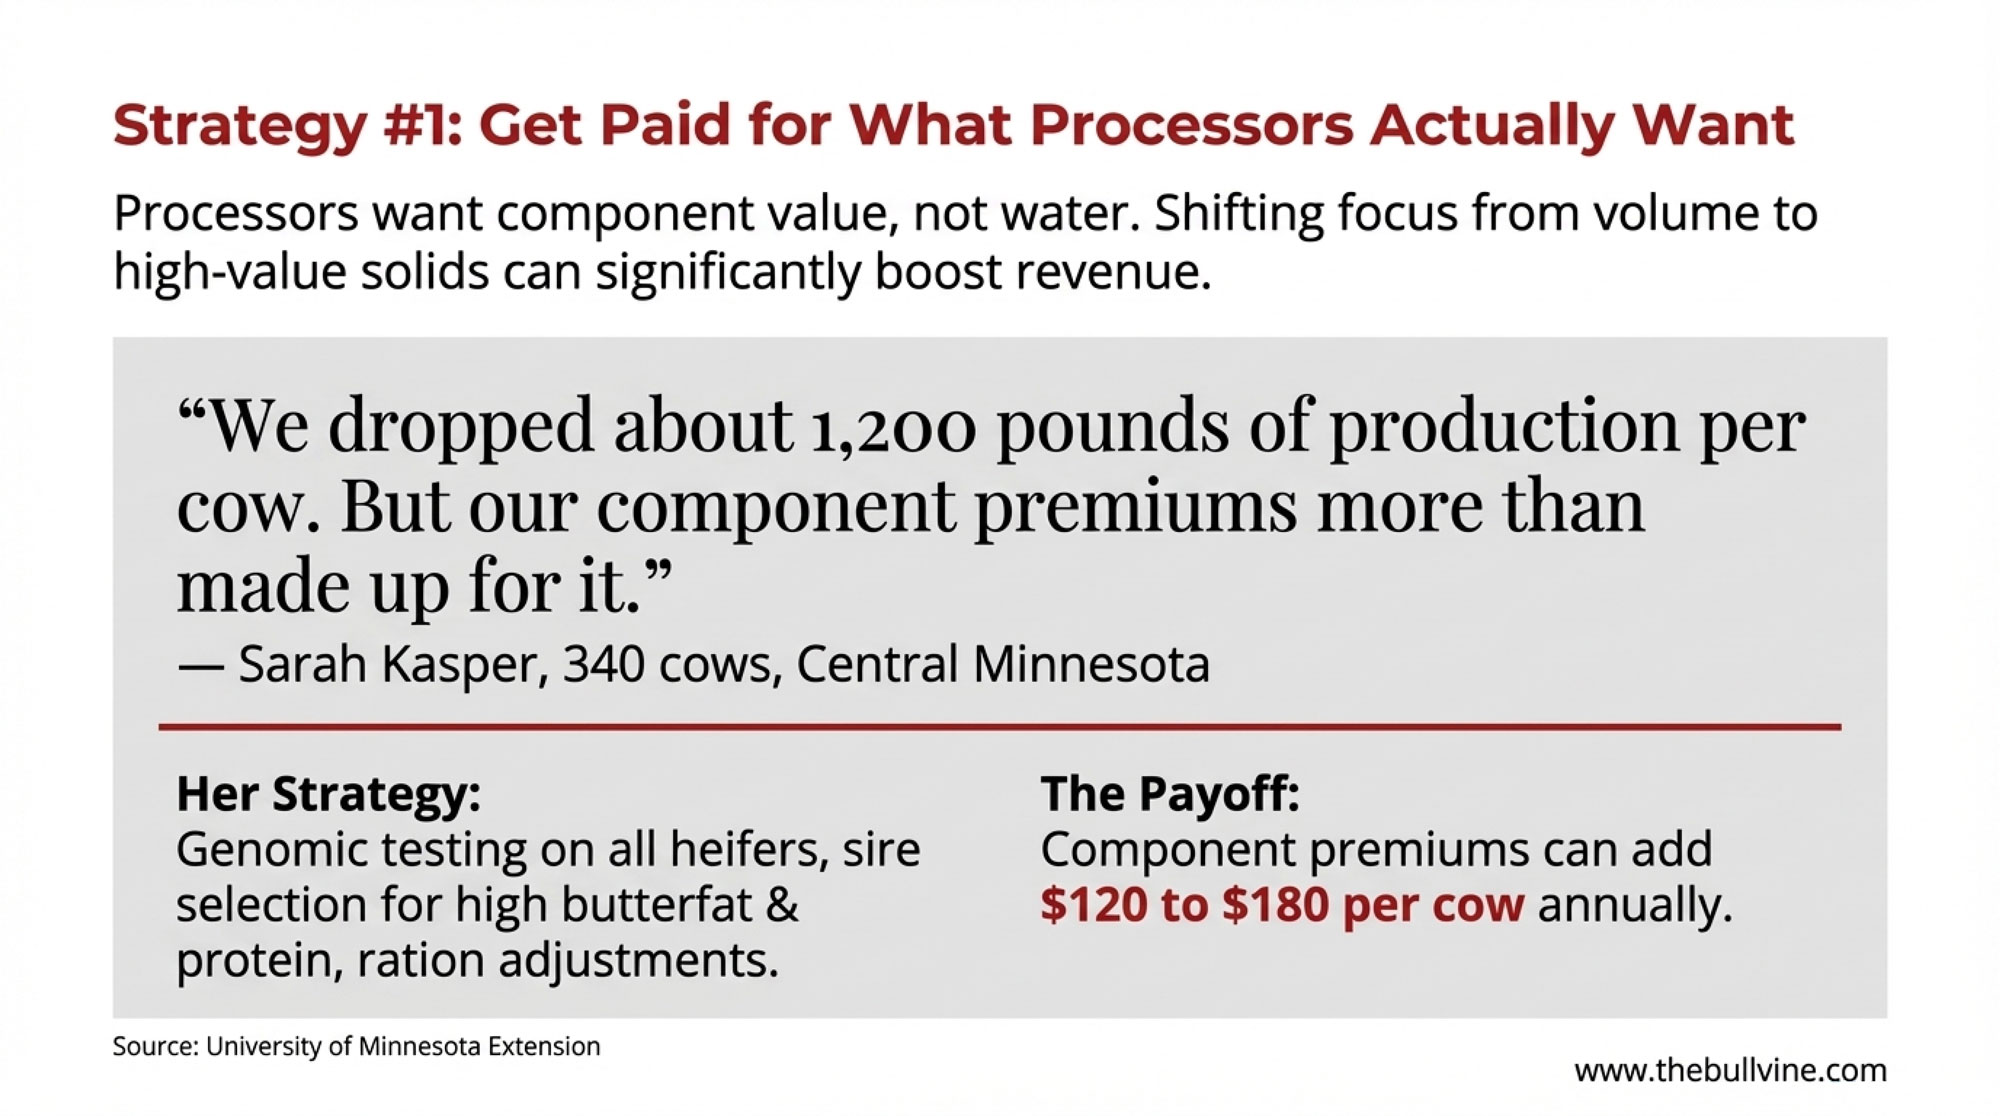
- 50–75¢/cwt is within reach: A 600-cow Wisconsin case shows targeted cuts to heifer programs, culling lag, and lease costs can close the gap—no expansion required.
- Decide before 2026 decides for you: Know your true cost at $17 milk, map your processor position, and choose your path—grow, hold, or exit—while you still can.
Complete references and supporting documentation are available upon request by contacting the editorial team at editor@thebullvine.com.
Learn More
- The Hidden Contract Clause That Could Cost Your Dairy $55,000 in 2026 – Arms you with a 30-day action plan to dodge massive liability shifts in new 2026 milk contracts. Exposes the $55,000 hidden cost of allergen compliance and delivers the negotiation leverage needed to protect your net profit.
- 211,000 More Dairy Cows. Bleeding Margins. The 2026 Math That Won’t Wait. – Reveals the structural “biological trap” of beef-on-dairy that’s keeping margins low despite collapsing heifer inventories. Breaks down the 2026 reset, allowing you to position your herd’s genetics before the next $11 billion processing wave hits.
- Your Cheese Plant’s New Bacteria Can Run 56% Faster – Why This Technology Decides Which Processors (and Farms) Survive 2030 – Exposes how gene-edited fermentation is fundamentally reshaping processor survival and your future milk check. This disruptive insight delivers a competitive advantage by identifying which supply chains will thrive in the 2030 automation era.
 Join the Revolution!
 Join the Revolution!
Join over 30,000 successful dairy professionals who rely on Bullvine Weekly for their competitive edge. Delivered directly to your inbox each week, our exclusive industry insights help you make smarter decisions while saving precious hours every week. Never miss critical updates on milk production trends, breakthrough technologies, and profit-boosting strategies that top producers are already implementing. Subscribe now to transform your dairy operation’s efficiency and profitability—your future success is just one click away.