Archive for Pregnancy Rate

Steve Jobs Never Soldered a Circuit: How His Mac Playbook Can Free 988 of Your Hours and Add $24,000 to a 200‑Cow Dairy

Teagasc and repro data show why the best herds work 19 fewer hours a week and still come out at least $24,000 ahead on a 200‑cow dairy.

Jim Kirk milks 606 Holsteins through a 60‑point GEA rotary parlour at Heanton Barton Farm near Okehampton in North Devon – and two people can run the whole thing in under two hours, according to an AHDB profile. Kirk and his herdsman Harrison handle all the AI, backed up by quarterly breeding reviews from Genus, weekly PD checks from the vet, and reports from VetIMPRESS after every visit. The team – three full‑time employees plus an apprentice, all living within five miles – meets every morning at a whiteboard, writes down the jobs, and ticks them off through the day. His pregnancy rate sits at about 25%, up from 20%, putting the herd in the top 5% of British operations on that metric. 

Kirk took over from his dad and replaced an old herringbone – the kind of call you’d make if milking was eating your whole day, the AHDB profile noted. The hardware changed, sure. But the real shift was where Kirk put his own hours: breeding strategy, team development, ration management – the stuff that never happens when you’re stuck in the pit. 

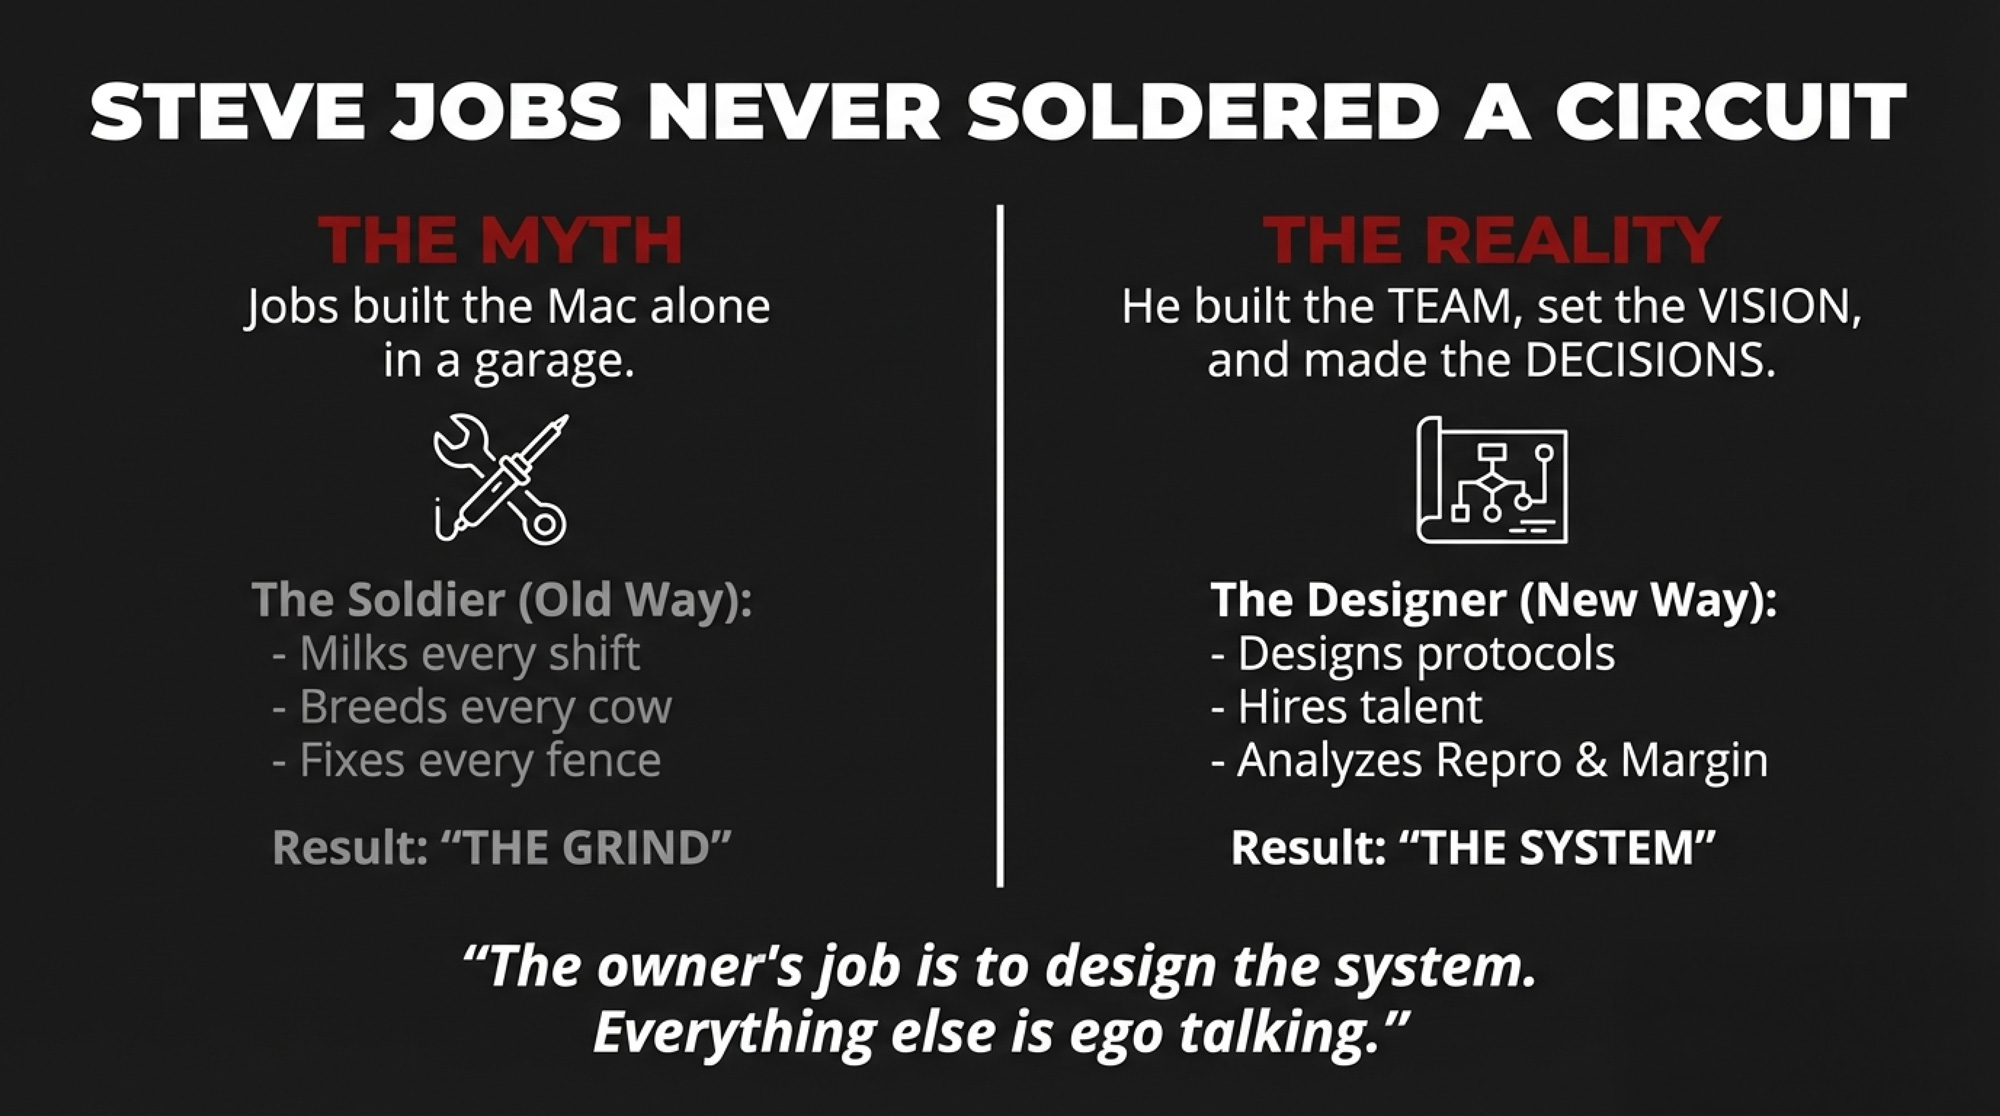
That’s the same shift Steve Jobs made on the original Macintosh – from “doer” to designer. Jobs never soldered a circuit board. He set the vision, picked the team, and killed anything that didn’t fit. The lone‑genius myth looks great on a magazine cover. It also shows up in too many barns as the lone‑wolf owner – and the gap between those two mindsets is about 19 hours a week, roughly 988 hours a year, and at least $24,000 on a 200‑cow herd before you even talk about family time. 

The Steve Jobs Story We Think We Know

Most people picture Jobs in a black turtleneck, holed up in a garage, personally inventing the Macintosh by sheer force of will. Clean story. One guy. One vision. One machine.

The real story’s a lot more crowded. Jef Raskin pitched the Macintosh project inside Apple in 1979 as a cheap, easy‑to‑use computer for ordinary people. Burrell Smith – a self‑taught technician who started in Apple’s service department fixing Apple II boards – designed the first Mac prototype around Motorola’s 68000 processor. Andy Hertzfeld wrote much of the system software. Bill Atkinson built QuickDraw, the graphics engine. Jerry Manock shaped the case everyone remembers. 

Jobs didn’t even join the project at the start. He spotted what the Mac team was doing, got hooked, and forced his way in around 1981. A BYTE magazine roundtable in February 1984 listed a dozen engineers and designers – Atkinson, Hertzfeld, Smith, Kenyon, Hoffman, Egner, Espinosa, Capps, Manock, Horn, Crowe – trading war stories about the machine they’d built together. Jobs sat there asking questions and drawing the line around what counted as “Mac‑like.” 

What Jobs actually owned were the decisions nobody else wanted to make. He decided what the Mac would not be – not a hobbyist toy, not a business terminal, not a stripped‑down Lisa knock‑off. He picked the team, set the standard, killed features that didn’t fit the user experience, and pushed everyone to strip away anything that made the product harder to love. As quoted in that BYTE roundtable, Jobs said the team was driven by “building something really inexpensive so that everyone can afford it”. 

The false lesson from that story is dangerous: if you’re the genius, you have to do everything yourself.

The real lesson is more useful on a dairy. The owner’s job is to design the system and say no ruthlessly. Everything else? That’s ego talking.

The 988‑Hour Gap Between Grinding and Growing

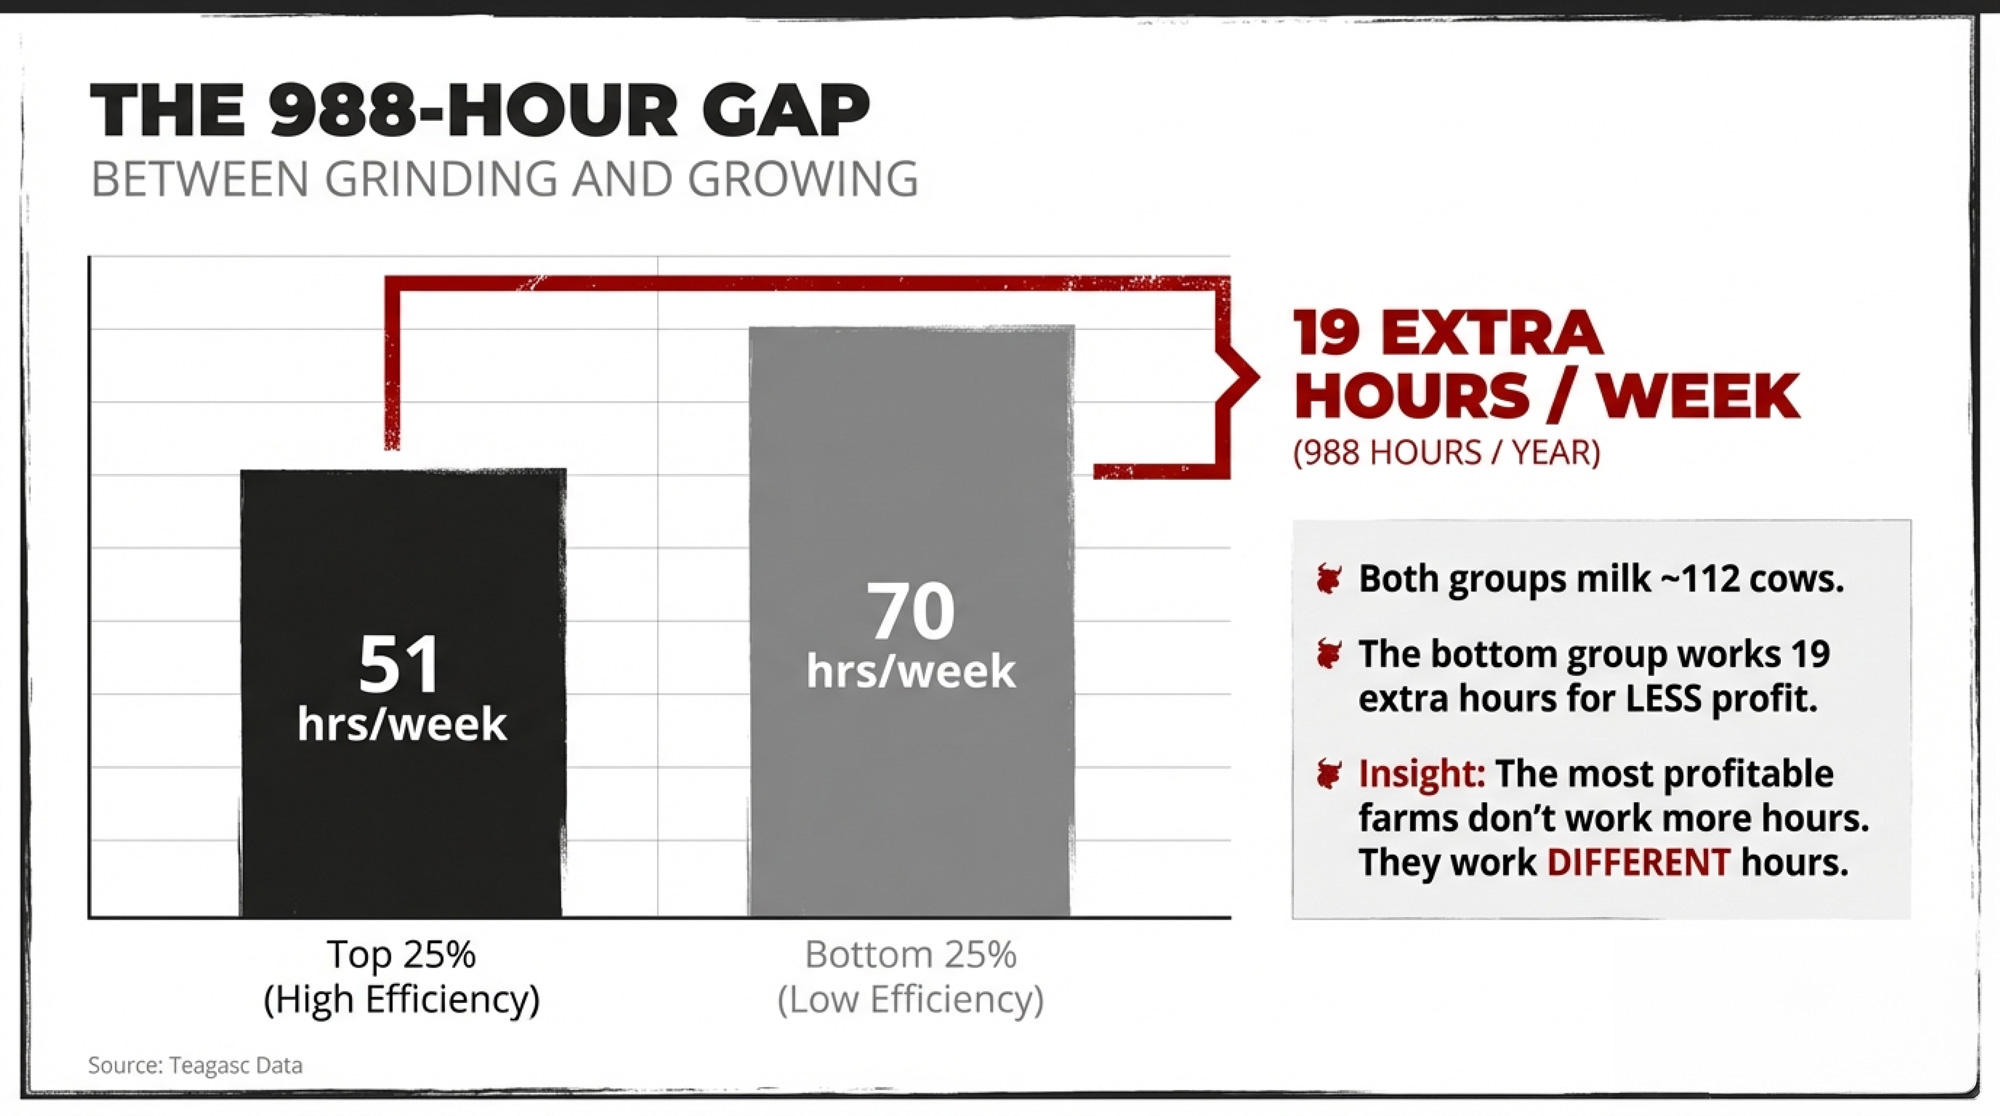
Teagasc Moorepark looked at labour time‑use on Irish pasture‑based dairy farms and split them into the top 25% most labour‑efficient and the bottom 25%. Herd sizes were almost identical – 112 cows in the top group, 113 in the bottom. The difference wasn’t cow numbers. It was hours. 

On those farms, the top group worked about 51 hours a week. The least efficient worked 70. Same cows. Same grass‑based system. Nearly 19 extra hours a week for the bottom group – about 988 hours over a year. 

On a seasonal‑calving Irish place, some of that gap piles up in spring when everything hits at once. But Teagasc’s case‑study work, published in the Irish Journal of Agricultural and Food Research in 2023, showed the same pattern on an individual herd: one 119‑cow spring‑calving operation ran on 2,986 total labour hours a year – about 54 hours a week – with the farmer doing 2,314 of those hours and the rest covered by family and outside help. 

Those numbers are Irish, seasonal, and heavily grass‑based. Your hours will look different on year‑round calving in Quebec tie‑stalls or on robots in Minnesota. But the core finding keeps repeating whenever somebody actually measures it: the most profitable farms don’t always work more hours. They work different hours.

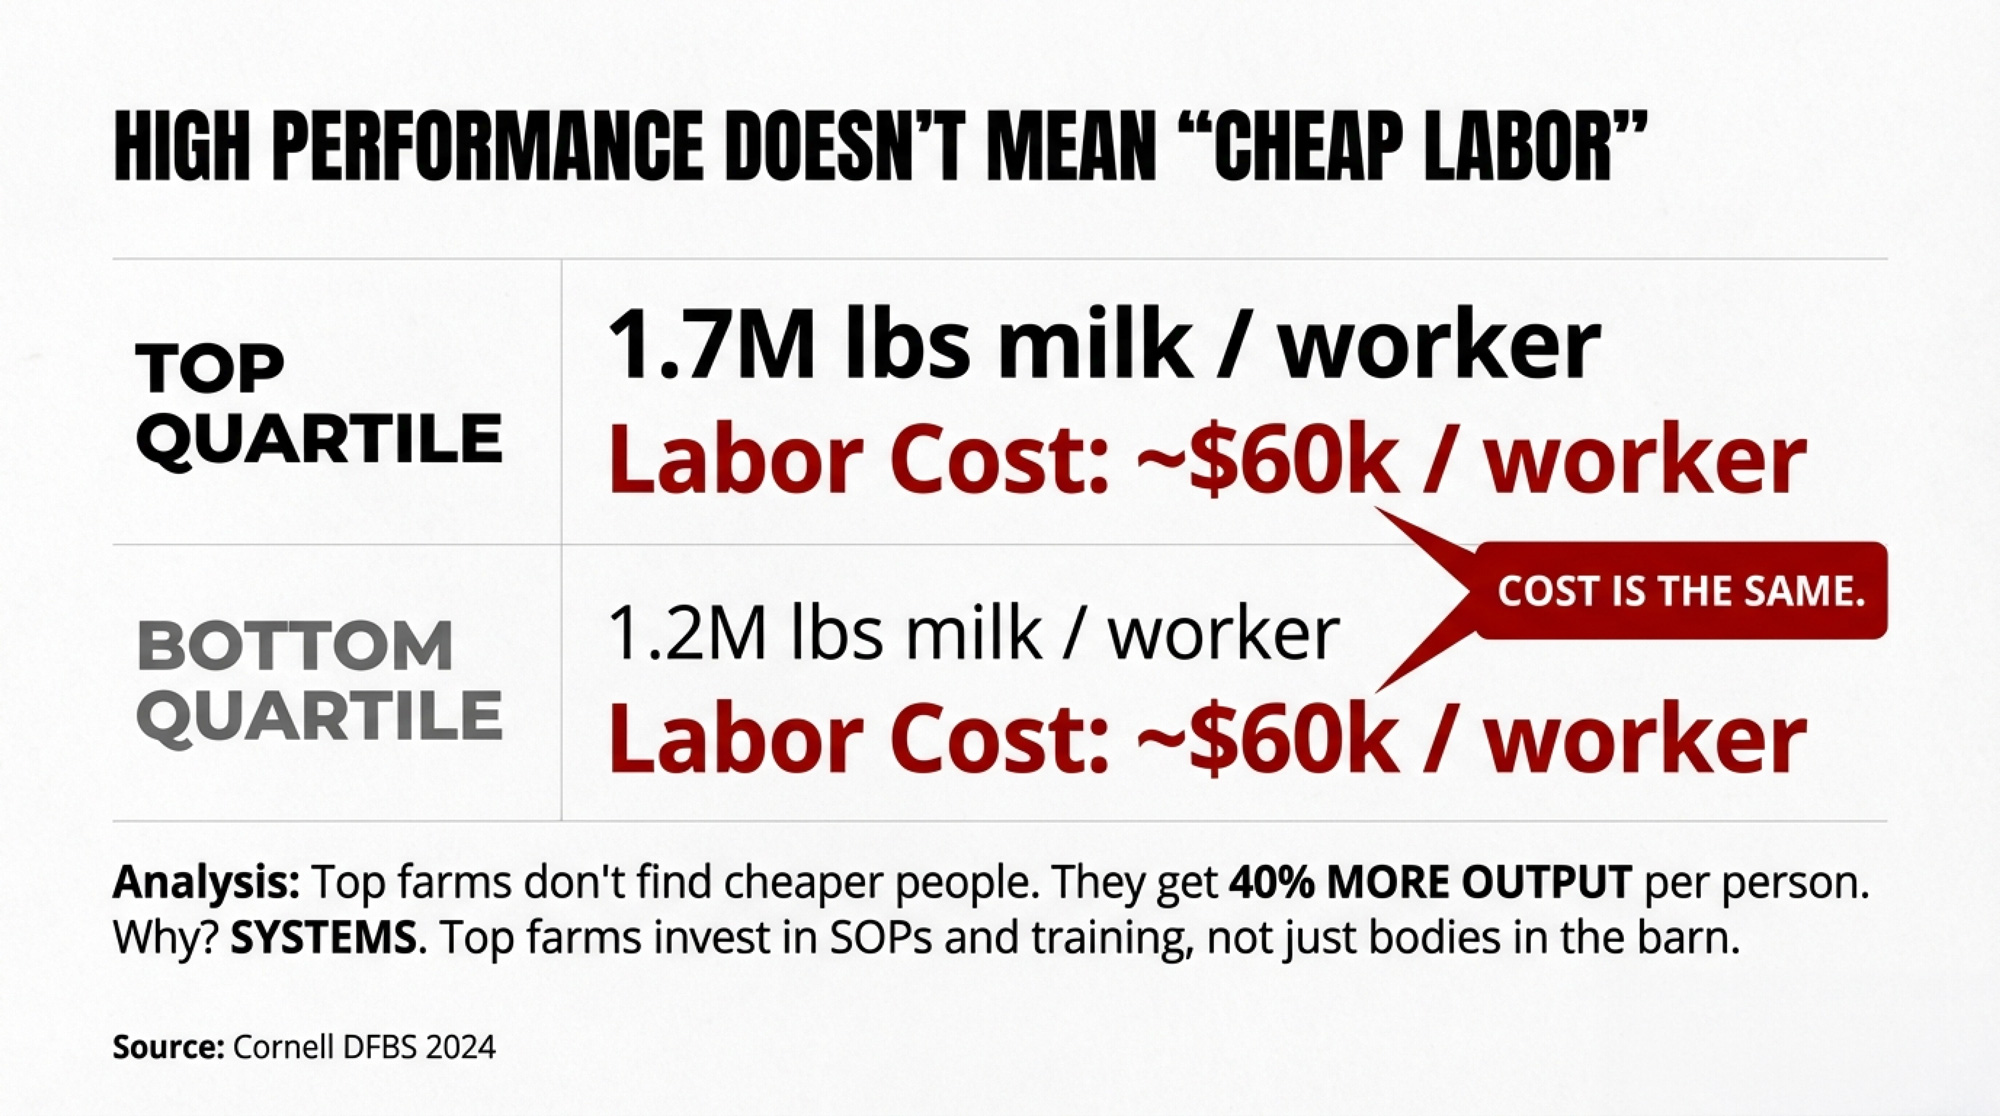
Cornell’s 2024 Dairy Farm Business Summary put teeth on that idea across 129 New York farms. Top‑earning quartile herds shipped about 1.7 million pounds of milk per worker equivalent and spent $3.17/cwt on hired labour. Bottom‑quartile farms shipped about 1.2 million pounds per worker and spent $3.82/cwt. 

Here’s the kicker. Hired labour cost per worker was roughly the same across all four quartiles – between about $57,600 and $61,177 a year. Top farms didn’t find cheaper people. They got a lot more milk per person. That’s what systems do. 

The Identity Problem Nobody Wants to Talk About

Jobs didn’t prove his worth by pulling every all‑nighter himself. He proved it by building a team that could ship a Mac without him standing over every keyboard.

If you’re honest, sleeping until 6:00 a.m. probably feels like failure. When you’ve been told since you were five that “real” dairy farmers are in the barn at 4:30, stepping back from a milking shift can feel like turning your back on your father’s work ethic, your cows, and half your identity.

In Teagasc focus groups, farmers themselves said “less than 55 hours per week” felt like an acceptable workload – anything above that was a grind they tolerated. Bottom‑quartile farms blew past that threshold by 15–20 hours every week. Nobody in those groups was lazy. Many had built herds from 60 cows to 200 by doing exactly what they were taught: show up first, leave last. 

But the data doesn’t care how guilty you feel taking a morning off. It just measures outcomes.

The question isn’t whether the grind was necessary in 1998, when parlours were smaller and sensors didn’t exist. It’s whether the same grind is still the highest‑value use of your time when margins are tight, lenders are watching operating cost per cwt, and the technology to shift your role already sits on the market. 

Every hour you spend holding a milker claw instead of managing reproduction, negotiating inputs, or reviewing cost of production is an hour you don’t get back. And once you put dollar values on those hours, the story changes fast.

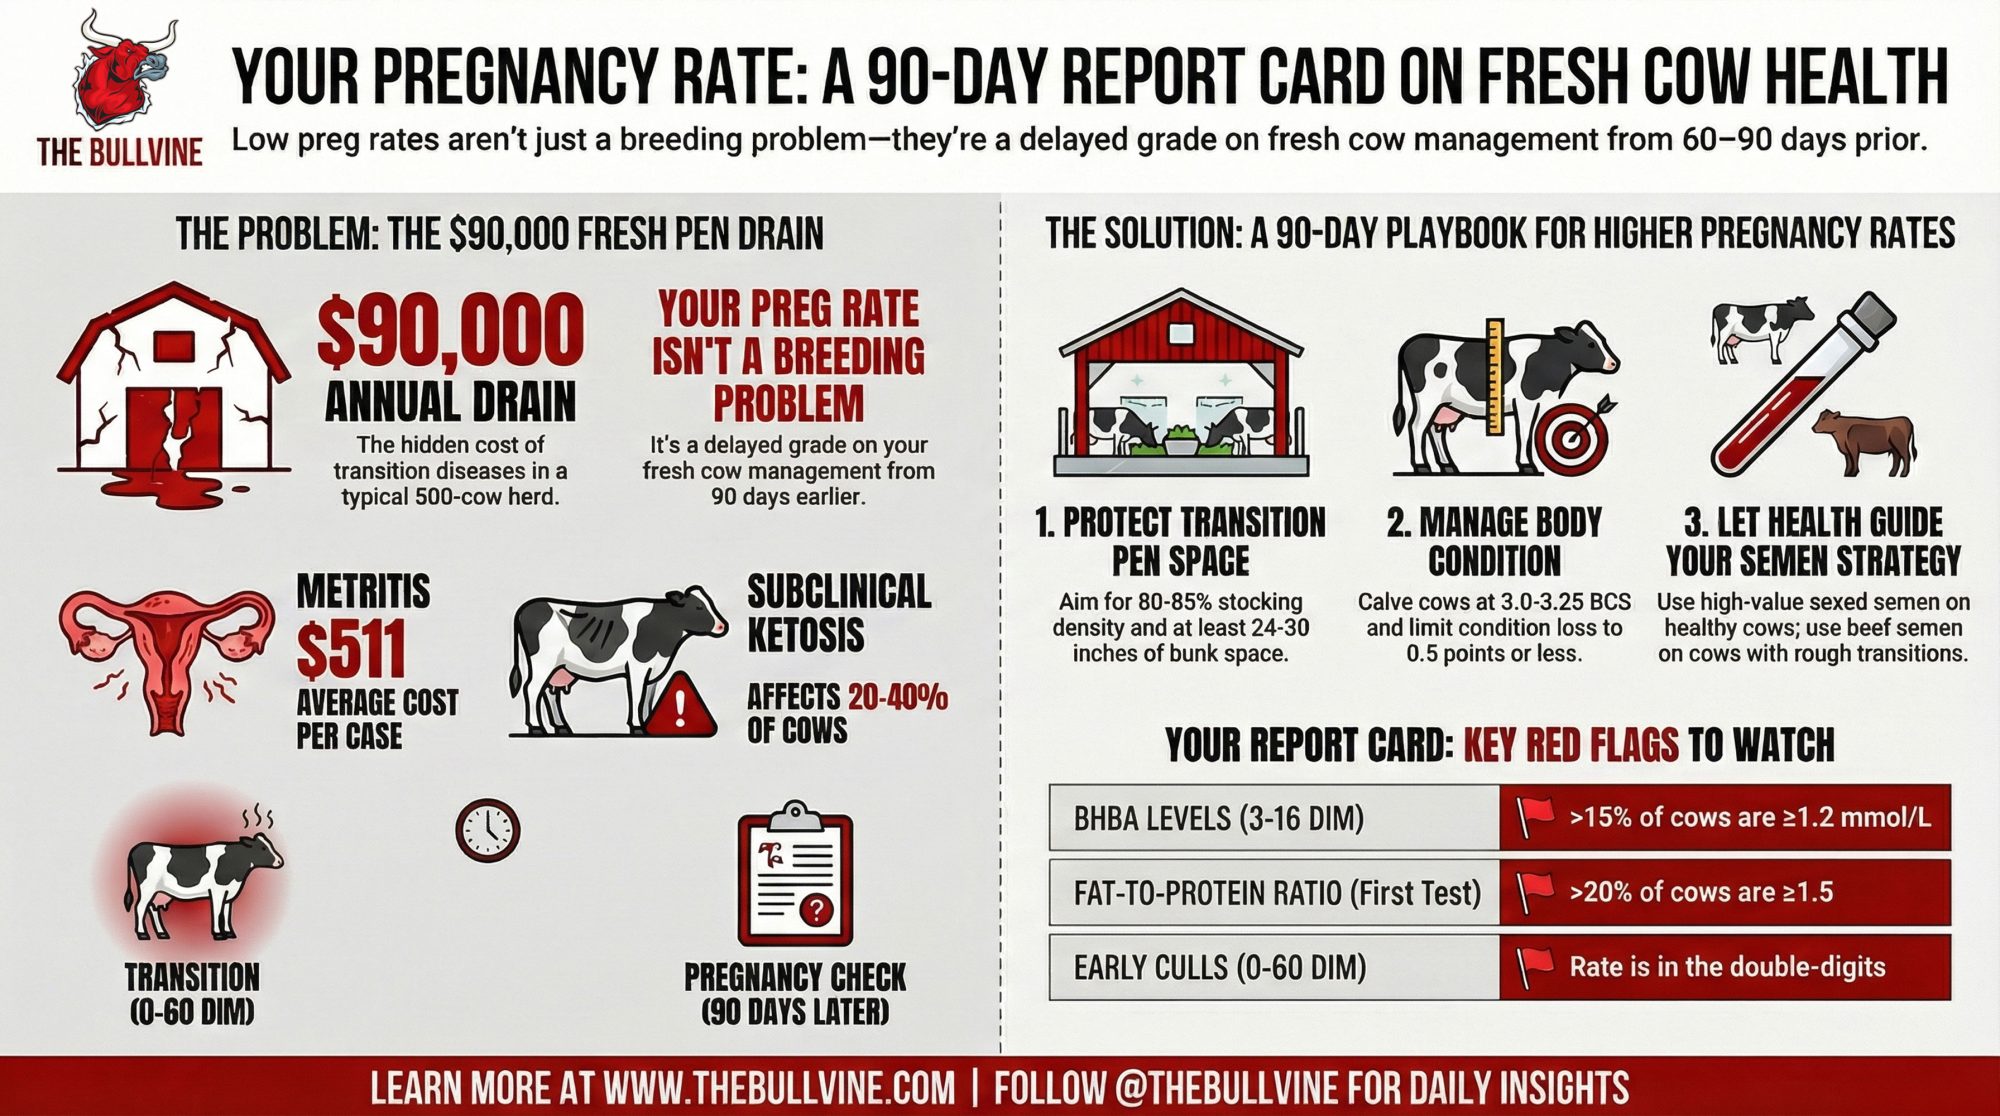
What Does a Six‑Point Pregnancy Rate Gap Actually Cost?

Dr. John Fetrow at the University of Minnesota laid this out in a DCRC white paper, “The Dollar Value of a Pregnancy.” A one‑point improvement in 21‑day pregnancy rate is worth about US$15 to US$35 per cow per year, depending on milk price, replacement heifer cost, and cull value. One pregnancy was worth roughly US$200 to US$600, and every extra day open cost between US$2 and US$6. 

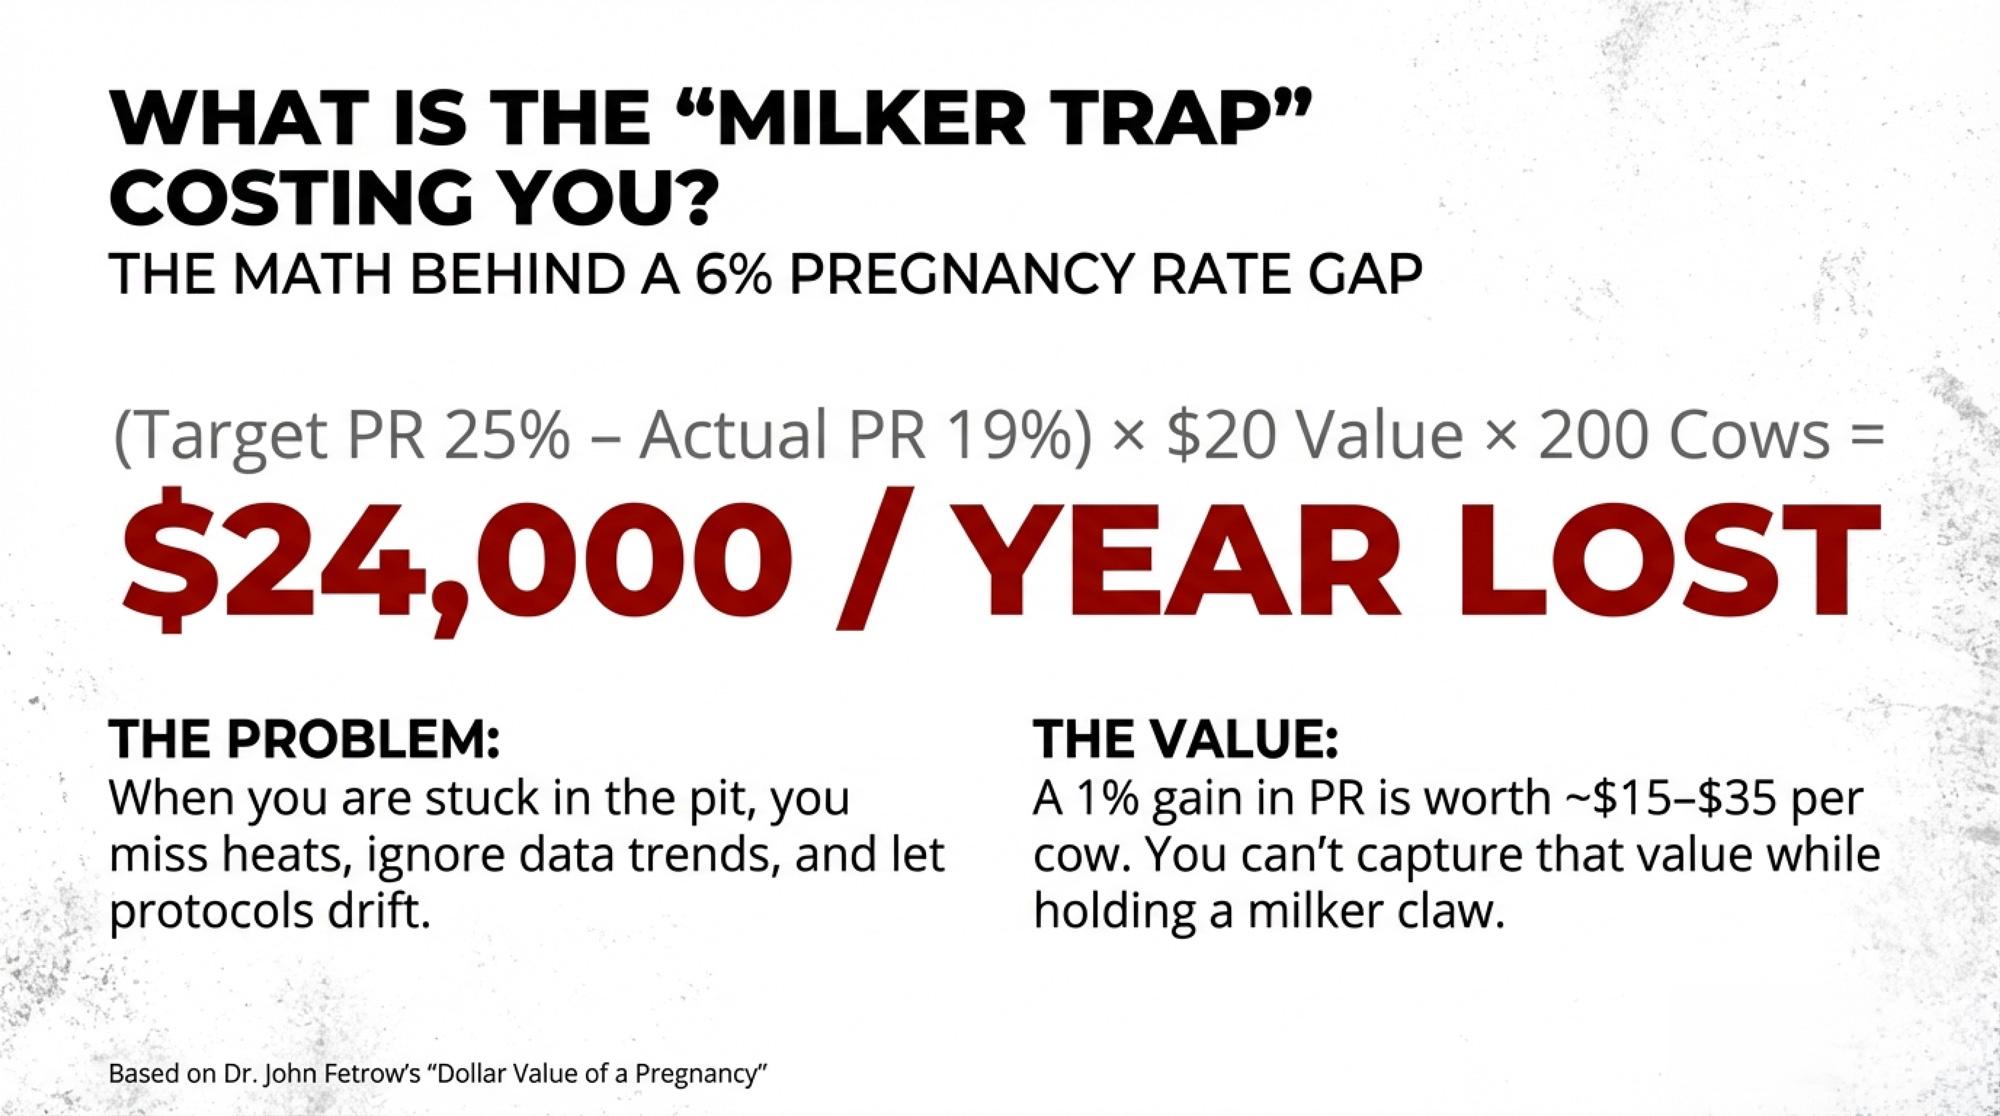
Here’s what that looks like on a 200‑cow freestall. Say your 21‑day pregnancy rate is 19%. A neighbour with similar genetics and facilities sits at 25%. Six‑point gap.

Fetrow’s formula, simplified:

Annual cost = (PR target − PR actual) × value per point × herd size

Plug in the middle of his range:

(25 − 19) × US$20 × 200 cows = US$24,000 per year

Low end at US$15 per point: US$18,000. High end at US$35: US$42,000. Same cows, same facilities, just different repro management.

Your 21-Day Pregnancy RateNeighbour’s PR (Target)Annual Cost at $20/PointRange ($15–$35/Point)
15%25%$40,000$30,000 – $70,000
17%25%$32,000$24,000 – $56,000
19%25%$24,000$18,000 – $42,000
22%25%$12,000$9,000 – $21,000

The University of Wisconsin’s “Repro Money” program – developed by UW–Madison’s Department of Dairy Science with UW–Extension – tested this on real farms. Forty Wisconsin dairies completed the team‑based program. On average, they lifted 21‑day pregnancy rate by two points and saw an estimated economic gain of US$31 per cow per year. No new sheds. No shiny robots. Mostly structure: advisory teams, clearer repro protocols, regular review meetings. 

On 200 cows, that Repro Money average is US$6,200 a year. On 300 cows, US$9,300. Run Fetrow’s six‑point example at US$20 and you’re back at US$24,000‑plus territory. 

You don’t fix a pregnancy‑rate problem from inside the parlour. You fix it with better heat detection, cleaner data, tighter protocols, and a team that’s trained and trusted to execute. That’s owner work. Not milker work.

What Jobs Actually Did – and What Smart Dairy Owners Do

Jobs didn’t write code, machine cases, or design circuit boards. He surrounded himself with people who could, then obsessed over decisions, not tasks. On a dairy, the parallels are closer than most owners want to admit. 

Product vision → herd vision. Jobs decided the Mac would be cheap, beautiful, and easy to use – not a Lisa clone and not a hobbyist box. On your farm, this is the one‑sentence answer to “What is this herd optimized for?” Cash flow? Components? Low‑labour lifestyle? If you can’t say it in a sentence, your team can’t execute it. 

Team‑building → hiring and developing your people. Jobs poached Andy Hertzfeld from the Apple II team, pulled Bill Atkinson from the Lisa project, gave Burrell Smith freedom to build prototypes until something clicked. Kirk did his own version. According to the AHDB profile, he invested in Harrison – including sending him to the U.S. with Worldwide Sires for a week to visit American herds and breeders – then handed him real responsibility when he came back. That’s not “help.” That’s succession in slow motion. 

System design → SOPs and data flows. Jobs killed features engineers loved if they made the Mac feel clunky. On your farm, that’s your milking routine, your fresh‑cow checks, your repro protocol, and how data moves from parlour or robot into decisions. CAFRE in Northern Ireland puts it bluntly: “It does not matter if a dairy producer has the best milking parlour feeding system and housing in the world, if employees do not perform their tasks consistently, herd health and performance will suffer.”

And the big one.

Saying “no” → culling tasks off the owner’s plate. Jobs killed the internal fan and a floppy port on the original Mac because he cared more about noise and simplicity than backward compatibility. On a dairy, saying “no” means dropping unprofitable side projects, stepping away from that one milking shift your ego says only you can run, or killing a tradition once the math proves it doesn’t work. 

The owner’s “unit of work” has to shift from “hours in the parlour” to “decisions per week that move net margin.”

That single sentence is worth putting on your office wall.

Are You Designing the System – or Just Running Laps Inside It?

Great cows don’t help much if the person running the breeding list is too tired to see a cow in heat.

Grab a scrap of paper and be honest with yourself.

  • Where do you spend your first hour every morning? Looking at repro lists and yesterday’s data, or already halfway through a milking shift?
  • Who actually makes breeding decisions? You set a plan and trust someone to handle heat detection and AI – or you personally breed every cow and heifer because “nobody else will do it right”?
  • What happens if you’re gone for three days? Do metrics hold, or do SCC and repro numbers wobble the moment you leave the yard?
  • How often do you review cost of production and labour cost per cwt? Monthly at minimum, or “whenever the accountant sends something”?

If your answers land in the second column more than twice, you’ve probably found the real bottleneck on your operation. And it’s the name on the mailbox.

Do Robots and Sensors Fix the Lone‑Wolf Problem?

Jobs was obsessed with user experience – he wanted people to turn a Mac on and just know what to do. Today’s dairy tech sells a similar promise. Robots milking around the clock. Collars flagging heats and health events. Sort gates moving the right cows at the right time. 

The uncomfortable truth: robots and sensors don’t fix the lone‑wolf problem if the owner still insists on personally watching every exception and making every micro‑decision.

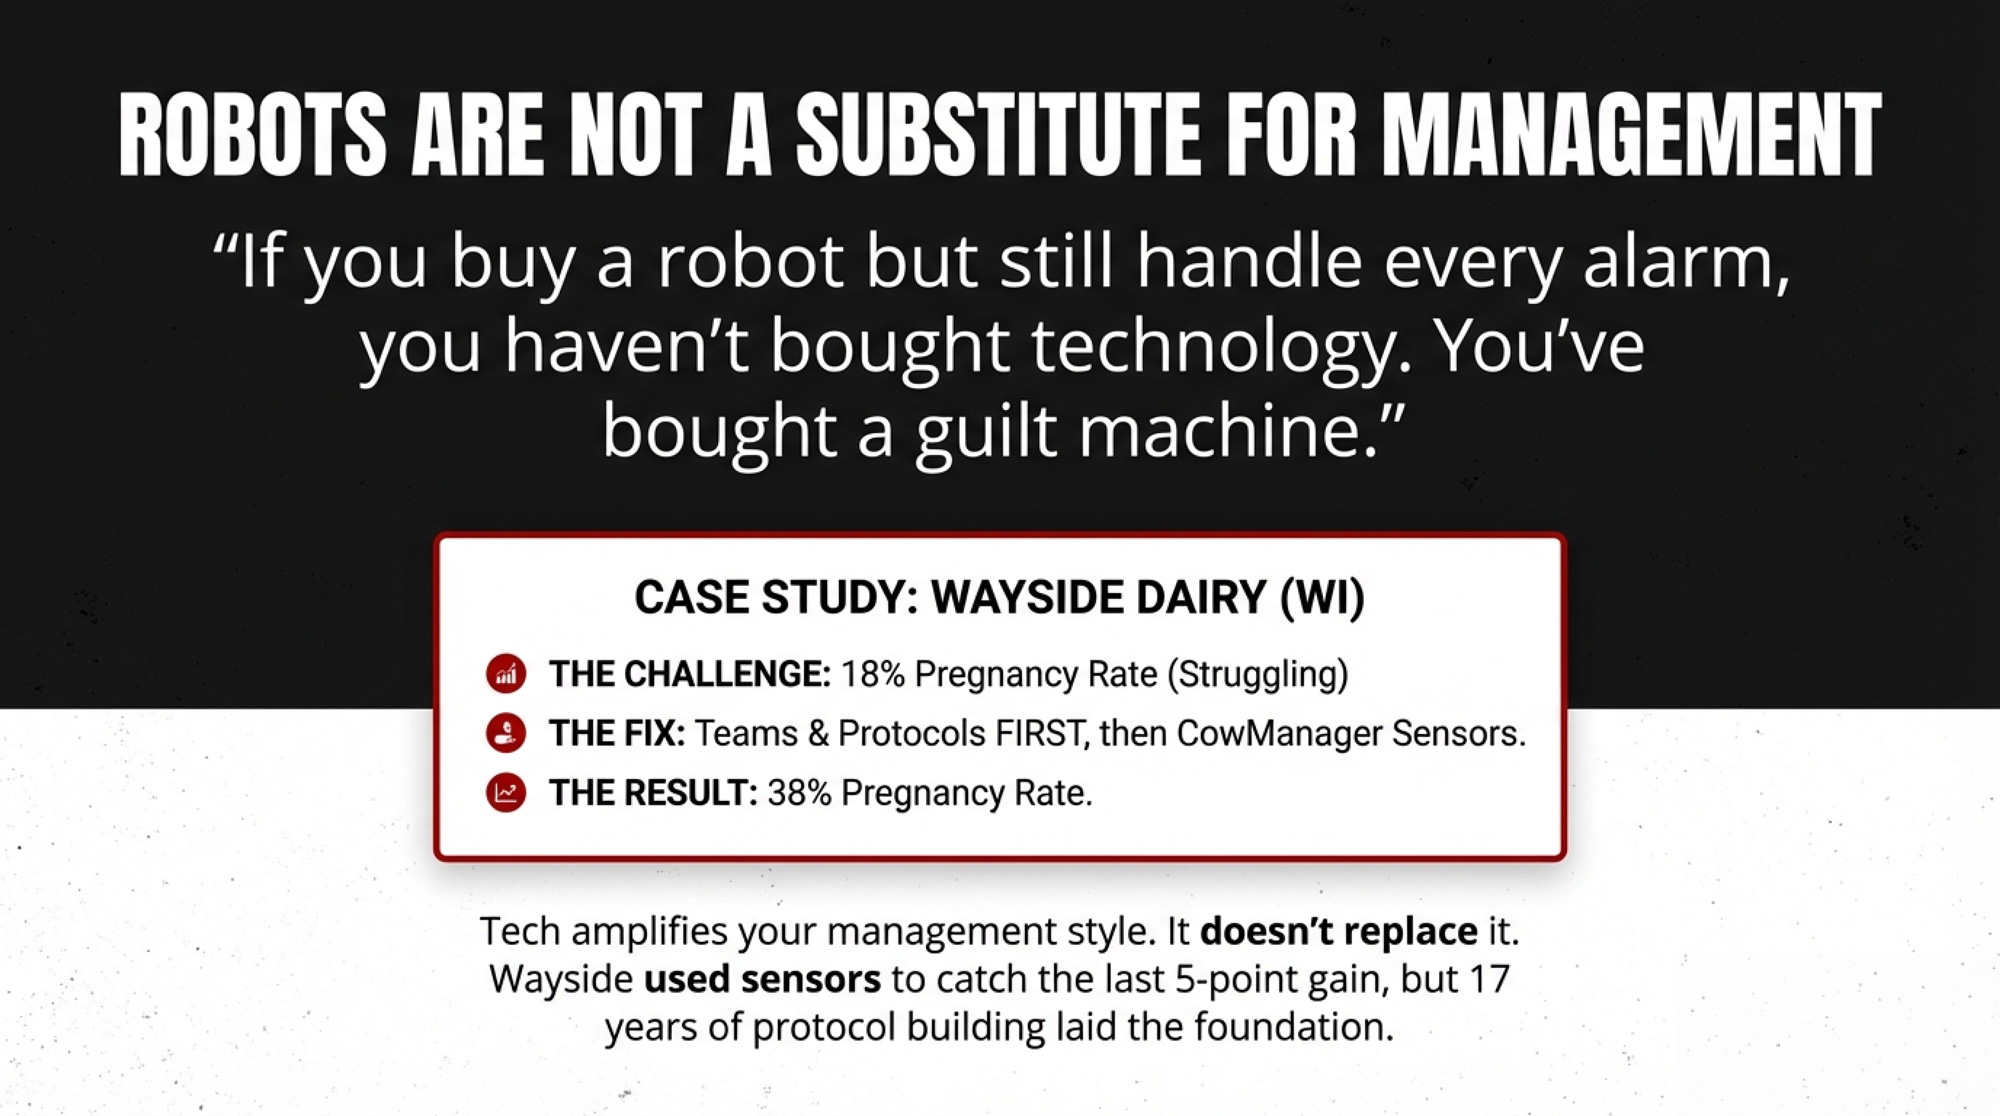
Look at Wayside Dairy LLC near Green Bay, Wisconsin. Co‑owners Jeremy Natzke, his father Dan, sister Jenna Nonemacher, and partner Jesse Dvorchek milk about 2,000 cows with 1,850 replacements, rolling herd average around 32,171 lb with 4.3% butterfat and 3.3% protein . For years their pregnancy rate hovered around 18% . Over roughly 17 years they brought in a new vet, changed nutritionists, implemented a double Lutalyse shot program, and added a 4 mL dose of GnRH 10 days before first breeding . “We kept asking consultants how we can improve,” Natzke told Bovine Veterinarian Online .

Those management changes – not a piece of stainless steel – lifted Wayside’s pregnancy rate to about 33%. Then, in mid‑2020, they installed CowManager ear sensors across the herd. In a Select Sires case study published in September 2022, Natzke said, “The return on investment with CowManager is really very quick. What it does is allow us to spend more time with the animals that need more attention”. By then, their pregnancy rate had climbed to 38% – because the Fertility alerts catch more cows on natural heats, reducing how many need the synchronization program and saving on both drug costs and labour. 

Seventeen years of decisions, protocols, and team development built the foundation. The sensors made it easier to catch that last five‑point gain because the system was already there to act on the data.

TaskThe “Robot/Sensor” JobThe “Owner/Designer” Job
Heat Detection24/7 Activity/Rumination AlertsSetting the “Threshold” for Intervention
MilkingUnit Attachment & Milk MappingReviewing Quarter-Level SCC Trends
HealthFlagging “Off-Feed” or High TempConsulting Vet on Treatment Protocols
DataRecording the 1,000 EventsDeciding which 3 Events matter today
Succession / LifestyleProviding a functional assetEnsuring the farm is a life the next generation wants, not just a job they have.

If you bought a robot and still insist on being the robot, you didn’t buy technology. You bought a guilt machine.

The right tech lets you work more like Jobs: set the rules, watch a dashboard, make a handful of big calls, step in only when the system throws a true red flag. The wrong mindset turns every robot alarm into another reason you can’t ever leave the yard.

Options and Trade‑Offs for Letting Go of the Milker Claw

There’s no single path out of the lone‑wolf trap. Herd size, labour market, and bank account all shape what’s realistic. But the data points to patterns that work – and each one carries real friction you should know about upfront.

MilestoneAction ItemTarget Metric
Day 1Write the “One-Page SOP” for the AM shift.Zero ambiguity in prep/post-dip.
Day 15Side-by-side training with “Shift Lead.”100% protocol compliance.
Day 30Owner Vacates Shift.Track SCC & Bulk Tank Weight.
Day 90Reallocate 15 hours/week to Repro Data.+1.5 points in 21-day PR.

Path 1: The 30‑Day Milking Test (Any Herd Size – Start This Month)

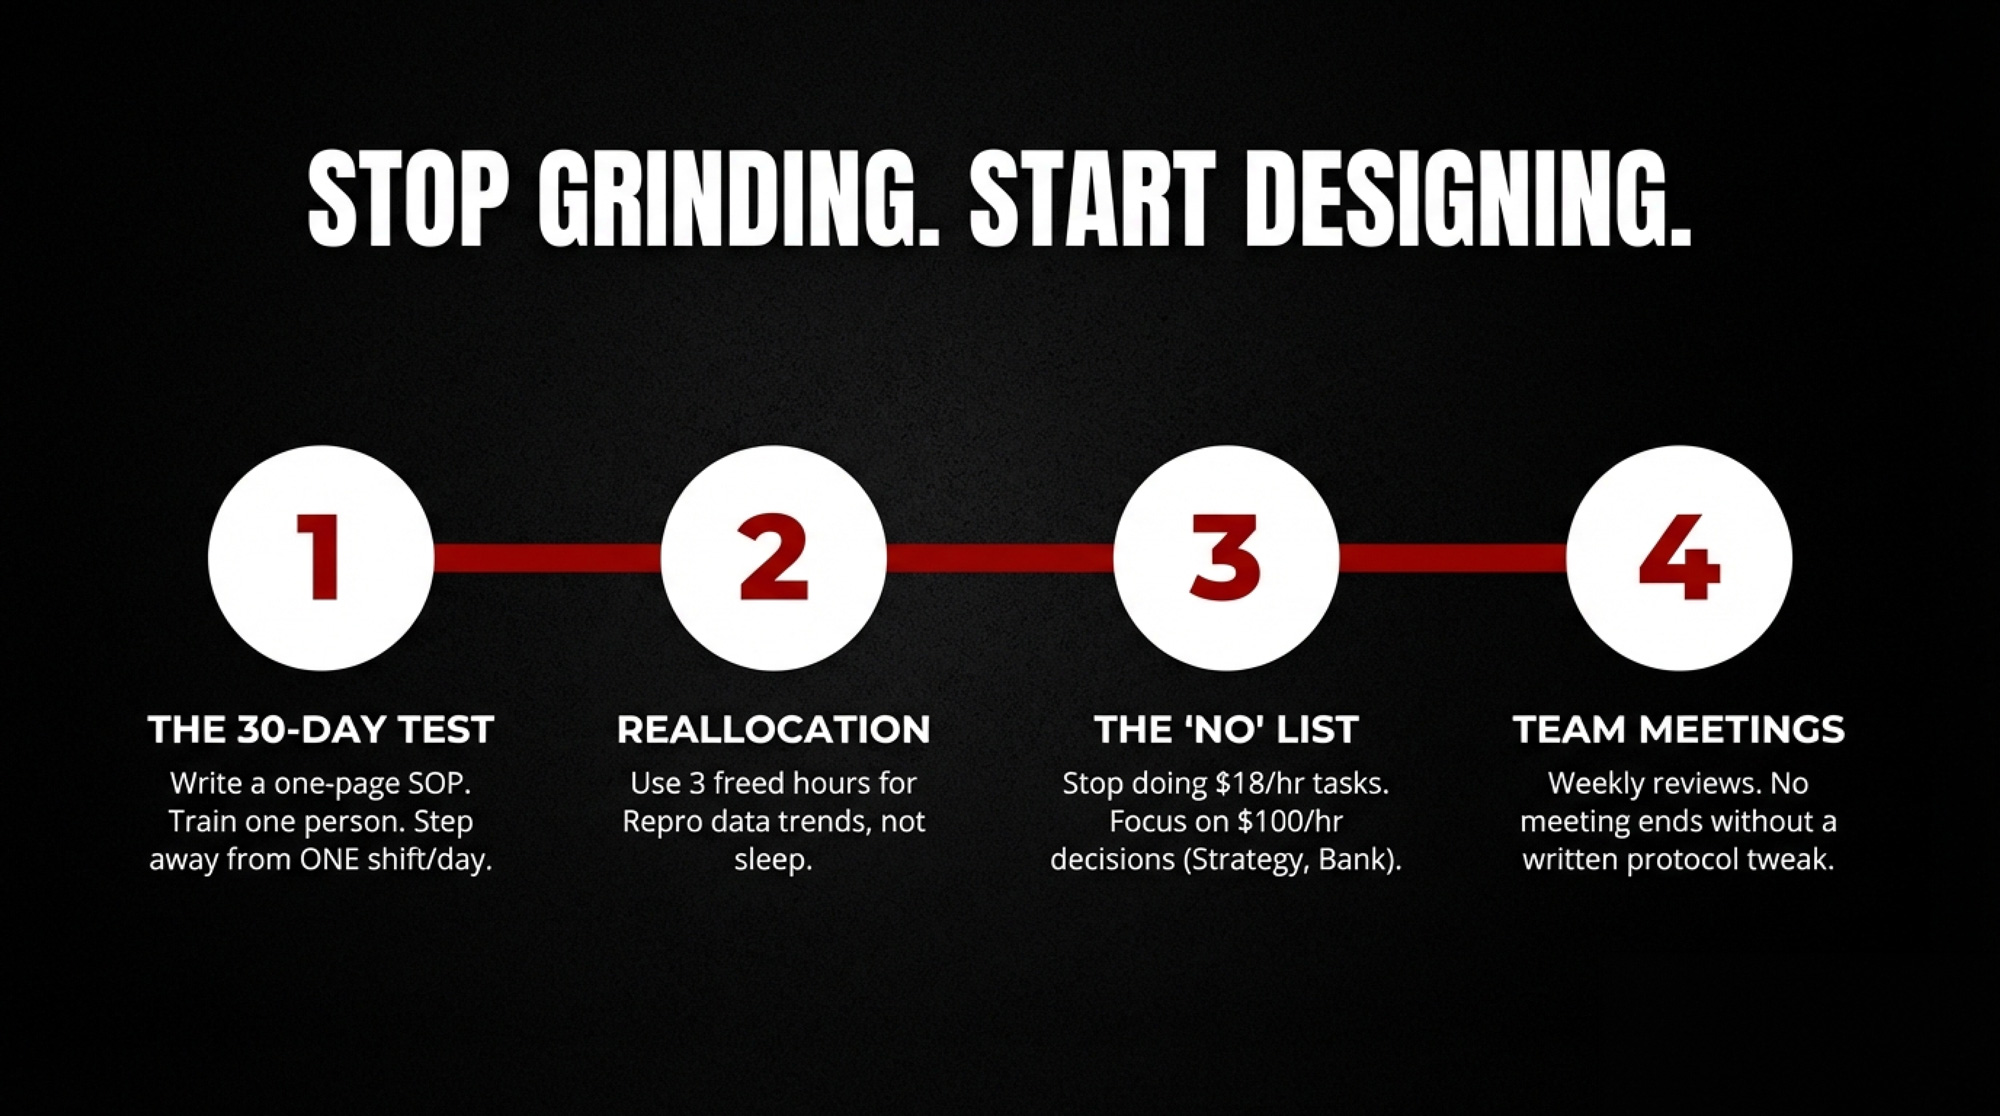
Steve Jobs’ first move wasn’t to code faster – it was to get out of the weeds. On your farm, that starts with one milking shift per day you’re willing to be absent from within 30 days. Write how you want that shift to run on one page: cow flow, prep routine, unit attachment, post‑dip, wash‑up. If you can’t fit it on a page, you don’t have a standard. You have a wish.

Train one person to run that shift to that page. Pay them for the responsibility. Then for 30 days, track three numbers: milk shipped per cow, bulk tank SCC, and how many cows hit your mastitis treatment list. If numbers hold, that shift becomes “owner‑optional” permanently.

If they slip, that’s not proof delegation fails. It’s proof you’ve got training or clarity gaps to fix. Don’t run back into the parlour and tell yourself “nobody cares like I do.” Fix the gap.

That first owner‑free milking is the proof your system works, not just your back.

Path 2: Strategic Reallocation on 150–500‑Cow Herds

This is where Kirk lives. When he stepped out of one milking, he freed up 3–4 hours a day. According to the AHDB profile, he put those hours into consistent feed push‑ups to lift dry matter intake, a daily chalking routine for heat detection at the same time every day, and investing in Harrison’s skills. 

Those changes helped move his pregnancy rate from 20% to 25%. Run Fetrow’s math on 300 cows at US$20 per point: 

(25 − 20) × US$20 × 300 cows = US$30,000 per year

At the low end (US$15): US$22,500. High end (US$35): US$52,500. That’s the kind of margin movement that separates “covering the bank” from “actually getting ahead.” 

The risk is real: for the first 60 days, it’ll feel like standards are slipping. You’ll see things you don’t like. Treat that as feedback on your system, not proof that stepping back was a mistake.

Path 3: The Team Build on 500+ Cow Herds

Above 500 cows, the question isn’t whether to delegate. It’s whether you’re doing it with structure.

Written SOPs, weekly team meetings, and outside advisors earn their keep here. The UW Repro Money program showed that when farms created farmer‑led repro teams – owner, vet, nutritionist, key staff – and actually met, average pregnancy rate improved by two points at about US$31 per cow per year. On a 700‑cow herd, that’s US$21,700 annually from repro alone. 

Forty farms completed the program . They didn’t keep meeting out of politeness. They kept meeting because the numbers moved.

The risk? Meetings for the sake of meetings. Simple fix: every meeting ends with three things written down. One protocol tweak. One training commitment. One number to check before the next meeting. Without those, you had coffee, not a team.

Path 4: The Financial Reckoning When U.S. Margins Are Tight

If your all‑milk price hovers close to your cost of production, you can’t afford to spend 70 hours a week doing work you could hire a livestock worker to do. USDA’s Farm Labor report for January 2025 pegged the national average at US$18.15/hour for livestock workers. In the Great Lakes region – Wisconsin, Minnesota, Michigan – the 2024 annual average ran US$17.68/hour. That’s roughly US$37,750 in base wages for a full‑time position, or about US$47,000–$49,000 once you load in payroll taxes, workers’ comp, and basic benefits. 

Meanwhile, US$50‑to‑US$100/hour decisions – breeding strategy, capital allocation, lender negotiations, ration‑level changes – keep getting pushed “to when it’s quieter.”

Cornell’s DFBS numbers are blunt. Bottom‑quartile farms spent about US$22.32/cwt in operating costs. Top‑quartile farms: US$15.79/cwt. Gap of US$6.53/cwt. On a 200‑cow herd shipping 75 lb/day, that’s roughly 5,475 cwt a year × US$6.53 = about US$35,750 per year

Not all of that gap is labour. But your lender already knows which side you’re on – they see your cost per cwt long before you do.

As labour tightens and margins compress through 2026–2027, farms that already treat owner time as a strategic resource will flex – cut hours, keep performance, absorb shocks. Farms that keep using the owner as the cheapest milker in the barn will break first.

PathUpfront CostPayback TimelineExpected Annual GainBiggest Friction Point
30-Day Milking Test$0–$2,000 (training time)30–60 days3–4 hrs/day freedFeels like losing control first 2 weeks
Strategic Reallocation (150–500 cows)$37,750–$49,000 (one FTE)6–12 months$22,500–$52,500 (5-pt PR gain)Standards slip for 60 days during transition
Team Build (500+ cows)$5,000–$15,000 (SOPs + advisor time)4–6 months$21,700+ (2-pt PR gain, 700 cows)Meetings feel like busywork without strict 3-item close
Financial Reckoning$0 (audit existing time use)Immediate insight$35,750 (closing Cornell cost gap)Admitting you’re the bottleneck, not the hero

Tech Investment: What the Numbers Actually Look Like

If you’re weighing sensors against robots, the cost gap is worth spelling out. Ear‑tag monitoring systems like CowManager run about US$0.07 per head per day according to CowManager reps – roughly US$25.55 per cow per year. Activity monitoring platforms more broadly (collars and ear tags combined) range from US$80–$150 per cow in hardware, plus base station equipment (US$2,500–$5,000) and software licensing (US$1,800–$3,600 annually), putting a 200‑cow operation at roughly US$20,000–$38,600 all‑in for the first year. 

A full robot string? US$400,000‑plus per unit once you count construction.

That doesn’t mean robots are wrong. It means the investment decision needs to match your actual bottleneck. If your bottleneck is information – catching heats, flagging health events, getting data into decisions faster – sensors at US$25/cow/year are a different conversation than robots at six figures.

TechnologyCost per Cow (Year 1)200-Cow Herd All-InBottleneck It Solves
Ear-Tag Sensors (e.g., CowManager)$25.55/year$5,110/year (ongoing)Information: catching heats, health alerts, getting data into decisions faster
Activity Monitoring Platform (collars/tags + infrastructure)$100–$190$20,000–$38,600Information + protocol consistency: 24/7 monitoring, automated alerts, team accountability
Single Robot Unit (incl. construction)$2,000+$400,000+Labour replacement: physical milking task automation, BUT only if system/team already works
Full Robot String (3–4 units, 600+ cows)$2,000–$2,500+$1.2M–$1.5M+Scale labour constraint: enabling herd growth when local labour market fails

Key Takeaways

  • If you can’t miss one milking a day without stressing out, your 30‑day goal is simple: pick a shift, write a one‑page SOP, train one person, track SCC and milk per cow for a month. Numbers hold? That shift is owner‑optional from now on.
  • If your 21‑day pregnancy rate sits below 22%, run Fetrow’s formula with your own herd size this week. If the number makes your stomach drop, book a repro team meeting with your vet and nutritionist and commit to one protocol change within 60 days. 
  • If your name shows up more than three times on the “who handles exceptions” list for robots or sensors, you’ve found your bottleneck. Write down what the tech is responsible for and what humans handle. Pick one area to hand off within 90 days.
  • If you haven’t reviewed cost per cwt and labour cost per cwt with your lender in six months, that’s your next call. Within a year, you want your time usage mapped well enough to say, with a straight face, “Here’s what I earn per hour of owner work.”
  • If your job description still reads ‘chief milker,’ remember Jobs didn’t prove his worth by living in the lab. He proved it by building a lab that worked when he walked out the door.

The Bottom Line

Ten years from now, the herds still standing will be owned by people who stopped pretending they were the machine and started acting like the designer – more Steve Jobs than “hired milker in chief.”

So this year – when you look at your own time sheet, even if it’s just the back of an envelope – which job are you training for?

Complete references and supporting documentation are available upon request by contacting the editorial team at editor@thebullvine.com.

Learn More

The Sunday Read Dairy Professionals Don’t Skip.

Every week, thousands of producers, breeders, and industry insiders open Bullvine Weekly for genetics insights, market shifts, and profit strategies they won’t find anywhere else. One email. Five minutes. Smarter decisions all week.

NewsSubscribe
First
Last
Consent

Is Your Fresh Pen Costing You $90,000? The 90-Day Transition Fix for Pregnancy Rate

Metritis + SCK can quietly drain US$90,000 from a 500‑cow herd. The fix starts 90 days before you ever thaw a straw.

Executive Summary: Most of us still reach for semen, protocols, or the AI tech when pregnancy rate flattens, but what’s interesting is how often the real damage was done 60–90 days earlier in the fresh pen. A 2023 study on 15,041 Holsteins bred on Double‑Ovsynch found that cows with transition diseases in the first 30 DIM had clearly lower pregnancy per AI and more pregnancies lost by 60 days, even under excellent repro management. At the same time, economic work shows metritis averaging about US$511 per case and subclinical ketosis hitting 20–40% of cows in many herds, together easily stripping around US$90,000 a year from a 500‑cow operation once milk loss, disease, extra days open, and early culls are added up. This article treats pregnancy rate as a “90‑day transition report card” and walks through simple tools—NEFA/BHBA thresholds, fat‑to‑protein ratios, peak curves, and early‑lactation culls—that make that connection visible in your own data. From there, it lays out a clear playbook: a BHBA testing routine you can run on Mondays, realistic stocking and bunk space targets, BCS and F:P benchmarks, and a health‑based plan for where to use sexed dairy semen versus beef‑on‑dairy. Whether you’re in a Wisconsin freestall, a Western dry lot system, a Canadian quota barn, or a seasonal grazing herd, the goal is the same—tighten up fresh cow management so the next three preg checks feel a lot less like a guessing game and a lot more like a controlled business decision.            

When a herd’s pregnancy rate gets stuck in the low‑to‑mid‑20s, the conversation still usually starts in the breeding pen. You know how it goes: semen choices, heat detection, synchronization tweaks, maybe a quiet question about the AI tech. That’s where the problem shows up in your software, so that’s where everyone looks first.

What’s interesting now is that newer work is making a pretty strong case that your pregnancy rate is really grading your fresh cow management from 60 to 90 days earlier, not just what happened on breeding day. A 2023 study in JDS Communications followed 15,041 Holstein cows in a high‑producing German herd where every first service was done on a Double‑Ovsynch program. Cows that had transition problems—milk fever, retained fetal membranes, metritis, ketosis, left displaced abomasum, or mastitis—in the first 30 days in milk had lower pregnancy per AI at 32 days and, in several of those categories, more pregnancies lost by 60 days than cows that stayed healthy, even though they all followed the same repro protocol.

So the old idea that “I’ll fix my preg rate with better semen and tighter protocols” is really only half the story. The other half is, “What were these cows living through in those first few weeks fresh?”

Looking at This Trend: Biology Keeps Pointing Back 90 Days

Let’s walk through the biology the way we’d talk it through over coffee. Once you see the timing inside the cow, this 90‑day connection stops feeling like a theory and starts looking like common sense.

The Egg You Breed Was Built During the Fresh Period

You probably know this already, but we all forget it sometimes: the follicle you breed at 60–80 days in milk didn’t show up last week. It’s been developing for weeks in the ovary. The “high fertility cycle” idea, outlined in a 2020 review, showed that cows that become pregnant around 130 DIM tend to lose less body condition after calving, experience fewer health events, have better fertility at first insemination, and have lower pregnancy loss. That pattern tells us fertility is strongly tied to what happened during the dry period and the early fresh period.

During that stretch, most cows slide into negative energy balance. Milk is ramping up, but dry matter intake hasn’t caught up yet. So the cow pulls more energy from body fat, which pushes non‑esterified fatty acids (NEFA) up in the blood and, if the liver gets overloaded, beta‑hydroxybutyrate (BHBA) as well. Cornell work and follow‑up studies have shown that when too many cows run with high NEFA and BHBA around calving, the herd sees more transition disease and weaker reproductive performance.

In an epidemiology study many of you will have heard about by now, Jessica McArt, DVM, PhD (Cornell University), and colleagues followed 1,717 cows in four New York and Wisconsin freestall herds. They tested blood BHBA between 3 and 16 days in milk and used 1.2 mmol/L as the cutoff for subclinical ketosis (SCK). In that dataset, 43.2% of cows had at least one BHBA reading at or above 1.2 mmol/L, with risk peaking around day five fresh. A larger study in 10 countries found a median SCK prevalence of 21.8% between 2 and 15 DIM at the same cut point, with herds ranging from 11.2% to 36.6%.

So in many herds, somewhere between one in five and almost half of the fresh cows are running with elevated ketones in that first couple of weeks. That’s a lot of cows quietly working too hard metabolically before we ever talk about breeding.

Now, here’s where it gets uncomfortable biologically. Several studies on negative energy balance and reproduction have shown that elevated NEFA and BHBA don’t just circulate in the blood—they show up in follicular fluid, right where the next oocytes are maturing. Under those conditions, oocytes tend to mature more slowly, fertilization rates are lower, and the embryos that do develop have fewer cells and more signs of stress and cell death in culture. Work examining genetically divergent fertility lines has also shown that cows in deeper negative energy balance after calving can exhibit slower follicle growth and altered ovarian activity compared with cows in better energy status.

In other words, the egg you’re hoping to get pregnant at 70 DIM has already been “programmed” by whatever energy and health storms the cow went through in those first three or four weeks fresh. If she was deep in negative energy balance and battling disease, that egg is starting behind.

The Uterus Doesn’t Forget a Rough Start

Then there’s the uterus, which is often harder to see from the alley. A metritis cow can look “fixed” pretty quickly: smell is gone, discharge looks cleaner, she’s eating again. It’s easy to mentally tick that box and move on.

But research and field experience say the uterus remembers that rough start longer than we’d like. A Hoard’s Dairyman article that drew on transition cow research described a “hangover effect” of uterine disease—cows that had metritis or retained fetal membranes early on often had slower uterine involution or subclinical inflammation later, even when they looked normal from a distance. That lingering inflammation can delay the return to normal cycles and make it harder for early pregnancies to survive.

The 2023 Double‑Ovsynch study we started with backs up what a lot of vets see in practice. Cows that had transition health events—retained fetal membranes, metritis, mastitis, ketosis, left displaced abomasum—in the first 30 DIM had lower pregnancy per AI and more pregnancies lost between 32 and 60 days, across first‑, second‑, and older‑lactation cows, despite a very standardized repro program.

Transition Health StatusPregnancy/AI at 32dPregnancy Loss by 60dNet Impact
Healthy (no disease)42.3%8.2%Baseline
Metritis36.1%11.8%-6.2% P/AI, +3.6% loss
Retained placenta37.4%10.9%-4.9% P/AI, +2.7% loss
Ketosis (clinical)34.8%12.4%-7.5% P/AI, +4.2% loss
Displaced abomasum31.2%14.1%-11.1% P/AI, +5.9% loss
Mastitis (0-30 DIM)38.9%9.7%-3.4% P/AI, +1.5% loss

On top of that, work on postpartum inflammatory conditions has shown that cows dealing with disease during this period can develop smaller or less functional corpora lutea and produce less progesterone, which is not the kind of environment a young embryo wants to live in.

A large retrospective study in intensive Holstein herds in Spain estimated that about 12.2% of pregnancies were lost between 28 and 110 days of gestation. Put that next to the transition‑health and hormone data, and it’s not hard to see how a cow can be “pregnant at 32 days, open at 60,” without anything obvious happening in between.

So, between eggs that were built in a high‑NEFA, high‑BHBA environment and a uterus that may still be recovering from a transition “hangover,” biology keeps pointing back to what happens in those first 30 days fresh.

The Big Dollars: Metritis, SCK, and the Quiet Six‑Figure Drag

The biology matters, but at the end of the month, you’re still staring at a milk cheque, a vet bill, and a loan statement. So let’s put some realistic dollars to these transition issues.

Metritis: A US$511 Per‑Cow Problem

A 2021 paper in the Journal of Dairy Science analyzed 11,733 cows in 16 herds across four U.S. regions and estimated the full economic cost of metritis. Using farm records and simulation, the authors found:

  • Mean cost per case: US$511
  • Median: US$398
  • Simulated mean: US$513, with 95% of scenarios between roughly US$240 and US$884

Those dollars include lost 305‑day milk, lower gross margin per cow, extra reproductive costs, and higher replacement costs because affected cows left the herd sooner. Hoard’s Dairyman, using herd‑level modeling on a large U.S. dairy, landed on metritis costs in the mid‑US$300 range for that specific scenario, which falls within the general range and shows how market conditions and farm structure can tweak the final number.

Now take a 500‑cow herd with a 20% metritis rate among fresh cows—a number that wouldn’t shock many vets in freestall herds. That’s roughly 100 cases of metritis per year. At US$511 per case, you’re into about US$51,000 in metritis‑related costs per year. That’s not just one bad month; that’s a steady leak.

Those costs don’t just sit in the “vet” column, either. A sizable chunk of that US$511 is hidden in longer days open, more services per pregnancy, lower milk, and cows that drift out of the herd earlier than they should.

Subclinical Ketosis: Common, Quiet, Costly

Subclinical ketosis doesn’t show up like a twisted stomach or a downer cow, but it quietly hits a lot more animals.

In McArt’s four‑herd study, 43.2% of cows hit SCK—BHBA ≥1.2 mmol/L—at least once between 3 and 16 DIM. In the 10‑country data set, the median herd‑level SCK prevalence was 21.8% between 2 and 15 DIM at the same cut point, with a broad range across herds. Cows with high BHBA were more likely to develop displaced abomasum, clinical ketosis, and metritis, and were more likely to leave the herd earlier.

The Subclinical Ketosis Reality: Between 1 in 5 and nearly half of fresh cows run dangerously high ketones. Cornell’s four-herd study found 43.2% SCK prevalence, while even the 10-country median (21.8%) sits well above the 15% risk threshold where reproductive and health problems accelerate

Economic analyses that bundle milk loss, disease risk, extra days open, and culling generally land in the low‑to‑mid hundreds of dollars per SCK case. The exact number depends on milk prices, feed costs, and replacement values, but it’s not pocket change.

So if around 40% of a 500‑cow herd—about 200 cows—experience SCK in early lactation, even a conservative estimate of US$200 per case means you’re looking at about US$40,000 per year in lost opportunity tied to SCK alone. When you stack that next to the metritis math, it’s easy to see how transition disease can quietly push the total into serious money for a 500‑cow operation.

The Hidden $90,000 Drain: How Transition Disease Costs Stack Up in a 500-Cow Herd. Metritis and subclinical ketosis together strip over $91,000 annually from a typical herd—with most costs hidden in lost milk, reproduction failures, and early culls rather than visible vet bills 

In Canadian quota systems, there’s another angle. Canadian Dairy Commission figures show that average butterfat tests on Canadian farms have been creeping up—around 4.3% in 2024—helping reduce structural surplus and improve returns per litre. When fresh cows crash, both milk yield and butterfat performance in early lactation tend to suffer. That means quota isn’t being used as efficiently, and you may be under‑delivering butterfat against the quota you paid a lot of money for. Dairy Global has reported that producers in Eastern Canada continue to battle for relatively small amounts of new quota at high butterfat prices per kilogram, reinforcing how valuable every kilogram of component really is. A fresh cow crash is a component crash—and in a quota system, components are your currency.

So these early diseases aren’t just a health story; they’re a transition‑to‑cheque story.

What Farmers Are Finding: NEFA, BHBA, and That Post‑Calving Crash

So how do you tell whether NEB and transition problems are really a big driver on your farm, beyond the feeling that you’re treating too many fresh cows?

Cornell work has given us some very practical markers. In a series of projects summarized by Tom Overton, PhD (Cornell University), and detailed in work by Ospina and colleagues, three key thresholds emerged when predicting disease and performance:

  • Pre‑calving NEFA: When more than about 15% of close‑up cows tested ≥0.30 mEq/L NEFA in the week before calving, the herd saw a higher risk of displaced abomasum, retained placenta, metritis, and poorer reproduction after calving.
  • Post‑calving NEFA: When more than about 15% of fresh cows had NEFA ≥0.60–0.70 mEq/L in the first two weeks after calving, early‑lactation disease risks and performance losses increased.
  • Post‑calving BHBA: When more than about 15% of cows had BHBA ≥10–12 mg/dL (≈1.0–1.2 mmol/L) in the first couple of weeks, the herd had more DAs, clinical disease, and lower 305‑day mature‑equivalent milk.

Overton and others have translated this into a simple herd‑level rule of thumb: if more than 15% of sampled cows are over those NEFA or BHBA thresholds, there’s likely “room for improvement” in transition energy balance and management.

So, a practical way to use NEFA/BHBA looks like this:

  • A few times a year, pull blood on 12–15 close‑up cows and 12–15 fresh cows with your vet.
  • See what percentage of each group is over those 0.30 / 0.60–0.70 NEFA levels and ~1.0–1.2 mmol/L BHBA equivalents.
  • If that percentage is under about 15%, you’re probably in decent shape. If it’s above 15–20% consistently, it’s a strong signal your transition program is leaving money and pregnancies on the table.

You don’t have to turn your herd into a research trial. A small, well‑chosen sample, taken a few times a year, gives you a pretty honest “weather report” on how tough that transition window really is for your cows.

What Farmers Are Doing: Three Management Levers That Actually Move the Needle

So, where are the herds that are doing well on this 90‑day connection, actually putting their time and money? Across extension meetings, Dairyland Initiative resources, and producer discussions, three levers keep coming up.

1. Protecting Space and Comfort in Transition Pens

Looking at this trend across herds, the first word that comes up is space. The University of Wisconsin’s Dairyland Initiative has been very clear: overstocking freestall pens increases competition at the bunk, reduces lying time, keeps cows on concrete longer, and leads to more lameness and lower milk yield. Those effects are especially problematic in close‑up and fresh pens.

Their recommendations—and those of other researchers—generally look like this:

  • Aim for about 80–85% stocking density in close‑up and fresh pens, not 100–120%.
  • Give at least 24–30 inches of bunk space per cow in these pens to reduce bunk competition.

Penn State Extension has also emphasized that overstocking at the bunk raises risk for SCK, displaced abomasum, and hypocalcemia because lower‑ranking cows end up eating less of the intended ration and at less‑ideal times.

In Wisconsin freestall herds, I’ve noticed that when producers finally protect those transition groups—sometimes at the cost of a tighter late‑lactation pen—fresh cow problems start to ease. Fewer DAs, fewer metritis cases, fewer slow‑starting cows. In Western dry lot systems in California or Idaho, the details change—shade, mud, and feedlane design matter more than stalls—but the principle is the same: if transition cows can’t eat and rest without fighting for it, you’ll pay for it in the breeding pen.

2. Keeping Body Condition in the Sweet Spot

Body condition management isn’t new, but the research has sharpened the targets.

The high fertility cycle paper and postpartum BCS studies suggest that Holsteins do best for health and fertility when they calve around 3.0–3.25 on a 5‑point scale. Cows calving at 3.5 or higher have a higher risk of metabolic problems—SCK, DA, metritis—and more reproductive trouble. On top of that, cows that lose more than about 0.5 BCS points between calving and first breeding tend to have poorer reproductive performance than cows that hold condition or lose only a little.

So a realistic set of targets looks something like:

  • Calve the bulk of the herd at 3.0–3.25 BCS.
  • Keep BCS loss from calving to first breeding to 0.5 points or less whenever possible.

In a lot of Midwest freestall herds, the big improvements came not from exotic feed additives but from tightening late‑lactation diets, grouping over‑conditioned cows more thoughtfully, and making sure transition rations support steady intakes before and after calving.

In Canadian quota herds, it has a direct butterfat angle as well. When fresh cows calve too heavy and crash in condition, you often see depressed butterfat performance right when you’re trying to maximize component yield against quota, this is critical to improving farm margins in a supply‑managed environment.

3. Making Sure the Ration on Paper Matches the Ration at the Bunk

The third lever is deceptively simple: cows don’t eat the ration in the nutritionist’s software, they eat what’s in front of them.

Penn State and other extension teams keep coming back to a few basics that are easy to slip on when days get long:

  • Feed at consistent times so cows know when to expect feed.
  • Push up often enough that there’s always feed in reach, especially for timid cows.
  • Watch refusals and particle size so you catch sorting before it becomes a habit.

Overstocking the feed bunk makes all three much harder, and that’s a big reason why crowded transition pens and higher SCK/DA/metritis risk so often travel together.

In the herds that really excel at fresh cow management, someone clearly “owns the bunk.” That person is watching how the ration looks in the wagon, how it looks in front of the cows, how cows are eating it, and how much is left—and they’re talking regularly with the feeder and nutritionist about what they see.

What I’ve noticed is that when this bunk piece is tight, you feel it everywhere: smoother fresh cow management, more consistent butterfat performance, fewer surprise DAs, and fewer cows that arrive at first service already behind.

Simple Data Tools That Make the 90‑Day Connection Visible

You don’t need a new monitoring system or a consultant parked at your farm to start connecting transition and reproduction. Three data points most herds already have—or can get easily—can take you a long way: early fat‑to‑protein ratio, peak milk patterns, and early cull rates.

Fat‑to‑Protein Ratio: A Metabolic Weather Report

A 2021 paper revisiting the link between fat‑to‑protein ratio (F:P) and energy balance found that early‑lactation F:P ratios of 1.5 or higher tended to reflect deeper negative energy balance—more body weight loss, higher NEFA, and more metabolic strain. That’s consistent with what a lot of nutritionists already treat as a warning sign.

So, practically:

  • If only a small slice of early‑lactation cows have an F:P ≥1.5 on the first test after calving, you’re likely okay.
  • If 20% or more of those cows have F:P ≥1.5 on that first test, it’s a good reason to dig into energy balance and SCK risk.

It won’t diagnose the problem for you, but it tells you there’s likely a problem to solve.

Peak Milk Curves: How Fast and How High

In well‑managed Holstein herds on TMR, mature cows often peak around 60–75 DIM, depending on genetics and ration strategy. When transition disease is common, those peaks tend to be lower and show up later in lactation.

Several studies and field analyses have shown that cows with clean transitions tend to have faster‑rising, higher peaks, while cows that battled SCK, metritis, or DA have flatter, delayed peaks and lower overall production. If your software will let you, plotting separate curves for “healthy through 30 DIM” cows and “at least one transition disease” cows can be an eye‑opening exercise in a herd meeting. In many herds, seeing those two curves side‑by‑side does more to justify investing in transition than any lecture.

Early‑Lactation Culls: When Do Cows Leave?

Most herds track the total cull rate. Fewer herds break out 0–60 DIM removals in a way that gets discussed regularly.

Disease‑costing and herd analyses repeatedly show that early culls are among the most expensive, because you’ve carried that cow through a previous lactation and the dry period and then gotten very little milk out of the current one. Herds with strong transition programs often keep early removals in the low single digits as a percentage of calvings, while herds where transition disease is a bigger issue can see early culls drift into double‑digit percentages.

Once you start tagging early culls with clear reasons and comparing them against fresh cow records and BHBA/NEFA test results, a pattern usually emerges: many of those cows never really recovered from the transition period. It’s a tough conversation, but it’s one of the most useful ones you can have.

What Farmers Are Doing: A BHBA Routine That Fits Real Herds

Subclinical ketosis is one of those areas where a simple routine can give you a lot of control without turning your farm into a research station.

Building on McArt’s SCK work and field protocols shared by practitioners like Jerry Gaska, DVM (Wisconsin), the routine many herds are adopting looks like this:

  • Pick one or two mornings each week.
  • On those days, test a group of cows between 3 and 9 DIM using a validated handheld BHBA meter.
  • Use 1.2 mmol/L as the cutoff for subclinical ketosis—the same line used in Cornell’s epidemiology work and in many extension programs.

Gaska described a Wisconsin farm where they treat their BHBA results like a herd‑level dashboard:

  • If ≤15% of tested cows are at or above 1.2 mmol/L, they just keep monitoring.
  • If 15–40% are positive, they test all cows 3–9 DIM and treat the positives.
  • If ≥40% are positive, they treat every fresh cow in that DIM range.
The Monday-Morning BHBA Dashboard: Turn your weekly testing into a transition health report card. When more than 15% of fresh cows test above 1.2 mmol/L BHBA, Cornell research shows you’ll see more disease, lower milk, and weaker reproduction 60 days later. This simple metric predicts your pregnancy rate before you ever pull the breeding gun

Their standard treatment is 300 cc of propylene glycol once daily for 5 days, which is consistent with recommendations from many vets and extension resources. The goal isn’t to drive SCK to zero—it’s to keep the percentage reasonable and to use that weekly number as an early warning system for when transition is slipping.

If you imagine a 500‑cow herd trimming SCK prevalence from 40% down toward 20% over a season or two, using this type of monitoring and better transition management, and you assume each SCK case costs in the low hundreds of dollars, the potential savings add up quickly. And what farmers are finding is that when that BHBA dashboard number improves, DA numbers, metritis cases, and repro results tend to look better a few months later.

What Farmers Are Finding: Letting Transition Health Steer Semen Use

Now let’s talk about where this transition health story meets some of the hottest decisions on many farms: how to use sexed dairy semen, conventional semen, and beef‑on‑dairy.

Beef‑on‑dairy has moved from “interesting idea” to everyday practice on a lot of operations. Industry reporting and national evaluation data show more herds using sexed dairy semen on a limited top tier and beef semen on lower‑priority cows to capture calf value. At the same time, reproduction leaders like Paul Fricke, PhD (University of Wisconsin–Madison), have been talking about a “reproduction revolution” centered on precision timed‑AI, early pregnancy diagnosis, and targeted use of sexed and beef semen.

What’s encouraging is that more producers are folding transition health into that conversation, not just parity and genetic index.

A Simple Health‑Based Semen Strategy You Can Actually Use

Here’s one way to structure it that fits real herds:

1. Clean Transition Cows

These cows:

  • Had no recorded transition disease in the first 30 DIM (no milk fever, metritis, DA, clinical ketosis, retained fetal membranes).
  • Stayed below 1.2 mmol/L BHBA on any early‑lactation testing, if you test.
  • Lost 0.5 BCS points or less from calving to first breeding.
  • Showed a first‑test F:P ratio comfortably under 1.5.

They’re prime candidates for high‑index sexed dairy semen, especially if their genetic merit fits your replacement goals. That’s where you want to invest in future daughters.

2. Minor Transition Bumps

These cows might have:

  • A single BHBA reading just over 1.2 mmol/L that responded to propylene glycol.
  • A mild metritis case that resolved quickly.
  • Slightly more BCS loss than ideal, but nothing dramatic.

They’re often solid cows, just not quite in the “best bets” class. Many herds here lean toward conventional dairy semen, reserving sexed semen for cows that are both genetically strong and biologically set up for success.

3. Major Transition Events

These cows tend to be the ones that:

  • Had metritis and a DA or stacked multiple transition diseases.
  • Showed consistently high BHBA readings or obvious SCK that lingered.
  • Dropped more than a full BCS point between calving and breeding.

A growing number of herds put these cows in the beef‑on‑dairy or “do not breed” category, depending on age, production, and pregnancy status. In Western dry lot systems where beef‑cross calves often have a ready market and good value, managers talk about this as a way to turn a cow with higher reproductive risk into a short‑term calf revenue opportunity instead of betting your future replacements on her.

In Canadian quota herds, where quota additions can be limited and expensive, many producers are using a similar idea: they focus sexed dairy semen on cows that are most likely to be long‑term, high‑component producers under their system, and use beef on cows where the odds of a trouble‑free, high‑butterfat lifetime are lower.

The big shift is that the first 30 days in milk are now part of the semen decision, not just age, production, or genomic index. That’s a very “2020s” way of thinking about reproduction that lines up biology, genetics, and cash flow.

Transition Health TierHealth Markers (0-30 DIM)Semen StrategyWhy This WorksExpected Outcome
Tier 1: Clean Transition– No disease events
– BHBA <1.2 mmol/L
– BCS loss ≤0.5 points
– F:P <1.5
High-index sexed dairy semenHealthy metabolism during follicle development; strong oocyte quality; optimal uterine environmentHigh P/AI (40%+); low preg loss; valuable replacement heifers
Tier 2: Minor Bumps– Single mild SCK event (responded to treatment)
– Mild metritis (quick resolution)
– BCS loss 0.5-0.75 points
Conventional dairy semenModerate metabolic challenge; good recovery; acceptable but not optimal fertilityModerate P/AI (30-38%); acceptable preg loss; solid replacements
Tier 3: Major Events– Metritis + DA
– Multiple disease events
– Persistent high BHBA
– BCS loss >1.0 point
Beef-on-dairy or Do Not BreedSevere metabolic/uterine damage; compromised oocyte quality; high preg loss risk; poor lifetime potentialCapture calf value; avoid wasting high-value dairy genetics on low-fertility cow

Nuances That Matter: Heifers, Pregnancy Loss, and Seasonal Herds

There are a few wrinkles worth mentioning, because not every group of cows—or every system—behaves the same.

One nuance that came out of the Cornell NEFA/BHBA work, and was highlighted in Hoard’s Dairyman, is that heifers and older cows don’t always show the same performance patterns at similar NEFA and BHBA levels. In those data, heifers with higher postpartum NEFA (≥0.60 mEq/L) and BHBA (≥9 mg/dL) sometimes produced more milk than heifers with lower levels, while multiparous cows with NEFA ≥0.70 mEq/L and BHBA ≥10 mg/dL produced less and had more disease. That doesn’t mean high ketones are ever “good,” but it does suggest that if time and budget are tight, focusing your most intensive monitoring on older cows may give you more bang for your buck.

On pregnancy loss, the Spanish Holstein work put numbers around something many of us feel: about 12.2% of pregnancies were lost between 28 and 110 days of gestation in intensive systems. Articles in Hoard’s Dairyman and Dairy Global have described pregnancy loss as a major ongoing puzzle in modern dairies, with uterine health and metabolic stress as key suspects. That’s one more reminder that “pregnant at 32 days” isn’t mission accomplished if the transition period was rough.

Seasonal and block‑calving herds—whether in New Zealand, Ireland, or pasture‑based pockets of North America—live and die by this 90‑day connection even more. Research on grazing herds with different fertility breeding values has shown that cows with better transition metabolism and shorter postpartum anestrus intervals are far more likely to conceive in the first 3–6 weeks of mating, which pushes up six‑week in‑calf rates and tightens the calving spread. When transition management has holes, those herds feel it almost immediately in more late‑calvers and a stretched season. When they improve energy balance, BCS management, and fresh cow monitoring, many see their fertility and calving patterns tighten within a couple of seasons.

The biology doesn’t care if you’re on pasture or TMR, quota or open market—the transition pen is still writing a big chunk of the repro story.

Bringing It Home: Benchmarks and Monday‑Morning Moves

If you’re thinking, “This all makes sense, but where do we start without turning the place upside‑down?”, here are some concrete benchmarks and a realistic plan.

Benchmarks to Check Your Own Herd Against

From the work and examples we’ve talked about, here are some practical “sanity check” targets:

  • BHBA in early lactation:
    If more than 15–20% of sampled cows 3–16 DIM test at or above 1.2 mmol/L, your transition energy balance likely needs work.
  • NEFA pre‑ and postpartum:
    If more than about 15% of close‑up cows have NEFA ≥0.30 mEq/L, or more than 15% of early‑lactation cows have NEFA ≥0.60–0.70 mEq/L postpartum, you’re in a higher‑risk zone for disease and weaker repro.
  • Body condition:
    Calving most Holsteins with BCS 3.0–3.25 and keeping BCS loss from calving to first breeding at ≤0.5 pointssupports better health and fertility.
  • Fat‑to‑protein ratio:
    If roughly 20% or more of early‑lactation cows have an F:P ≥1.5 on their first test after calving, it’s a good sign you should dig into energy balance and SCK.
  • 0–60 DIM culls:
    If early‑lactation culls are creeping into double‑digit percentages of calvings, transition disease is almost certainly playing a major role.

You don’t have to fix every metric at once. The power is in watching them over time and seeing whether changes in your transition program move those numbers in the right direction.

MetricTarget (Green Zone)Acceptable (Yellow Zone)Fix This Now (Red Zone)
BHBA Prevalence (3-16 DIM, ≥1.2 mmol/L)<15% of tested cows15-20% of tested cows>20% of tested cows
Postpartum NEFA (0-14 DIM, ≥0.60 mEq/L)<15% of tested cows15-20% of tested cows>20% of tested cows
Calving BCS & LossCalve at 3.0-3.25; lose ≤0.5 points to 1st breedingCalve at 3.25-3.5; lose 0.5-0.75 pointsCalve at >3.5 or lose >0.75 points
Fat-to-Protein Ratio (1st test postpartum)<20% of cows with F:P ≥1.520-30% of cows with F:P ≥1.5>30% of cows with F:P ≥1.5
Transition Pen Stocking(close-up & fresh)75-85% stocking; 24-30″ bunk/cow85-95% stocking; 22-24″ bunk/cow>95% stocking or <22″ bunk/cow
Early Culls (0-60 DIM)<5% of calvings5-8% of calvings>8% of calvings

A Realistic Plan for the Next Six Months

If you want to put this 90‑day lens to work without overwhelming the team, a simple roadmap could look like this:

  1. Start a BHBA Snapshot.
    Once or twice a week, test a small group of cows 3–9 DIM (maybe 6–8 cows in a 100‑cow herd, 10–15 in a 500‑cow herd) using a handheld meter. Track the percentage at or above 1.2 mmol/L, treat positives with a propylene glycol protocol that your vet is comfortable with, and write that weekly percentage where everyone can see it.
  2. Walk Your Transition Pens with a Tape Measure.
    Count stalls, count cows, and measure bunk space in your close‑up and fresh pens. If you’re regularly at or above 100% stocking or bunk space is under 24 inches per cow, sit down with your nutritionist and vet to talk through options for regrouping, overflow pens, or small facility tweaks that protect those high‑risk groups.
  3. Bring Transition Health Into the Semen Discussion.
    At your next breeding strategy meeting, take along a simple list of fresh cow diseases and BHBA results by cow, plus BCS scores on cows coming up for first service. Sort cows into “clean,” “minor bump,” and “rough transition,” and make deliberate decisions about where sexed dairy semen, conventional semen, and beef‑on‑dairy semen really belong.

The Bottom Line

If there’s one big idea to tuck in your pocket, it’s this: your pregnancy rate isn’t just a breeding‑pen number. It’s a delayed grade on your fresh cow management. The more we treat those first 30 days in milk as the front end of our repro program, not a separate chapter, the more room we give ourselves to improve both the biology and the bottom line.

What’s encouraging is that you don’t need a brand‑new barn or a shiny gadget to get started. Same cows, same buildings, same people—just looked at through a 90‑day lens that connects what happens in the transition pen to what shows up at preg check and, ultimately, on your milk statement. 

Key Takeaways:

  • Pregnancy rate is really a 90‑day transition report card. Cows with metritis, SCK, or DA in the first 30 DIM have lower pregnancy per AI and more pregnancy loss—even on excellent timed‑AI programs. ​
  • The math adds up fast. Metritis costs about US$511/case; SCK hits 20–40% of fresh cows. Together, they can quietly drain around US$90,000 a year from a 500‑cow herd. ​
  • Simple flags make it visible. BHBA ≥1.2 mmol/L in >15–20% of fresh cows, F:P ≥1.5 in >20% on first test, or 0–60 DIM culls in double digits all signal transition trouble. ​
  • Three levers matter most. Protect stocking (80–85%) and bunk space (24–30″) in transition pens; calve cows at BCS 3.0–3.25 and limit loss to ≤0.5 points; make sure the ration at the bunk matches the ration on paper. ​
  • Use transition health to guide semen decisions. Clean‑transition cows are prime for sexed dairy semen; cows with rough transitions often belong in the beef‑on‑dairy column.

Complete references and supporting documentation are available upon request by contacting the editorial team at editor@thebullvine.com.

Learn More

The Sunday Read Dairy Professionals Don’t Skip.

Every week, thousands of producers, breeders, and industry insiders open Bullvine Weekly for genetics insights, market shifts, and profit strategies they won’t find anywhere else. One email. Five minutes. Smarter decisions all week.

NewsSubscribe
First
Last
Consent

Keep Your Mind Open But Not Your Cows

For generations dairy cattle breeders have had reasons to explain why their cows did not quickly conceive or why the show cows needed to stay open and then calve at a particular time of the year in order to look their best for the show season. Well those are not reasons. They are excuses. We buy equipment, use drug therapy, manage groups, ask the vets to perform miracles and yes even lose sleep in attempts to raise our herd’s conception and pregnancy rates and lower our day’s open and extra days in the dry pen. But then we tell ourselves and fellow breeders that at only 5% heritability there is nothing we can do about genetically improving fertility in our dairy cattle.

If it was anything else, like a broken tractor, we’d go about getting it repaired even though it was a costly undertaking. Enhancing the genetics of dairy cattle fertility however falls into that ineffective area where –  we keep doing things the same old way but expect different results. The truth is we must do things differently. Until we revamp the genetics of the dairy cows, we can not expect to reduce the costs and lost revenue associated with infertility.

What Oman Has Shown Us

Mention the name Oman to a Holstein breeder and you can expect a reaction.  He is categorized as either the best sire to come along in years or he has ruined the breed.  This icon does not inspire fence sitters. On the like side both Don Bennick (Read More – North Florida Holsteins: Aggressive, Progressive and Profitable!) and Chris Buchner (who I recently visited with at Elmwold Farms) extol Oman’s virtues. Don’s favourite cow is an Oman daughter.  Chris put it this way – “We just loved our Omans. Sure they would not win a show but the Omans did it for us as we are in the business of efficient profitable production measured by maximizing fat and protein in the tank per cow per day of course at reasonable input costs’.  This raises the question “Does function follow form or does form follow function?”.  For Don and Chris, it is form that follows function

Oman did many things right when it comes to fertility. Calves are born easily, able to be productive cows before two years of age, able to breed back quickly while yielding a high volume of solids and able to do it year after year. And they do it in any environment. Oman showed us that calving ease, reproduction and longevity can all fit into a package and that cows do not have to be tall, dairy, flat boned or angular. In fact what Oman did was to show that there are genetic differences between sires when it comes to female fertility and it stimulated breeders to measure all traits independently instead of trying to define the model perfect cow.  One size does not fit all.

Female Fertility

Both phenotypic and genetic trends for female fertility have spiralled downwards as production increased in the past forty years. We put our focus on milk production and picture perfect conformation, using what is often called a combined production and type index. But the amount and quality of data captured and stored relating to female reproduction has been sadly lacking. For the milking herd that situation has been reversed in the past half decade due in part to the great expansion in herd management software programs with the data uploaded to central data bases where genetic analysis and evaluations are performed. But the same can not be said for heifer information.  Any data that does exist for heifers remains on farm so, except in education or research herds, we can not correlate, on a population basis, the heifer stage of development with lifetime performance.

Where once we relied on what we called “cow sense” we now have genetic evaluations, for cows and bulls, for the following traits that correlate well with female fertility:

Calving Ease
For years breeders felt that calves had to be large at birth to develop into large framed cows. Today commercially oriented breeders want live calves that are born unassisted and cows, especially first calvers, that deliver a live calf without assistance. Two genetic indexes are published – one for the birth of the calf (Calving Ease / Calving Ability) and one for the mother’s ability to deliver ( Maternal Calving Ease / Daughter Calving Ability). Sires rated above 7 in the USA or below approximately 97 in Canada for either calving ease index should be avoided unless breeders are prepared to attend and assist the birth. The cost of a difficult calving is significant when you consider the risk of death of calf and mother, vet and drug costs, an anestrous period, a longer time in the dry pen and less yield for both the lactation and lifetime.

Pregnancy Rate – No pregnancy, no calf, no lactation!
That says it all. Getting a pregnancy when a cow is lactating at a high level is no mean feat but is the reality of dairy cattle farming. Sires that rate below +1.0 for Daughter Pregnancy Rate (USA) and 105 for Daughter Fertility (Canada) will not improve the genetic merit of a herd for pregnancy rate.  Correlated positively with sire ratings for Daughter Fertility in Canada is Body Condition Score (BCS). Correlated negatively is Dairy Form (USA) and Angularity (Canada). Bulls that have a rating above 105 for BCS have daughters that get pregnant whereas bulls above average for Dairy Form and Angularity are more difficult to get in calf. Using all these indexes assists breeders to get the overall picture so wise decisions can be made when selecting sires to use.

Length of Life
Some breeders prefer to select only for Productive Life (USA) or Herd Life (Canada) instead of selecting for the fertility traits. Additional factors beyond fertility go into calculating the length of herd life including SCS and udder depth. Therefore selecting for longevity may not get the boost in female fertility a breeder may be looking for. Again, as with the other indexes sires will need to have high ratings for Productive Life (over +3) and Herd Life (over 105) to positively impact the genetic merit of a herd.

Genomic evaluations
have been a major step forward in ranking bulls for female fertility traits.  Accuracies of genomic indexes are more than double what they were with Parent Averages alone. The general recommendations on using genomic sires applies when addressing daughter fertility – use many sires not just one or two.

So what is improved female fertility worth?

A definitive answer may not be available, but considering that for the average cow it starts when she is bred as a heifer and finishes when she has completed about three lactations. This, on average, covers about 54 months, and the total can mount up to a considerable amount from loss of revenue and added expense. If improving the genetics for female fertility in a herd could give you an added profit in a cow’s lifetime equivalent to the value of milk for half a lactation would it be worth putting more selection pressure of female fertility? I think it would.

Male Fertility

A.I organizations go to considerable effort to package the semen from each sire so the optimum conception rates can be achieved from that bull. High semen fertility is not a genetic measurement for male fertility but it has a very positive effect on herd profit. Dr Bob Welper of Alta Genetics estimates that in a 500 cow herd using somewhat below average bulls for Sire Conception Rate (SCR) compared to using bulls that are above average for SCR costs the breeder a minimum of $35,000 per year. Having six more pregnancies every twenty-one days, higher herd average production, less semen cost, less labor required and more calves in a year are where the added profits come from.

Perhaps a breeder’s semen tank should have a warning label that reads – “Warning- Semen put in this tank must be above average for conception rate and able to produce fertile female offspring”.

The Bullvine Bottom Line

Female fertility can no longer be ignored when selecting sires to use or cows that are to be the mothers of heifer calves. Many tools exist that assist with female reproduction on a farm however the use of genetically inferior animals for female fertility as the parents of the next generation is costing much more than we care to admit. In time there will no doubt be additional female genetic fertility index. The time to start using the current indexes is now. Big dividends await breeders who make the effort to use the current genetic tools for female fertility.

Get original “Bullvine” content sent straight to your email inbox for free.


[related-posts-thumbnails]

Send this to a friend