


Asked Arla and Müller how £300M in expansions aligns with 28p milk. No response. Their annual reports answered anyway: €401M profit, margins tripled.
EXECUTIVE SUMMARY: Lakeland’s November 2025 price of 28.8p per litre—the first below 30p in over a year—means the average farm loses 15p on every litre produced. Processor economics tell a different story: Arla netted €401 million profit, Müller tripled operating margins to £39.6 million, and the sector poured £300 million into new capacity. This pattern extends globally. US lenders expect only half of dairy borrowers to profit this year; Germany loses 6 farms a day; Darigold members describe $4/cwt deductions making cash flow “impossible.” Factor in 2-3p/L in looming environmental compliance costs, and margins compress further still. Farms positioned to navigate this share clearly have the following characteristics: debt below 50% of assets, production costs under 38p, and component or contract strategies that capture value beyond the base price. The global dairy industry is consolidating faster than at any point since 2015. What you decide in the next 90 days shapes whether your operation leads that consolidation or gets swept up in it.
The text came through just after 6 AM on a wet December morning in County Fermanagh. Lakeland Dairies had announced November’s price: 28.8 pence per litre. The Irish Farmers Journal confirmed it was the first time we’d seen prices dip below 30p since November 2023.
For the farmer who shared it with me—180 cows, third-generation operation, silage already put up for winter—the math took about thirty seconds. At 28.8p against his actual production cost of roughly 44p, he’s losing just over 15p on every litre his cows produce. That works out to around £2,500 a month in the red, assuming nothing else goes sideways between now and spring.
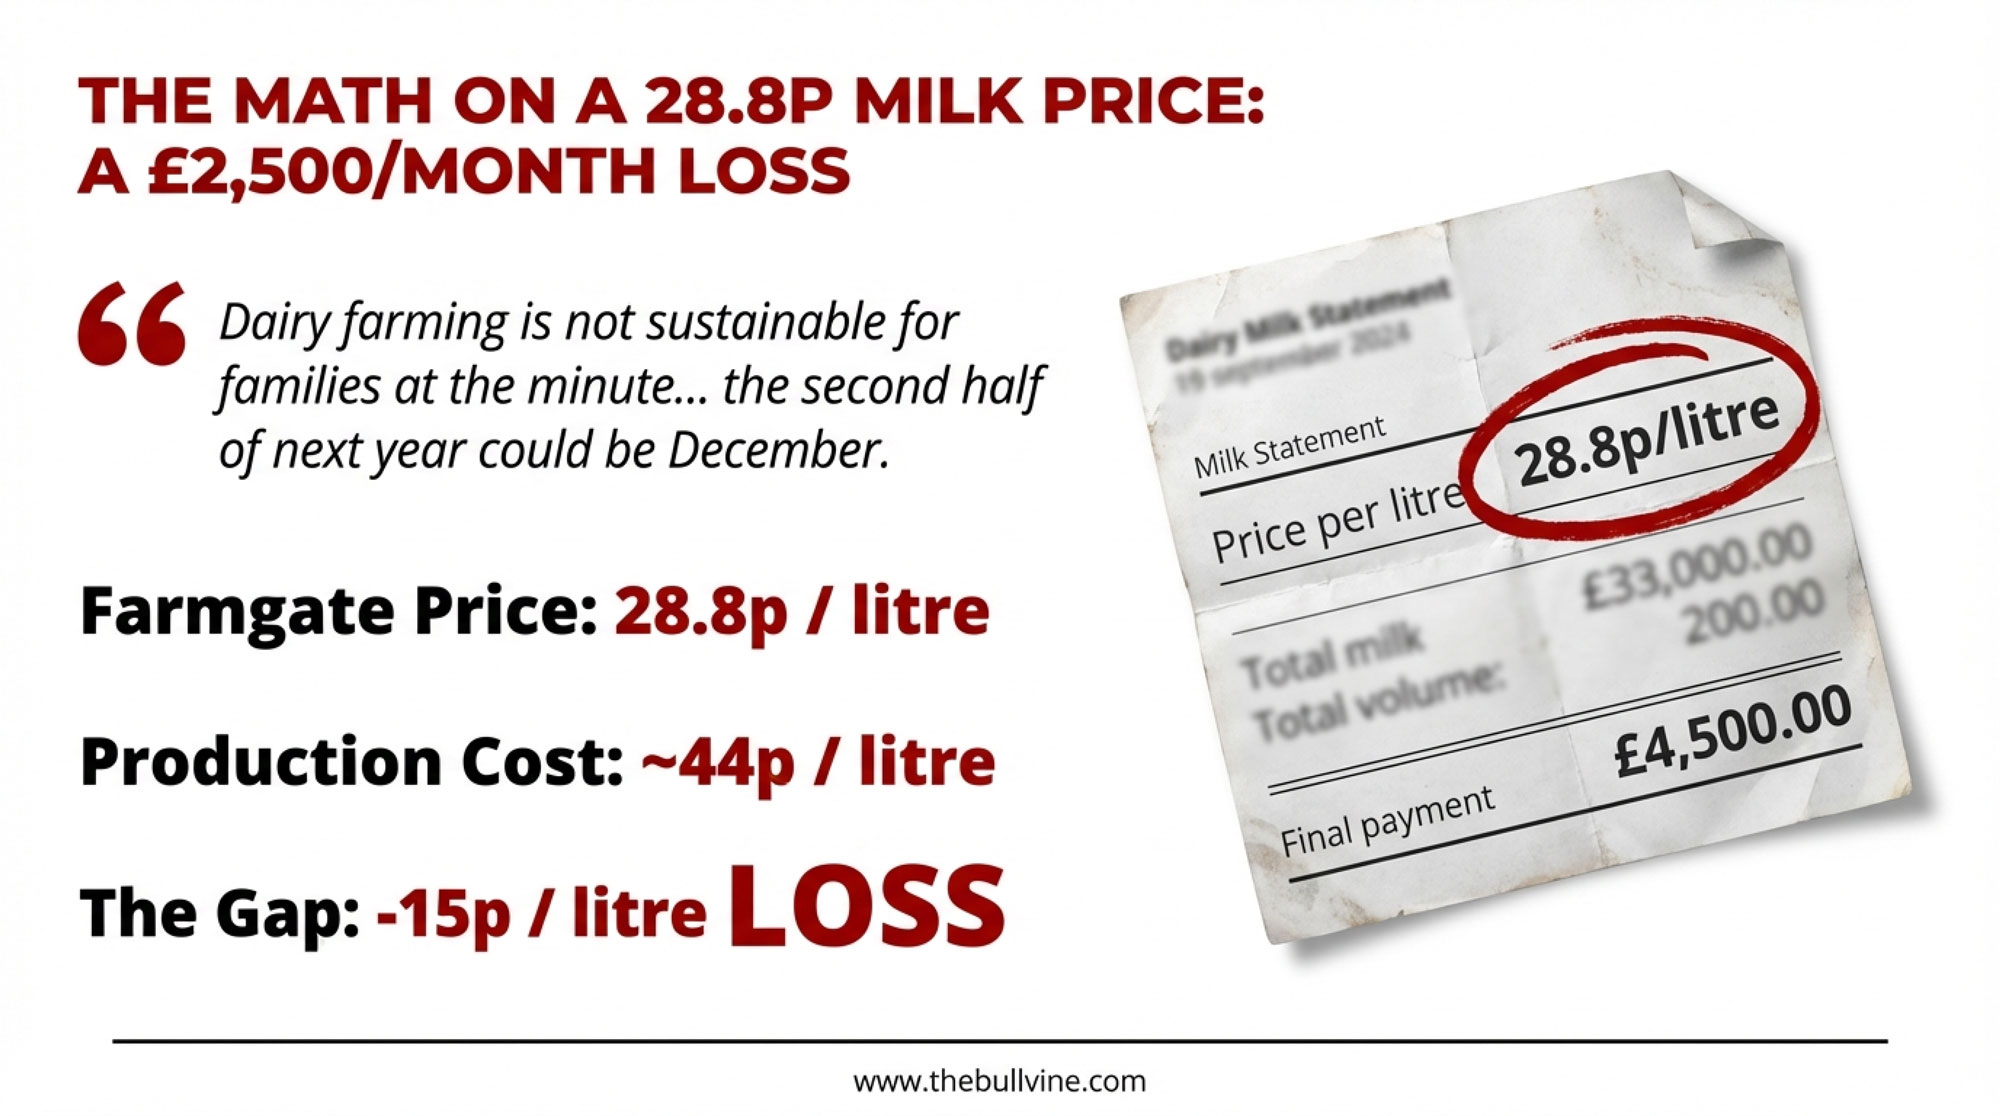
“Dairy farming is not sustainable for families at the minute,” is how he put it when we spoke later that week. “They talk about it coming back at the second half of next year—the second half of next year could be December.”
You know what struck me about that conversation? It wasn’t the frustration. Every dairy farmer I’ve talked to lately has plenty of that. It was the clarity. He’d already run his numbers. He knew exactly how many months of working capital he had left, what land he could move if it came to that, and at what price point he’d need to start having some hard conversations about the herd’s future.
That kind of clear-eyed planning is becoming more common across dairy operations worldwide right now. And given where things stand, that’s probably smart.
The 70p Gap: Where Your Milk Money Actually Goes
So let’s dig into what we actually know about where the money flows in late 2024.
The headline numbers tell a pretty stark story. Lakeland’s 28.8p base price for Northern Ireland suppliers is the first time we’ve breached that 30p floor in over a year. Meanwhile, you walk into any Tesco Express or Sainsbury’s Local, and you’re looking at somewhere between £1.00 and £1.50 for a litre of milk.
That’s a gap of 70p to 120p per litre between what we’re getting at the farm gate and what consumers pay at checkout.
Now here’s the thing—and you probably know this already—a good chunk of that gap is completely legitimate. Processing costs real money. So does transport, packaging, refrigeration, retail labour, and the considerable energy costs of keeping those dairy cases cold around the clock. A reasonable industry estimate for post-farm costs is 25-35p, depending on the product and supply chain.
But even accounting for all those real costs, there’s still a meaningful portion—perhaps 40p or more—being captured at various points along the supply chain between the bulk tank and the checkout. Understanding where that value ends up, and why, helps when you’re trying to make sense of your own situation.
| Segment | Typical revenue per litre (p/L) | Approximate cost per litre (p/L) | Approximate margin per litre (p/L) |
| Dairy farm | 28.8 | 44.0 | -15.2 |
| Processor | 45.0 | 35.0 | 10.0 |
| Retailer | 110.0 | 70.0 | 40.0 |
| Whole chain | 110.0 | 149.0* | – |
Here’s what gets interesting when you look at the regional breakdown. According to AHDB data from October 2025, the UK average farmgate price is 46.56p per litre, with Great Britain at 47.99p. Northern Ireland? Just 39.09p—and remember, that’s the average, which includes farms on better contracts. The 28.8p base price we’re talking about sits well below even that regional figure.
I was chatting with a Devon producer last month who put it pretty plainly:
“We’re getting 38p on a standard liquid contract, which isn’t great, but it’s survivable if you’re careful. When I hear what lads in Fermanagh are getting, I honestly wonder how they’re managing it.”
So why such a big difference across regions? Some structural factors help explain it.
The Export Trap: Why Northern Ireland is the Canary in the Coal Mine
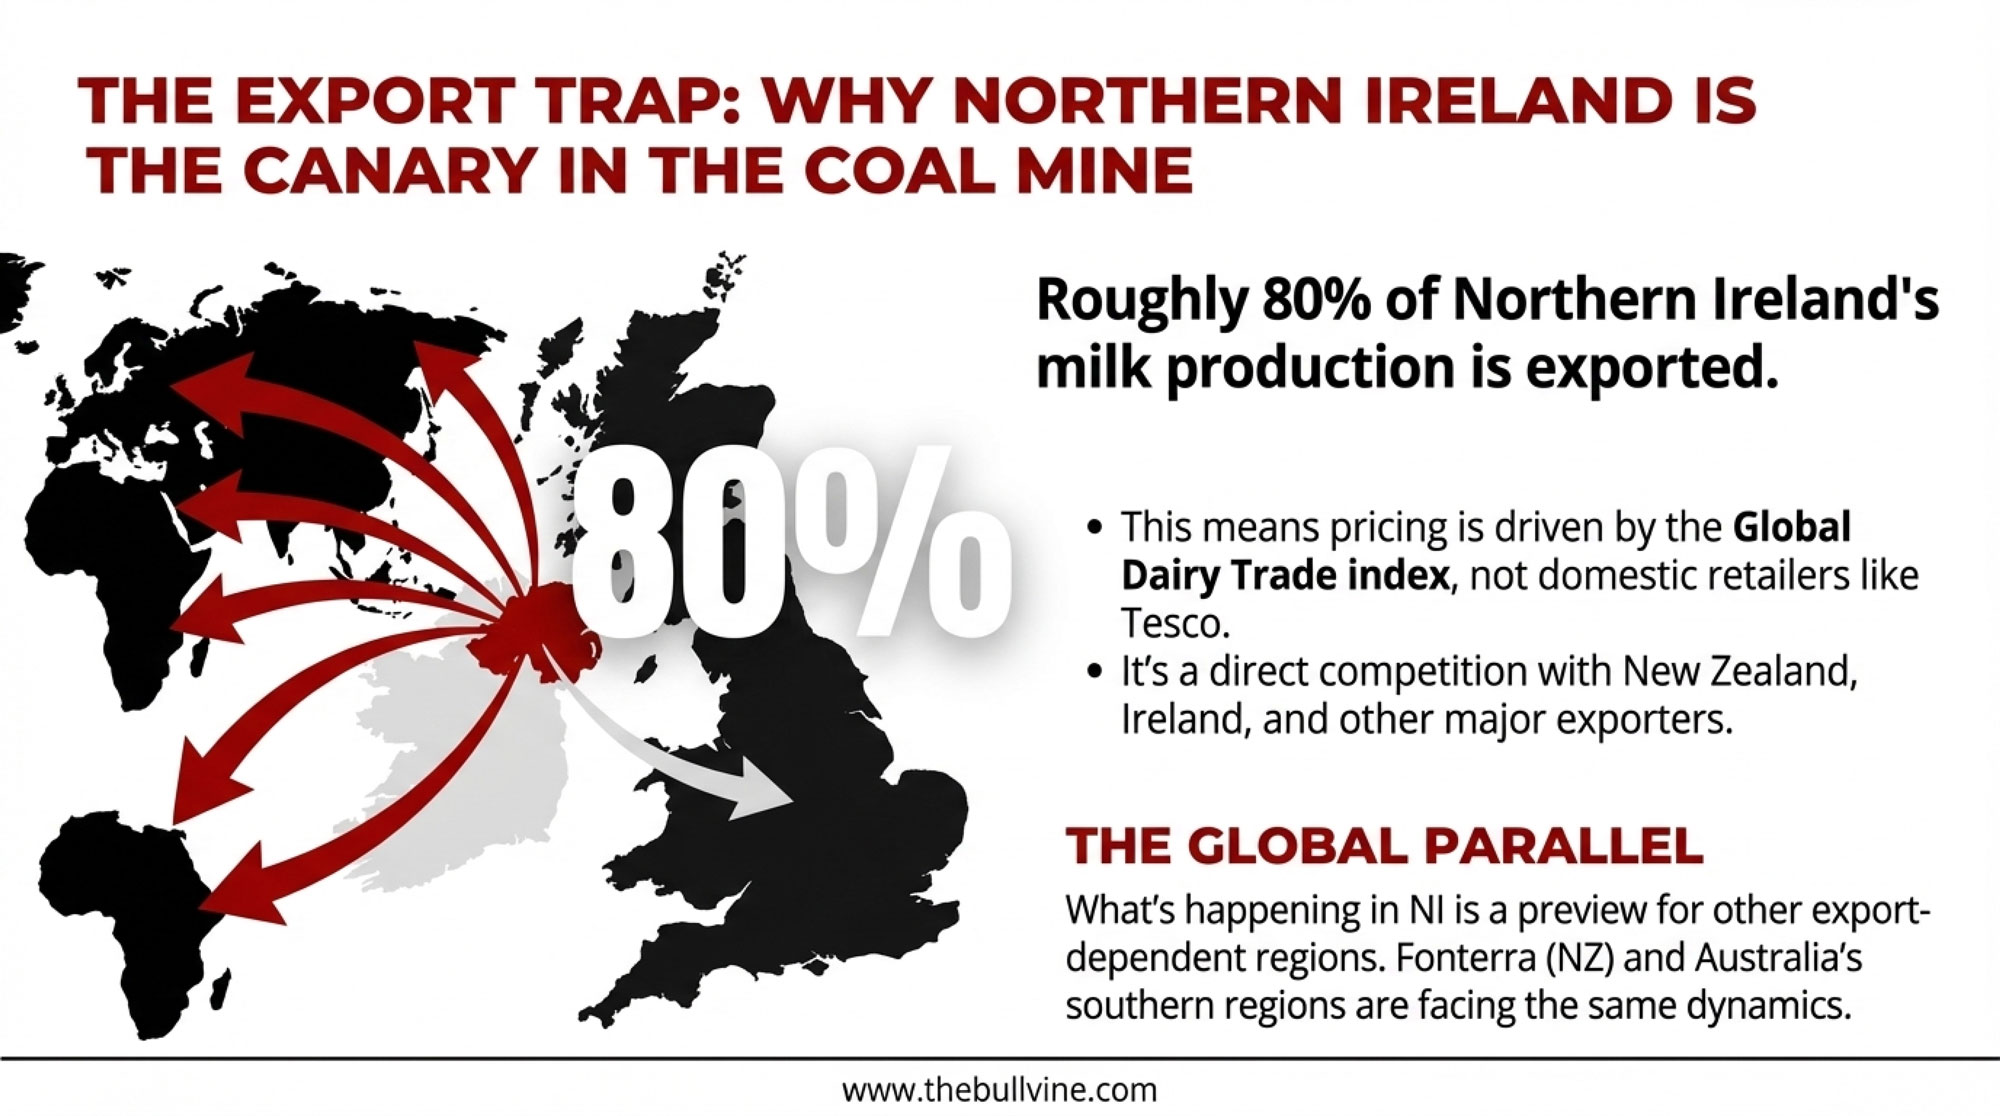
Here’s the key thing about Northern Ireland that shapes everything else: roughly 80% of NI milk production—that’s from AHDB’s latest figures—heads straight for export markets. Cheese, butter, powder destined for Europe, Africa, and beyond. That’s a fundamentally different setup from Great Britain, where more milk stays domestic and flows through liquid contracts with the major retailers.
What that export focus means—and this is really the central point—is that pricing works on completely different terms. When you’re selling mozzarella into European food service or milk powder into global commodity markets, you’re competing against New Zealand, Ireland, and every other major exporter out there. Your price gets driven by the Global Dairy Trade index, not by whether Tesco needs to keep shelves stocked.
And there’s a geographic reality that also constrains options. You can’t economically truck raw milk across the Irish Sea to chase a buyer in Liverpool. The collection infrastructure, the processing capacity, the contractual relationships—they’re all concentrated within Northern Ireland. That creates a different competitive environment than what a Cheshire farmer might have with potentially more buyers nearby.
Why does this matter for producers elsewhere? Because what’s happening in Northern Ireland is a preview of what export-dependent regions face globally when commodity markets soften. The same dynamics are playing out in New Zealand right now, where Fonterra is facing pressure on its farmgate milk price forecast amid supply outpacing global demand. Australia’s southern export regions have seen similar pressure on milk prices compared to last season, according to recent Rabobank analysis.
Cyril Orr, the Ulster Farmers’ Union Dairy Chairman, has been pushing hard on the transparency issue through all of this. “As dairy farmers, we are entering a challenging period marked by significant market uncertainty and pressure on farm gate prices,” he said in a December statement. “It is more vital than ever that farmers can place trust in their processors. We need to see greater openness, transparency, and genuine collaboration within milk pools.”
That call for transparency reflects something I’ve heard from producers across the UK, Ireland, and frankly, the US too: there’s a real desire for clearer information about how product values actually translate into what shows up on our milk checks.
The £300 Million Question: What Processor Investments Really Tell Us
Here’s where things get more nuanced—and it’s worth thinking through carefully.
If the dairy sector were struggling across the board, you’d typically expect processors to pull back on capital spending, maybe close some facilities, and issue profit warnings. That’s what we saw during the 2015-2016 downturn, as many of us remember.
But that’s not what’s happening now.
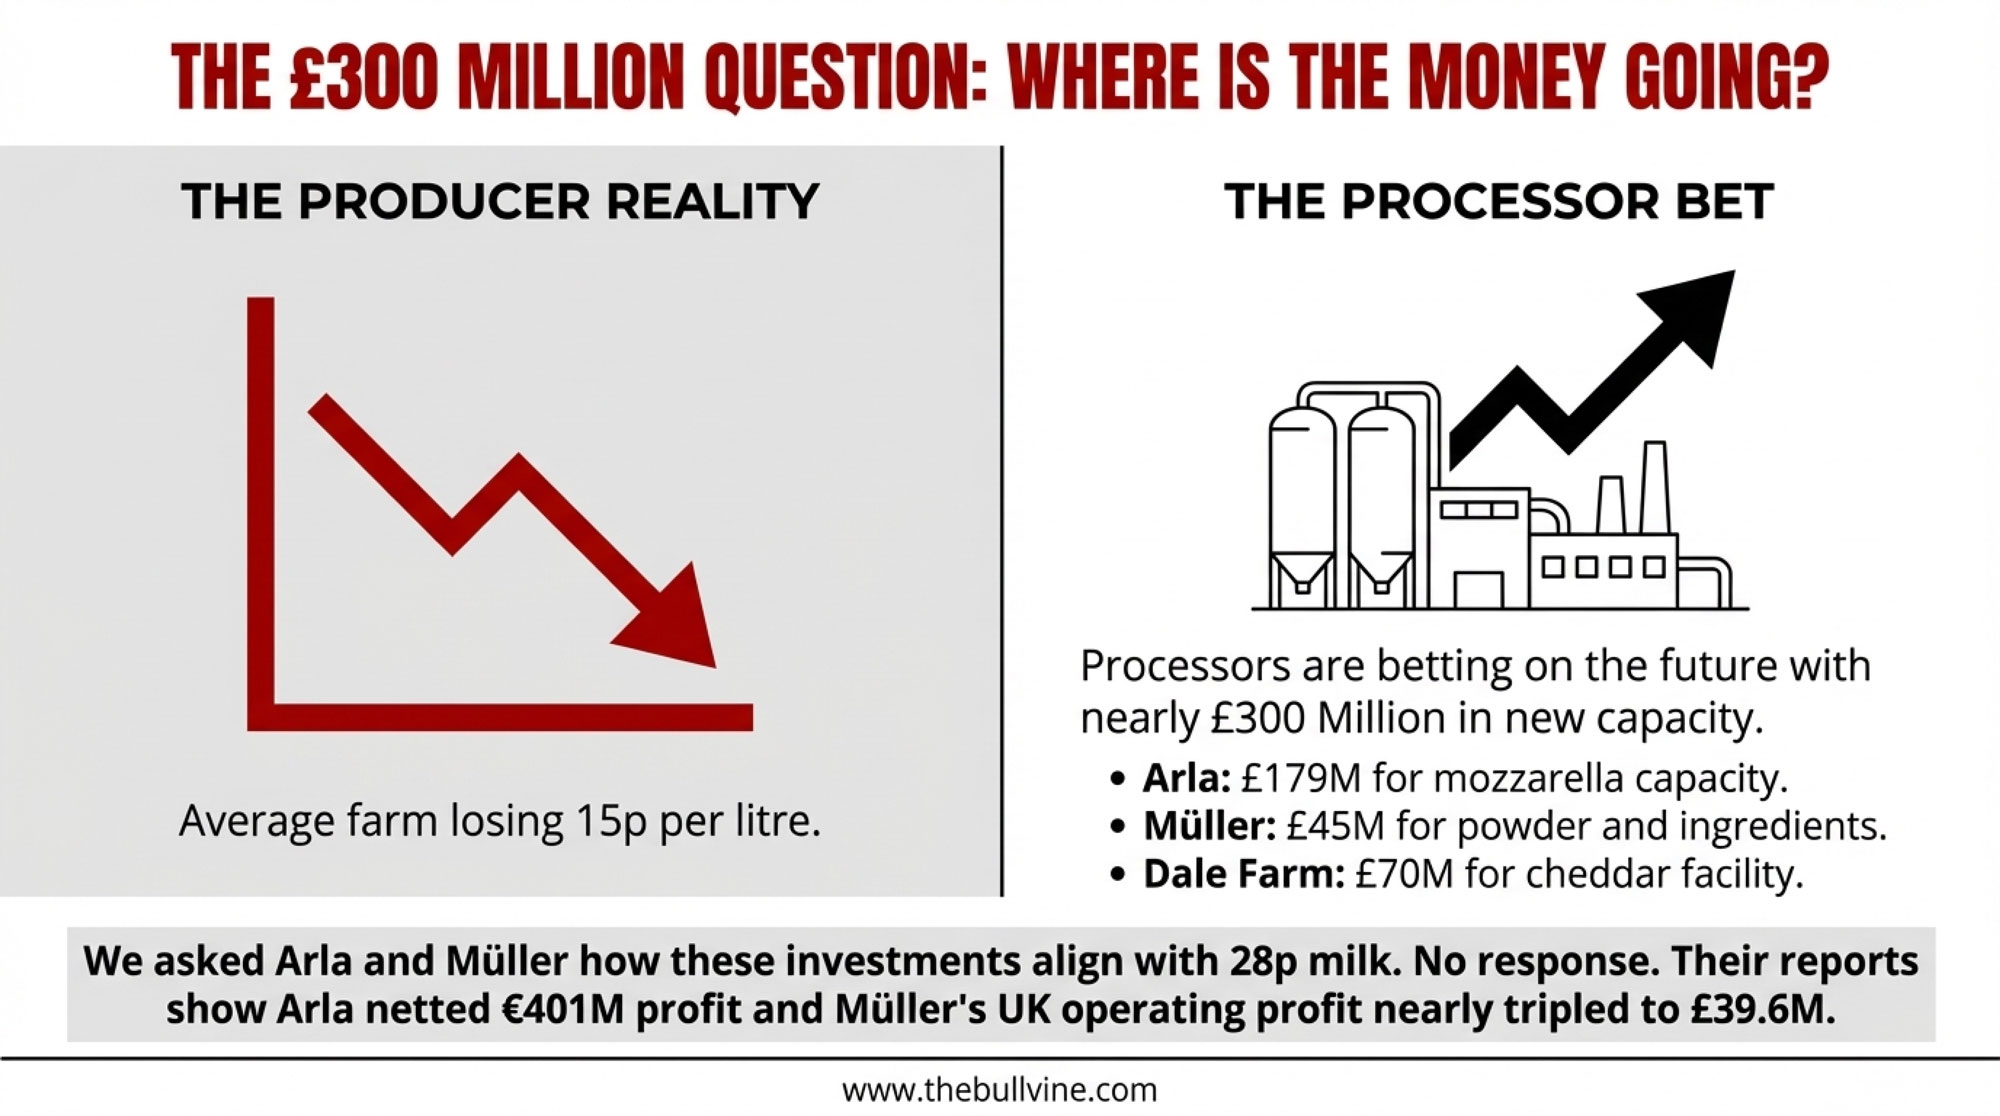
Over the past 18 months, UK and Ireland-based processors have committed nearly £300 million to capacity expansion:
- Arla Foods: £179 million for Taw Valley mozzarella capacity, announced July 2024
- Müller: £45 million at Skelmersdale for powder and ingredients
- Dale Farm: £70 million for the Dunmanbridge cheddar facility in Northern Ireland, plus a major long-term supply deal with Lidl covering 8,000 stores across 22 countries
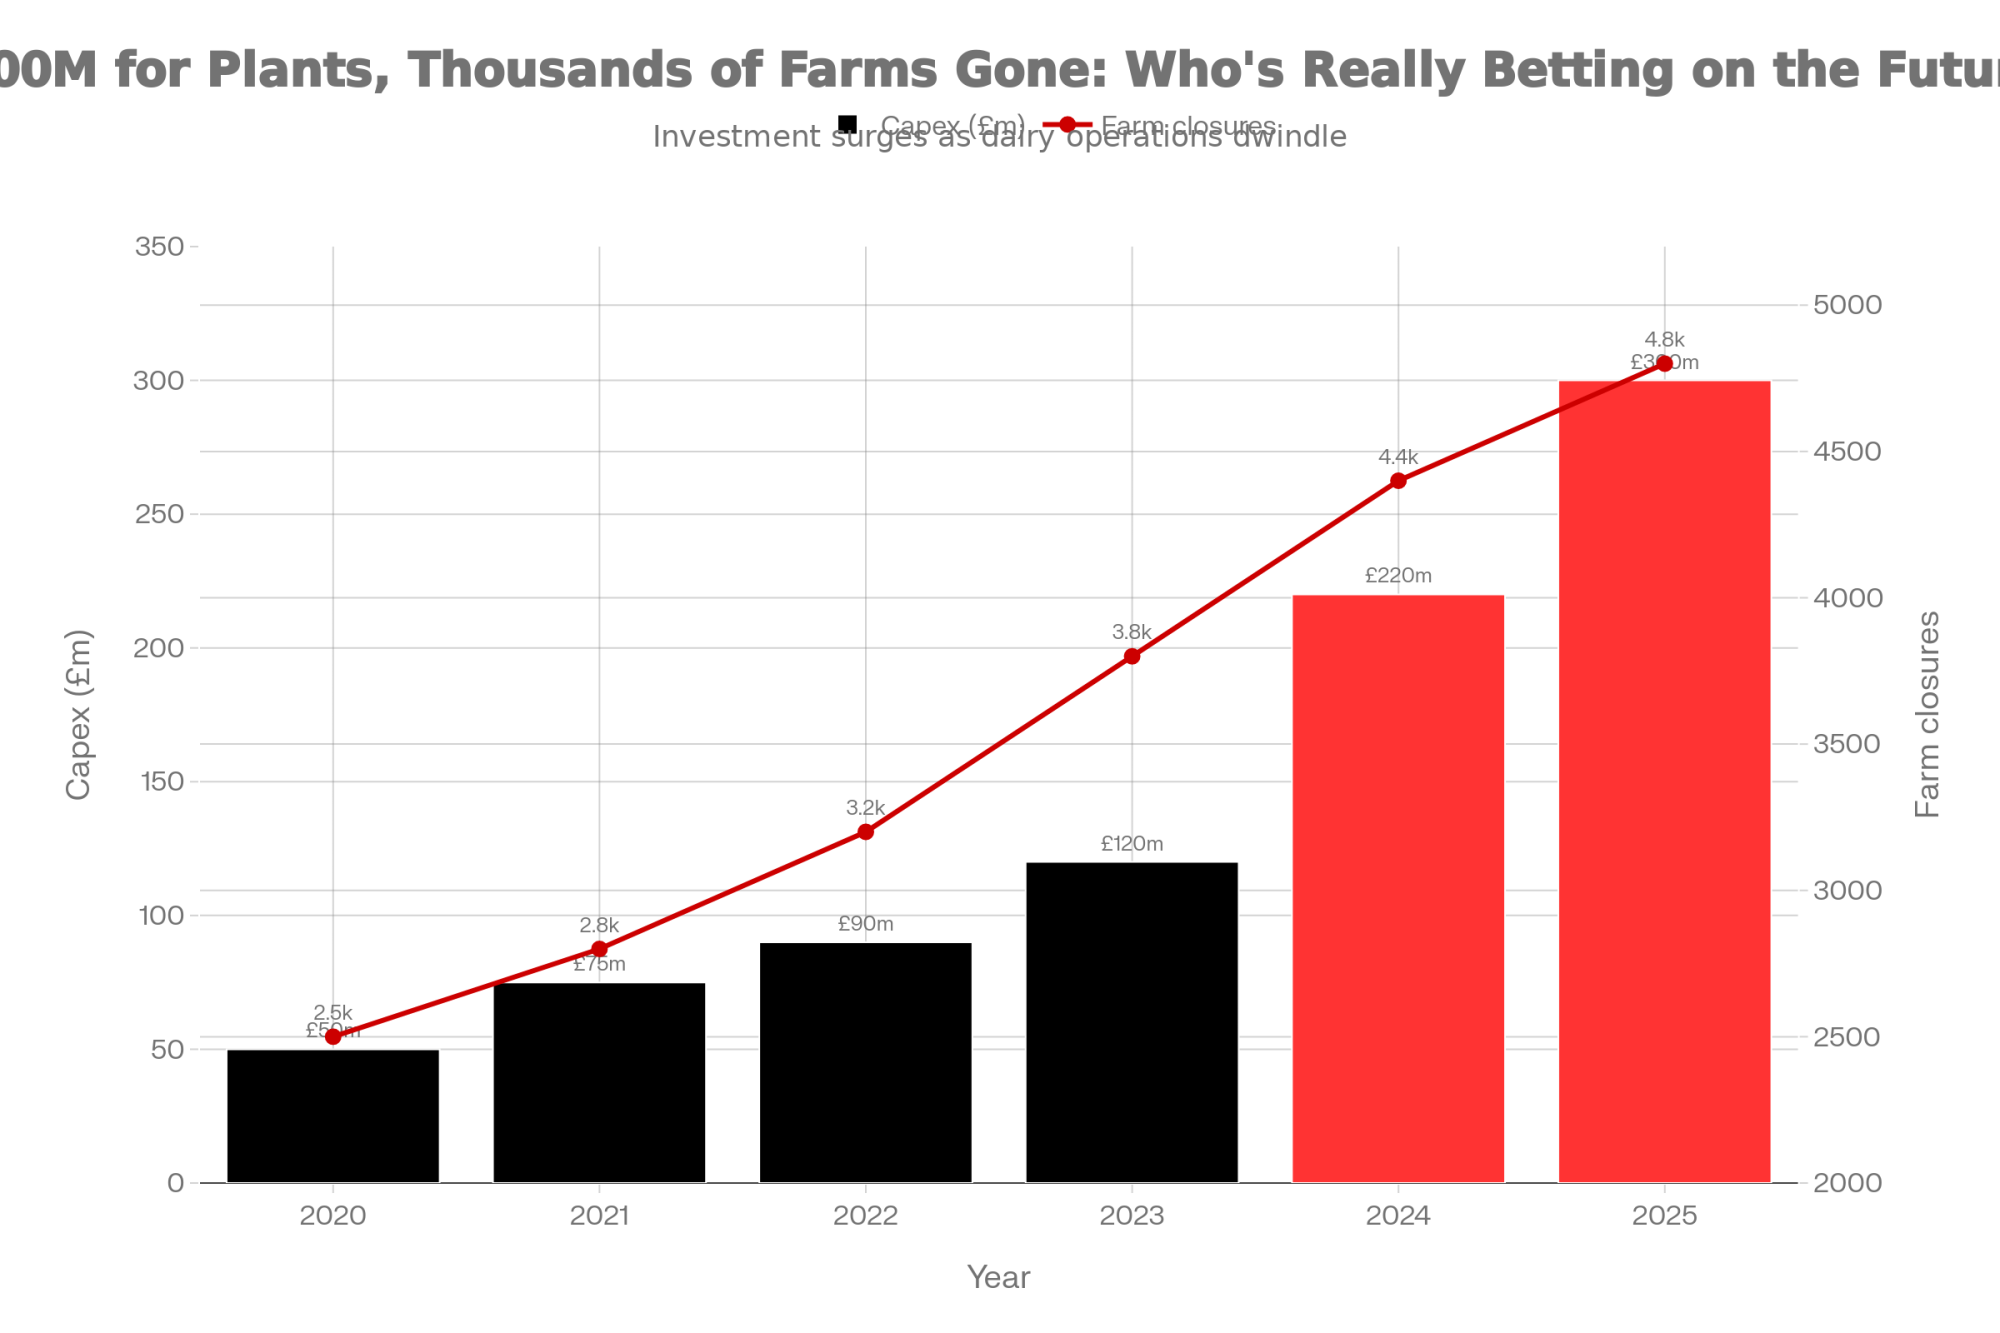
You don’t commit nearly £300 million to capacity expansion unless you’re confident about future milk availability and market demand. That’s just business sense.
It’s worth looking at the processor financials, too. Arla Foods group-wide posted €401 million in net profit for 2024—up from €380 million the year before—on revenues of €13.8 billion, according to their February annual report. Müller UK, according to The Grocer’s September coverage, nearly tripled its operating profit to £39.6 million after turning a profit again.
What does all this suggest? Well, one way to read it is that while farm-level economics are under real pressure, other parts of the supply chain have found ways to maintain or even improve their positions. Whether that’s a temporary rebalancing or something more structural… honestly, reasonable people can look at these numbers differently. The situation is complex.
I reached out to both Arla and Müller for comment on how their investment plans align with current farmgate pricing. Neither responded. And you know, that silence tells you something too.
A Global Squeeze: This Isn’t Just a UK Problem
Before we go further, it’s worth zooming out—because this margin pressure isn’t unique to the UK. Not by a long shot.
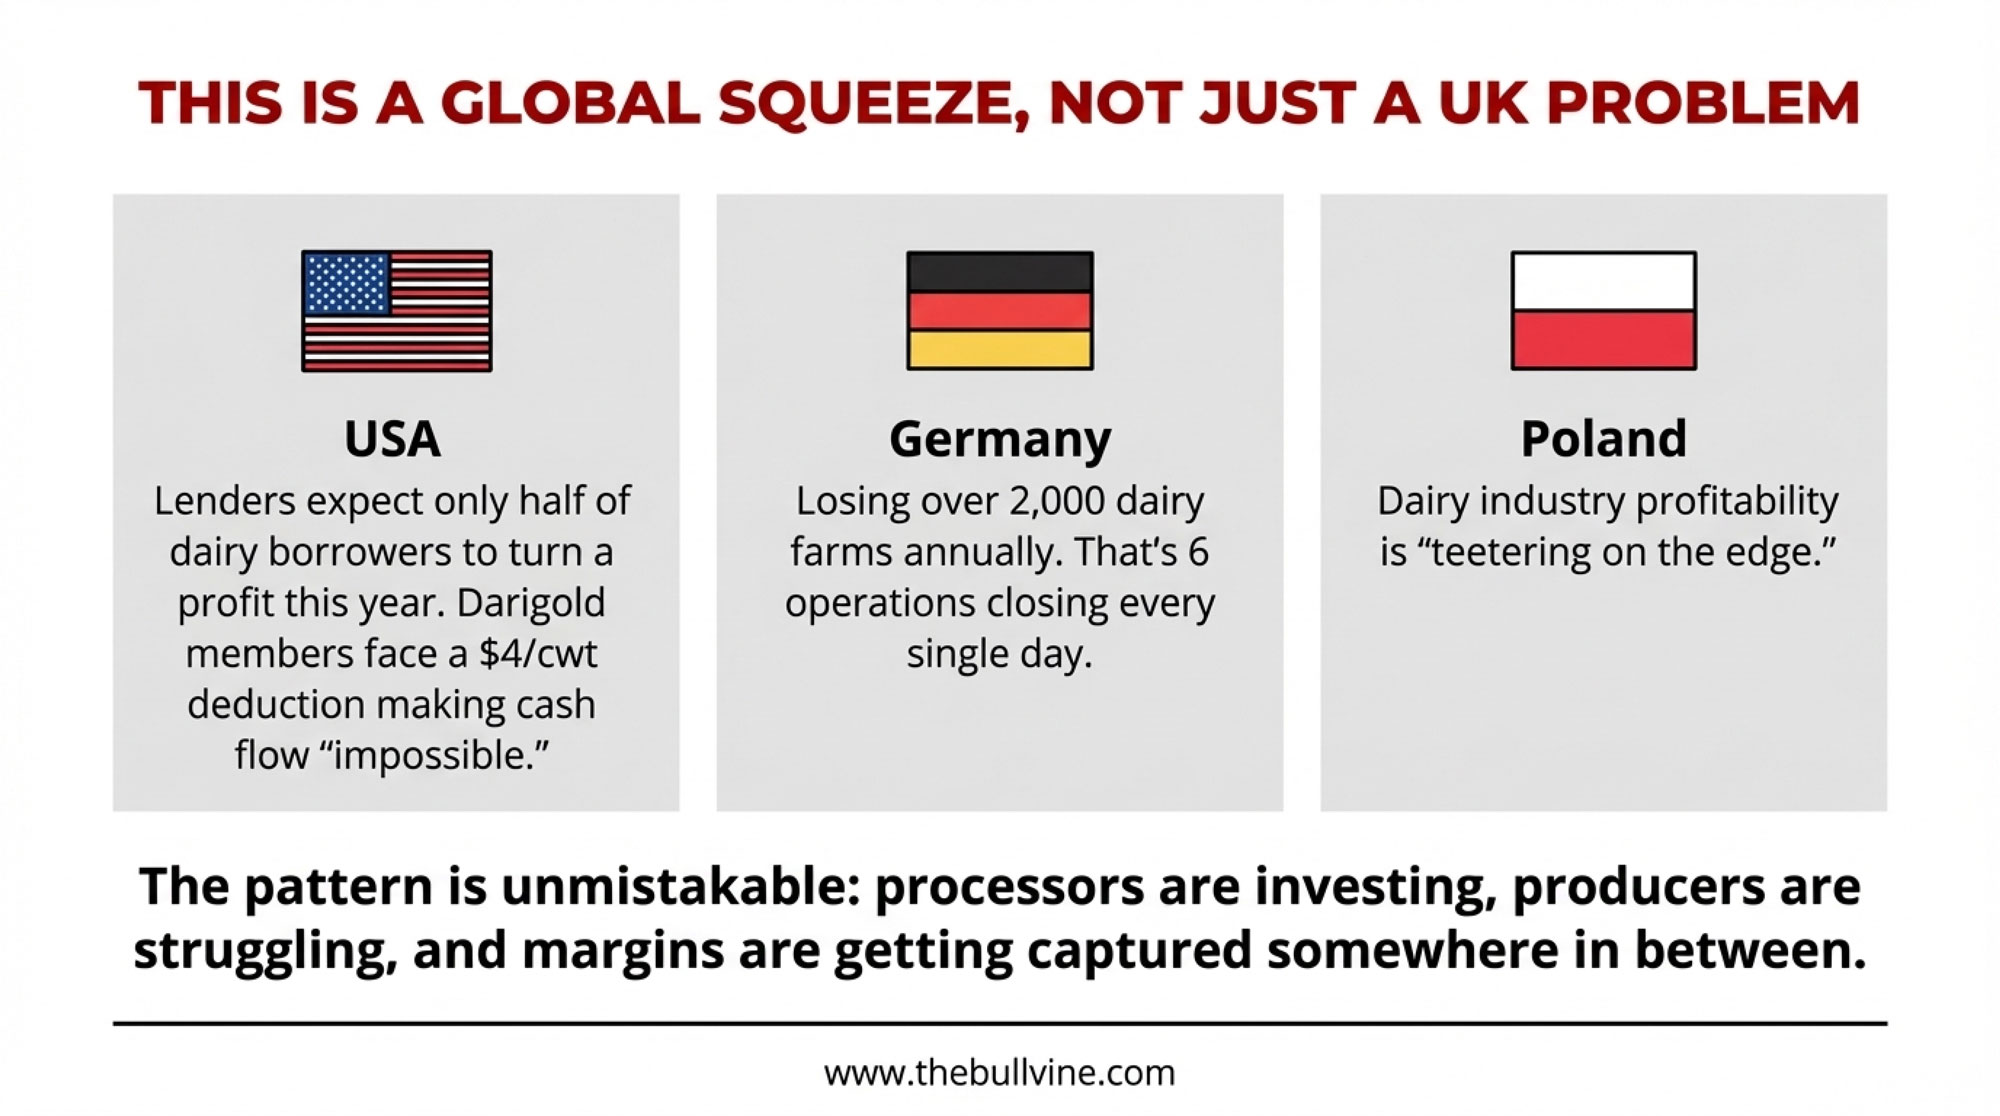
In the US, agricultural lenders now expect only about half of farm borrowers to turn a profit this year. That’s a marked decline from previous expectations. Out in the Pacific Northwest, Darigold—a cooperative serving around 250 member farms across Washington, Oregon, Idaho, and Montana—announced a $ 4-per-hundredweight deduction earlier this year to cover construction cost overruns at its new Pasco facility. As Capital Press reported in May, one farmer bluntly described the situation: “The $4.00 deduct, combined with all the other standard deductions, has made it impossible for us to cash flow.”
The EU picture isn’t any rosier. A December 2024 USDA GAIN report forecast that EU milk production would decline in 2025 due to declining cow numbers, tight dairy farmer margins, and environmental regulations. Germany has been losing over 2,000 dairy farms annually—that’s roughly six operations closing every single day, according to analysis of federal statistics. Poland’s dairy industry profitability is “teetering on the edge,” per a recent Wielkopolska Chamber of Agriculture report. And across Eastern Europe, thousands of farms have exited in recent years amid what industry leaders describe as significant crisis conditions.
The pattern is unmistakable: processors investing, producers struggling, margins getting captured somewhere in between.
What’s interesting is how different regions are responding. And one of the more instructive comparisons—with lessons worth considering—is how Irish farmers handled similar pressure.
When Farmers Fought Back: The Irish Playbook
When Irish processors announced cuts in late 2024, the response was notably coordinated. Over 200 farmers gathered outside Dairygold’s headquarters in Mitchelstown on September 19th—Agriland covered it extensively—and many of them brought printed copies of their milk statements. A broader group eventually mobilised roughly 600 suppliers to raise specific questions about pricing formulas and the calculation of value-added returns.
What made this different was the specificity of it. Rather than general complaints about “unfair prices,” farmers showed up with documented questions: How does the Ornua PPI relate to what’s actually showing up in our milk checks? How are value-added premiums being allocated? What are the real margins on different product categories?
Pat McCormack, the ICMSA President, was pretty direct in his assessment—he suggested processors were using milk prices to absorb volatility that might otherwise hit other parts of the chain. The IFA raised concerns about what continued cuts might mean for production levels.
Within a few weeks, several cooperatives did adjust their pricing. The movement wasn’t dramatic, but it showed that organised, data-driven engagement could influence outcomes.
Here in the UK, the farming unions—NFU, NFU Scotland, NFU Cymru, and UFU—took a different approach, issuing a joint letter calling for “responsible conduct” across the supply chain. Professional and measured.
I’m not saying one approach is inherently better than another—different markets and structures call for different strategies. But the contrast raises some interesting questions about which kinds of engagement actually move the needle. Something to think about.
The Environmental Wildcard: Already on Your Balance Sheet
Here’s a factor that’s reshaping farm economics right now—not someday, but today: environmental regulation. And honestly, it probably deserves more attention than most of us are giving it.
What happened in the Netherlands—where nitrogen limits led to mandatory herd reductions—shows how fast the regulatory picture can shift. Irish farmers have already felt it from nitrate derogation adjustments. Ireland’s water quality issues prompted the EU to reduce the limit to 220kg/ha in some areas starting January 2024, forcing affected farmers to cut stock or find more land.
For UK producers, several things are worth watching:
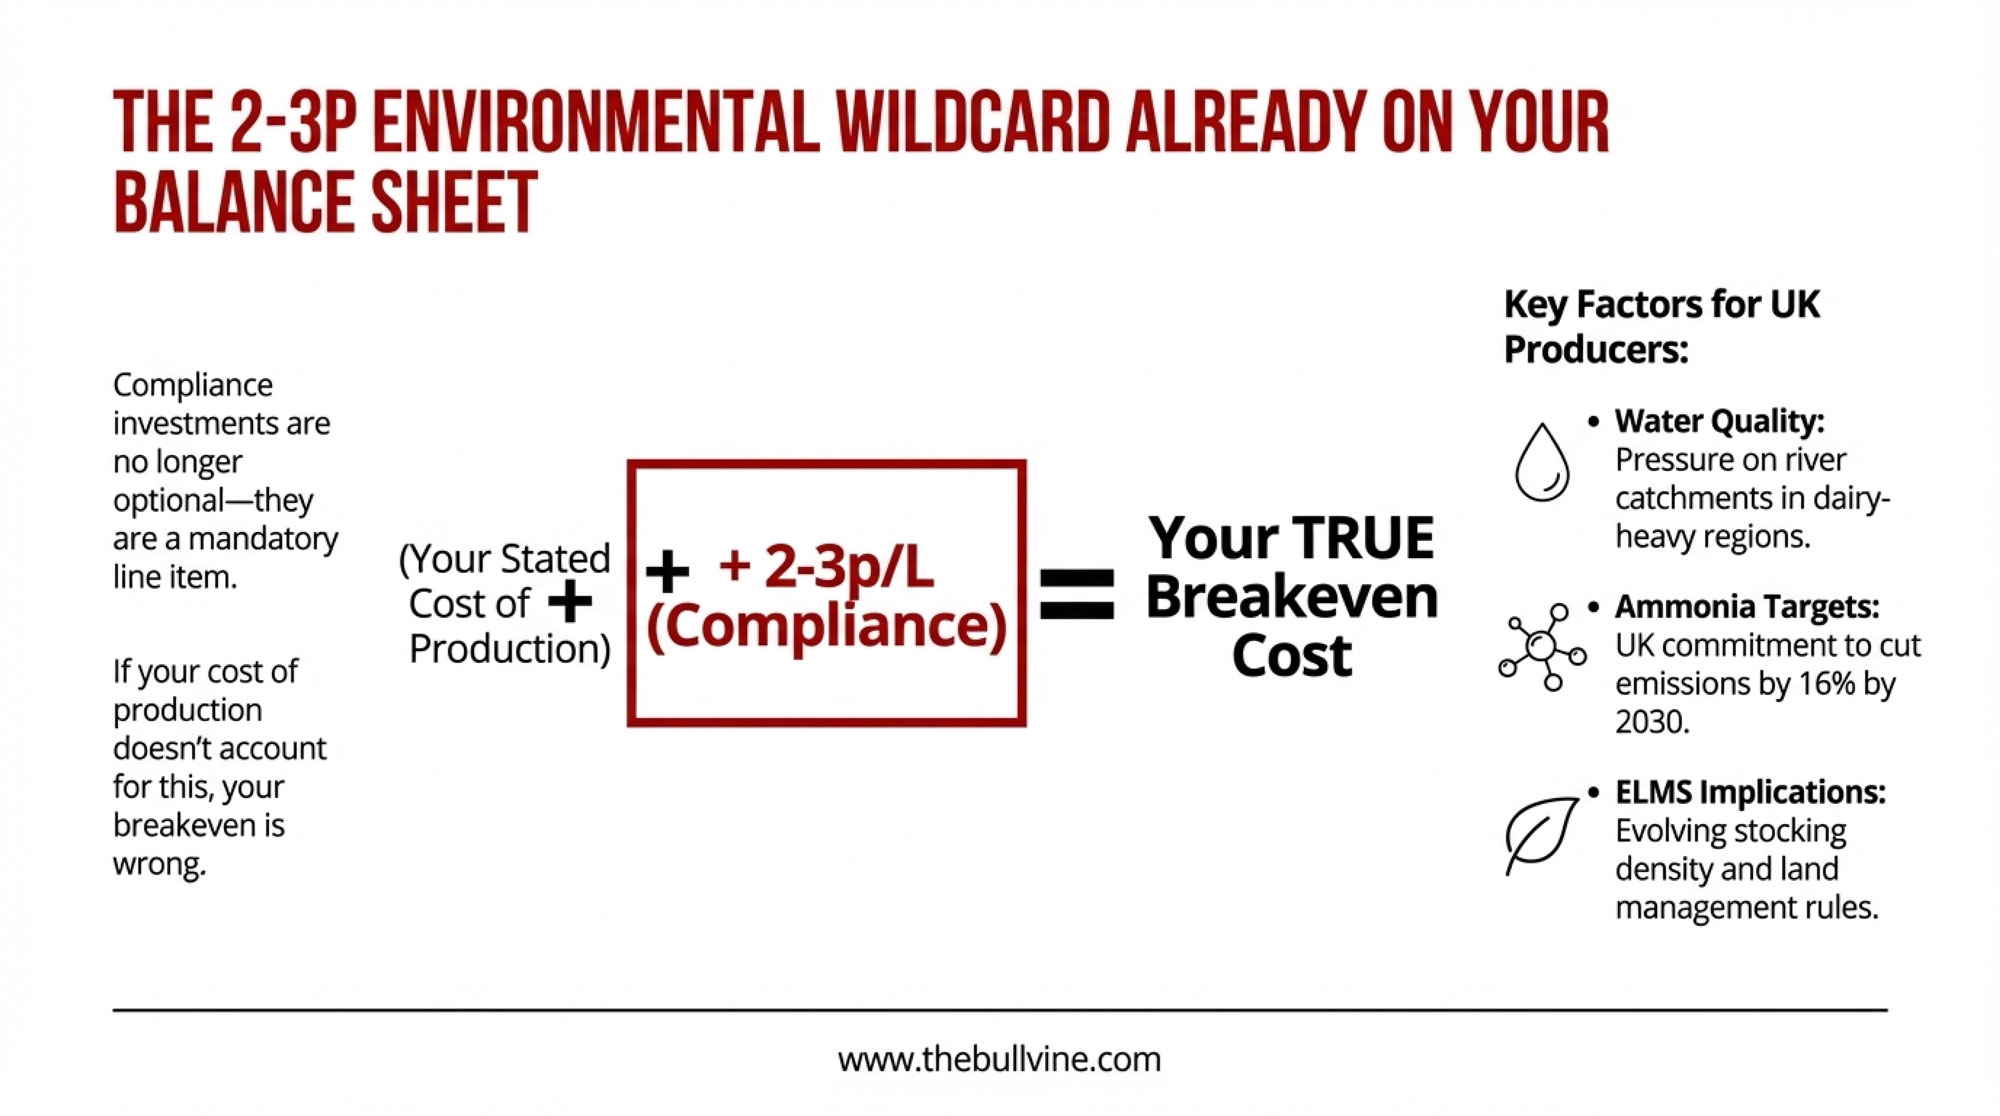
- Water quality pressure: Defra’s getting pushed to address agricultural contributions to river catchment issues. Dairy-heavy areas in the South West and North West could face new requirements as review cycles progress.
- Ammonia targets: The Clean Air Strategy includes a UK commitment to cut ammonia emissions by 16% by 2030 compared to 2005—that’s according to official government reporting. Housing and slurry management are big focus areas.
- ELMS implications: How dairy operations fit into the Environmental Land Management scheme’s eligibility—and whether future support involves stocking density requirements—are still evolving questions with real implications.
Why does this matter for your cost of production calculation? Because compliance investments aren’t optional anymore—they’re line items. If you’re running your numbers at 44p and not factoring in upcoming environmental requirements, you might be underestimating your true breakeven by 2-3p per litre. That’s the difference between surviving and not in a sub-30p market.
If UK policy moves toward firmer livestock limits, the ripple effects would run right through the supply chain. Processing infrastructure designed for current volumes faces different economics if milk availability shifts through regulation rather than markets.
The Numbers That Actually Matter for Your Operation
If you’re milking cows right now and trying to figure out where you stand, all this industry analysis provides useful context. But your specific numbers are what really matter. Here’s a framework several farm business consultants have been using—not hard rules, but useful reference points:
| What to Track | Generally Comfortable | Worth Watching | ⚠️ Needs Attention |
| Debt-to-Asset Ratio | Below 50% | 50-60% | Above 60% |
| Working Capital Runway | 12+ months | 6-12 months | Under 6 months |
| True Cost of Production | Under 38p/L | 38-42p/L | Above 42p/L |
| Annual Volume | 2M+ litres | 1.5-2M litres | Under 1.5M litres |
The debt-to-asset calculation you probably know—total liabilities divided by total asset value. What matters about that 60% threshold is that above it, your ability to absorb an extended low-price period gets pretty limited. You might find yourself servicing debt out of equity rather than cash flow, and any softening in land or livestock values creates additional pressure you don’t need.
Working capital runway—current assets minus current liabilities, divided by your monthly cash burn—tells you how long you can keep going if nothing changes. Dairy pricing cycles generally take 6-18 months to shift meaningfully, so shorter runways don’t leave much room to wait things out.
And the cost of production number? That’s where honest self-assessment really matters. Include everything: variable inputs, fixed overhead, family labour at what you’d actually have to pay someone else, full finance charges—and now, factor in those environmental compliance costs we just discussed. If that figure’s above 42p and there’s no clear path to getting it under 38p in the next 90 days… that’s a structural challenge that better markets alone probably won’t fix.
Three Questions Worth Asking Your Processor This Week
- What’s the current Ornua PPI or equivalent product return index, and how does my price track against it?
- What market factors might support a price adjustment in Q1 2025?
- Are there aligned contract opportunities available, and what would I need to qualify?
You might not get detailed answers. But asking demonstrates you’re engaged, and it creates a record of the conversation.
What’s Working for Producers Who’ve Been Here Before
In conversations with farmers who’ve navigated previous cycles, several themes consistently emerge. Here’s what seems to be helping.
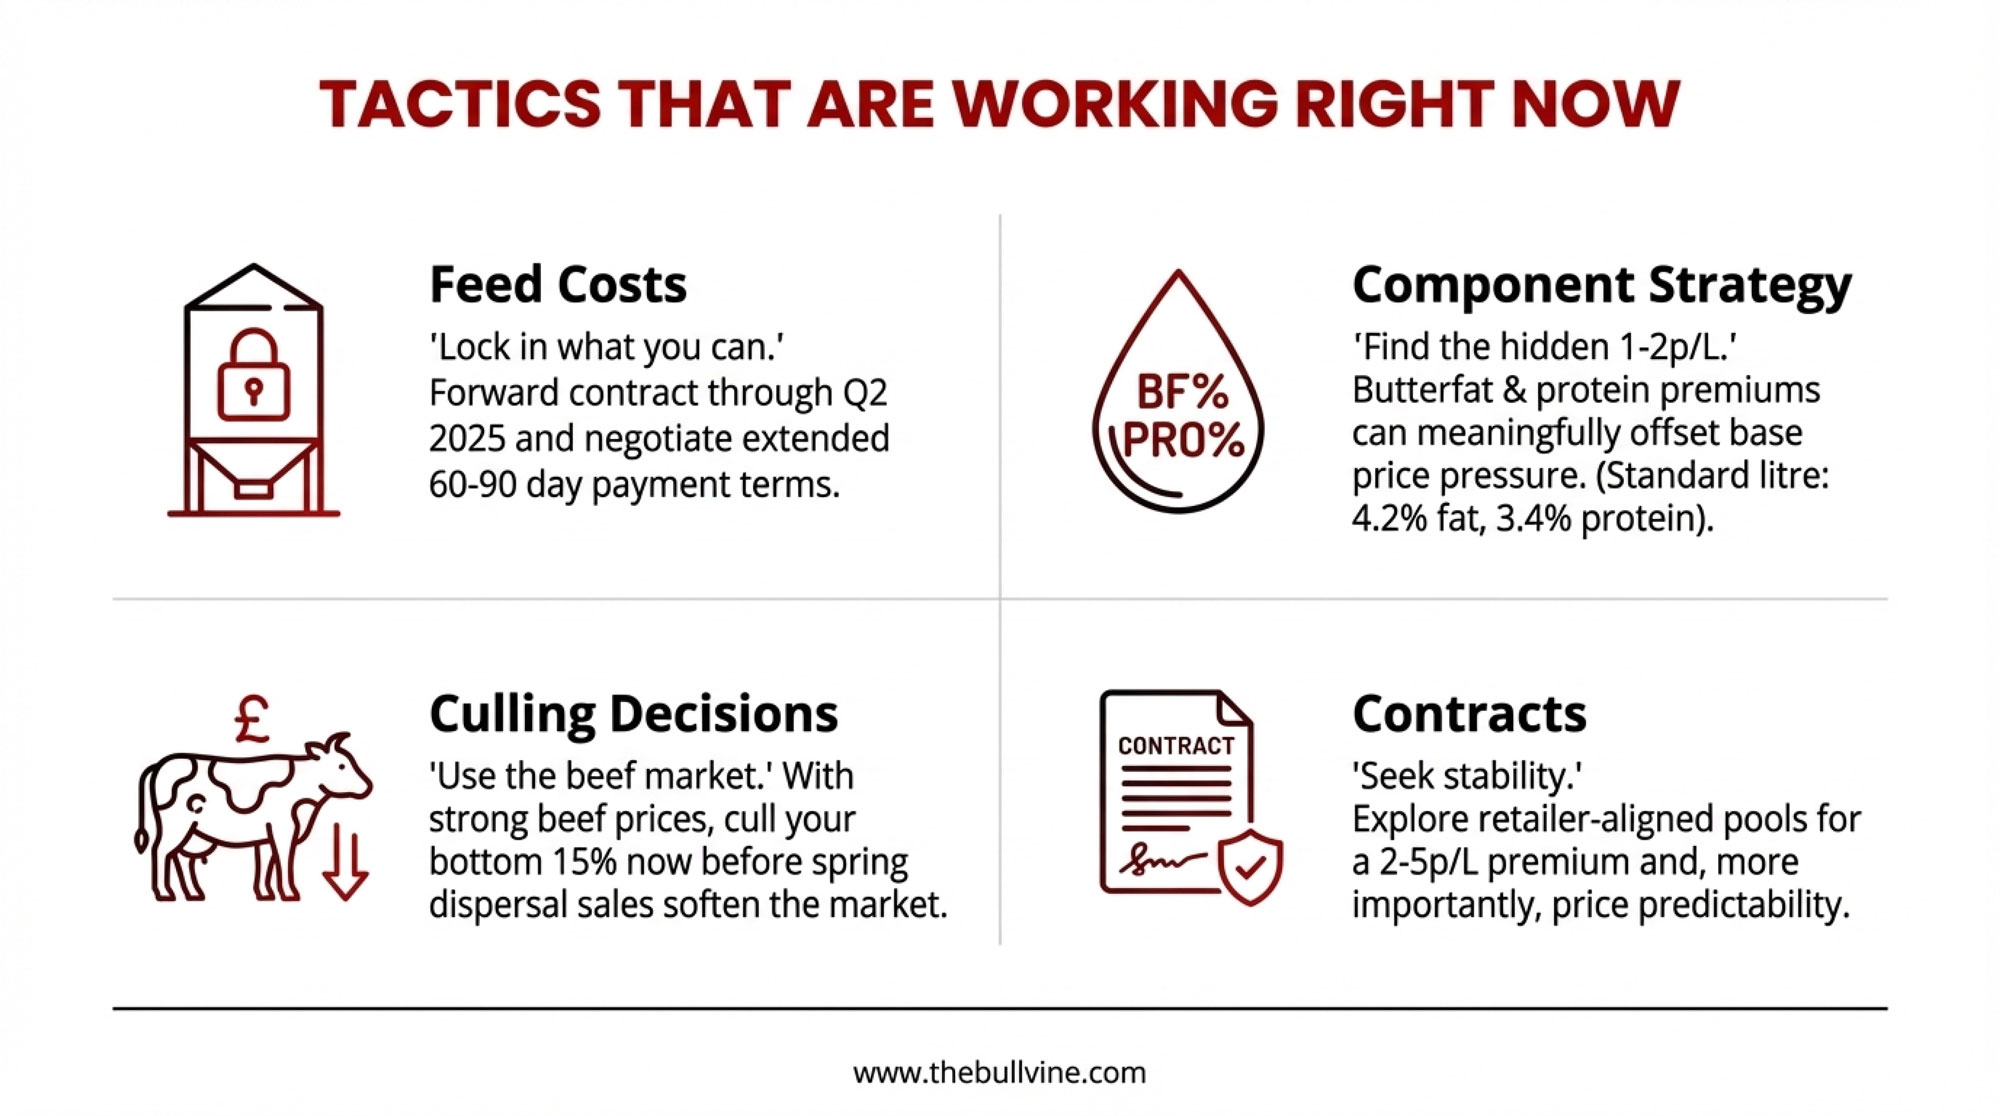
On feed costs: “Lock what you can while grain markets are favourable” was something I heard over and over. Feed generally runs over 40% of variable costs for most of us, so it’s one of the bigger levers you can actually pull. Forward contracting through Q2 2025 won’t entirely offset a 15p/litre shortfall, but it removes one variable from the equation. Several farmers mentioned negotiating extended payment terms—60-90 days—in exchange for volume commitments. Worth exploring.
On component strategy: Here’s something that doesn’t get enough attention in these pricing discussions: butterfat and protein premiums can meaningfully offset base price pressure for operations set up to capture them. UK butterfat levels averaged 4.44% in October 2025 according to Defra statistics—but there’s wide variation between herds. First Milk’s Mike Smith noted in their June 2025 announcement that component payments directly affect their manufacturing litre price, with the standard calculated at 4.2% butterfat and 3.4% protein. Farms consistently running above those benchmarks are realizing additional value that doesn’t show in base-price comparisons. If your herd genetics and nutrition programme support higher components, that’s real money—potentially 1-2p/L or more depending on your processor’s payment structure.
On culling decisions: With beef prices relatively strong right now, the math on marginal cows looks different than it might in other years. The general guidance is to look hard at your bottom 15% by productivity—but timing matters too. Cull values tend to be better now than they might be if spring brings a wave of dispersal sales from farms exiting. One Cumbrian producer told me he’d moved 20 cows in November specifically because he expected prices to soften by February. Smart thinking.
On contracts: Farmers with competitive cost structures and solid compliance credentials may benefit from exploring retailer-aligned pools. The premium over standard contracts—typically 2-5p per litre—can add up to £35,000-£90,000 annually on a million-litre operation. Application windows for Q1 usually run in autumn, so timing for 2025 might be tight, but it’s worth a conversation.
And here’s something that doesn’t get talked about enough: farmers on well-structured, aligned contracts often say it’s the stability, not just the premium, that makes the real difference during volatile times. Knowing your price three months out changes how you plan, how you manage cash flow, and, honestly, how those conversations with your bank manager go.
On sharing information: Producer Organisations provide a framework for collective engagement that individual suppliers just don’t have. The Fair Dealing regulations have given these structures more teeth. Several farmers mentioned that even informal setups—WhatsApp groups where neighbours compare milk checks and input costs—have been really valuable for understanding whether their situation reflects broader patterns or something specific. Shared information helps everyone.
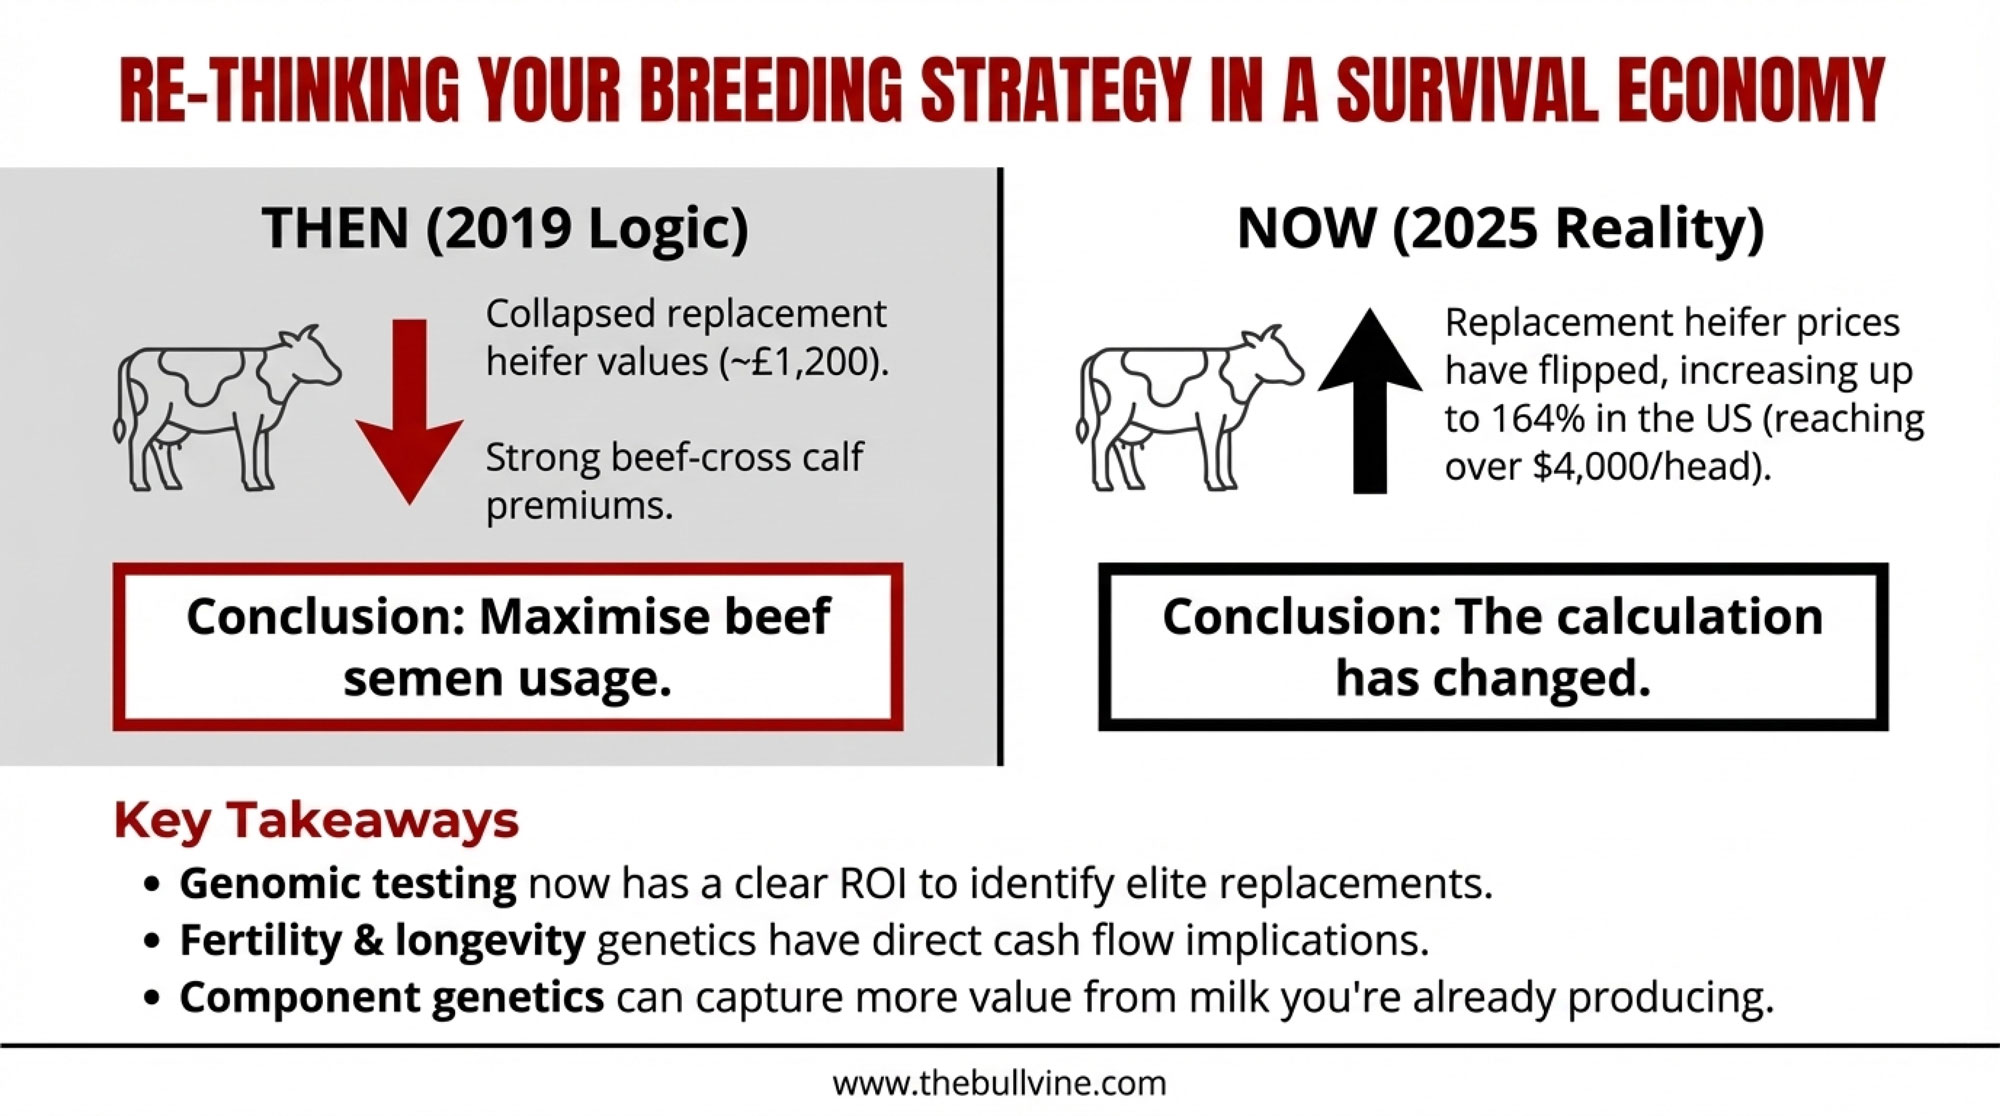
Breeding Decisions in a Survival Economy
Here’s something worth thinking through carefully if you’re making genetic decisions right now: the beef-on-dairy question has gotten a lot more complicated.
The numbers tell part of the story. According to AHDB’s December 2025 analysis, dairy beef now makes up 37% of GB prime cattle supply—up from 28% in 2019. Dairy-beef calf registrations increased another 6% in the first half of 2025 compared to the same period in 2024. That’s a significant shift in how our industry contributes to the broader meat supply.
What’s driven it? Pretty straightforward economics, really. When beef-cross calves were bringing strong premiums and replacement heifer values had collapsed to around £1,200 back in 2019, the maths pushed many operations toward more beef semen at the bottom end of the herd. Made perfect sense at the time.
But here’s what’s changed: replacement heifer economics have flipped dramatically. In the US, USDA data shows replacement dairy heifer prices jumped 69% year-over-year in Wisconsin—from $1,990 to $2,850 by October 2024. CoBank’s August 2025 analysis reported prices reaching $3,010 per head nationally, with top heifers in California and Minnesota auctions fetching over $4,000. That’s a 164% increase from the 2019 lows.
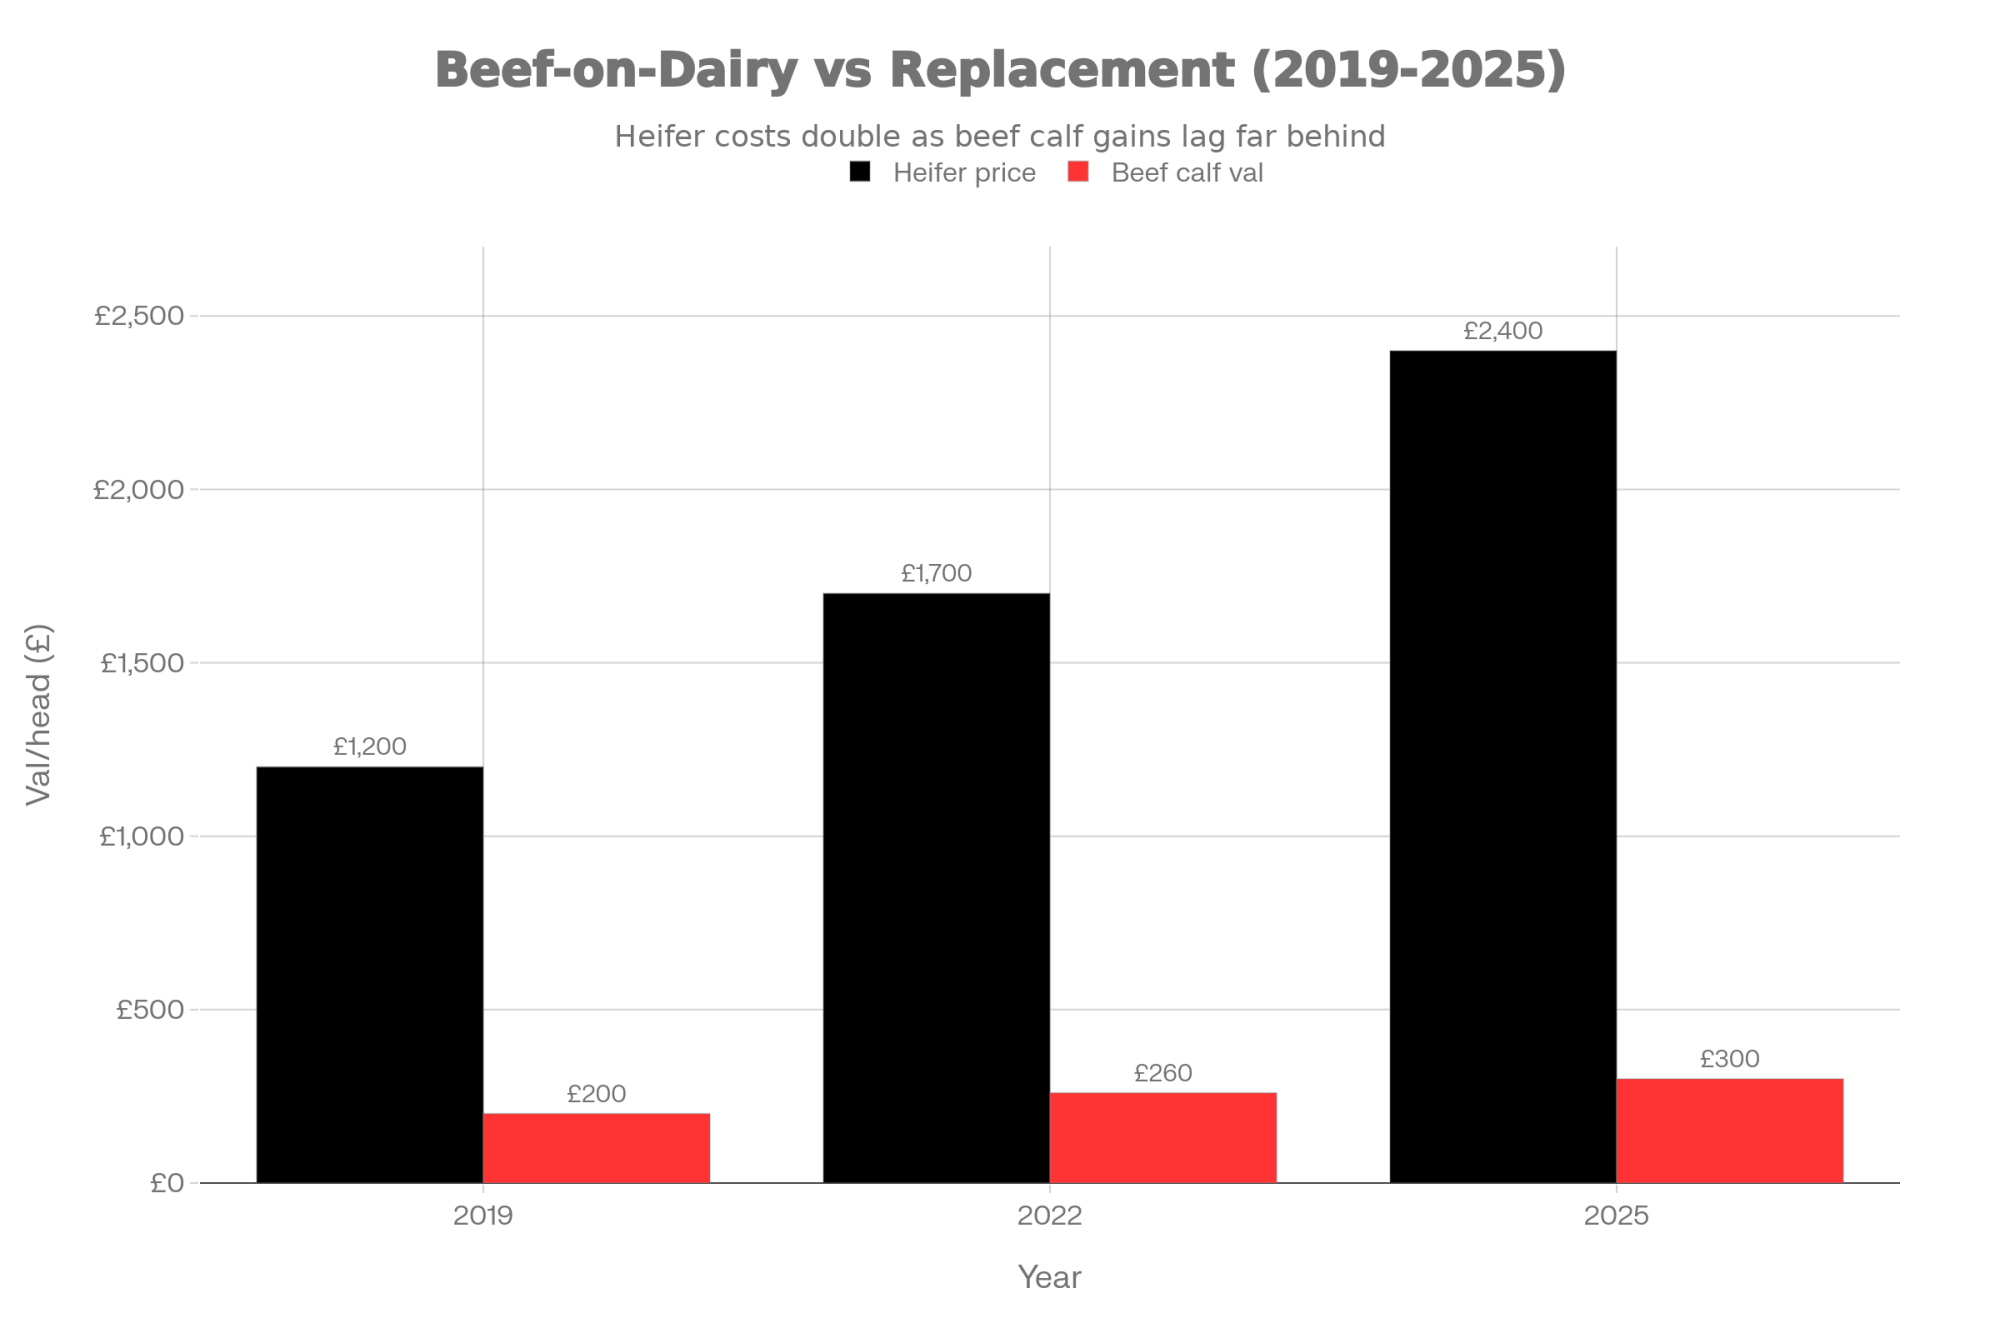
The UK hasn’t seen quite the same spike, but the trend is similar: quality replacement heifers are getting harder to source and more expensive when you find them.
So what does this mean for breeding decisions right now? A few things worth considering:
- Genomic testing economics have shifted. When heifers were cheap, testing your youngstock and culling aggressively on genomics felt like a luxury. Now, with replacement costs significantly higher, knowing which animals are worth developing and which should go to beef makes real financial sense.
- The fertility-longevity trade-off matters more. Every open cow or early cull represents a replacement purchase in a tight heifer market. Genetic selection for fertility and productive life has direct cash flow implications that weren’t as acute three years ago.
- Component genetics intersect with pricing strategy. If your processor pays meaningful butterfat and protein premiums, breeding decisions that move those numbers aren’t just about future herd composition—they’re about capturing more value from the milk you’re already producing.
I’m not suggesting everyone should immediately pivot away from beef-on-dairy—the calf values are still there, and for many operations the economics still work. But the calculation has changed enough that it’s worth running the numbers fresh rather than assuming what worked in 2021 still makes sense in 2025.
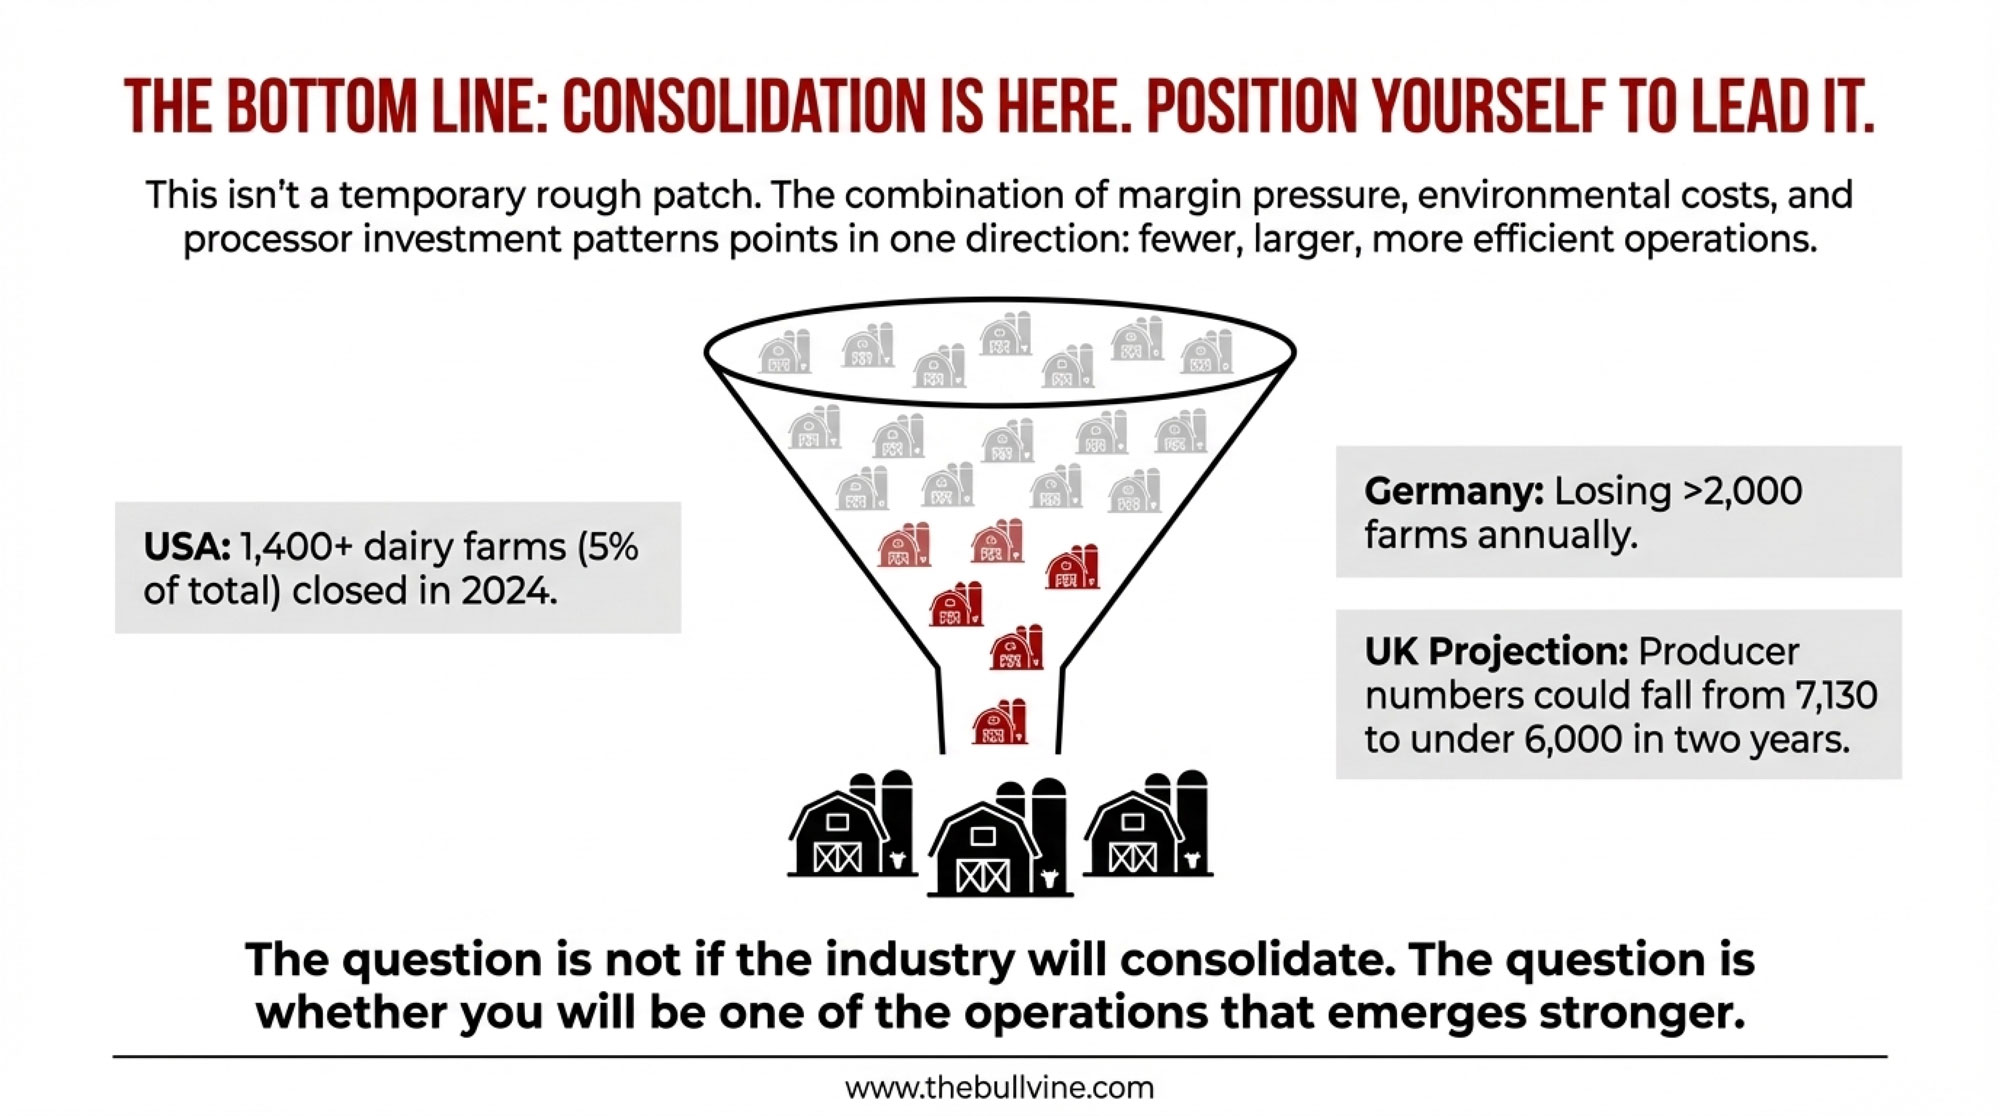
The Bottom Line: Consolidation is Coming—Position Yourself Now
Let me be direct about what I see happening.
The UK dairy industry isn’t just going through a temporary rough patch. It’s consolidating. The combination of margin pressure, environmental compliance costs, and processor investment patterns all point in the same direction: fewer, larger operations capturing a greater share of production. USDA data shows more than 1,400 US dairy farms closed in 2024—that’s 5% of all operations in a single year. Germany is losing over 2,000 dairy farms annually. The Andersons Outlook report projects GB dairy producers could fall to between 5,000 and 6,000 within the next two years, down from 7,130 in April 2024. The pattern is global, and it’s accelerating.
That’s neither good nor bad—it’s just reality. The question is whether you’re positioned to be one of the operations that emerges stronger, or whether the current squeeze catches you unprepared.
The farms that will thrive through this cycle share some common characteristics: debt loads below 50%, production costs under 38p, component levels capturing premium payments, breeding programmes balancing replacement needs against beef income, and the willingness to explore non-traditional arrangements—whether that’s aligned contracts, on-farm processing, or strategic partnerships.
The current environment is genuinely challenging, but it’s not the same for everyone. Some farms will work through this and find opportunities on the other side. Others face situations where operational improvements alone may not be enough.
Figuring out which category your operation falls into is the essential first step. Run your numbers honestly. Have proactive conversations with your lender—before they’re calling you. Think through the full range of options, including the possibility of stepping away with equity intact rather than waiting until choices narrow.
If it’s been more than a couple of months since you’ve really dug into your financial position, this might be a good week for that work. The decisions made now—with complete information and realistic expectations—are usually the ones that still look sound eighteen months down the road, whatever direction ends up making sense for your situation.
The processors are betting on continued milk availability. The question is: at what price, and from whom?
KEY TAKEAWAYS
- You’re Losing 15p on Every Litre: 28.8p farmgate vs. 44p production cost = £2,500/month loss for average herds. First sub-30p price in over a year.
- Processors Are Expanding While Farms Contract: €401M Arla profit. Müller margins tripled to £39.6M. £300M in new capacity committed. The pain isn’t distributed equally.
- This Is Global Restructuring, Not a Local Dip: Half of US dairy borrowers expected to be unprofitable in 2025. Germany loses six farms daily. Same pattern, different currencies.
- Your True Breakeven Is 2-3p/L Higher: Environmental compliance—ammonia targets, water-quality regs—is now a line item. Update your numbers before your lender does.
- The 90-Day Survival Test: Debt below 50%? Costs under 38p/L? Strategy capturing value beyond base price? Farms passing all three will shape the consolidation. The rest will be shaped by it.
Complete references and supporting documentation are available upon request by contacting the editorial team at editor@thebullvine.com.
Learn More
- Squeezed Out? A 12-Month Decision Guide for 300-1,000 Cow Dairies – Arms you with a month-by-month survival roadmap to combat shrinking margins. You’ll gain specific ROI benchmarks for robotic transitions and labor-saving tech, allowing you to stop the equity bleed and stabilize cash flow before spring arrives.
- 2025’s $21 Milk Reality: The 18-Month Window to Transform Your Dairy Before Consolidation Decides for You – Exposes the structural shifts reshaping the global dairy landscape. It delivers a blueprint for restructuring your operation into a high-leverage business model, ensuring you emerge as a leader in the inevitable consolidation wave hitting the industry by 2030.
- Sensor-Based Milking Speed: CDCB’s Game-Changing Trait Set for August Release – Reveals a breakthrough in genetic selection that directly cuts parlor labor costs. By selecting for sensor-derived milking speed, you gain a massive competitive advantage, optimizing throughput and slashing hours without adding a single extra cow to the herd.
 Join the Revolution!
 Join the Revolution!
Join over 30,000 successful dairy professionals who rely on Bullvine Weekly for their competitive edge. Delivered directly to your inbox each week, our exclusive industry insights help you make smarter decisions while saving precious hours every week. Never miss critical updates on milk production trends, breakthrough technologies, and profit-boosting strategies that top producers are already implementing. Subscribe now to transform your dairy operation’s efficiency and profitability—your future success is just one click away.


