12,200 farmers control €19B in milk revenue—but who controls the farmers?
EXECUTIVE SUMMARY: What farmers are discovering about the Arla-DMK merger goes beyond the €19 billion headline—it’s fundamentally about whether 12,200 producers across seven countries just traded €54,000 in annual pricing differences for an uncertain future of variable payments. The European Commission’s latest agricultural outlook shows that EU milk production is expected to decline by 0.2% to 149.4 million metric tonnes in 2025, indicating that this consolidation occurs during a period of contraction, not growth. DMK’s transition payments of 2.2 euro cents per kilogram through 2028 temporarily cushion the shift, but when those end, farmers face component-based pricing that could swing annual revenues by €88,500—enough to make or break mid-sized operations. Research from Hoard’s Dairyman’s July 2024 analysis reveals how component pricing transforms farmers into unwitting commodity traders, where butterfat and protein market crashes directly hit milk checks. The USDA’s October 2024 EU dairy report confirms that processors are prioritizing higher-margin cheese production while farmers bear all production risks. Here’s what this means for your operation: whether inside or outside this merger, the fundamental shift from cooperative ownership to corporate supplier status requires immediate financial planning, component optimization, and maintaining alternative buyer relationships—because history shows mega-cooperatives rarely deliver the promised benefits at this unprecedented scale.
Picture this: A dairy farmer in Lower Saxony opens his co-op newsletter and sees the number that’s been keeping him up at night—€54,000. That’s what the price difference between DMK’s €0.473 per kilogram and neighboring Arla’s €0.509 means for his 1.5-million-kilogram operation annually. Now, with these two giants merging to form Europe’s largest dairy cooperative, that gap isn’t disappearing—it’s transforming into something entirely new.
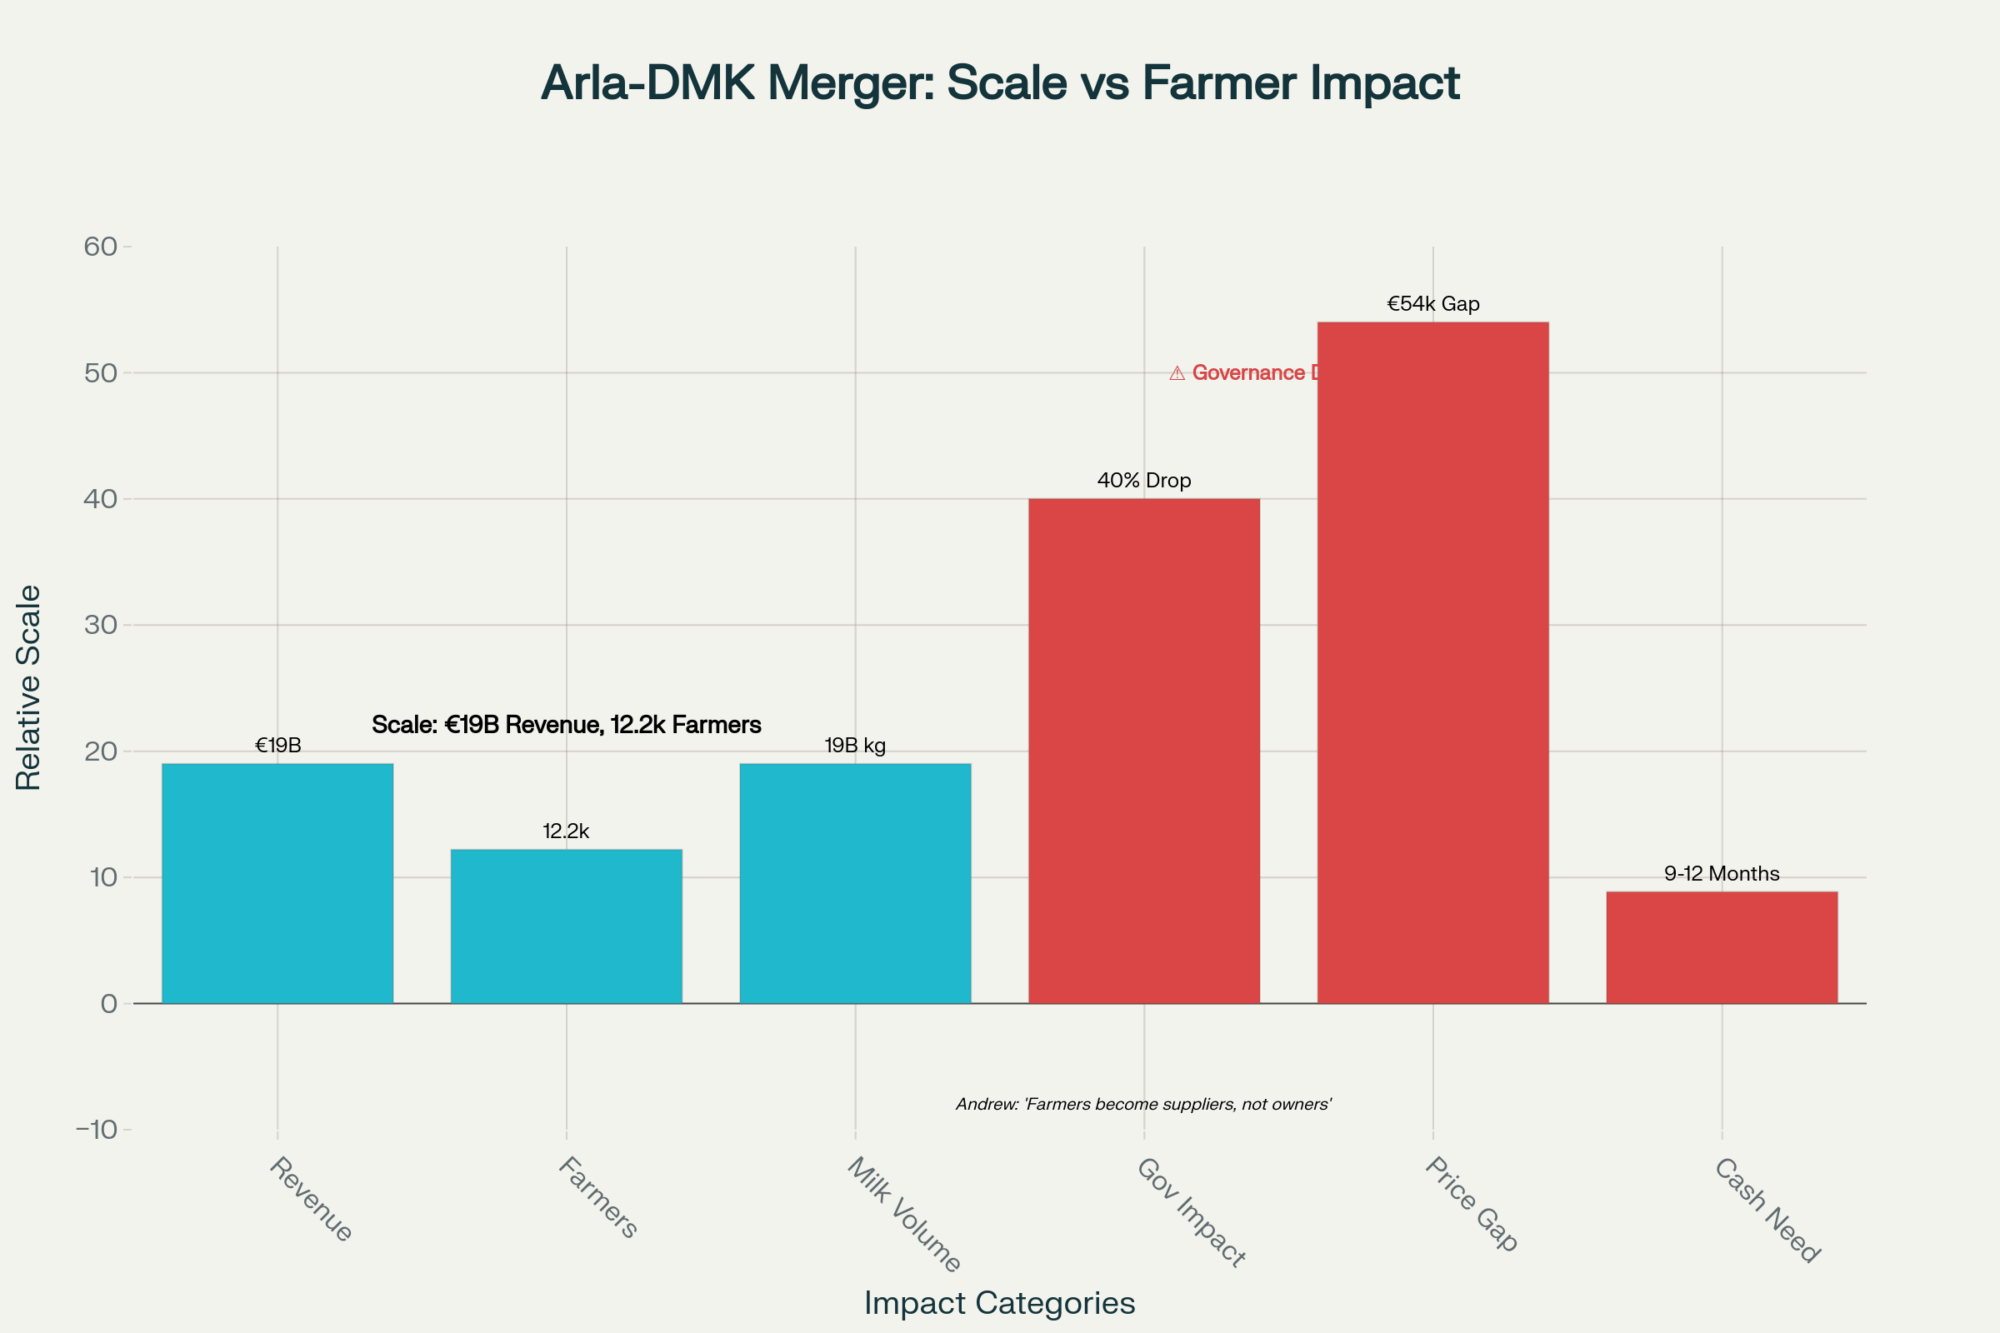
When the boards approved this €19 billion merger in June 2025, they didn’t just bring together 8,900 Arla farmers with 3,300 DMK producers. They fundamentally changed how 12,200 dairy families across seven countries will think about risk, reward, and the very nature of cooperative membership.
The Opposition They Don’t Want You to Hear
While official announcements paint a rosy picture, Kjartan Poulsen—himself an Arla member and president of the European Milk Board representing tens of thousands of farmers—drops a bombshell: “Co-operatives have ceased to be the representatives of producers’ interests they claim to be on paper.”
Think about that. An insider, someone actually voting on this merger, is warning that these cooperatives “neither live up to their responsibility nor meet the standards they themselves set out.” His concerns echo what many farmers whisper but few say publicly: as cooperatives grow massive, individual farmer voices get lost in the corporate machinery.
The European Milk Board’s criticism cuts deeper. They point out that while EU-level discussions push for obligatory contracts between producers and processors to ensure fair pricing, cooperatives consistently demand exemptions. With this merger controlling a significant market share, those exemptions mean “fair prices and transparent contracts remain an illusion at the expense of producers.”
The Transition Payment Math That Changes Everything
DMK’s official merger documents reveal a carefully orchestrated transition that’s both clever and concerning. From 2026 through 2028, DMK and DOC Kaas farmers receive an additional 2.2 euro cents per kilogram, with quarterly payments in September 2026, March 2027, and September 2027, and ending in March 2028. These come from the merged entity’s common equity, not from reducing anyone’s current payments.
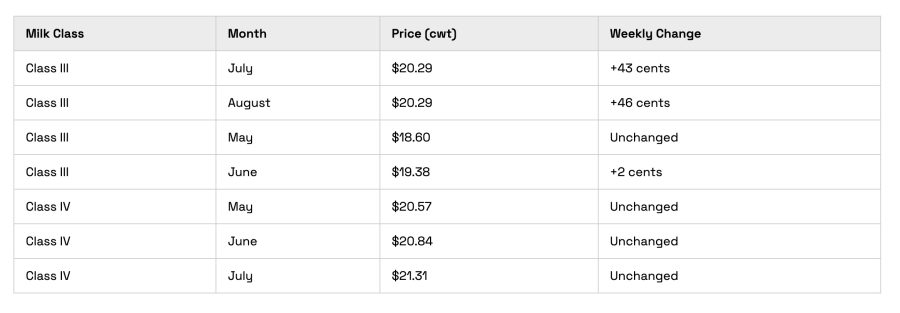
However, what they’re not emphasizing is that after 2028, everyone will shift to Arla’s component-based system. According to Arla’s half-year 2025 results, the average price was 57.5 cents per kilogram across all markets. Sounds good, right? Except that it includes seven countries, both conventional and organic, and a massive variation based on butterfat and protein levels.
Quick Calculator: Your Transition Impact
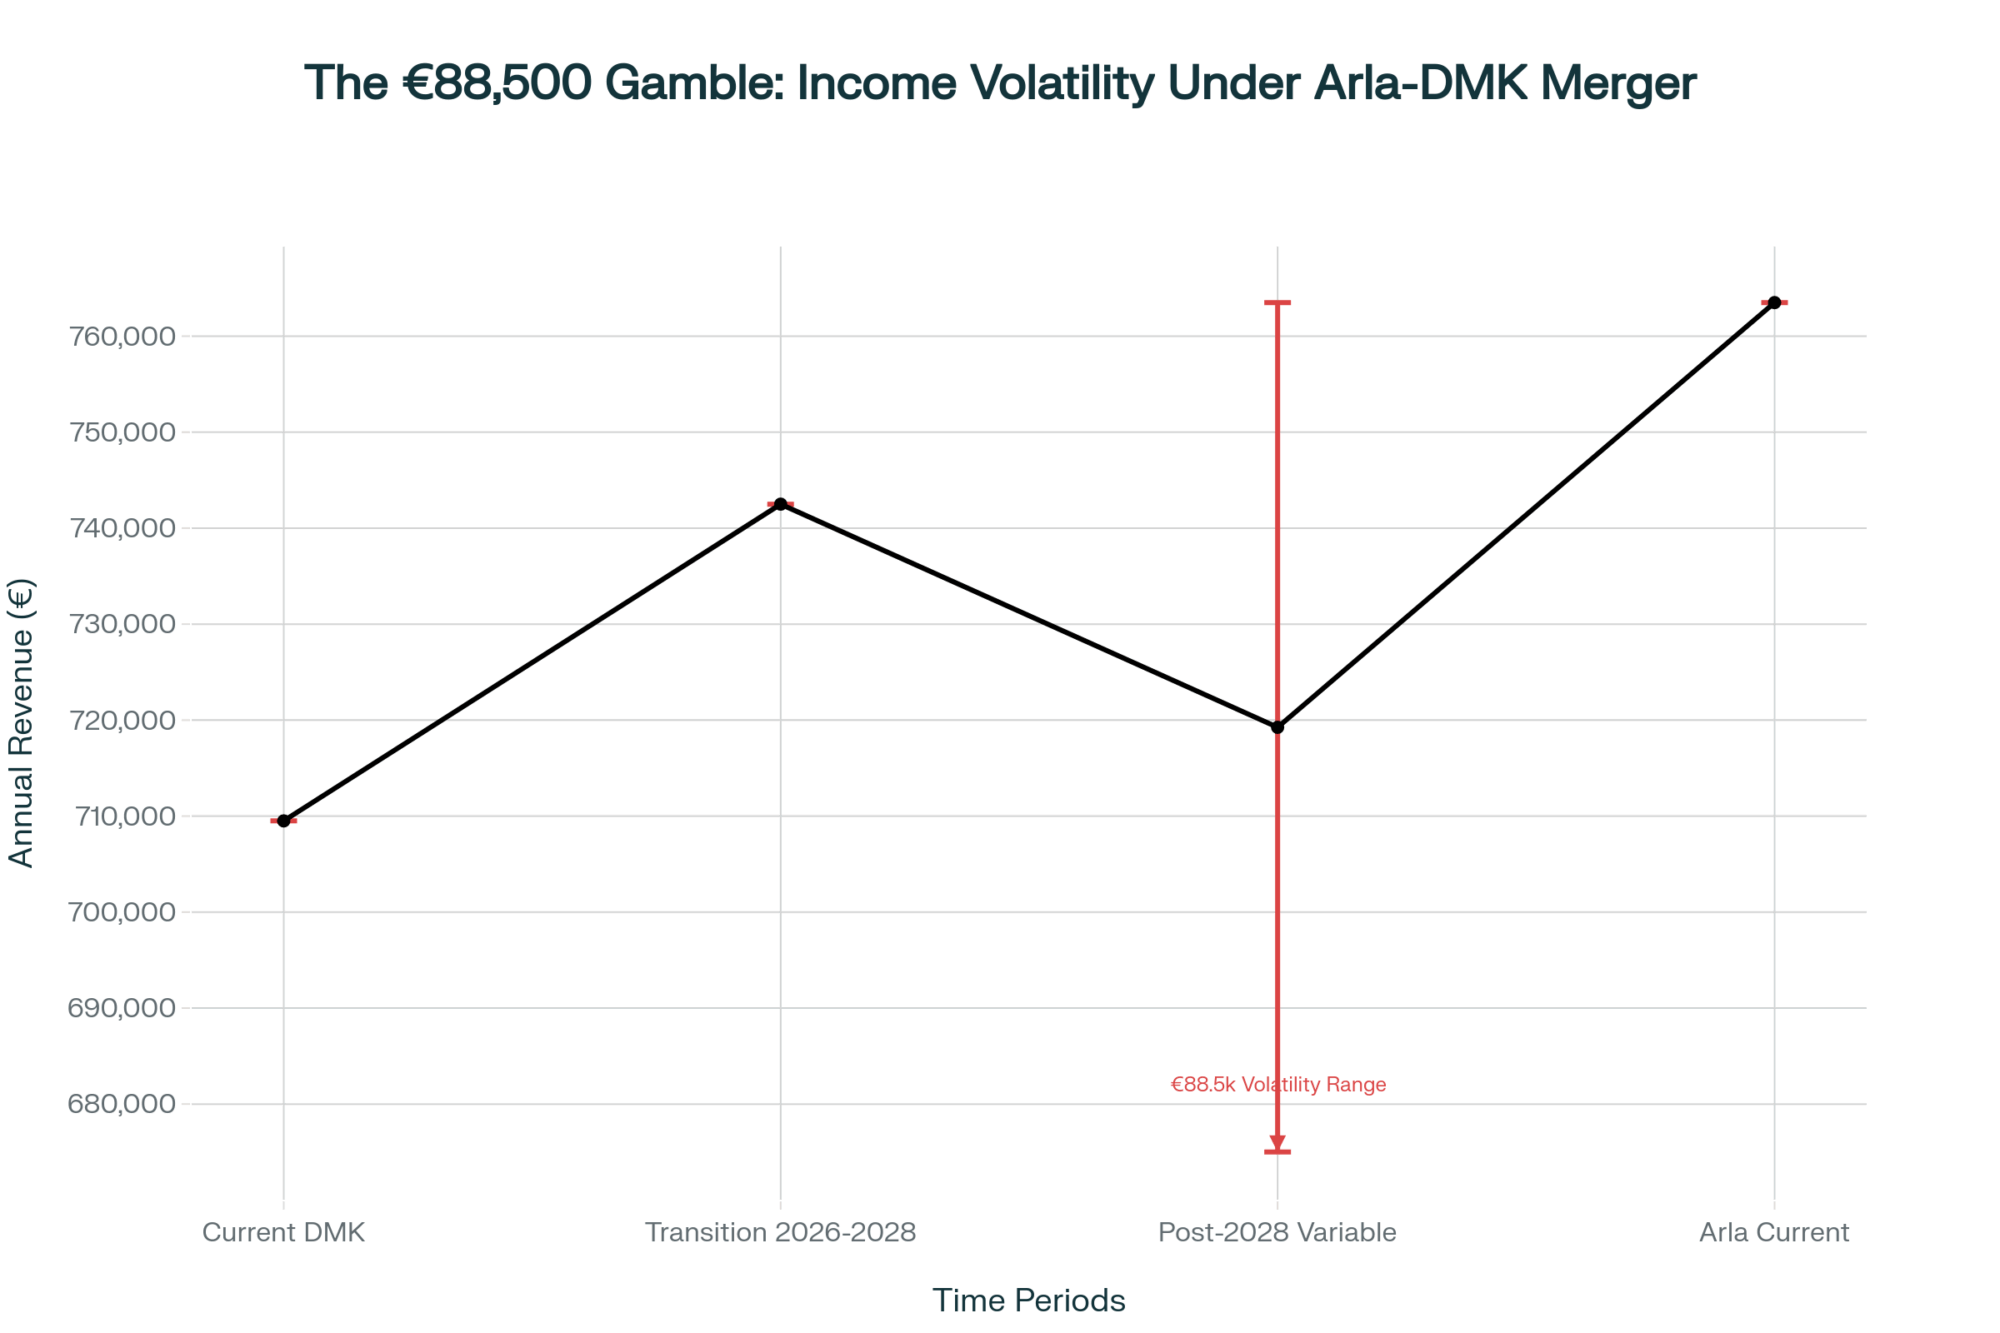
Current DMK farmer (1.5 million kg/year):
- Now: €709,500 annually (€0.473/kg)
- Transition period: €742,500 (€0.495/kg with bonus)
- Post-2028: Variable between €675,000-€763,500
That’s an €88,500 annual swing based on factors largely outside your barn door. For comparison, that volatility equals:
- 18 months of tractor payments
- Complete parlor renovation
- Feed for 60 additional cows
The Component Pricing Trap Nobody’s Discussing
Understanding component pricing isn’t just academic—it’s survival. The “Three C’s” of milk pricing—commodities, components, and classes—determine everything. Under Arla’s system, your milk’s value depends on:
- Butterfat percentage (worth more in butter markets)
- Protein content (drives cheese value)
- Other solids (affects powder pricing)
- Quality premiums (somatic cell counts, bacteria levels)
The catch? Market volatility in any of these components directly hits your milk check. When cheese markets tank, protein values drop. When butter surplus builds, butterfat premiums evaporate. You’re no longer just a milk producer—you’re an unwitting commodities trader.
Why the European Commission’s Numbers Should Terrify You

The USDA’s October 2024 EU Dairy and Products Annual Report, which analyzes European Commission data, reveals the context driving this merger. EU milk deliveries hit 149.4 million metric tonnes for 2025, down 0.2% from the previous year. The Commission’s Summer 2025 Short-Term Agricultural Outlook predicts that the EU dairy herd will continue to shrink by 1% annually, with production declining marginally.
But look closer at product allocation. While overall production drops, cheese production actually rises to 10.8 million metric tonnes (up 0.6%). Meanwhile, butter falls to 2.1 million tonnes, and skim milk powder drops 4% to 1.4 million tonnes.
Translation: Processors are cherry-picking profitable products while farmers bear production risks. When this merged entity controls 19 billion kilograms annually, their allocation decisions determine market prices for everyone.
The Environmental Compliance Bomb
The Common Agricultural Policy’s 2023-2027 strategic plans include climate requirements that translate to massive farm costs. Different regions face different hammers:
- Netherlands: Nitrogen caps threatening 18% herd reductions
- Ireland: Water quality standards requiring infrastructure overhauls
- Germany: Fertilizer ordinances limiting nutrient applications
Individual farms can’t navigate these alone. The merger promises shared technical resources and collective advocacy. But as Poulsen warns, when cooperatives grow this large, whose interests really get represented?
Alternative Perspectives: The Processor Gold Rush
Regional processors see opportunity in this consolidation. While Arla-DMK creates a giant, it also creates gaps. Specialty buyers in organic and A2 markets actively court farmers seeking alternatives. Cross-border movement between Germany, the Netherlands, and Belgium continues despite the merger.
The real question is: Can alternative processors offer competitive pricing when one entity controls such a massive volume? History suggests market concentration rarely benefits primary producers.
Practical Survival Guide for Navigating This Merger

If You’re Inside the Merger:
1. Build Your War Chest Now Component pricing creates volatility. Build 9-12 months of operating expenses in reserves before 2028. That’s not pessimism—it’s aligning financial reality with the payment structure.
2. Master Your Components. A 0.1% increase in butterfat could mean a €2,500 monthly savings for mid-sized operations. Invest in:
- Genetic selection for components
- Feed programs targeting butterfat/protein
- Comfort improvements reducing stress
3. Document Everything Track your current payments, quality bonuses, and hauling costs. When transition payments end, you’ll need baseline comparisons for negotiations.
If You’re Outside Looking In:
1. Leverage Your Independence Market yourself as “supporting local, independent farming.” Consumers increasingly value supply chain transparency.
2. Lock in Contracts Now. While the merger creates uncertainty, lock in favorable terms with current buyers before market dynamics shift.
3. Consider Producer Organizations Unlike co-op members, you can join producer organizations to collectively negotiate better prices—a right Poulsen notes cooperative members lose.
The Global Warning Signal
This merger reflects worldwide patterns. In the U.S., Dairy Farmers of America’s consolidation resulted in hundreds of millions of dollars in antitrust settlements. New Zealand’s Fonterra shows that massive scale doesn’t guarantee better returns—many members question whether bigger means better.
What’s different about Europe? The speed and scale. Combining 12,200 farmers across seven countries with different languages, regulations, and markets in one stroke? That’s unprecedented.
The Hard Questions Nobody’s Asking
- Where’s the detailed financial modeling? Farmers voted without seeing farm-level impact projections.
- What are the exit penalties? Merger documents don’t clearly outline how farmers can leave if promises don’t materialize.
- Who really controls decisions? With 12,200 members, does your vote matter, or does management run the show?
- Where’s the competition authority review? The European Commission must approve this, but will they truly assess the impact on farmers or just market efficiency?
The Bottom Line: Your Move
This merger isn’t about growth—EU production is declining according to the Commission’s medium-term outlook. It’s about control. Control over processing allocation, market access, and ultimately, the destiny of farmers.
The 2.2 cents transition payment is a Band-Aid on a structural wound. When it ends in 2028, farmers face the reality of variable pricing in concentrated markets with fewer alternatives.
For those inside: Start planning now for increased volatility. For those outside: Secure your independence while you can. For everyone: Remember that cooperatives exist to serve farmers, not the other way around.
The €54,000 question isn’t really about price differentials. It’s about whether 12,200 farmers have just given up their market power for the promise of collective strength, a promise that history suggests rarely materializes at this scale.
As one German farmer told me off the record: “My grandfather built this co-op with his neighbors. Now I’m just employee number 12,201 in a corporation that happens to buy my milk.”
KEY TAKEAWAYS:
- Financial Impact: DMK farmers face €88,500 annual income volatility post-2028 (€675,000-€763,500 range), requiring 9-12 months operating reserves versus traditional 3-4 months—that’s €177,000-€236,000 in cash cushioning for typical 1.5 million kg operations
- Component Optimization: Every 0.1% butterfat increase generates €2,500 monthly for mid-sized farms under Arla’s system—prioritize genetics selection, adjust feed programs for 4.0%+ butterfat targets, and invest in cow comfort improvements that reduce stress-related component drops
- Market Positioning: Regional processors like Hochwald actively court farmers with competitive alternatives, while specialty organic and A2 buyers offer 8-15% premiums—maintain certifications with 2-3 alternative buyers even if committed to the cooperative
- Governance Reality: With 12,200 members across different regulations and languages, individual farm influence drops 40% compared to sub-1,000 member cooperatives, according to Swedish agricultural research—engage through regional meetings and document all quality/payment changes for future negotiations
- Strategic Timeline: Lock current contracts before 2026 transition begins, build reserves during 2026-2028 payment bonus period, prepare for full variable pricing by investing in quality improvements that directly impact component payments—because after 2028, there’s no going back
Complete references and supporting documentation are available upon request by contacting the editorial team at editor@thebullvine.com.
Learn More:
- Class III Milk Futures Explained – This tactical guide provides a practical framework for using futures to manage the volatility of component pricing. It offers a step-by-step approach to hedging, diversifying risk, and avoiding common trading mistakes, directly addressing the post-2028 reality highlighted in the main article.
- 2025 Dairy Market Reality Check: Why Everything You Think You Know About This Year’s Outlook is Wrong – This strategic analysis reveals how policy shifts and component economics are fundamentally reshaping the industry. It provides a crucial U.S. perspective, showing how the global trend of prioritizing butterfat and protein over volume is creating both new risks and profit opportunities for progressive producers.
- Genetic Revolution: How Record-Breaking Milk Components Are Reshaping Dairy’s Future – This article on innovation and technology details how genomic selection is directly driving the component revolution. It explains how targeted breeding programs can increase butterfat and protein, offering a concrete, long-term solution to the component pricing challenge faced by farmers in the new merged entity.
 Join the Revolution!
 Join the Revolution!
Join over 30,000 successful dairy professionals who rely on Bullvine Weekly for their competitive edge. Delivered directly to your inbox each week, our exclusive industry insights help you make smarter decisions while saving precious hours every week. Never miss critical updates on milk production trends, breakthrough technologies, and profit-boosting strategies that top producers are already implementing. Subscribe now to transform your dairy operation’s efficiency and profitability—your future success is just one click away.