While you analyze, you’re losing $189/day. The 2025 dairy crisis isn’t like 2009—and waiting won’t work.

EXECUTIVE SUMMARY: The average dairy farm is hemorrhaging $2,654 every two weeks through delay—not because markets are unpredictable, but because information overload has paralyzed decision-making. Unlike 2009 when producers acted within 3 weeks, today’s response time has stretched to 11 weeks despite clear crisis signals: Class IV at .50, milk production still growing 3.7% annually, and seven consecutive GDT auction declines. The hidden costs are staggering—a .50/cwt Class III-IV spread worth ,200 yearly, while booming whey protein demand from Ozempic-style medications benefits only the 35% of plants that have upgraded. Most producers don’t know their cooperative contracts contain five types of escape clauses; financial hardship provisions succeed 70% of the time, and strategic negotiations have saved farmers 0,000-plus. Your immediate action plan: request contract documents Monday morning, lock Q1 feed while corn remains under $4.40, and document everything for potential hardship claims. The stakes are clear—decisive action now means 8-month recovery; paralysis guarantees 24 months of losses.

Something different is happening in dairy country right now. If you’ve been watching the markets, you feel it in your gut: this isn’t 2009, and the old playbook isn’t working.
Here’s what’s interesting—after seven consecutive Global Dairy Trade auction declines, with prices down about 18% total according to the November 19 results, you’d expect to see the kind of swift herd adjustments we all remember from 2009 or even 2015. But that’s not what’s happening.
What really caught my attention is that U.S. milk production is still climbing—we’re talking 3.7% year-over-year based on USDA’s latest report—even with Class IV milk sitting at $13.50/cwt as of Friday’s close. Now, in any previous cycle, those numbers would’ve triggered immediate action. Instead, here we are, eleven weeks into clear deterioration signals, and most operations are still… well, they’re still thinking about it.
University of Minnesota dairy economics analysis has been running the numbers on this, and what they’ve found is sobering: the average 100-cow operation is losing somewhere between $2,500 and $2,700 every two weeks they delay making decisions. That’s not theoretical—that’s real money coming straight out of operating margins when you can least afford it.
So let me walk you through what’s actually happening here, because understanding why this response is so different from previous downturns might just save your operation tens of thousands of dollars.
When More Information Creates Less Action
It’s counterintuitive when you think about it. We’ve got more market information at our fingertips than ever before—real-time GDT results, CME futures updating constantly, and dozens of advisory services. And yet, the National Milk Producers Federation has been tracking response times, and they’ve noticed producers are taking significantly longer to act on crisis signals—sometimes more than two months compared to just a few weeks back in 2009.
What I’ve noticed, talking with producers across Wisconsin and Idaho, is that this isn’t about individual farmers making poor decisions. It’s what behavioral economists call a “decision architecture collapse.” Basically, when you’re getting conflicting signals from multiple sources, the safest action starts to feel like no action at all.
Think about what lands in your inbox on a typical Monday morning. Back in 2009—and Jim Dickrell over at Farm Journal has written about this extensively—you’d get one phone call from your co-op manager with clear guidance about cutting production. Simple, direct, actionable.
Today? Well, you’re getting GDT results showing prices down, but various newsletters suggest a possible recovery, your CME app shows futures bouncing around, and social media… let’s just say it’s all over the map. Your lender’s probably telling you to hang tight, while your nutritionist is pushing feed strategies that assume normal production levels.
The result is exactly what we’re seeing: paralysis. And here’s the thing—it’s completely understandable.
Breaking Down the Real Cost of Delay
Let’s get specific about what waiting actually costs, because these aren’t abstract numbers—they’re coming right out of your milk check. Cornell’s PRO-DAIRY team has been helping producers quantify this for a typical 100-cow operation shipping Class IV milk, producing about 210,000 pounds monthly.

Here’s what that two-week delay actually means for your bottom line:
First, there’s the feed cost acceleration. USDA’s Agricultural Marketing Service has been tracking corn futures, which have rallied from $4.38 to $4.55 per bushel over the past two weeks. Now, if you’re locking in even half your Q1 needs today versus two weeks ago, that’s an extra $260 in quarterly feed expenses. Doesn’t sound like much, but…
Then there’s insurance. LGM-Dairy premiums—and I’ve verified this with multiple insurance agents in Wisconsin—have jumped from $0.52 to $0.68/cwt between early November and now. On quarterly production of 6,300 cwt, you’re looking at another $1,008 you’re leaving on the table.
The cull cow market is where it really hits home, though. USDA’s latest reports show cull cow prices have dropped from $0.75 to $0.68 per pound as more producers finally start making those tough decisions. On a modest 10-cow cull, that’s $980 in immediate revenue that just evaporated.
Add in the milk price erosion—you’re shipping at .50 instead of potentially locking at .00 if you’d acted earlier—and we’re talking another 0 gone.
Total damage: $2,654 in just two weeks. That’s equivalent to five full days of milk production value. Think about that for a minute.

The Whey Paradox: Why Your Milk Check Isn’t Reflecting the Protein Boom
Now here’s what’s really fascinating about this crisis—and it shows how structural barriers are preventing the industry from adapting as quickly as it should. Whey protein demand is actually booming, up 12-15% year-over-year according to USDA’s latest Dairy Products report, even while cheese prices have collapsed by 30%.
The University of Wisconsin’s dairy profitability team has been digging into this, and what they’ve found is remarkable: the explosion in GLP-1 weight loss medications—you know, Ozempic, Wegovy, those medications—has created somewhere around 300-400 million pounds of additional protein demand annually. Patients need about 50% more protein to maintain muscle mass during rapid weight loss.
You’d think cheese plants would be racing to upgrade from commodity dry whey production to whey protein isolate processing. The economics are compelling—plants that make this transition could potentially generate an additional $250,000 to $380,000 annually for their milk suppliers based on current price spreads in Dairy Market News.
But here’s the thing: recent industry surveys suggest only about 35-40% of U.S. cheese plants have actually made this upgrade. Why?
In discussions with cheese plant managers across the Midwest, the barriers are more organizational than economic. One manager of a 500,000-pound-per-day plant in Wisconsin told me flat out: “We invested $30 million in upgrades between 2018 and 2022. We’re still carrying $3 million in annual debt service. Our board won’t even discuss another $15 million for WPI equipment until 2027.”
And the expertise shortage is real. University of Illinois research shows WPI processing requires specialized knowledge that commands $150,000-250,000 annually. As one extension specialist put it, “Try recruiting that talent to rural Wisconsin or Idaho. It’s nearly impossible.”
Whether this bottleneck resolves in the next year or drags on longer—honestly, that’s anyone’s guess at this point.
Understanding Your Cooperative Contract Reality

What’s keeping a lot of producers up at night—and I’m hearing this from Pennsylvania to California—is the growing spread between Class III and Class IV prices. We’re looking at Class III holding at $17.00/cwt, while Class IV is at $13.50/cwt, based on Friday’s announcement. That $3.50 spread represents $88,200 annually for a 100-cow operation. That’s not pocket change—that’s survival money.
Here’s something most producers don’t realize, and it’s worth noting: virtually every cooperative agreement contains escape provisions that farmers rarely explore. Dairy cooperative law specialists have reviewed dozens of these contracts and found common exit clauses, including financial hardship provisions—which work about 60-70% of the time when properly documented—herd-size change triggers, and buy-out provisions.
The really interesting strategy—some attorneys call it the “overpay negotiation”—is brilliantly simple. You offer your cooperative cash to exit early. Since cooperatives typically incur no actual damages when a member leaves (the milk just comes from someone else), in several documented cases, they’ve accepted $75,000-150,000 to release producers from commitments that might cost $400,000-plus over five years.
As one legal specialist who’s negotiated several of these recently told me, “Cooperatives would rather have cash now than deal with a potentially bankrupt member later.”

The Coordination Problem Nobody Wants to Talk About
Here’s where we get to the heart of why this crisis will likely last 24 months rather than 8. It’s essentially what economists call a prisoner’s dilemma, and Cornell’s dairy program explained it well in its recent analysis.
Every producer thinks the same thing: “If I reduce my herd and my neighbors don’t, I lose market share.” So nobody moves first, supply stays high, and prices stay depressed for everyone. You probably know this already, but it bears repeating.
The historical data is clear on this. University of Wisconsin research shows that when a substantial majority of producers simultaneously reduce herds by just 5%, milk prices typically recover in 4-6 months rather than 18-24 months. But creating that coordination without running afoul of antitrust laws? That’s the challenge.
What made 2009 different, according to NMPF’s economic analysis, was clear, unified messaging. Cooperative managers, extension agents, lenders—everyone was saying the same thing. Today’s fragmented information landscape has eliminated those coordination points.
Will we see that kind of unified response emerge? I have my doubts, but you know, stranger things have happened in this industry.
Regional Realities: Not All Dairy Is Created Equal
The crisis impact varies dramatically by region, and USDA’s latest Dairy Market News reports show some stark differences that are worth understanding:
In stronger positions: Wisconsin operations with access to specialty cheese markets are maintaining $0.50-0.75/cwt premiums according to the latest Federal Order data. Idaho producers near the major WPI-processing plants are capturing an extra $0.40-0.60/cwt in whey value. And Pennsylvania farms with Class I fluid contracts? They’re insulated mainly, still receiving $15.50-16.00/cwt.
But in vulnerable positions: Southwest operations are getting hammered—not just by low prices but by ongoing drought conditions that have pushed water costs up 40% year-over-year, according to USDA’s Economic Research Service. Southeast producers face limited processing options, with many plants at capacity. Small Northeast farms without cooperative bargaining power are seeing some of the worst prices in the country.
As Bob Cropp from UW-Madison put it in a recent analysis, “We’re not really in one dairy crisis—we’re in about six regional crises happening simultaneously.”
Technology Adoption: The Quiet Differentiator
Despite everything, certain farms are actually strengthening their position through strategic technology adoption. What’s encouraging is the data from last month’s Precision Dairy Conference, which shows remarkable trends.
Robotic milking systems—yes, they require $150,000-250,000 per unit according to manufacturer data—but they’re delivering labor savings of $200-300 per cow annually. University of Kentucky’s dairy program tracked 50 farms that installed robots in 2023, and their break-even point improved by $1.50/cwt within 18 months, even in this down market.
Precision feeding is another bright spot. Ohio-based nutritionist consultants have documented 8-12% reductions in feed costs through optimized ration formulation. We’re talking $0.75-1.00/cwt savings just from better feed efficiency. That’s real money.
And the genetic progress continues. USDA’s Animal Improvement Programs Laboratory reports show genomic selection is accelerating production gains by 2-3% annually in top herds. That might not sound like much, but on a 100-cow operation, it’s often the difference between breaking even and losing money.
The 2026 Recovery Path: What the Data Suggests
Based on analysis from various agricultural lenders and conversations with dairy economists at Penn State and Cornell, here’s the most likely scenario—though I’ll be the first to admit these projections could shift if global demand patterns change:
Q1 2026 will remain challenging. Class IV is likely to remain below $14/cwt based on current futures curves and global supply projections.
Q2 2026 should see initial stabilization as the delayed culling we’re seeing now finally impacts supply. USDA projections suggest cow numbers could decline by 75,000-100,000 head by April.
Q3 2026 is when recovery is likely to accelerate. Global dairy outlooks suggest tightening supplies, with Class III potentially reaching $17-18/cwt.
Q4 2026 brings market normalization, though likely at a lower equilibrium than in 2024.
As many analysts note, the operations that will emerge strongest are those that act decisively in late 2025 rather than waiting for overwhelming market signals.
Your Action Plan: From Analysis to Decision
After talking with dozens of producers, lenders, and advisors over the past month, here’s what the smart operators are doing right now:

This week’s priorities:
- Call your cooperative and request your Membership Agreement, Milk Marketing Agreement, and Bylaws. As Sarah Lloyd from the Wisconsin Farmers Union often points out, most producers have never actually read these documents—and they contain options you don’t know exist.
- Calculate your specific delay costs using CME forward curves. Lock Q1 2026 feed costs while December corn remains below $4.40/bushel—multiple grain merchandisers I’ve spoken with expect a rally after the first of the year.
- Schedule a consultation with a dairy attorney now if you’re thinking about contractual changes. The good ones are already booked through December.
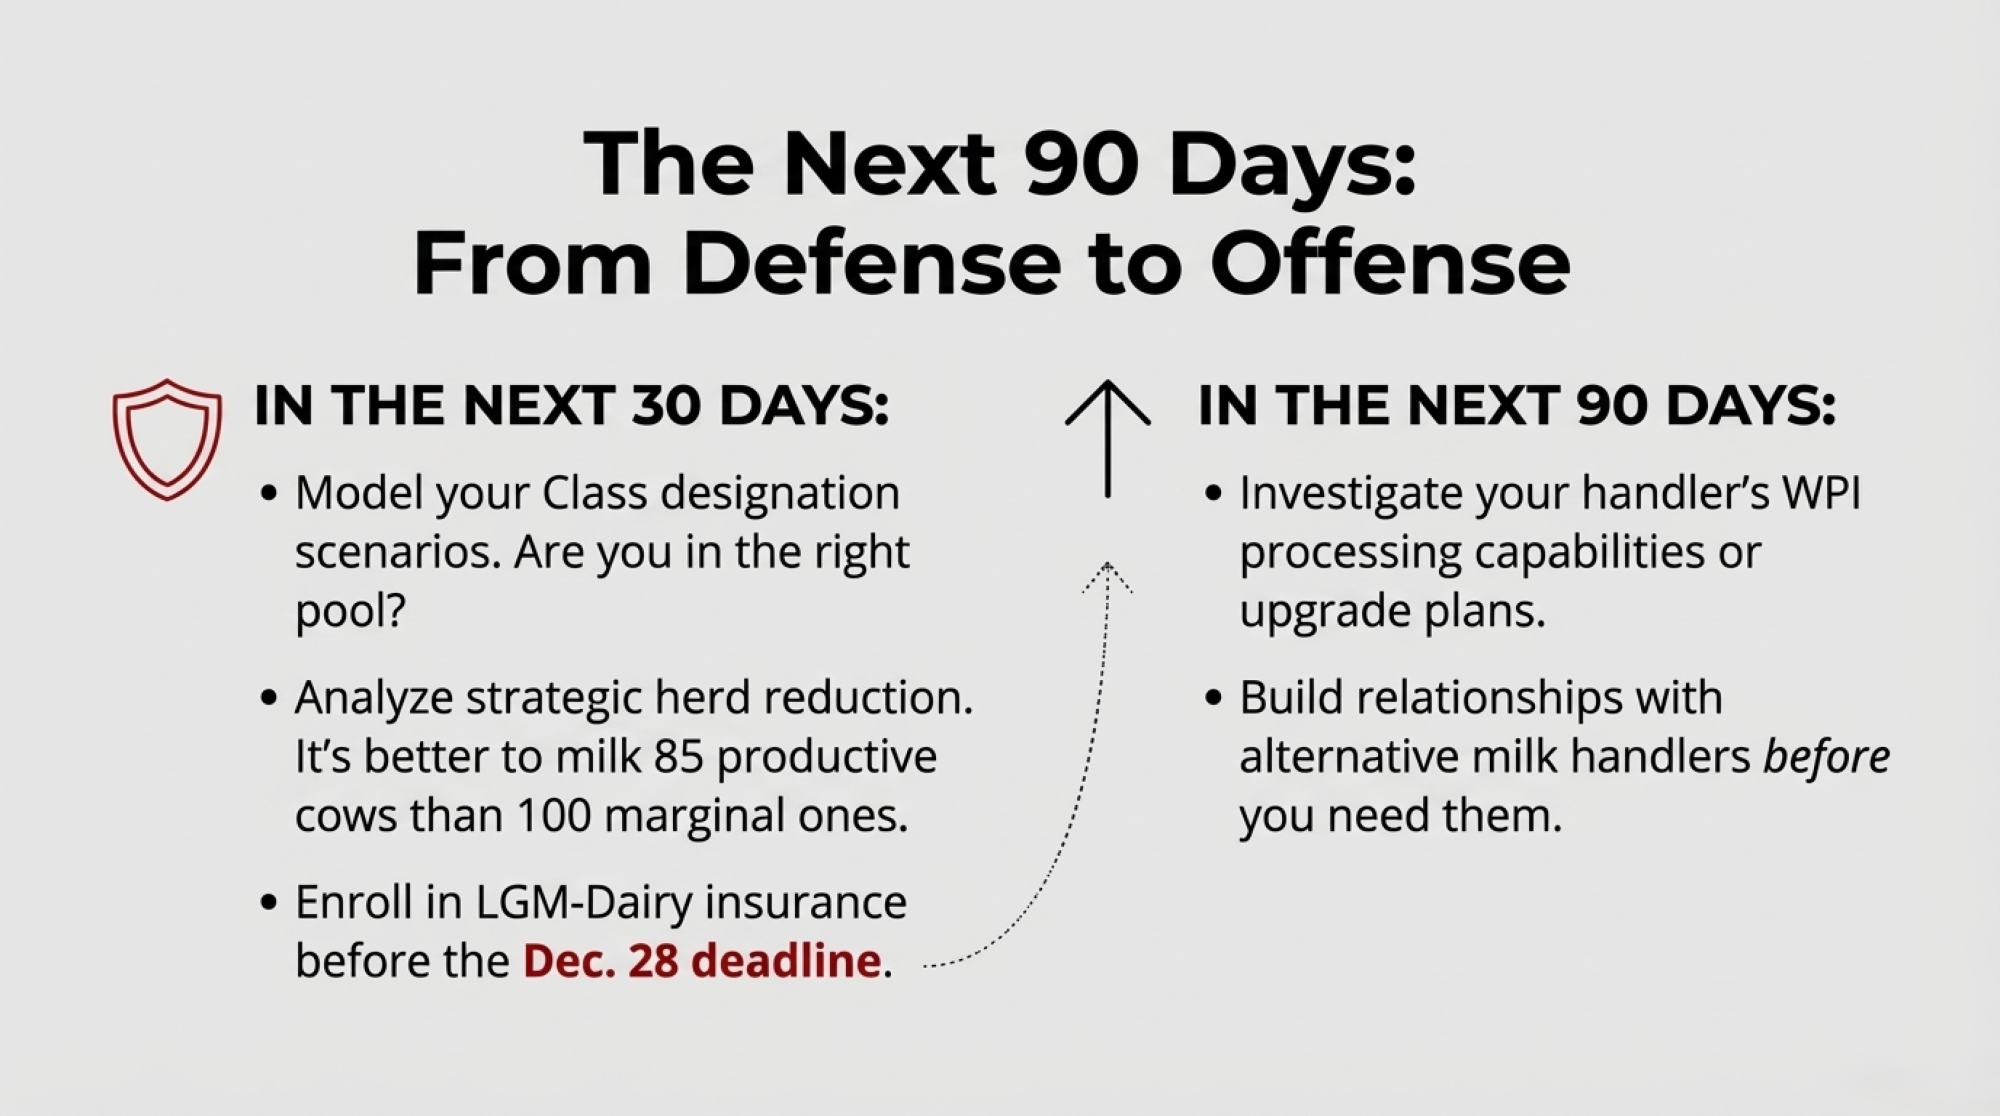
Next 30 days:
- Take a hard look at whether your current Class designation makes sense. The University of Wisconsin’s online tools can help you model different scenarios.
- Consider strategic herd reduction if cash flow projections show negative margins through Q2. Penn State’s extension templates are excellent for this analysis. As Iowa State Extension often teaches, it’s better to milk 85 productive cows than 100 marginal ones.
- LGM-Dairy insurance enrollment for Q1 2026 closes December 28. With premiums still below $0.70/cwt according to RMA data, it might be worth the protection.
Next 90 days:
- Investigate whether your milk handler has WPI processing or upgrade plans. The industry directories can tell you who’s investing in what.
- Build relationships with alternative handlers now, not when you’re desperate. As Cornell’s dairy program likes to say, the best time to negotiate is when you don’t have to.
- Document everything if you might claim financial hardship. Your cooperative will want to see cash flow statements, tax returns, and lender correspondence.
The Information-to-Action Challenge
What’s becoming crystal clear from this crisis is that success isn’t about having perfect information—it’s about acting on good-enough information before the window closes.
The $2,654 that disappears every two weeks through delay is real money with real consequences. For a 100-cow operation, that’s the difference between updating equipment and deferring maintenance, between keeping good employees and losing them, between staying current with your lender and starting those difficult conversations.
Cornell’s dairy crisis research—they’ve studied every major downturn since the 1980s—shows something interesting: the producers who survive aren’t necessarily the lowest-cost or highest-producing. They’re the ones who recognize reality quickly and adapt before they’re forced to.
That adaptation starts with understanding what’s actually possible. Not what you wish were possible, not what should be possible, but what your contracts, your finances, and your operation can actually execute.
The irony is that we have more information, better genetics, superior technology, and deeper market understanding than ever before. But as this crisis is proving, those advantages mean nothing if they don’t translate into timely decisions.
For most operations, the path forward isn’t about making perfect decisions—it’s about making intentional ones. The cost of waiting for certainty is becoming higher than the cost of acting with uncertainty.
As we head into what looks like a challenging 2026, remember this: The market doesn’t care about your analysis paralysis. It only responds to actual supply and demand. And right now, with production still growing while demand stagnates, that response is telling us something important.
The question isn’t whether to act anymore. It’s whether you’ll act in time to make a difference.
Market prices and data are current as of November 22, 2025. Individual situations vary significantly—consult with your advisory team before making major operational changes.
KEY TAKEAWAYS:
- This Week’s Must-Do: Request your cooperative contracts and calculate delay costs—you’re losing $2,654 every 14 days through inaction
- December Deadlines: Lock Q1 feed under $4.40/bushel and LGM-Dairy insurance below $0.70/cwt by December 28—premiums are climbing daily
- The $88,200 Reality: Class III-IV spread at $3.50/cwt means escape clauses in your contract could save you $300k+ over 5 years (70% success rate with proper documentation)
- Break the Paralysis: This isn’t 2009—more information is creating slower decisions. Trust your math, not the market consensus that isn’t coming
Learn More:
- Unlock the Blueprint: How Strategic Planning Transforms Dairy Farming Success – Provides a practical “ABCDE” framework for overcoming the decision paralysis described in the main article. It offers specific steps for assessing operational strengths and turning financial chaos into a structured recovery plan for 2025.
- Dairy Outlook December 2024: Navigating Price Shifts and Production Trends – Delivers the deep-dive market data behind the crisis, offering detailed Class III and Class IV price forecasts. This analysis helps producers validate the “cost of waiting” calculations with specific feed and milk price projections for the coming quarters.
- Robotic Milking Revolution: Why Modern Dairy Farms Are Choosing Automation in 2025 – Expands on the technology differentiator strategy, breaking down the exact ROI of automation. It details how farms are offsetting the labor crisis and achieving the $200-300 per cow savings mentioned in the main text through strategic equipment upgrades.
Complete references and supporting documentation are available upon request by contacting the editorial team at editor@thebullvine.com.
 The Sunday Read Dairy Professionals Don’t Skip.
 The Sunday Read Dairy Professionals Don’t Skip.
Every week, thousands of producers, breeders, and industry insiders open Bullvine Weekly for genetics insights, market shifts, and profit strategies they won’t find anywhere else. One email. Five minutes. Smarter decisions all week.