


If 20,000 clean tests can’t stop what’s coming in 60 days, what exactly are we measuring?
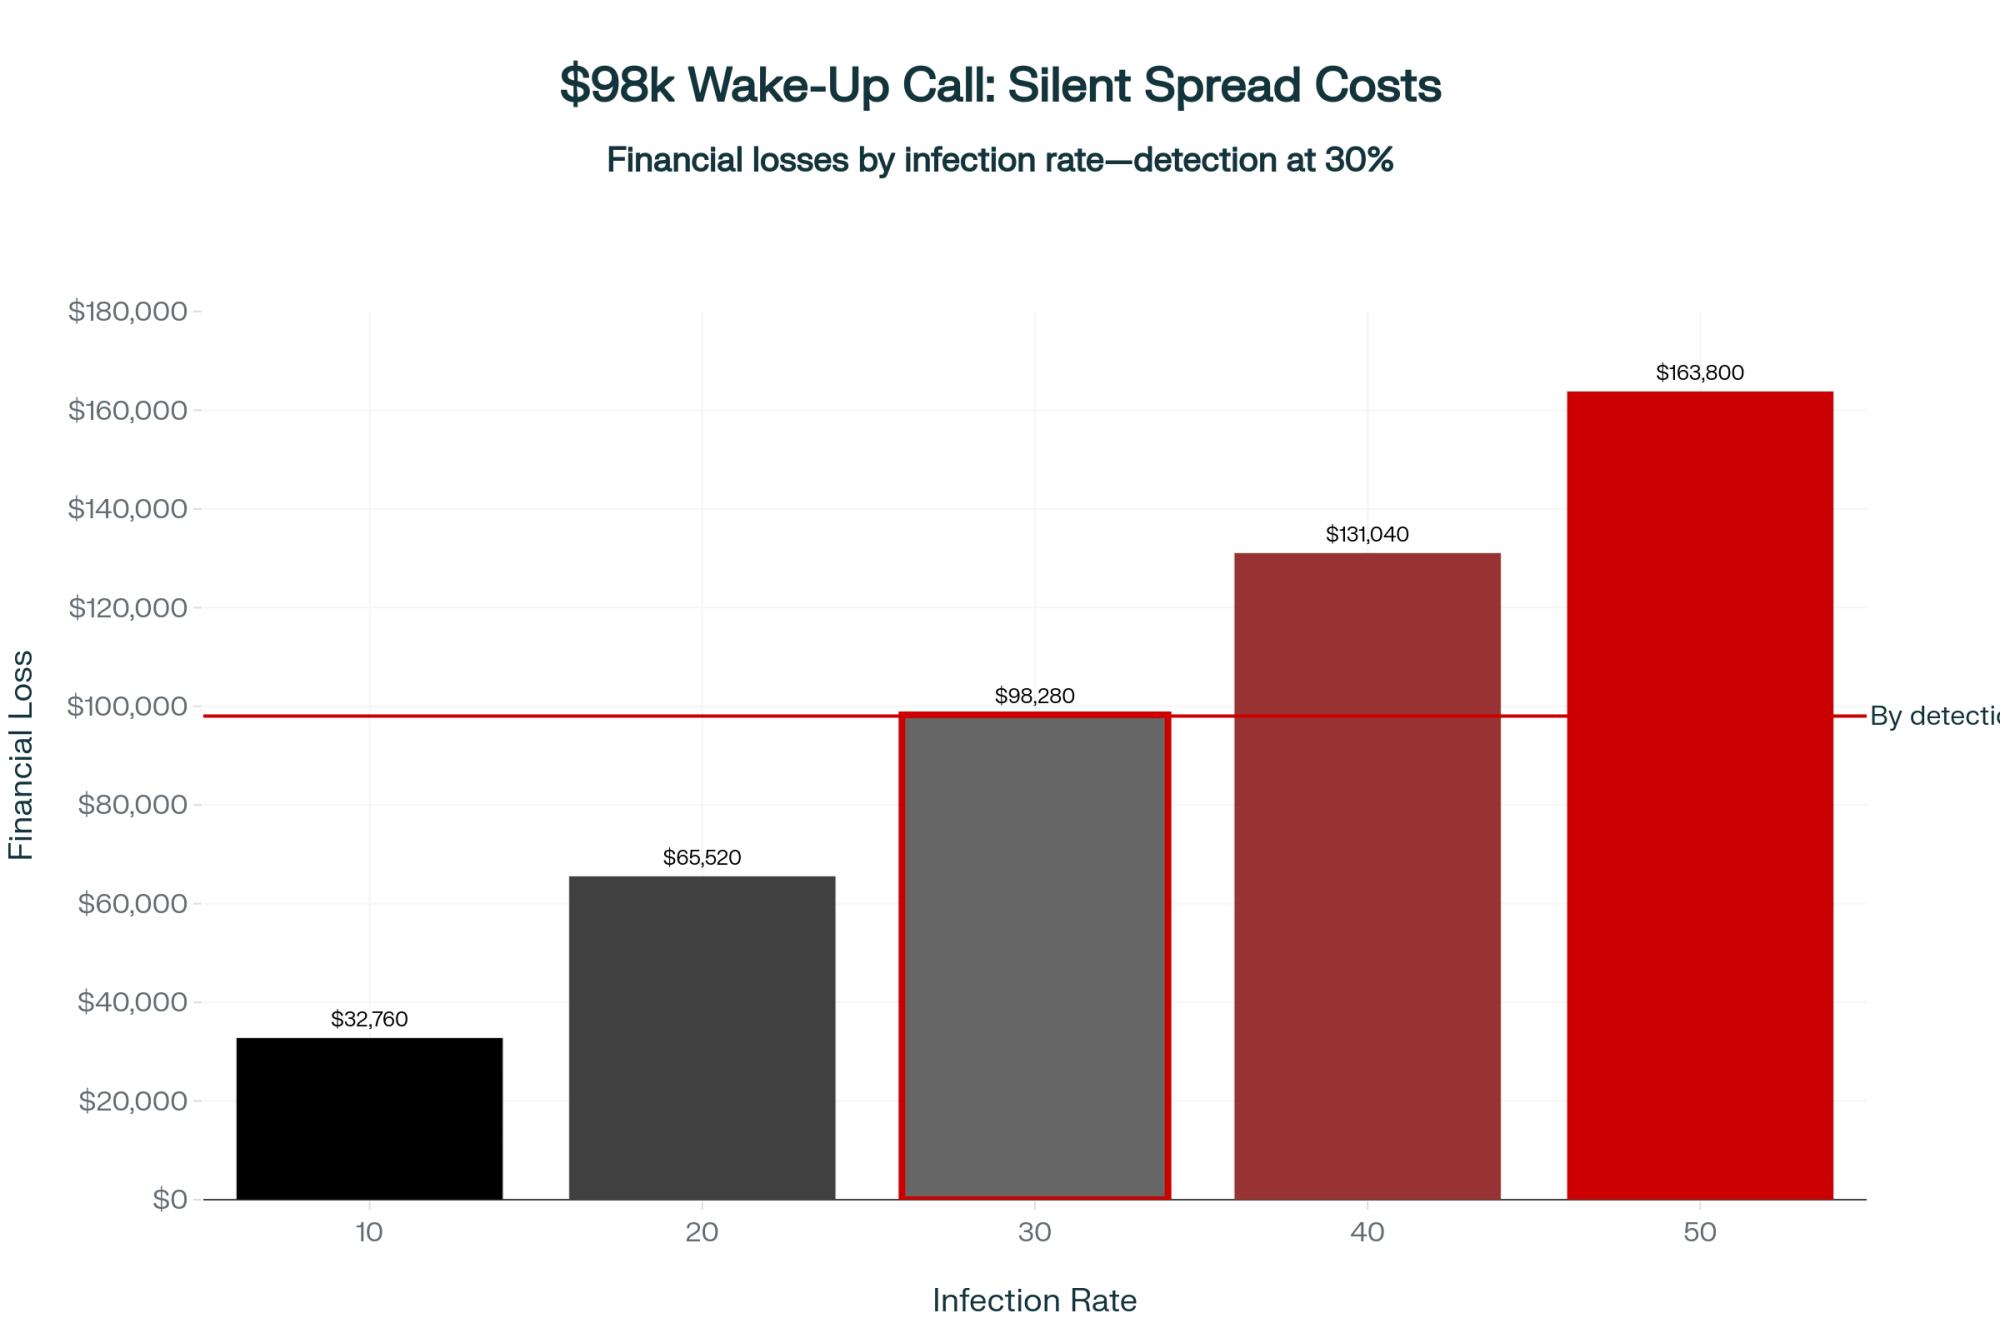
EXECUTIVE SUMMARY: What farmers are discovering through Wisconsin’s H5N1 situation is that negative bulk tank tests don’t mean what we think they mean—UC Davis documented California farms with 5-10% infection rates persisting up to three weeks before detection thresholds triggered, and with 3.5 million birds just depopulated at Jefferson County’s Daybreak Foods facility, that silent spread window becomes critically important. The financial stakes are sobering: Ohio State Extension calculates $504 per infected cow in direct losses, meaning a 30% infection rate in a 650-cow herd translates to $98,000 in immediate impact, not counting the long-term production losses Cornell’s pathology studies show from mammary tissue damage. Here’s what makes this particularly urgent: epidemiological models from Iowa State and the University of Minnesota suggest a 60-75% probability that several Jefferson County dairy operations already harbor undetected infections, with Wisconsin’s first confirmed dairy case likely occurring between December 2025 and January 2026. The encouraging news is that farms implementing three strategic preparations now—securing 90 days of operating capital, investing $800 in USDA Dairy Herd Status certification, and forming cooperative purchasing groups—position themselves to capture the $2-3/cwt premiums processors are offering for disease-free milk, worth $255,500 annually for a 500-cow operation. With Wisconsin’s strong cooperative traditions and emerging real-time monitoring technologies from UW-Madison, producers who act decisively in the next 60 days can navigate this challenge while maintaining operational control and market access.
You know, the disconnect between Wisconsin’s “Gold Status” and what’s actually happening 2.1 kilometers from this Palmyra dairy parlor tells you everything about our surveillance blind spots.
That’s what a third-generation producer shared with me last week. His question is resonating throughout Wisconsin’s dairy community: “If we’ve tested 20,000 milk samples with zero detections, why do I feel less secure now than I did six months ago?”
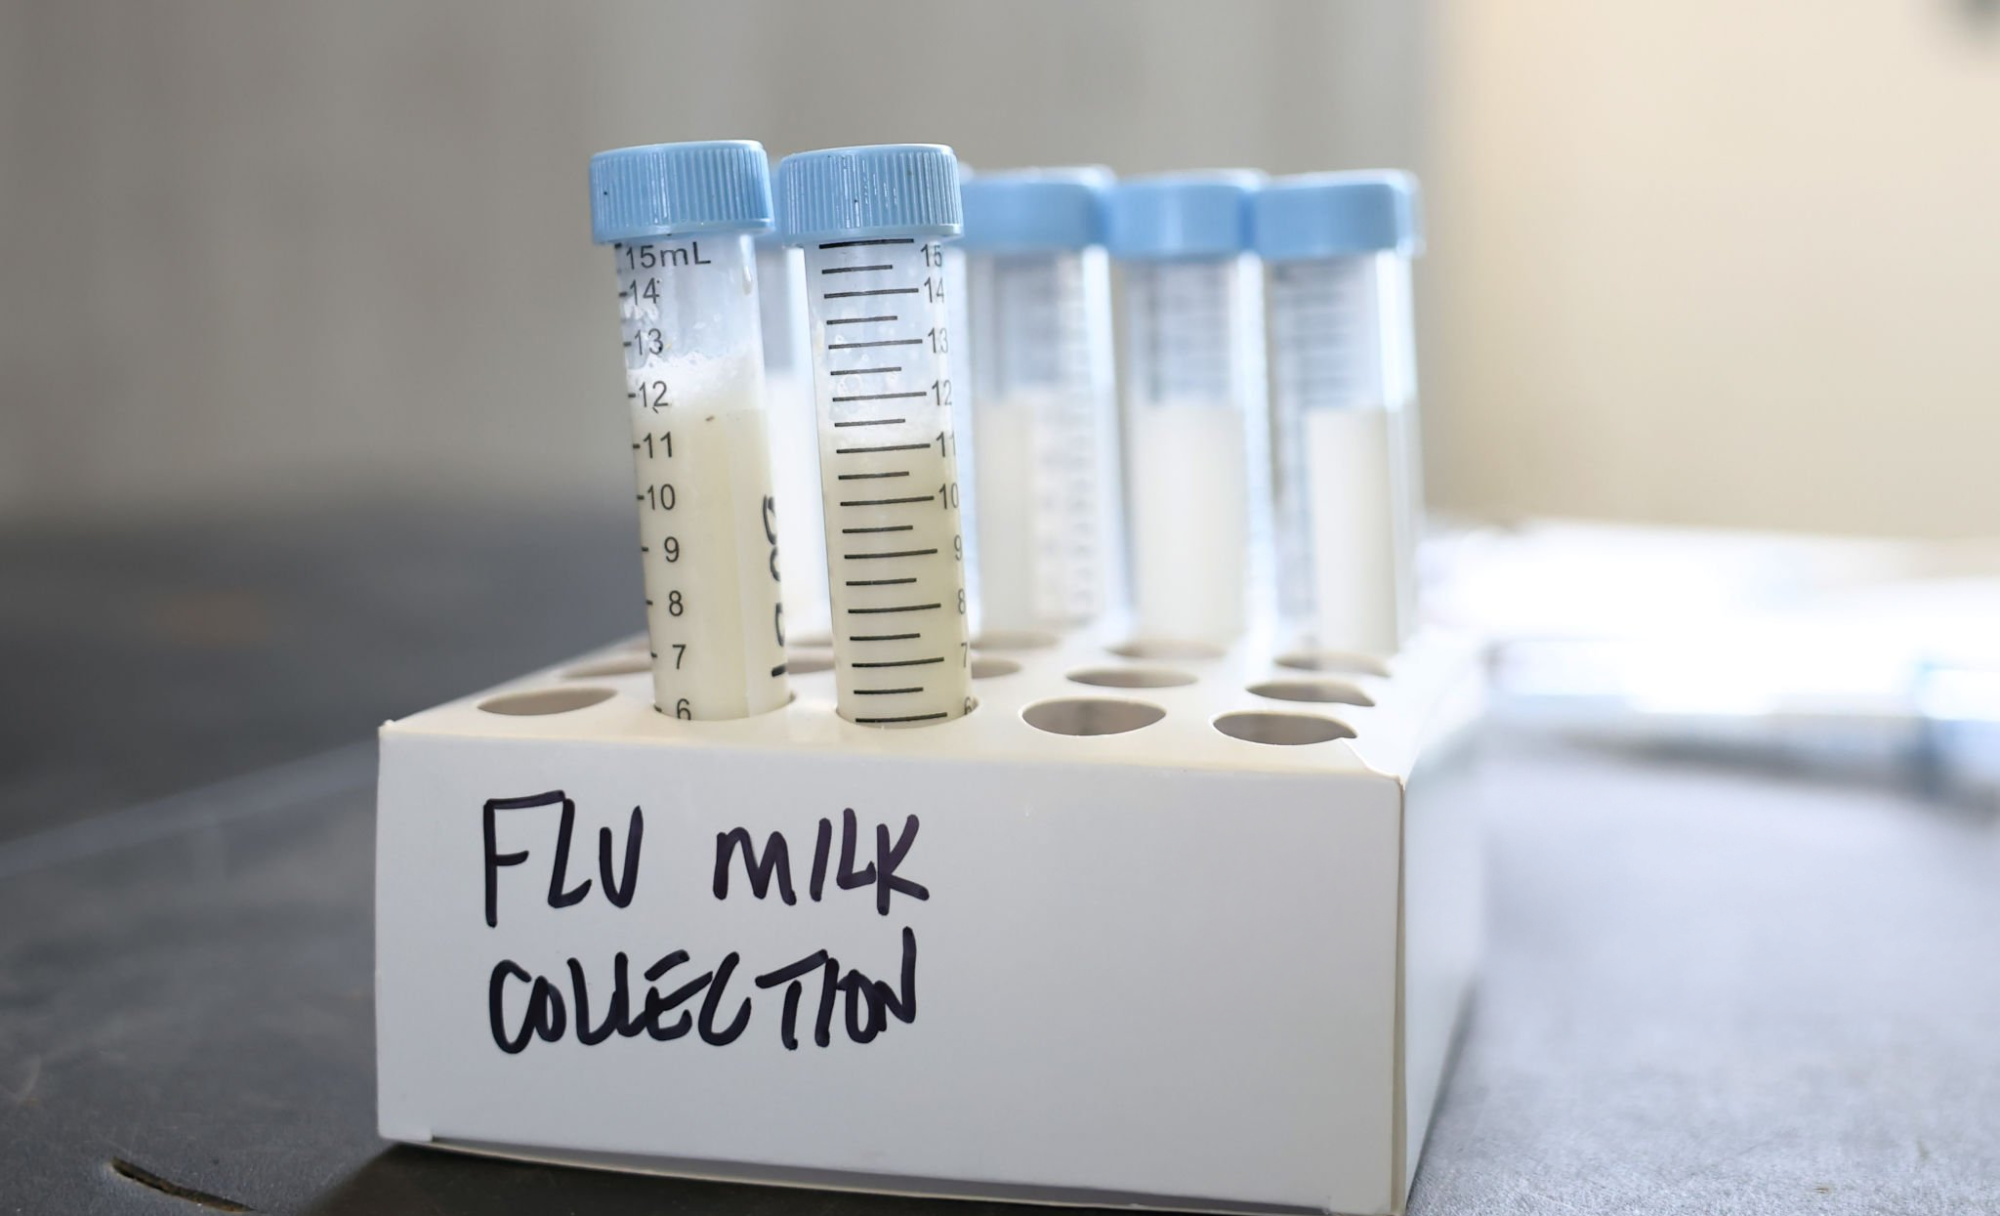
And here’s the thing—his concern makes perfect sense when you understand what’s unfolding at the Daybreak Foods facility just down the road. This September, according to Wisconsin DATCP’s reports, they depopulated 3.5 million laying hens. That’s their second major H5N1 outbreak since 2022. Same facility, same biosecurity protocols, but the implications for neighboring dairy operations? They’ve evolved considerably.
What’s interesting here is how our monthly bulk tank testing for Wisconsin dairy H5N1 surveillance might be capturing only part of the picture. We’re maintaining clean results statewide, sure. But insights from California’s recent dairy experience, combined with emerging environmental research on avian influenza dairy transmission, suggest there’s more to this story than those negative test results tell us.
Note: Some producer names and specific operational details have been modified to protect privacy while accurately representing industry perspectives.
Understanding Surveillance Limitations in Practical Terms

KEY DATA POINTS (check the summary boxes for quick reference):
- Detection threshold: 10,000 viral copies/mL
- Typical Wisconsin herd size: 387 cows
- Pre-detection infection window: 2-3 weeks
- Herd prevalence needed for detection: ~30%
Let’s talk about what that monthly bulk tank test actually tells you—and maybe more importantly, what it doesn’t.
The CDC and USDA surveillance methodology sets the detection threshold at approximately 10,000 viral copies per milliliter. That’s the level that triggers a positive result. To put that in perspective, it’s like trying to find a teaspoon of salt dissolved in a swimming pool—you need a certain concentration before your test picks it up. Now, if you’re milking around 387 cows—pretty typical for Wisconsin according to the 2022 Census of Agriculture—you’d need roughly one-third of your herd actively shedding high viral levels to reach that threshold.
This builds on what we’ve seen in California. Their Department of Food and Agriculture documented farms with 5-10% infection rates that persisted for two to three weeks before bulk tank concentrations triggered detection. The UC Davis response team’s analysis from September 2024 revealed something sobering: by the time monthly testing identifies a positive, the outbreak has typically been progressing for several weeks already.
Think about the practical implications here. Twenty cows in early-stage infection, each shedding below detection levels? Your bulk tank shows negative. Meanwhile, you might notice subtle production drops that seem attributable to weather changes or that new ration you’re trying. Research published in the Journal of Dairy Science last September demonstrates how the virus can spread through milking equipment during this subclinical phase, allowing for cow-to-cow transmission before anyone is aware of a problem.
Environmental Persistence: An Underappreciated Factor
One of the more sobering developments comes from Iowa State University’s research published in Environmental Science & Technology Letters. They documented H5N1 genetic material in groundwater wells during the 2015 poultry outbreak—and we’re not talking surface water here. Actual groundwater contamination. Three of the twenty wells tested positive for influenza markers.
This fundamentally changes how we need to think about environmental risk, particularly in Jefferson County’s context. Southeast Wisconsin’s Crawfish River watershed—you know, the area between Madison and Milwaukee—encompasses 178 square miles according to Wisconsin DNR watershed data. Daybreak’s Palmyra facility sits right within this drainage system. So when composting operations handle 3.5 million infected birds during October’s typical rainfall patterns… well, the runoff implications become pretty significant for any Wisconsin dairy H5N1 exposure zones.
I spoke with a producer near Johnson Creek who’s taken proactive measures. He’s invested about $3,000 in UV water treatment for his pond system. Not because anyone’s requiring it, but because that water eventually connects to the Crawfish River system. His reasoning was straightforward: preventive investment versus potential losses.
Ohio State Extension’s economic analysis from June suggests approximately $504 per infected cow in direct losses. For a 650-cow operation? Even 30% infection rates could mean $98,000 in immediate impact. And that doesn’t account for the long-term production losses that Cornell’s veterinary pathology studies have documented from mammary tissue damage.
Market Dynamics and Structural Changes
The industry consolidation we’ve witnessed—Wisconsin lost 39% of dairy farms between 2017 and 2022, according to the USDA’s Census of Agriculture—takes on new dimensions during disease events. Operations exceeding 2,500 cows increased from 714 to 834 nationally during this period, as the USDA Economic Research Service reported this February. It’s an ongoing structural shift that disease events seem to accelerate.
California’s experience really drives this home. When H5N1 affected 75% of their dairy herds last year, the shortage of EU export-eligible milk created significant market disruptions. And here’s what’s particularly relevant for Wisconsin producers dealing with potential avian influenza dairy transmission: it hit Class III and Class IV products the hardest—you know, the cheese and milk powder that dominate our export markets.
Several procurement managers at major cooperatives told me—speaking on condition of anonymity due to competitive considerations—they’re offering $2-3 per hundredweight premiums to farms with documented disease-free status. Do the math on that. For a 500-cow operation at current production levels? That’s over $255,000 in additional annual revenue.
The processor perspective makes sense when you think about it. European customers require guaranteed disease-free milk for export contracts, especially for those Class III cheese and Class IV powder products. Sourcing from verified operations becomes a market necessity, not a preference. This creates what’s essentially a two-tier system where quarantine zone farms—even ones that never test positive—lose access to premium markets.
What’s worth considering is how this affects different cooperative structures. Some co-ops are exploring risk-pooling arrangements to protect members. Others are moving toward individual farm accountability. Neither approach is inherently right or wrong—they’re different philosophies about collective versus individual risk management in our evolving dairy landscape.
Strategic Positioning Among Progressive Operations

FINANCIAL PREPAREDNESS CHECKLIST (see summary boxes throughout):
- Target: 90 days of operating expenses in accessible capital
- Typical mid-size need: $135,000
- Credit line setup: Complete before crisis
- Documentation investment: $800-$1,500
- Potential annual return: $12,000-$18,000
Looking at farms that successfully navigated California’s outbreak, there’s a consistent preparation pattern worth considering.
A producer near Fort Atkinson recently restructured her operating line—not from immediate need, but for contingency planning. With about 420 cows, she negotiated $150,000 in available credit through her regional bank. As she explained it: “Having accessible capital that sits unused costs virtually nothing. Needing it during a quarantine when approval becomes difficult? That could mean the difference between weathering the crisis and forced liquidation.”
Agricultural economists at UW-Madison’s Center for Dairy Profitability suggest maintaining 90 days of operating expenses in accessible capital. For mid-sized operations, that typically means around $135,000 based on monthly costs averaging $45,000 for feed, labor, utilities, and debt service.
Documentation is equally important. Several producers have enrolled in USDA APHIS’s Dairy Herd Status Program. The investment—about $800 in veterinary documentation time, according to participating veterinarians—provides official disease-free certification. Given the current Class III differentials reported by USDA Agricultural Marketing Service, this certification could generate $12,000-$18,000 annually in premium access if processors implement tiered pricing based on disease status. Not a bad return on $800, if you ask me.
Beyond the certification, you know, there’s also federal disaster assistance to consider. USDA’s Emergency Assistance for Livestock program can provide some support, though it typically covers only partial losses, and payments can lag 60-90 days behind the actual crisis.
Projected Timeline Based on Current Conditions

CRITICAL TIMELINE:
- Current status: Environmental contamination is active
- Probability of undetected infections: 60-75% (based on current modeling)
- First detection window: December 2025 – January 2026
- Preparation window remaining: 60-90 days
Epidemiologists at the University of Minnesota’s Center for Infectious Disease Research and Policy have modeled probable scenarios based on current viral pressure and migration patterns. Their October report makes for interesting reading.
As of right now, October 2025, Jefferson County faces significant environmental contamination from the Daybreak depopulation. USGS bird banding data confirms fall migration is bringing infected waterfowl through the Mississippi Flyway. Wisconsin’s temperatures are entering that 5-15°C range where USDA Agricultural Research Service studies show optimal viral survival.
Now, while the data is still developing, epidemiological models from Iowa State’s veterinary diagnostic lab suggest—based on current modeling parameters—a 60-75% probability that 3-8 Jefferson County dairy operations may already harbor low-level infections below bulk tank detection thresholds for Wisconsin dairy H5N1. These wouldn’t appear in surveillance until herd prevalence exceeds 20%.
Wisconsin’s Veterinary Diagnostic Laboratory director, along with other regional experts, estimates a 70-80% probability of the state’s first confirmed dairy detection occurring between December 2025 and January 2026. This timing reflects when October-November infections would reach detectable levels, not when initial infections occur.
Spring 2026 migration patterns will likely accelerate geographic spread. UC Davis researchers documented similar patterns in California, with 15-25% of operations in affected regions experiencing infection over 18 months. UW-Madison’s Center for Dairy Profitability models suggest this could affect 300-500 Wisconsin farms, though it’s important to note these are projections based on current understanding.
Regional Variations and Operational Considerations
Wisconsin’s seasonal patterns create unique risk profiles compared to California’s stable year-round conditions. UW-Madison School of Veterinary Medicine research demonstrates viral survival exceeding one month at 4°C. Freezing reduces aerosol transmission, sure, but spring thaw then releases accumulated viral loads precisely when your fresh cows face peak immunological stress during transition periods.
Regional differences matter considerably. Marathon and Clark counties? Lower livestock density but proximity to Mississippi Flyway staging areas. Green County’s cheese production focus and cooperative structure may provide enhanced collective biosecurity resources. Each region needs tailored approaches.
A producer near Marshfield shared an observation that really captures this challenge: “We’re more geographically isolated, but the Mead Wildlife Area brings thousands of migrating waterfowl through each spring. Last year, I counted over 300 geese on my heifer pasture pond in a single morning. Traditional biosecurity can’t address that exposure.”
This highlights something we don’t discuss enough—how wildlife management and dairy production increasingly intersect. Some operations are exploring habitat modification to reduce waterfowl attraction. Others are investing in covered water systems. There’s no perfect solution, but understanding your specific risk factors helps prioritize investments.
I remember talking with a nutritionist who shared how one farm successfully navigated a previous disease challenge—not H5N1, but Johne’s disease—by implementing similar preparedness strategies. They maintained financial reserves, documented their protocols meticulously, and when neighboring farms struggled, they were able to expand through strategic acquisition. The parallels are worth considering.
Scale-Appropriate Response Strategies
INVESTMENT RANGES BY FARM SIZE (reference these summary boxes for your operation):
Small Operations (<200 cows):
- Covered feed storage: $2,000-$5,000
- Water chlorination: $500-$1,000/month
- Group purchasing savings: 20-30%
Mid-Size Operations (200-500 cows):
- Shared UV systems: $6,000/farm (5-way split)
- Cooperative vet services: 15-25% discount
- Total biosecurity budget: $15,000-$30,000
Large Operations (500+ cows):
- Comprehensive biosecurity: $150,000-$200,000
- ROI timeline: 18-24 months through premium preservation
- Acquisition positioning advantage: Significant
Let’s be honest about scale here. Smaller operations under 200 cows face challenging economics. With typical gross revenues of around $1.2 million annually, is it investing $150,000 in comprehensive biosecurity infrastructure? That’s just not feasible given current margins.
But targeted investments can provide meaningful protection. Midwest Plan Service estimates suggest $2,000-$5,000 for covered feed storage to prevent bird contamination. UW Extension research indicates that chlorinating water sources during high-risk periods costs between $500 and $1,000 per month. And you know what’s working well? Several smaller farms are forming purchasing groups to achieve volume discounts on sanitizers and supplies. That’s practical cost management.
Mid-size operations—200-500 cows—they’re in a tough spot. Too large for minimal measures but often lacking capital for major upgrades. A group near Watertown developed an innovative solution, though. Five neighboring farms formed a purchasing cooperative, negotiating bulk pricing on sanitizers, group veterinary consulting rates, and they’re sharing a UV water treatment system that rotates between farms during high-risk periods. Makes $30,000 investments feasible when split five ways.
Larger operations face different calculations entirely. Penn State Extension’s August analysis suggests $150,000-$200,000 biosecurity investments may pay for themselves through premium preservation alone. Several large operators have acknowledged—and this deserves honest discussion without judgment—they’re also considering acquisition opportunities that may arise if smaller neighbors face financial stress. It’s a reality of modern agricultural consolidation.
Community Resilience Through Collective Action
What’s encouraging is the Jefferson County Dairy Producers Association’s new rapid communication network for sharing surveillance results and resources. As President Mike Kemper notes, “Disease doesn’t recognize property boundaries. We can compete in the marketplace while still protecting our collective interests.”
Their bulk purchasing through United Cooperative, coordinated veterinary services with regional practices, and exploration of shared mobile UV treatment units demonstrate practical cooperation. Think about it—a $30,000 mobile unit split among ten farms means $3,000 per operation versus $15,000 for individual units that would sit idle most of the time.
This aligns with documented outcomes from other regions. California Farm Bureau Federation data from September shows 18% consolidation in the competitive Central Valley post-outbreak. Pennsylvania Department of Agriculture reports only 6% consolidation in Lancaster County, despite similar infection rates—likely reflecting stronger cooperative traditions.
The psychological toll deserves acknowledgment as well. Rural mental health professionals working with UW Extension report that monthly surveillance creates ongoing stress. Producers describe heightened vigilance, sometimes seeing symptoms that aren’t present, and losing sleep over factors beyond their control. And you know what? Seeking support during challenging times reflects strength, not weakness.
Insurance and Risk Management Considerations
You know, something that’s emerged from California’s experience—and hasn’t received enough attention—is how disease outbreaks affect insurance coverage. Most standard farm policies exclude losses from government-ordered depopulation or movement restrictions. Some carriers are developing specialized disease coverage, but premiums reflect the risk level.
You really should review your policies now, understanding exactly what is and isn’t covered. Some folks are finding that business interruption insurance may provide partial coverage if properly structured. Others are exploring captive insurance arrangements where groups of farms create their own risk pool. These aren’t simple decisions, but understanding your options before a crisis hits is crucial. That’s crucial.
And don’t forget about USDA’s Emergency Assistance for Livestock program. While it won’t cover everything, it can provide a financial cushion during the worst of it. The key is having all your documentation ready before you need it.
Looking Forward: Emerging Research and Resources
What’s encouraging is the emerging research developments. The University of Wisconsin is launching a real-time environmental monitoring network specifically for agricultural watersheds, with Jefferson County among the pilot sites. This could provide early warning capabilities we currently lack.
Additionally, new rapid on-farm testing technologies are in the final stages of validation. These could allow individual cow testing at costs approaching bulk tank sampling, potentially closing the detection gap we currently face. While not yet commercially available, stay informed about these developments through your veterinary channels.
And here’s what’s also promising: the growing recognition that Wisconsin’s strong cooperative traditions position us better than most regions to navigate these challenges. The combination of shared resources, collective purchasing power, and information networks creates resilience that purely competitive markets can’t match.
The Bottom Line
Wisconsin’s window for strategic positioning is closing. The choice is clear: act on the 60-90 day timeline driven by epidemiological data and California’s documented experience, or react to the market’s timeline when the first positive bulk tank is confirmed in a Jefferson County dairy outbreak.
Your biosecurity overhaul starts with three immediate steps: secure 90 days of operating capital, invest $800 in USDA Dairy Herd Status certification, and join or form a local purchasing cooperative to reduce biosecurity costs by 20-30%. The data shows Wisconsin’s strong cooperative traditions position us better than most regions—but only if we use that advantage decisively in the next 60 days.
Use the resources below to start your plan today.
For biosecurity guidance and USDA Dairy Herd Status Program enrollment, contact your herd veterinarian or visit aphis.usda.gov. Wisconsin DATCP provides current H5N1 updates at datcp.wi.gov. Mental health support for Wisconsin farmers is available through the Farm Center hotline at 1-800-942-2474.
KEY TAKEAWAYS
- Financial preparedness beats perfect biosecurity: Secure 90 days operating capital (approximately $135,000 for mid-size operations) before crisis limits your options—Wisconsin agricultural lenders confirm accessible credit makes the difference between weathering disruption and forced liquidation at 60-70% valuations.
- The $800 investment that returns $12,000-$18,000: USDA’s Dairy Herd Status certification provides official disease-free documentation that processors increasingly require for Class III and IV export premiums. One day of veterinary paperwork creates market differentiation when EU contracts require guaranteed clean milk.
- Scale-smart biosecurity saves 20-30% through cooperation. Small farms, which cover feed storage ($2,000-$5,000) and chlorinate water ($500-$1,000/month), see meaningful protection. In contrast, five-farm cooperatives sharing a $30,000 UV system reduce individual costs to $6,000. Jefferson County producers are already proving this model works.
- Your location matters more than your size: A 200-cow dairy within 5 kilometers of composting poultry faces a higher risk than a 1,000-cow operation in isolation—map your actual exposure using watershed data and prevailing winds, not arbitrary regulatory boundaries that the virus doesn’t recognize.
- The 60-day window determines your position: Based on California’s documented 18% consolidation rate and current epidemiological modeling, Wisconsin producers acting before December’s probable first detection maintain strategic options, while those reacting after face whatever terms the market dictates—the difference between consolidator and consolidated.
Complete references and supporting documentation are available upon request by contacting the editorial team at editor@thebullvine.com.
Learn More:
- HPAI H5N1: The 2025 Science-Based Dairy Farm Survival Guide (Because Hope Isn’t a Biosecurity Plan) – This essential guide reveals the tactical, day-to-day PPE protocols (N95s, goggles, deep boot baths) and critical auditing steps required to protect your farm. Learn exactly how to enroll in the Herd Status Program and handle symptomatic cows to maximize your risk mitigation efforts.
- Dairy Profit Squeeze 2025: Why Your Margins Are About to Collapse (And What to Do About It) – Go beyond H5N1 to understand the broader economic forces crushing IOFC margins below
and the structural impact of trade tariffs on Class III/IV exports. This article provides the critical market context needed to strategically position your farm against a perfect storm of collapsing prices and surging costs.
- New Testing Strategies for Dairy Calves Can Reduce Johne’s Disease by 30% – Explore how advanced diagnostic technologies like Fecal PCR and Phage-Based Tests are closing the “detection gap” for another chronic disease. This piece demonstrates the economic necessity of moving beyond bulk tank surveillance, providing cost/accuracy comparisons of the innovative testing needed to maintain herd health and boost profitability.
 Join the Revolution!
 Join the Revolution!
Join over 30,000 successful dairy professionals who rely on Bullvine Weekly for their competitive edge. Delivered directly to your inbox each week, our exclusive industry insights help you make smarter decisions while saving precious hours every week. Never miss critical updates on milk production trends, breakthrough technologies, and profit-boosting strategies that top producers are already implementing. Subscribe now to transform your dairy operation’s efficiency and profitability—your future success is just one click away.


