


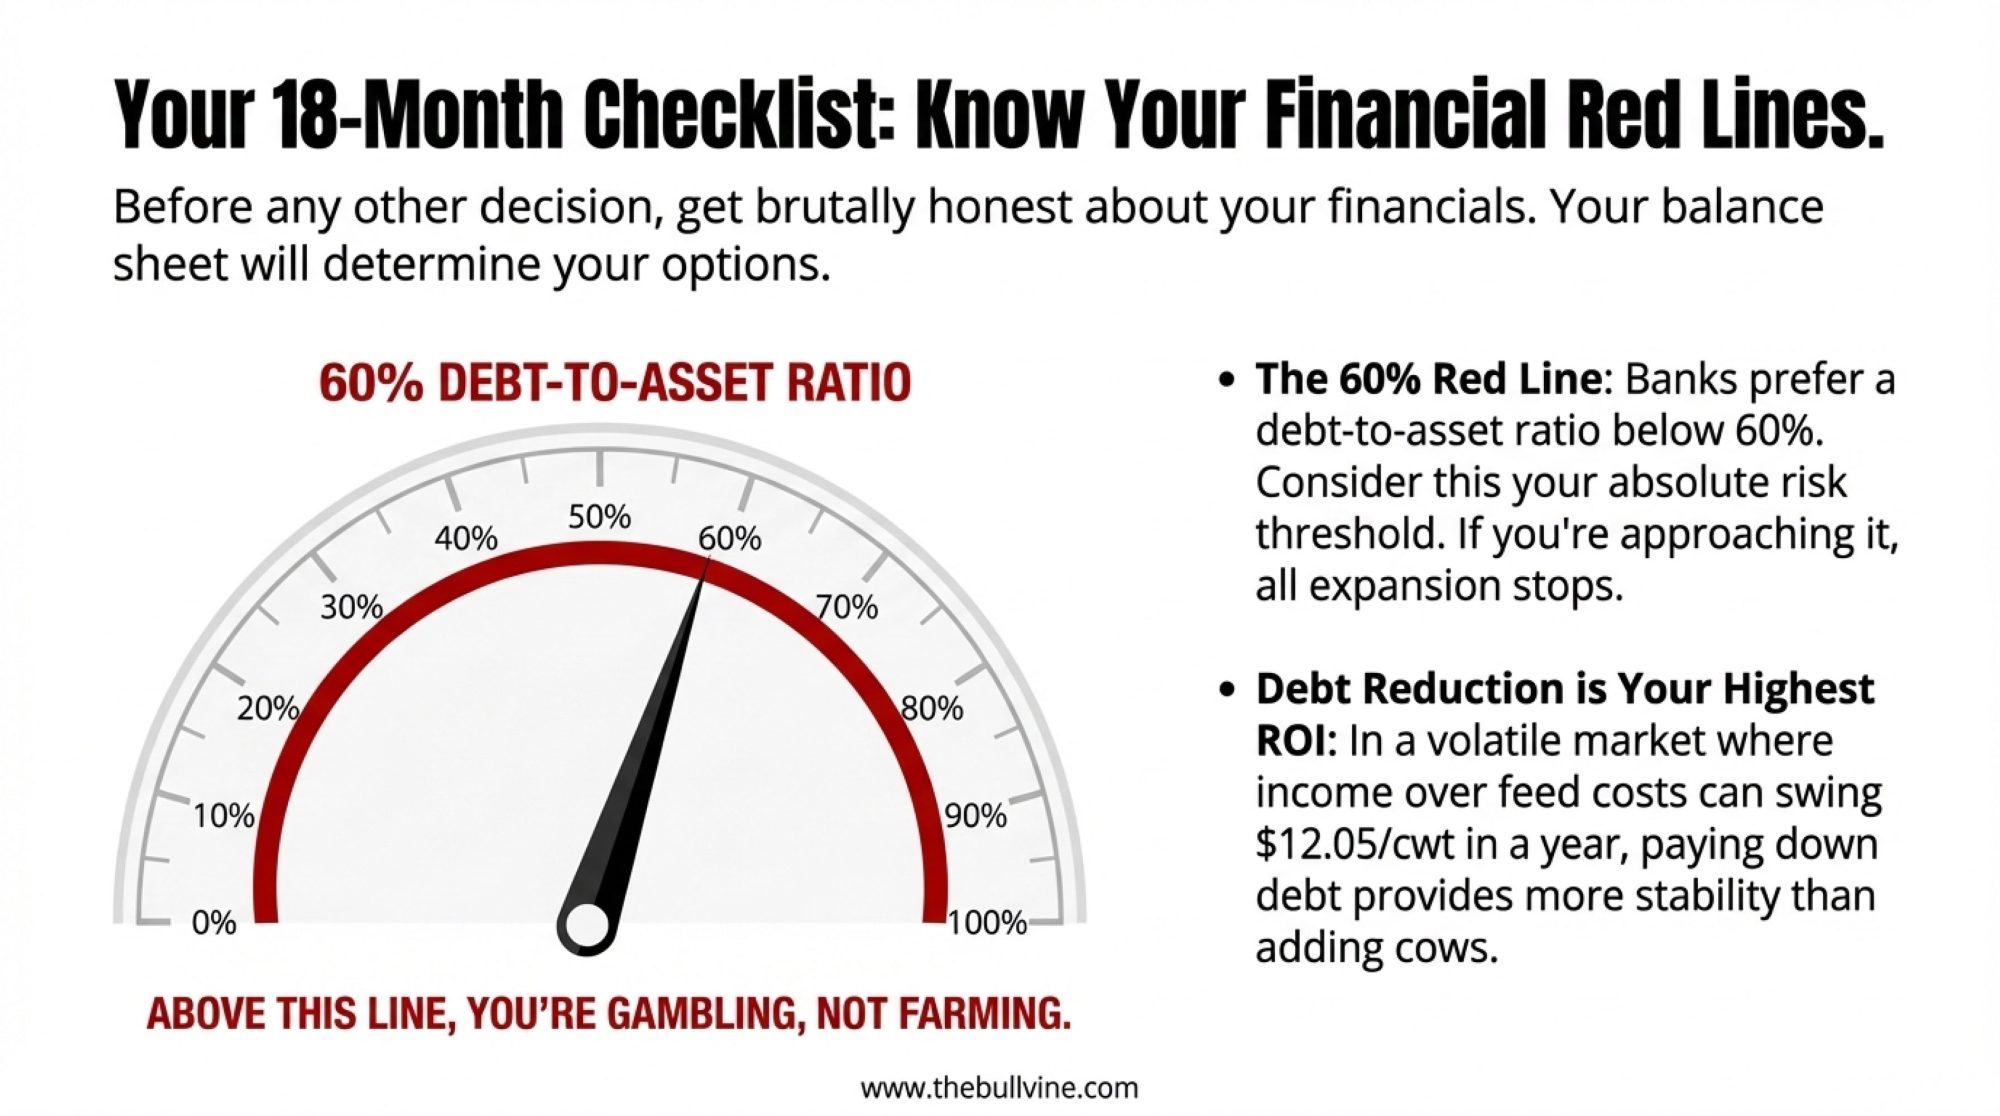
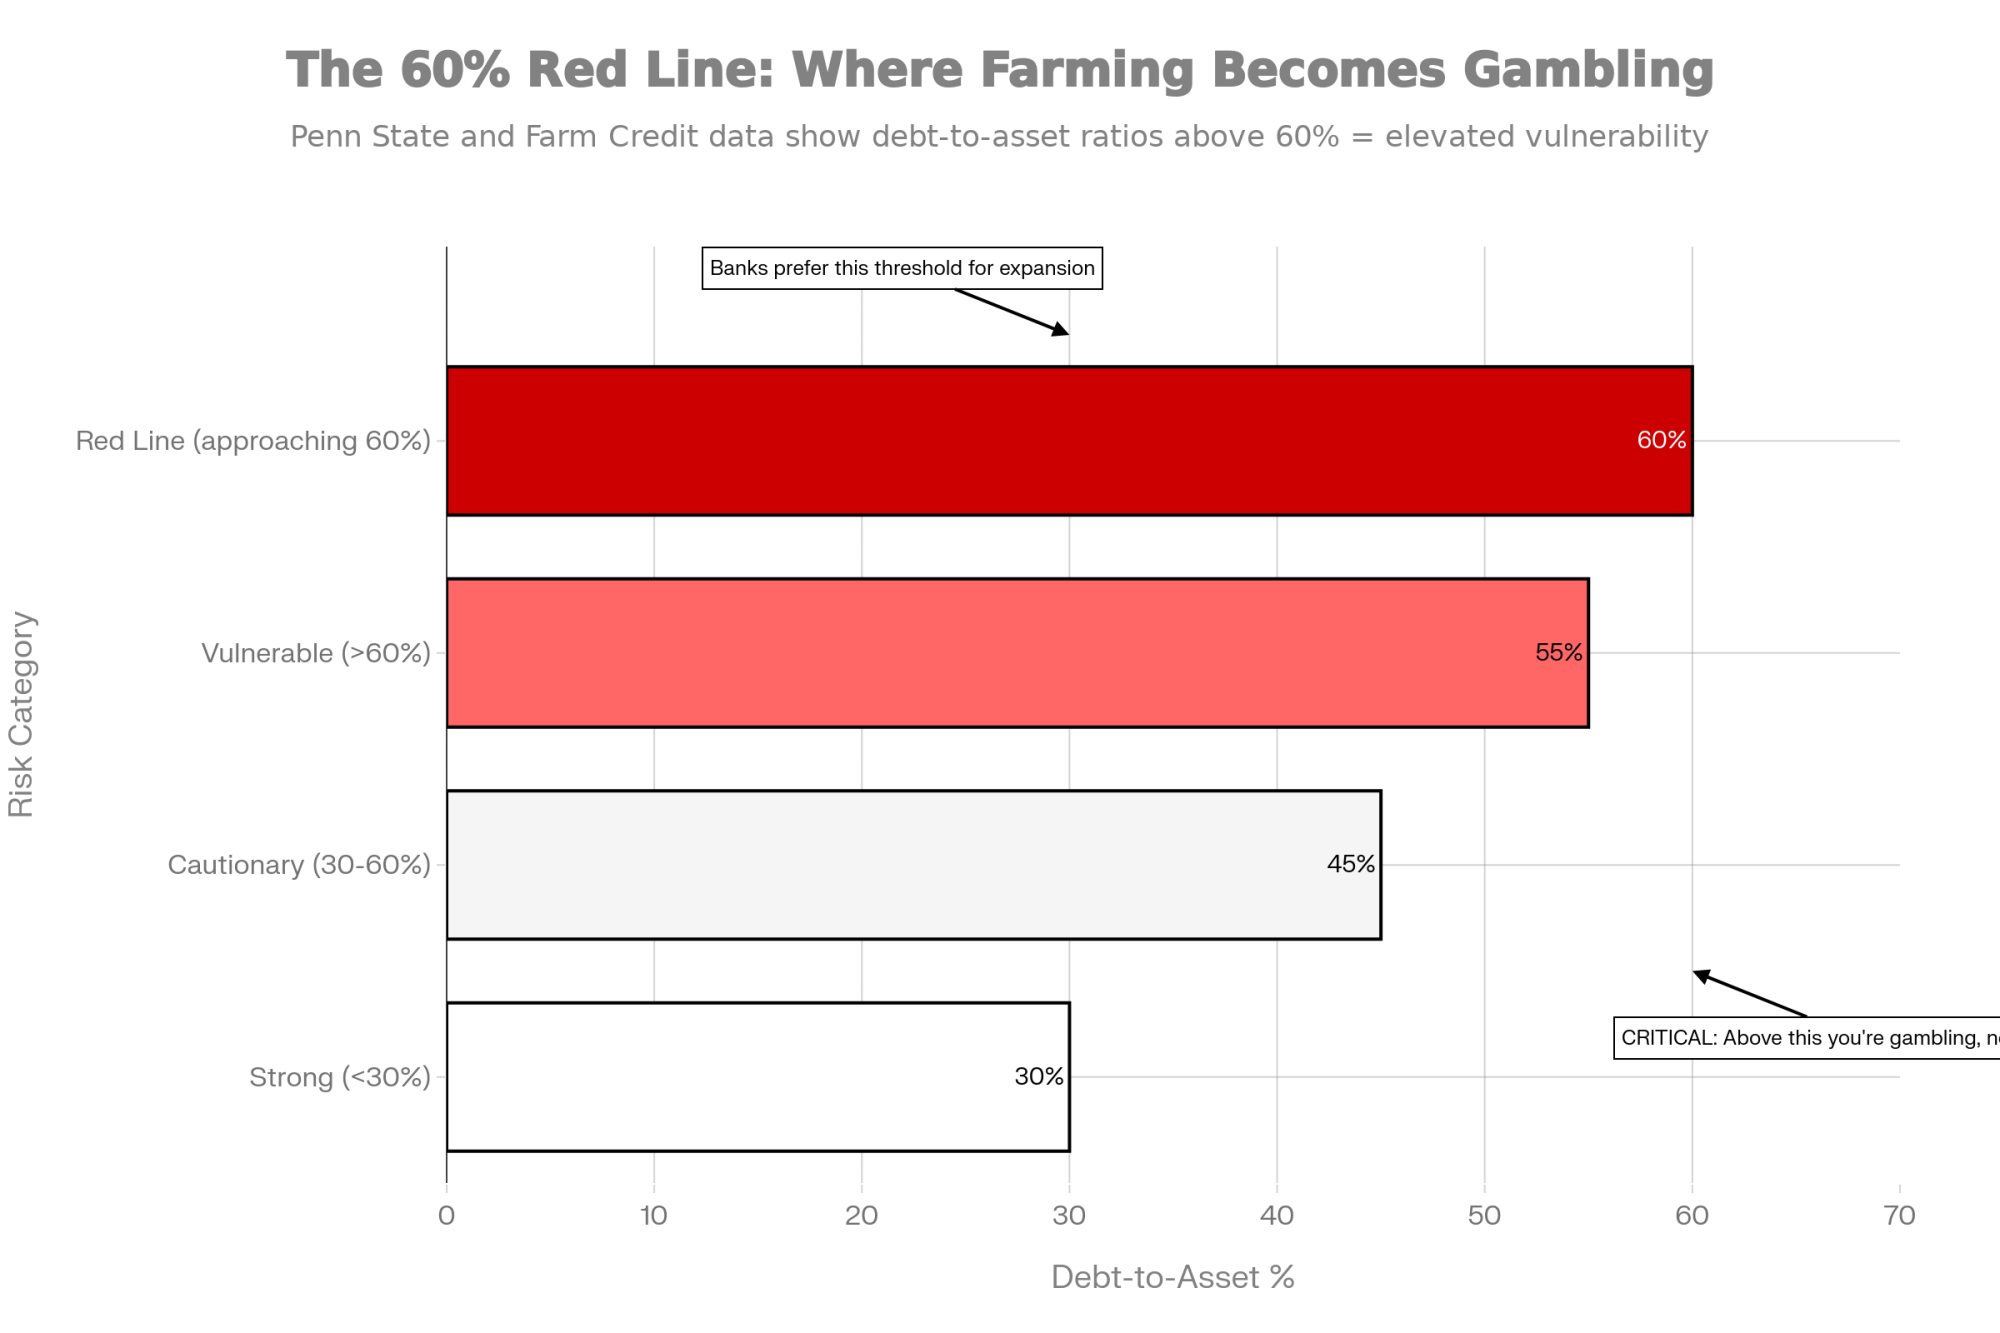
60% debt-to-asset. That’s the red line. Above it, you’re gambling. Below it, you might survive 2026.
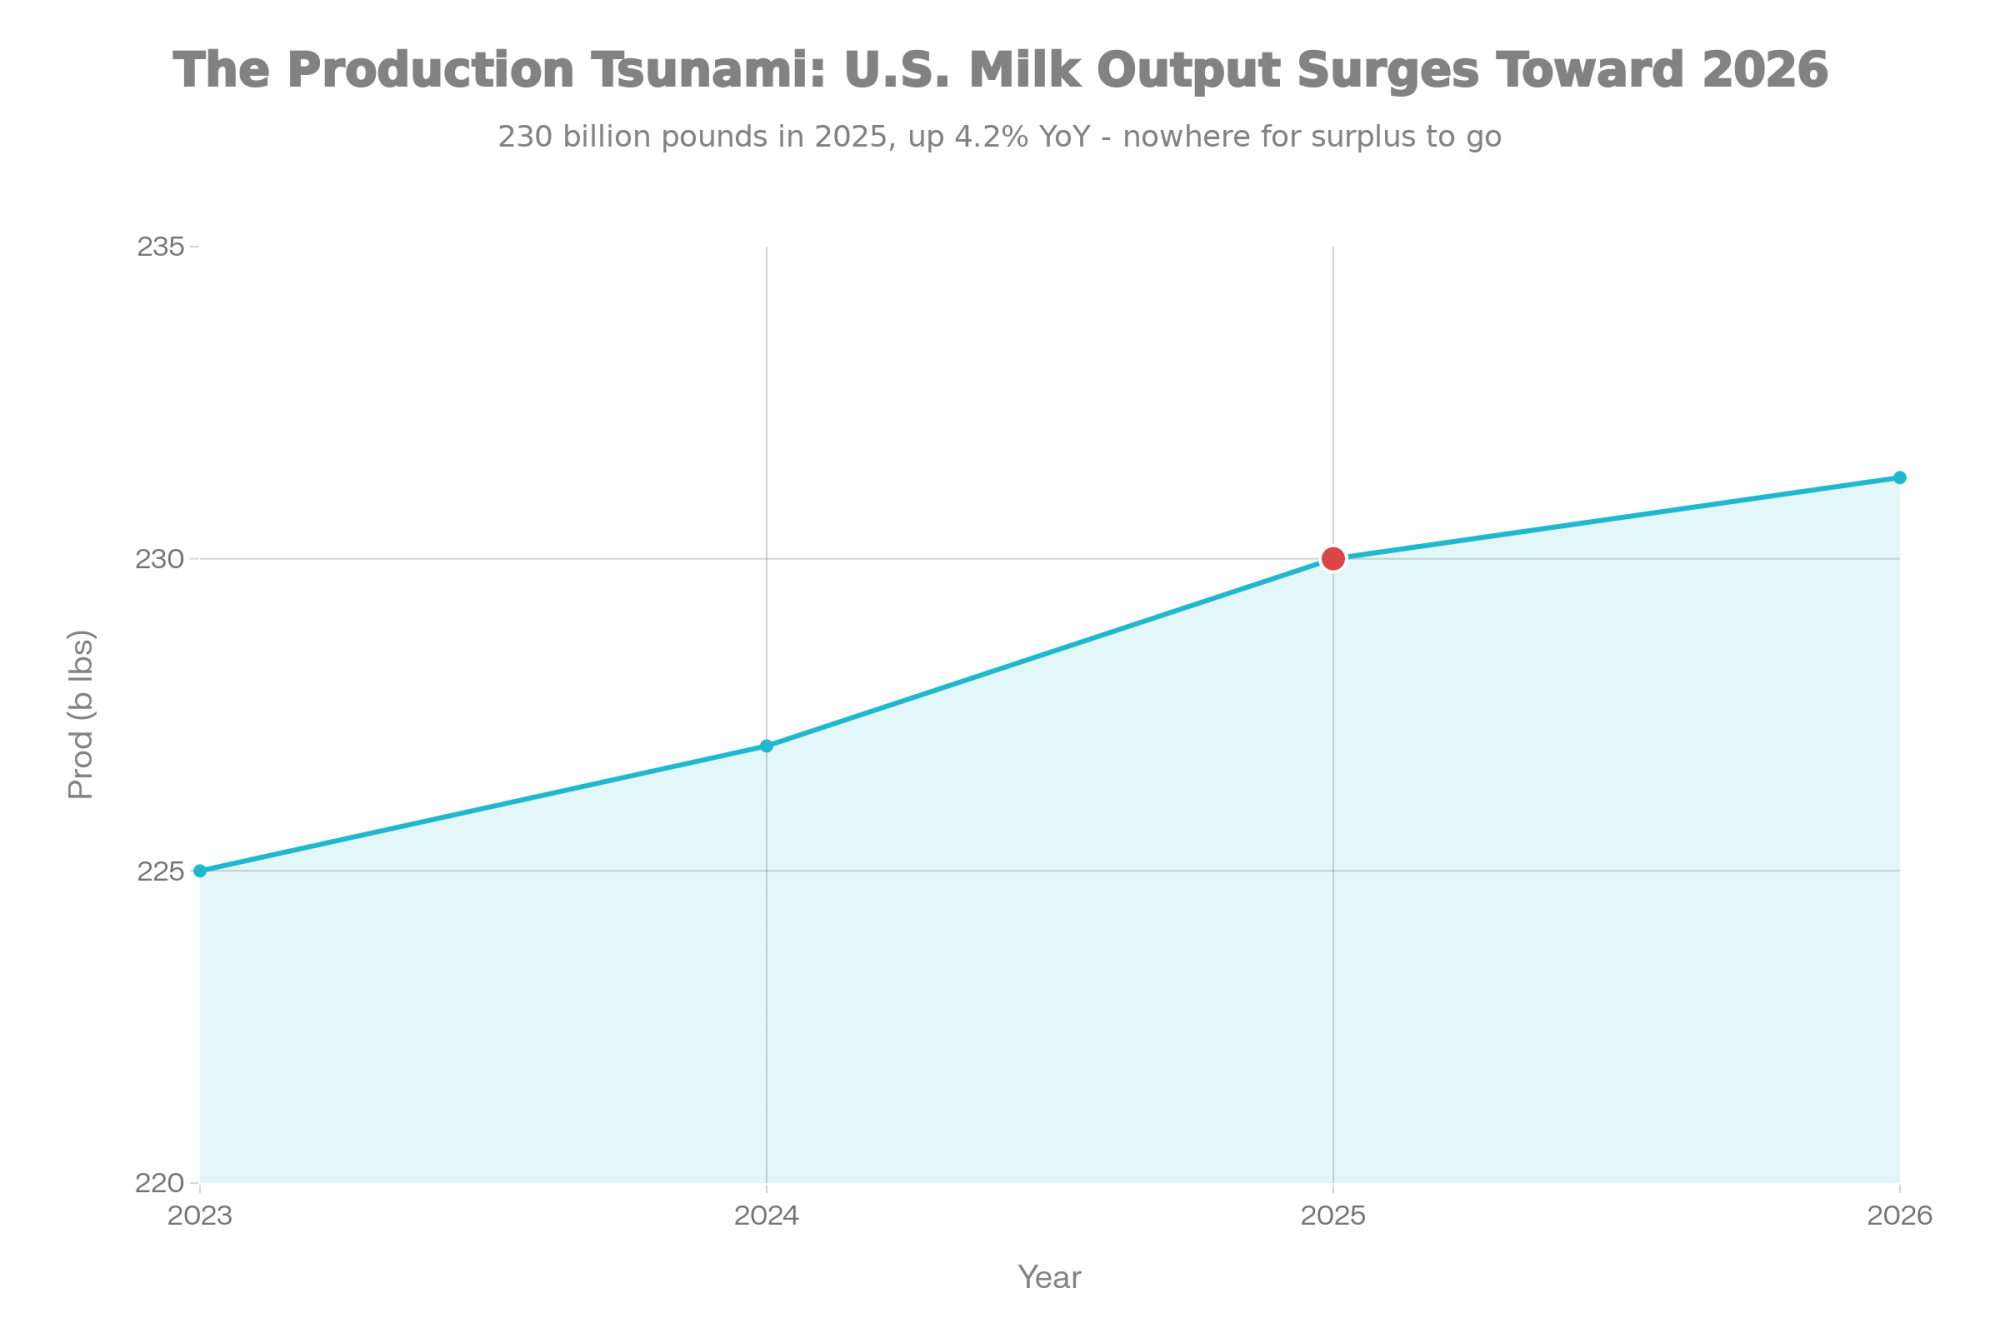
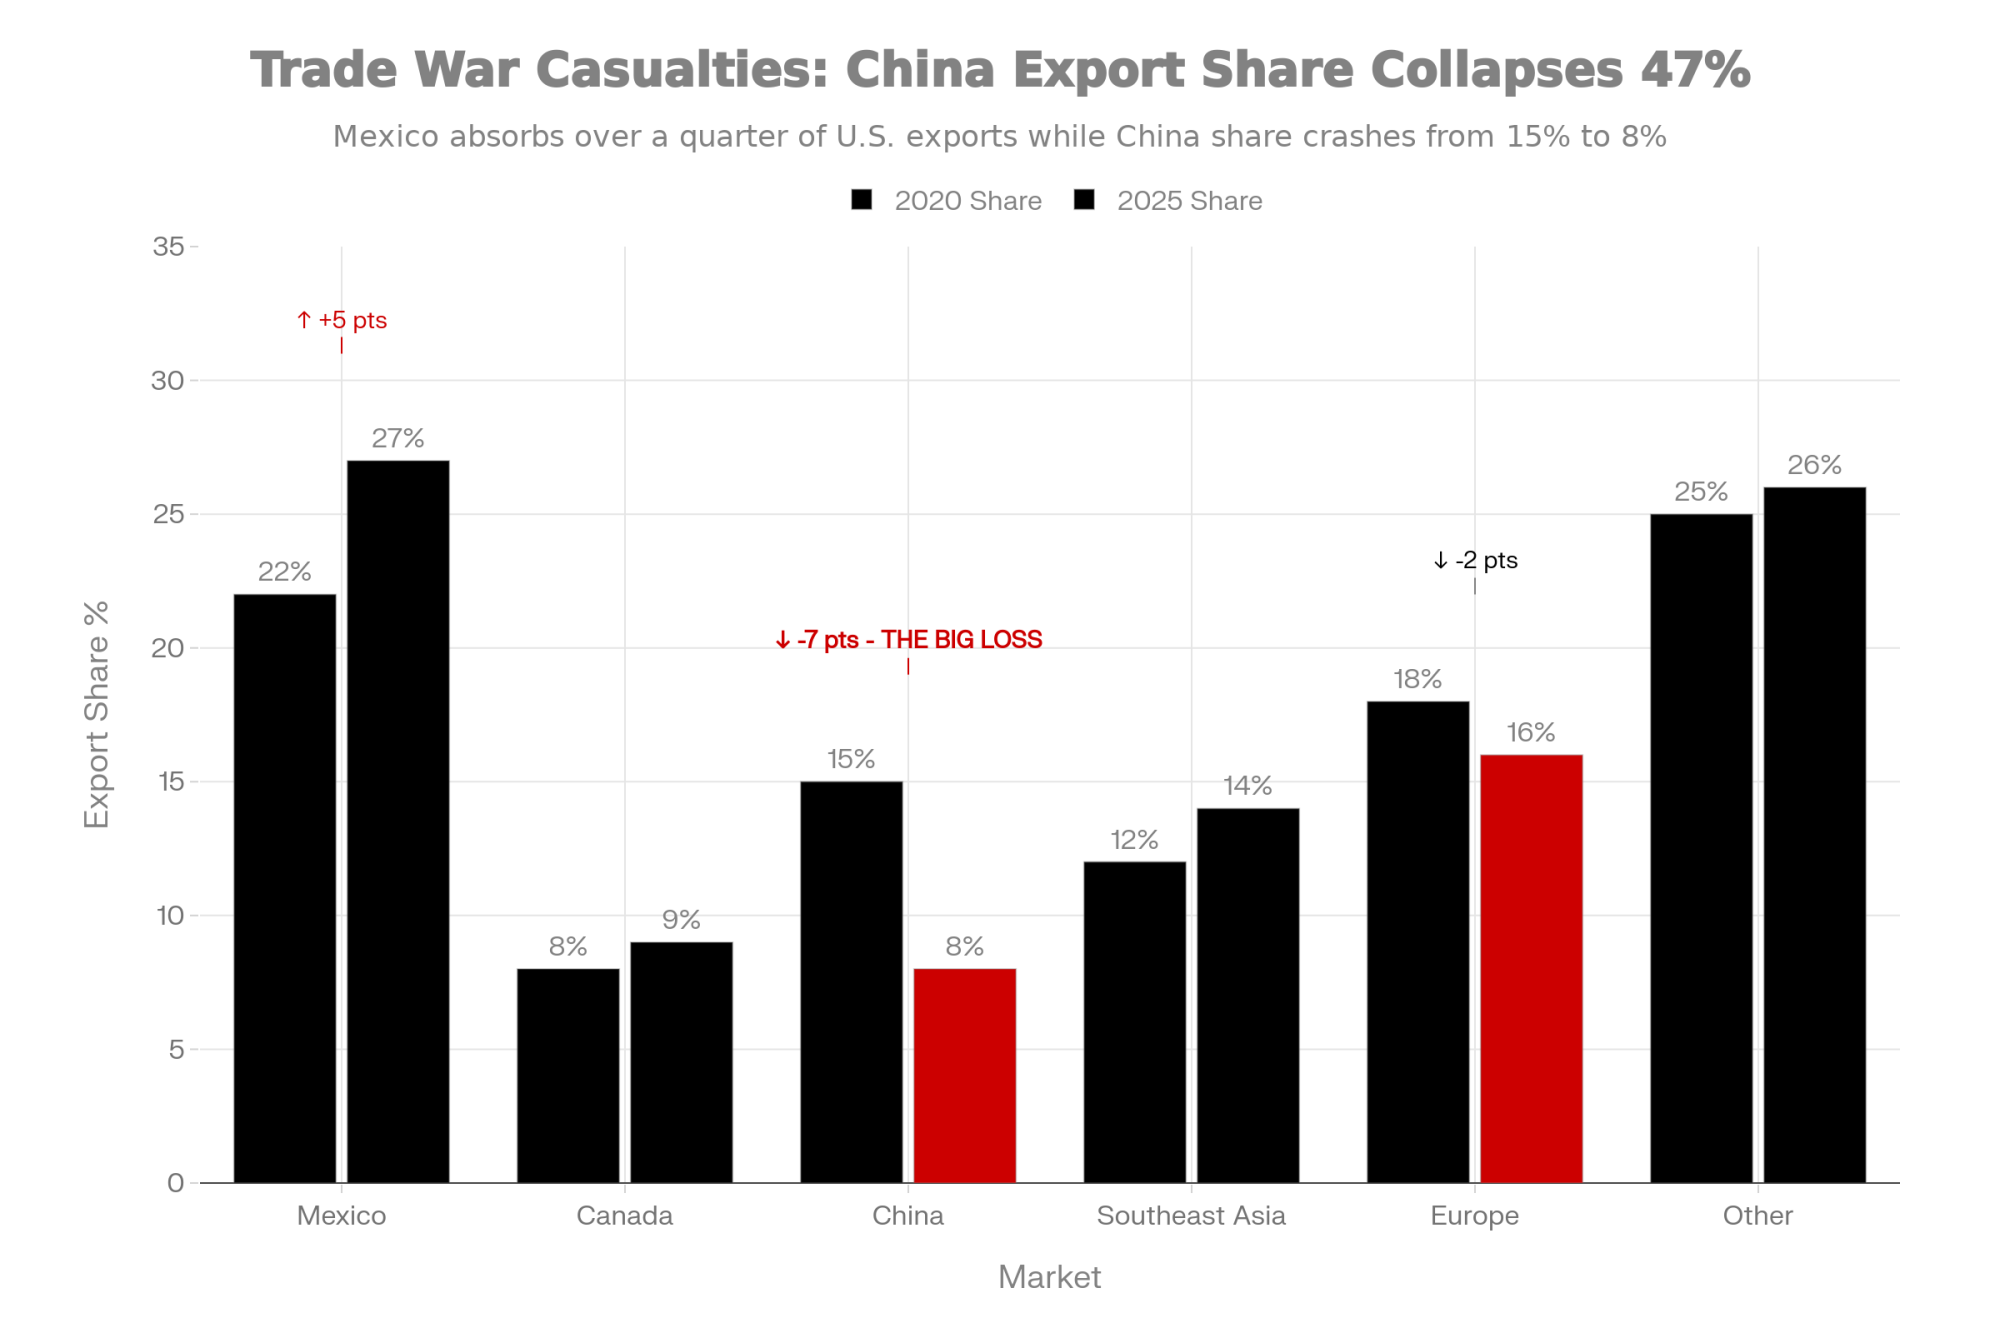
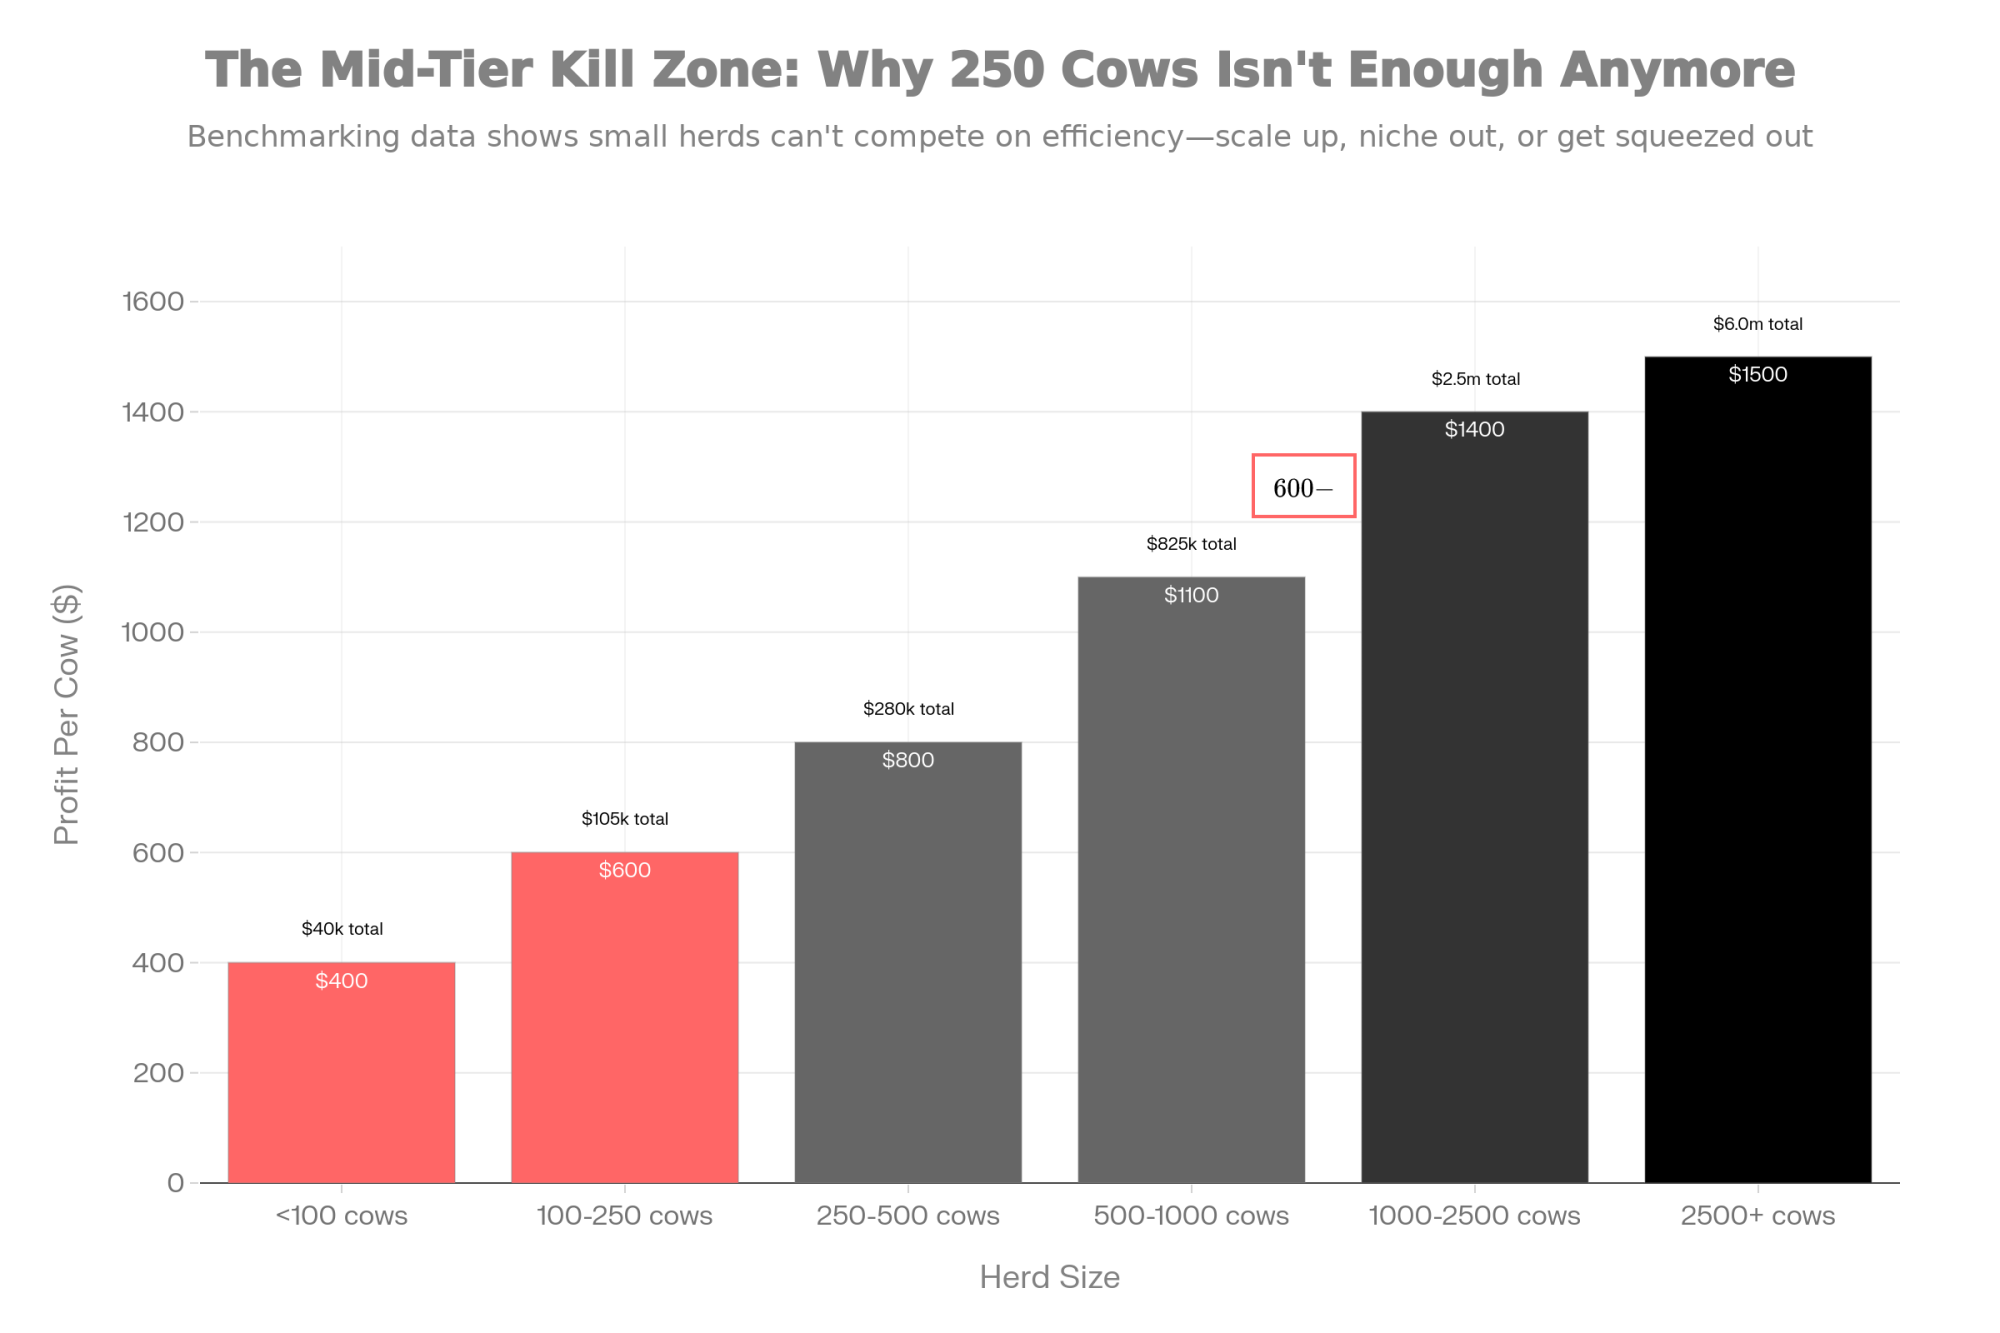
Executive Summary: The dairy industry you’ve built your life around is heading into 18 months that will decide who’s still milking in 2030. U.S. production jumped 4.2% year-over-year in September 2025, and with China now 85% self-sufficient, the world’s biggest surplus sponge has dried up. Trade has splintered into regional blocs—Mexico now absorbs over a quarter of our exports, and if that relationship falters, most farms have no backup plan. The math is unforgiving for mid-size operations: Benchmarking data shows herds under 250 cows earning $500-700 less per cow annually than large-scale competitors. If your debt-to-asset ratio is creeping toward 60%, you’re approaching the red line. This analysis delivers a practical checklist for the decisions that matter most—while you still have the runway to make them.

You know, I’ve been talking with producers across the country lately, and there’s a common thread in those conversations that’s worth paying attention to. One third-generation Wisconsin dairy farmer I spoke with recently—he’s running around 200 cows in the south-central part of the state—put it pretty well.
“It’s not just about milk prices anymore,” he told me. “It’s about whether the whole system we’ve built our lives around is going to exist in five years.”
Now, I’ve heard concerns like this before during tough market cycles. But after spending considerable time digging into the data and talking with economists, producers, and industry analysts… I think he’s onto something. The global dairy industry is approaching a point that feels genuinely different from the cyclical ups and downs we’ve all weathered before. And the decisions farmers make over the next 18 months—about expansion, processing investments, market relationships, and yes, whether to keep milking—will shape who’s still in business when things settle out.
So let me walk through what’s actually happening beneath the headline noise. Some of this you probably know already. Some of it might surprise you.
The Supply Picture Building for 2026
Here’s what caught my attention when I started looking at the production numbers: we’re not seeing one region expand while others pull back. Multiple major dairy regions are growing at the same time—and that matters more than people realize.
The U.S. expansion is real and shows no signs of slowing. USDA’s fall 2025 Milk Production reports show cow numbers and output running well above year-ago levels. The September numbers were particularly striking—production in the 24 major states came in 4.2% higher than September 2024, with gains in both cow numbers and milk per cow. And here’s what’s worth paying attention to: industry analysts looking at heifer retention data suggest this expansion momentum is likely to carry into 2026 and possibly beyond. That means production volumes keep climbing even if nobody adds another cow starting tomorrow.
Dr. Mark Stephenson, who served as Director of Dairy Policy Analysis at the University of Wisconsin-Madison before his recent retirement, has been tracking these trends for decades. As he’s noted in recent industry discussions, we’re looking at production growth momentum that’ll take a year to 18 months to work through the system, regardless of what current price signals might suggest.
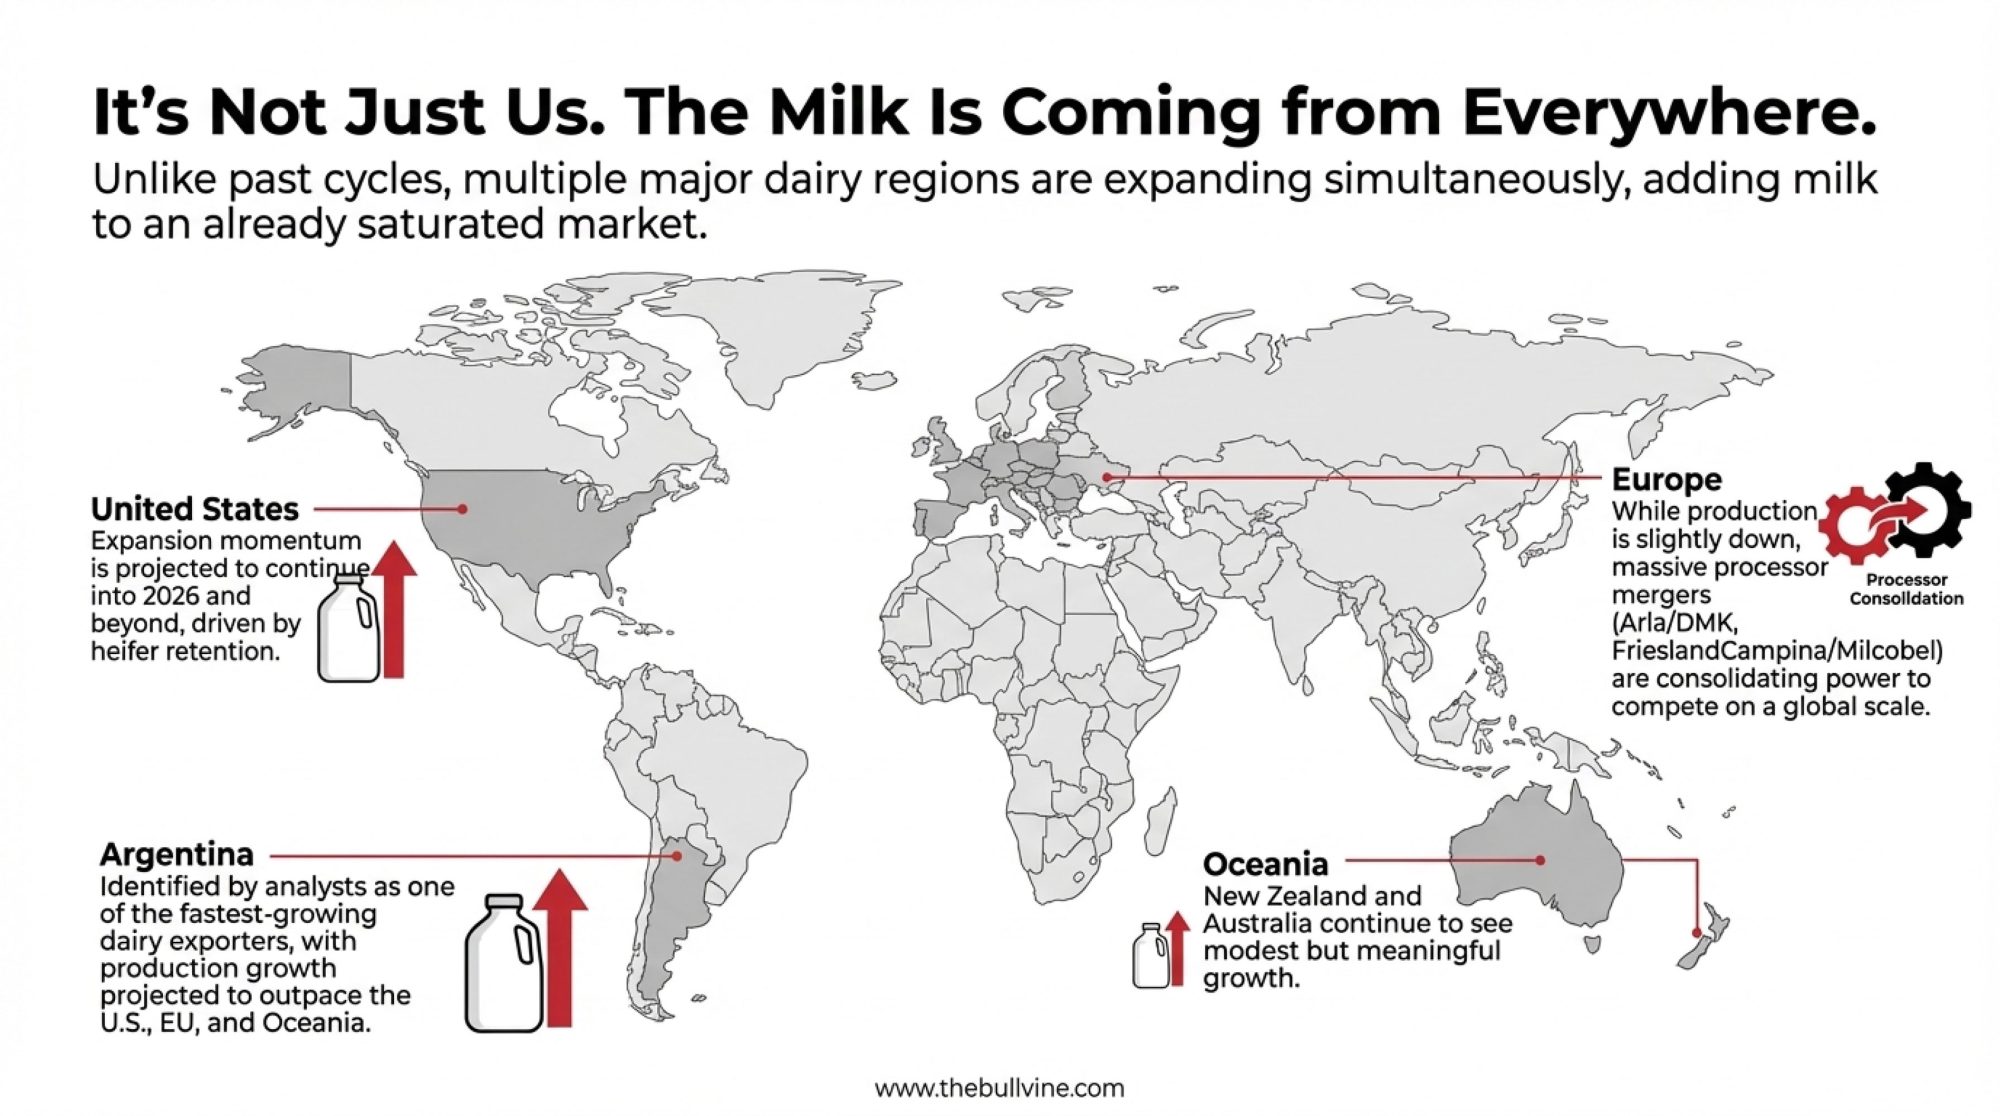
Meanwhile, Rabobank’s global dairy analysts point to modest growth continuing in New Zealand and Australia over the next couple of seasons. Not huge numbers, but meaningful when you’re adding milk to markets that are already well-supplied.
And Argentina? That’s the one I think deserves more attention than it’s getting. Industry analysts identify Argentina as one of the fastest-growing dairy exporters today, with milk production projected to grow faster than in the U.S., the EU, or Oceania. They’re expanding capacity and targeting export markets that traditionally absorbed surplus from other regions.
Europe’s situation is a bit different. The European Commission’s recent short-term outlook projects EU production will edge slightly lower in 2025—dropping cow numbers, tight margins, environmental regulations, and disease outbreaks are all playing roles there. But the mega-cooperative mergers happening on that side of the Atlantic—Arla combining with DMK to create roughly a 25-billion-liter entity with combined revenues around €19 billion, FrieslandCampina merging with Milcobel to form another giant with about 16,000 member farms—those are consolidating processing capacity in ways that’ll reshape how things work over there.
Why does simultaneous expansion in the Americas and Oceania matter so much? Because the traditional safety valves for oversupply aren’t available this time.

Three Things Making This Different
Market cycles come and go. I’ve seen enough of them to know that what feels unprecedented often isn’t. But three structural changes make what’s building for 2026 genuinely different from previous downturns.
First, inventory dynamics have shifted. USDA Cold Storage reports show U.S. butter inventories in 2025 near multi-year highs—well above levels seen in 2022 and 2023. European cheese stocks are similarly elevated. In past cycles, processors moved inventory quickly to avoid storage costs. Today’s more regionalized trade structure lets them hold product longer, waiting for better conditions rather than clearing markets on our timeline. What that means practically: don’t expect inventory liquidation to relieve price pressure as fast as we’ve seen historically.

Second—and this is the big one—China’s role has fundamentally changed. From roughly 2010 to 2020, China was the growth market. The safety valve. When global supply got heavy, Chinese demand absorbed it. That chapter’s closed.
Rabobank’s Mary Ledman has been tracking this closely, and what she’s documented is significant: China’s dairy self-sufficiency has climbed from around 70% to roughly 85% over just a few years. Their imports fell around 12% year over year in recent data. The market that once absorbed surplus production is now competing as a supplier.
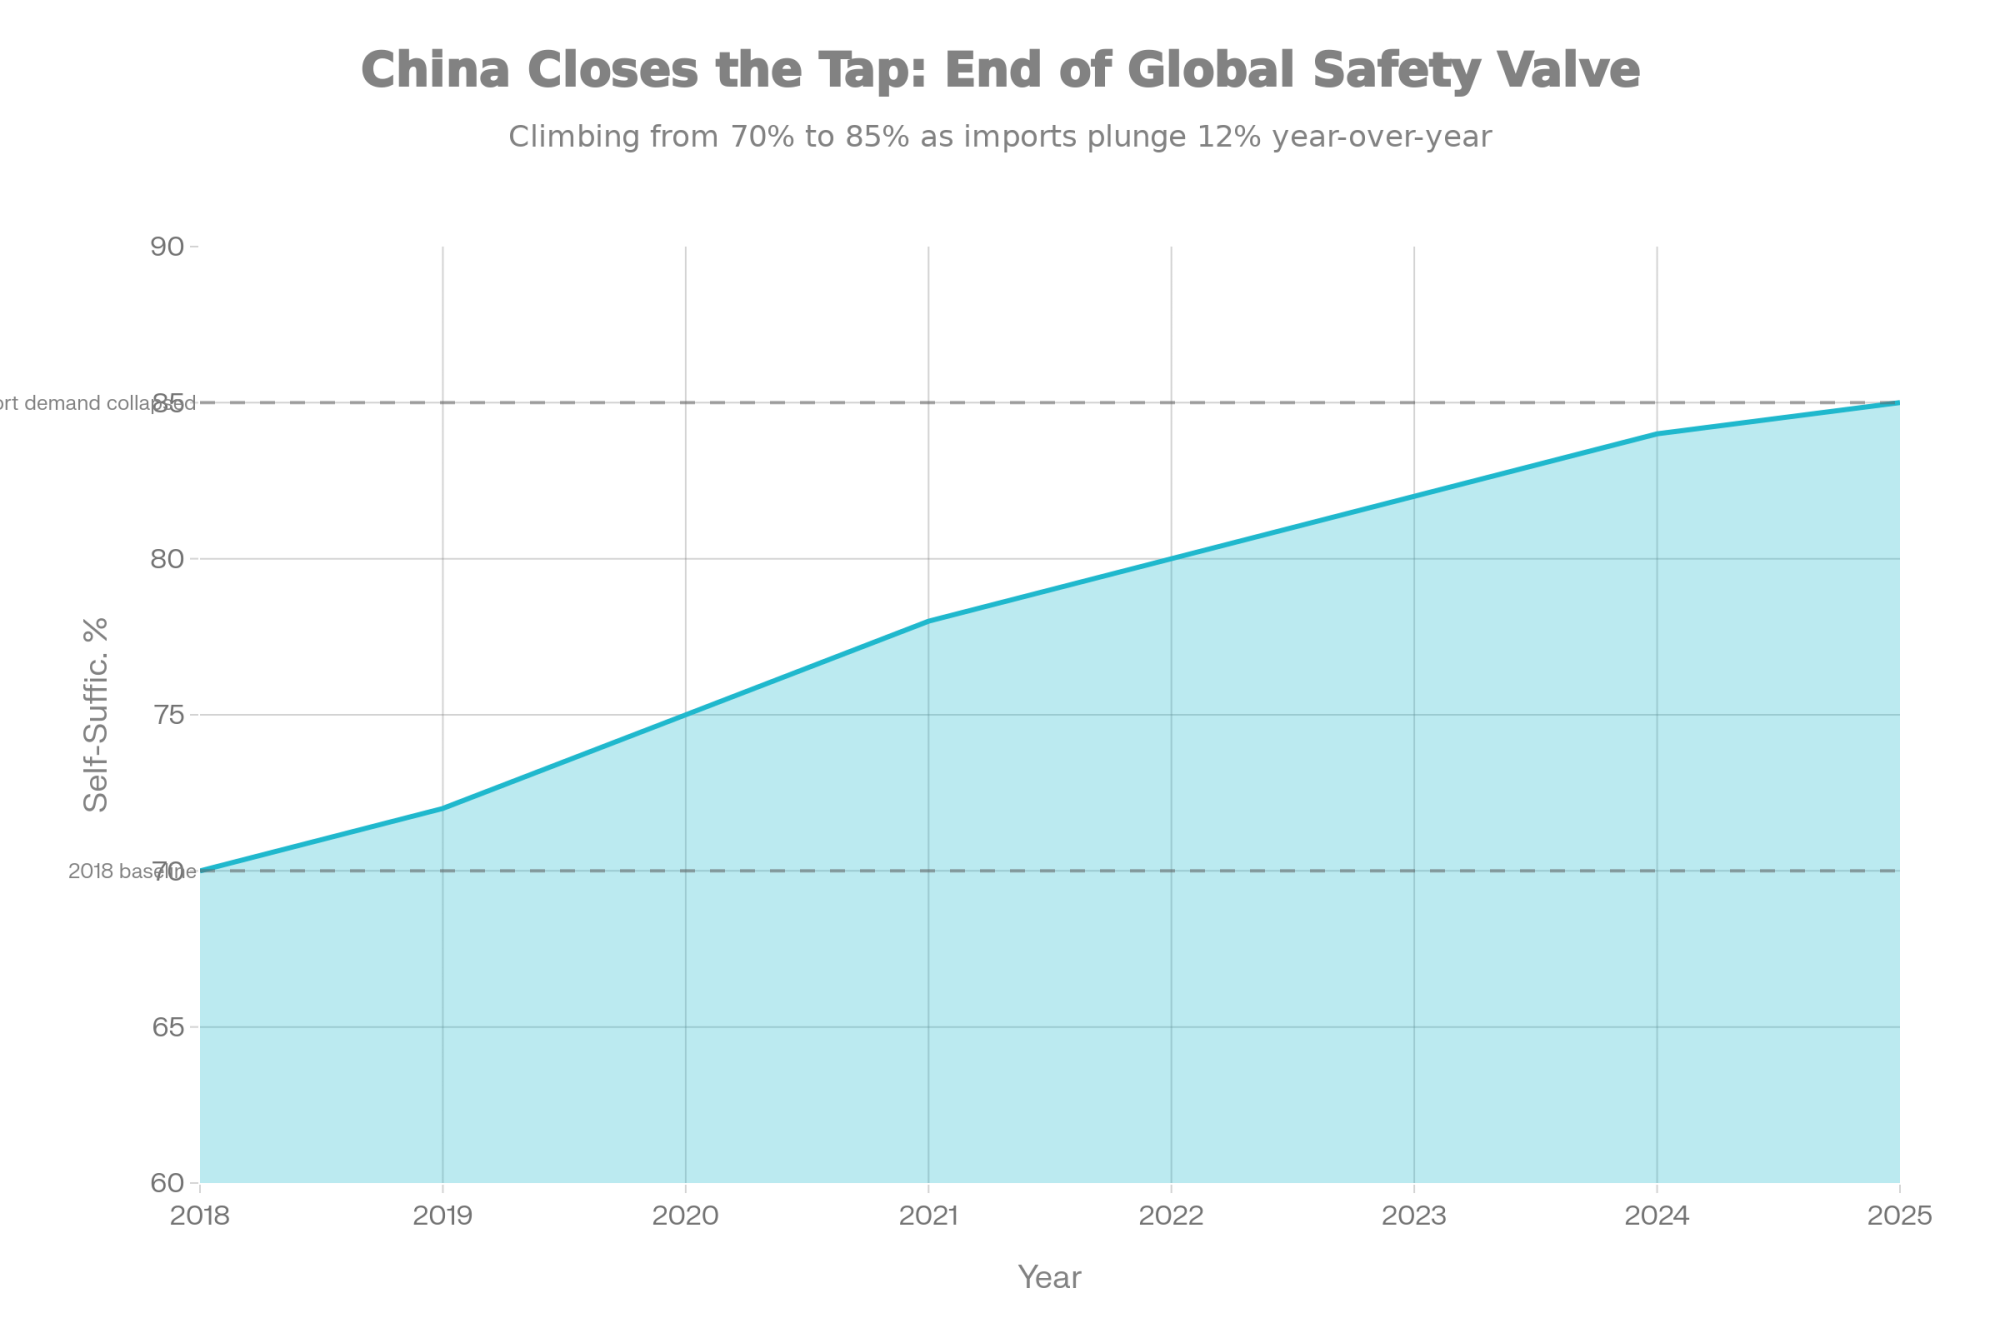
And here’s what’s interesting—even though China’s domestic milk production has actually declined slightly, their import demand isn’t growing. Consumption remains weak despite that massive population. Government policy explicitly prioritized domestic production, aiming to expand output over the coming years.
Third, tariff structures have pushed trade toward regional patterns. When trade tensions escalated in early 2025, it didn’t just affect prices temporarily—it reorganized supply chains. Chinese buyers shifted to New Zealand suppliers with preferential trade access. European exporters lost U.S. market share.
I’ve talked with agricultural economists about this dynamic, including folks at Cornell who study the impacts of trade policy. The consensus is sobering: once supply chains reorganize and buyers establish new purchasing patterns, those structures tend to persist even when tariff rates change. Trade policy forces realignment that often sticks.
That’s worth sitting with for a moment. The relationships being built now aren’t necessarily temporary adjustments.
Geography as Destiny
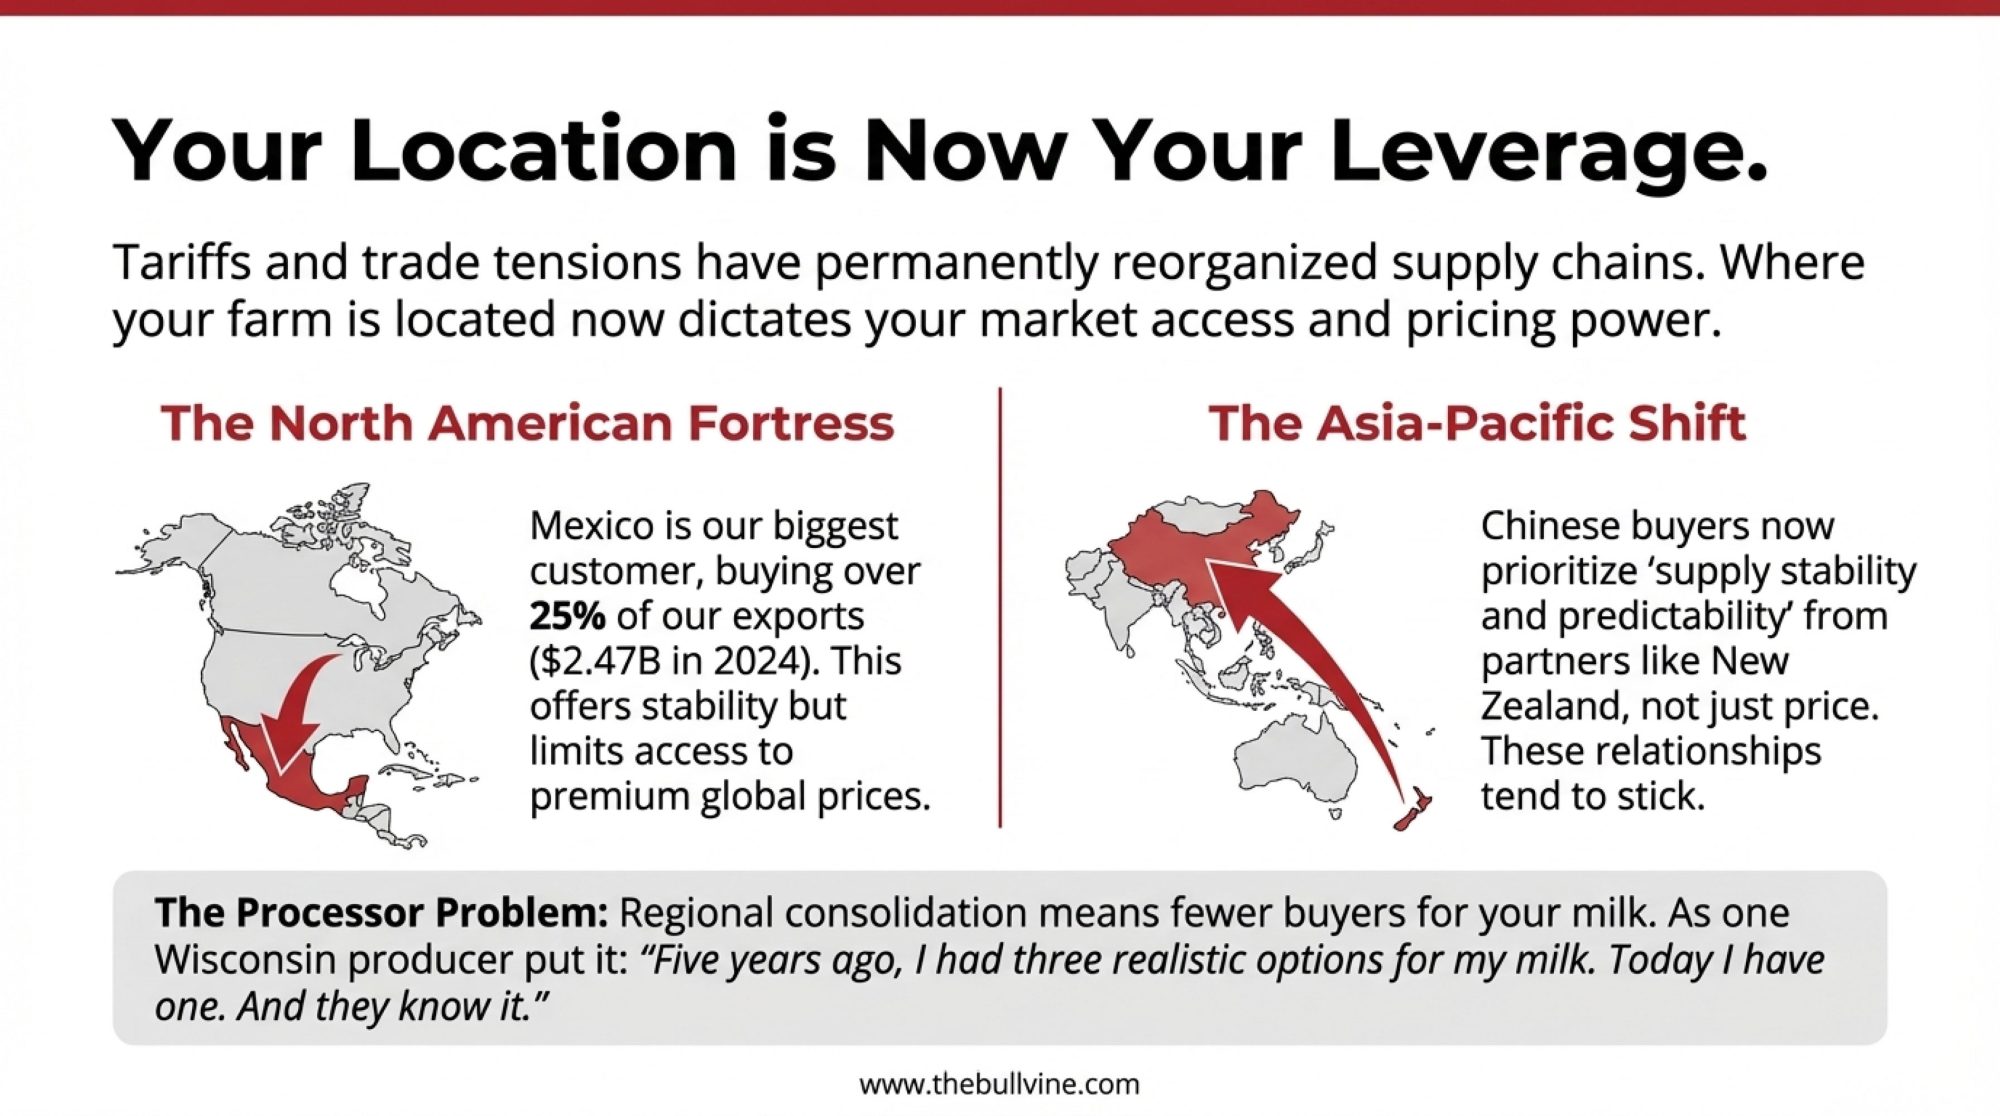
One dynamic I’ve been watching closely is the emergence of distinct regional trading patterns. Where your farm sits within these patterns increasingly shapes your market access and pricing power.
North America’s More Protected Market
The U.S. dairy market has become more insulated through tariff protection. Mexico remains our biggest customer—industry data from CoBank and the U.S. Dairy Export Council shows they bought roughly $2.47 billion of U.S. dairy in 2024, representing well over a quarter of our total export value, which was approximately $8.2 billion.
Here’s what’s interesting about this structure: when tariffs affect trade with Mexico and Canada, our whole North American market adjusts without outside supply filling the gaps. The University of Wisconsin’s Center for Dairy Profitability has examined this dynamic in their trade analyses.
What emerges is something like forced regional integration. U.S., Mexican, and Canadian markets operate somewhat independently from global commodity pricing. For farmers here, that means milk prices tend to stabilize around domestic supply and demand rather than global competition.
Former USDA Secretary Tom Vilsack has been vocal about these tradeoffs. In remarks to Brownfield Ag News last October, he warned that continued tariffs could cause lasting damage to U.S. agricultural trade relationships, noting concerns about losing customers to competitors such as Brazil and Argentina, which are “eager to take that business.” Trade protection provides some stability, but it also limits opportunities and creates long-term relationship risks.
That’s a fair summary of the situation. You’re cushioned from global oversupply to some degree, but you also can’t easily capture premium pricing when Asian markets are paying up.
The Asia-Pacific Shift
New Zealand now supplies nearly half of China’s dairy imports through preferential trade access. Australia is positioning aggressively as an alternative supplier, with its dairy council projecting market-share gains in Southeast Asia.
What’s notable is why they’re winning. This isn’t primarily about price competition. It’s geopolitical stability and access to trade agreements that create advantages others can’t easily match.
Recent industry reporting quotes Chinese buyers explicitly prioritizing “supply stability and predictability” over price. Once those supply chains get rebuilt around preferred partners, the relationships tend to persist even when trade conditions change.
For American farmers hoping Asian demand eventually absorbs our domestic oversupply… this is worth serious thought.
Europe’s Consolidation Strategy
Europe’s massive processor consolidation tells you something important: they’re consolidating because they can’t achieve global market dominance, not because they’re winning.
U.S. tariffs hit EU dairy with 15-20% duties, while New Zealand faces around 10% and Australia even less. Recent trade frameworks have provided only limited tariff-free access—far below historical trade volumes.
European dairy is increasingly focused on serving the EU domestic market (where per capita consumption is actually declining), exporting to Africa and adjacent regions with existing trade agreements, and competing for remaining global market share at compressed margins.
The mega-mergers make sense in that context. When you can’t grow externally, you consolidate to survive internally.
The Demand Puzzle
Something that puzzled me initially: global dairy demand actually is growing. The OECD-FAO Agricultural Outlook and various market research firms project steady consumption growth over the next decade, with Asia-Pacific expected to post some of the fastest gains.
So why doesn’t this help producers in North America and Europe?

The growth is geographically misaligned with where we’re producing milk.
The UK’s Agriculture and Horticulture Development Board put out a good analysis on this last summer. Per capita dairy consumption in Southeast Asia remains well below 20 kilograms annually, compared with around 300 kilograms in developed markets. That sounds like massive upside potential.
But building the cold chains, retail networks, and consumer habits takes a decade or more. Our cows produce milk today. Every day. That milk needs a market this month, not in 2035.
Meanwhile, consumption in developed markets continues to slide.
You probably know this already, but USDA data shows per capita fluid milk intake has been falling for decades—we’re now drinking roughly 90-100 pounds less per person annually than folks did in the mid-1980s.
Dr. Glynn Tonsor, Professor of Agricultural Economics at Kansas State University, has studied this extensively. As he’s noted in industry presentations, this isn’t a temporary consumer preference—it’s a generational dietary shift. People born in the 1980s and 1990s drink significantly less milk than previous generations, and that pattern isn’t reversing.
The numbers are pretty simple: producers in Wisconsin, California, Europe, and New Zealand can’t wait a decade for Asian demand to scale. Today’s production floods into commodity channels, putting pressure on prices while structural demand slowly builds in distant markets.
Understanding Processor Dynamics
Let me be careful here because there’s a tendency to frame processor relationships in adversarial terms. That’s not especially helpful. Processors are responding to the same structural forces farmers face. But understanding the dynamics helps explain why farmgate prices don’t always improve even when retail dairy prices rise.
In more regionalized markets, external competition doesn’t constrain processor pricing the way it once did. Think about what that means practically. If your cooperative’s pricing feels inadequate, what’s your alternative? In a truly global market, you could theoretically explore other buyers or export channels. In a regionalized setup? Options narrow considerably.
The Australian Competition and Consumer Commission examined this dynamic in their dairy industry inquiry reports from 2018-2020. What they found isn’t surprising: when fewer processors operate in a region, farmers have fewer switching options, and that correlates with lower farmgate prices.
The U.S. processor landscape has consolidated quite a bit over the decades. While exact historical counts vary by how you define processors, the trend is unmistakable—far fewer processors compete for farmers’ milk today than did a generation ago.
A mid-size Wisconsin producer I spoke with—he asked to remain anonymous to discuss business relationships candidly—described his experience this way: “Five years ago, I had three realistic options for my milk. Today I have one. And they know it. The conversation around pricing is just different when everyone understands you can’t leave.”
The cooperative model is evolving in complex ways.
Dairy Farmers of America now channels a substantial share of its member milk through DFA-owned processing plants. That vertical integration creates tensions. When your cooperative is also your processor, the interests don’t always align cleanly.
This isn’t universal among cooperatives. Organic Valley has maintained farmer-centric governance and stable pricing for its member farms. But they operate in a premium niche. The commodity milk cooperative model faces different pressures.
Alternative Strategies: An Honest Look
When commodity prices compress, many producers consider alternatives such as on-farm processing, direct-to-consumer sales, and specialty products. I’ve talked with farmers pursuing each path. Here’s what the experience and research actually show.
The capital requirement is substantial.
Case studies from Wisconsin, Vermont, and New York—documented through their respective extension programs—show that small cheese rooms or bottling facilities frequently carry six-figure price tags when you combine equipment, building work, and regulatory compliance. On a 200-300 cow operation, that investment can easily equal a sizable chunk of annual gross revenue.
One organic producer in Wisconsin who added on-farm cheese processing about five years ago described the decision as “terrifying” at the time. But she had the scale to absorb it and proximity to Madison’s premium market. A 100-cow farm two hours from any metro area? The math works very differently, she pointed out.
Geography matters more than many folks realize.
Extension and marketing research—including work from the University of Vermont’s Center for Sustainable Agriculture—repeatedly shows that successful direct sales tend to cluster near higher-income, higher-population areas, often within easy driving distance of a metro market.
A producer in rural South Dakota faces fundamentally different market access than one 30 minutes from Minneapolis or Denver. Farms succeeding at direct sales often get $12-20 per gallon versus commodity pricing—but only with the right customer base within practical driving distance.
That geographic constraint excludes many farms from serious consideration for direct-to-consumer strategies, regardless of capability or willingness.
Farms that make alternative strategies work tend to share certain characteristics.
Based on extension research and documented case studies, they typically have enough scale to absorb the capital investment—often 100-plus cows. They’re located within a reasonable distance of processing infrastructure or premium consumer markets. The operators are willing and able to work in sales and marketing, not just production. They have existing capital reserves or credit access. And they’re patient—these transitions generally take three to five years to reach profitability.
For farms meeting those criteria, alternative strategies genuinely can work. For farms missing two or more factors, pursuing alternatives may delay rather than prevent exit.
| Decision Path | Capital Required | Timeline to Profitability | Risk Level | Target Profit/Cow | Critical Success Factor | Geographic Advantage | Typical Farm Profile |
|---|---|---|---|---|---|---|---|
| Scale Up (1000+ cows) | $5M – $15M+ | 3-5 years | High (debt load) | $1,400 – $1,500 | Access to capital + cheap feed | ID, TX, NM, SD | Current 500-800 cows, <40% debt |
| Niche Out (Specialty) | $150K – $500K | 3-5 years | Medium (market) | $1,800 – $2,500 | Premium markets within 60 miles | Near metro areas | Current <200 cows, near city |
| Right-Size + Tech | $250K – $750K | 1-2 years | Medium (execution) | $1,000 – $1,200 | Management excellence | WI, MI, PA, NY | Current 200-600 cows, family labor |
| Exit with Equity | $0 (liquidation) | Immediate | Low (opportunity cost) | N/A | Timing + existing equity | Any | Current <250 cows, >50% debt |
What Determines Mid-Tier Survival
A question I hear constantly: what about the 100-500 cow operations? Not mega-dairies, but not small enough to pivot easily to direct sales. What separates the ones likely to make it from those who won’t?
I’ve spent considerable time looking at this segment, and some patterns emerge.
Financial structure is often the clearest predictor.
Penn State Extension notes that banks generally prefer a debt-to-asset ratio below 60% for farms considering expansion—and that threshold serves as a reasonable risk benchmark more broadly. Farm Credit analyses similarly suggest that operations carrying ratios above that level face elevated vulnerability during prolonged price downturns. Farms that weather extended margin compression typically carry ratios well below that threshold.
Labor has become a critical factor as well.
This is something that doesn’t always get enough attention in these discussions. Mid-tier operations often sit in an awkward spot—too large for family labor alone, but not large enough to offer the wages, housing, and advancement opportunities that larger operations can. Immigration policy uncertainty has made workforce planning even more challenging. The farms that navigate this successfully tend to invest in employee retention: better housing, competitive pay, and clear advancement paths. It’s not just about finding workers anymore—it’s about keeping them.
Processor relationships matter enormously at this scale.
What I’ve noticed talking with mid-tier survivors: most have some form of arrangement with their processor, whether a formal contract or long-standing relationship. The most vulnerable farms sell essentially into spot markets—milk goes wherever the co-op sends it at whatever price the co-op offers.
Jim Goodman, a former Wisconsin dairy farmer who’s been active on farm policy issues and has been featured in agricultural publications, has made this observation: the mid-size farms that survive have often figured out they’re in the relationship business, not just the milk business. They know their processor’s field rep by name. They attend every meeting. They’re not invisible.
Regional concentration tells you something important.
Surviving mid-tier operations cluster in specific geographies: south-central Wisconsin, Michigan’s western lower peninsula, parts of California’s central valley, and pockets of the Northeast near processing infrastructure.
Mid-tier farms in regions dominated by large operations—such as the Texas Panhandle, southern Idaho, and New Mexico—face structural disadvantages that operational excellence alone can’t overcome. If you’re running a 250-cow operation where the average dairy has 2,000-plus cows, you’re not competing on the same terms. Feed costs per ton run higher, labor efficiency runs lower, and processor leverage is minimal.
The successful mid-tier operators I’ve met share a mindset.
They’re not trying to become mega-dairies. They’re not romanticizing small-scale farming either. They’ve made realistic assessments about what their operation can achieve and optimized it within those constraints.
They’ve typically identified one or two specific advantages—exceptional forage production, low-cost facilities, family labor flexibility, proximity to a specialty buyer—and built a strategy around protecting those advantages rather than chasing scale they can’t realistically achieve.
A Mid-Tier Success Story Worth Noting

Not everything in this analysis points toward consolidation and exit. I talked with a 320-cow operation in Michigan’s Thumb region that’s actually positioned well for what’s coming—and their approach offers some useful lessons.
They made three strategic decisions over the past decade that now look prescient. First, they aggressively paid down debt during the strong milk price years of 2022-2024, bringing their debt-to-asset ratio below 40%. Second, they locked in a five-year component-based contract with a regional cheese processor that values their high-protein milk. Third, they invested in employee housing and retention rather than herd expansion.
“Everyone around us was adding cows when prices were good,” the operator told me. “We added a duplex for our two key employees instead. Those guys have been with us for seven years now. That stability is worth more than another hundred cows.”
They’re not immune to what’s coming—nobody is. But they’ve built resilience through relationships, financial discipline, and knowing what they’re good at. That’s a model worth considering.
What the Next Five Years Likely Looks Like
Let me share what the structural forces and consolidation trends point toward. I want to be clear that these are projections based on current patterns—not certainties. Markets can surprise us, and policy changes could shift the trajectory. But the direction seems reasonably clear if present trends continue.
Farm numbers will likely decline substantially.
If current exit rates persist, several industry and academic analysts estimate U.S. dairy farm numbers could fall significantly by 2030—potentially into the low tens of thousands, down from somewhere around 25,000-28,000 today. Similar consolidation pressures are projected in Canada—some observers suggest a substantial portion of their remaining farms could exit over the coming years if trends continue.
Scale concentration will likely increase further.
Current USDA and industry analyses show that large herds—often 1,000 or more cows—already produce the majority of U.S. milk. Most observers expect that share to keep climbing. Mid-tier operations that survive will generally do so through geographic advantage, quality differentiation, or secure relationships with processors.
Smaller operations face steep structural headwinds.
I don’t say this to be discouraging, but to be realistic: farms with under 100 cows face structural challenges that operational improvements alone often can’t overcome. Historical exit rates among smaller herds have frequently ranged from 4% to 7% annually. If anything like that pace continues, a large majority of sub-100-cow operations could exit commercial production over the next decade.
Some will transition to specialty or direct-to-consumer models. Most will exit through gradual herd reduction and eventual sale.
Geography will shape regional outcomes.
The traditional Dairy Belt—Wisconsin, Michigan, California, Idaho, Texas, South Dakota—has concentrated processing infrastructure. Consolidation will continue, but the industry will survive with large-scale producers intact.
Peripheral regions—New England, Mid-Atlantic, Plains states, Southeast—have more limited processing infrastructure and smaller average farm sizes. Exit rates may run higher there. Surviving operations in those areas will likely be scattered and specialty-focused.
Is Change Possible?
Can anything alter this trajectory? Mechanisms exist to slow or shift consolidation, but implementing them requires confronting uncomfortable realities about power, politics, and collective action.
Organized farmer action has shown real influence in some settings.
In Ireland, farmer pushback against Dairygold’s recent price reductions—including coordinated attendance at a key supplier meeting organized through social media—demonstrated that organized producers can influence cooperative decisions on milk pricing. That worked partly because Dairygold operates as a true cooperative with farmer-shareholders who have voting rights and equity stakes. Collective organization gave them genuine leverage.
That model differs meaningfully from structures where farmers supply milk but don’t own equity. The leverage differs accordingly.
Antitrust enforcement shows some activity.
Recent European court decisions have found that coordinated pricing behavior by major dairy buyers did depress farmgate prices, with courts quantifying significant producer losses. Here in the U.S., the USDA and the Justice Department announced a joint initiative last September to investigate agricultural market concentration. That represents progress, though antitrust cases typically take years to work through the system.
Political constraints remain substantial.
Those with the power to implement structural solutions often benefit from current arrangements. Large cooperatives and mega-farms gain from consolidation. Farmer political voice tends toward large-operation representation. Unified action is difficult when most milk flows through a handful of competing cooperatives.
Dr. Marin Bozic, a dairy economist at the University of Minnesota, has summarized this challenge in industry presentations: the mechanisms for change exist, but the political will and farmer coordination required to implement them are the limiting factors.
That’s probably a fair assessment of where things stand.

Your 18-Month Checklist
Based on everything I’ve looked at, here’s your checklist for the next 18 months:
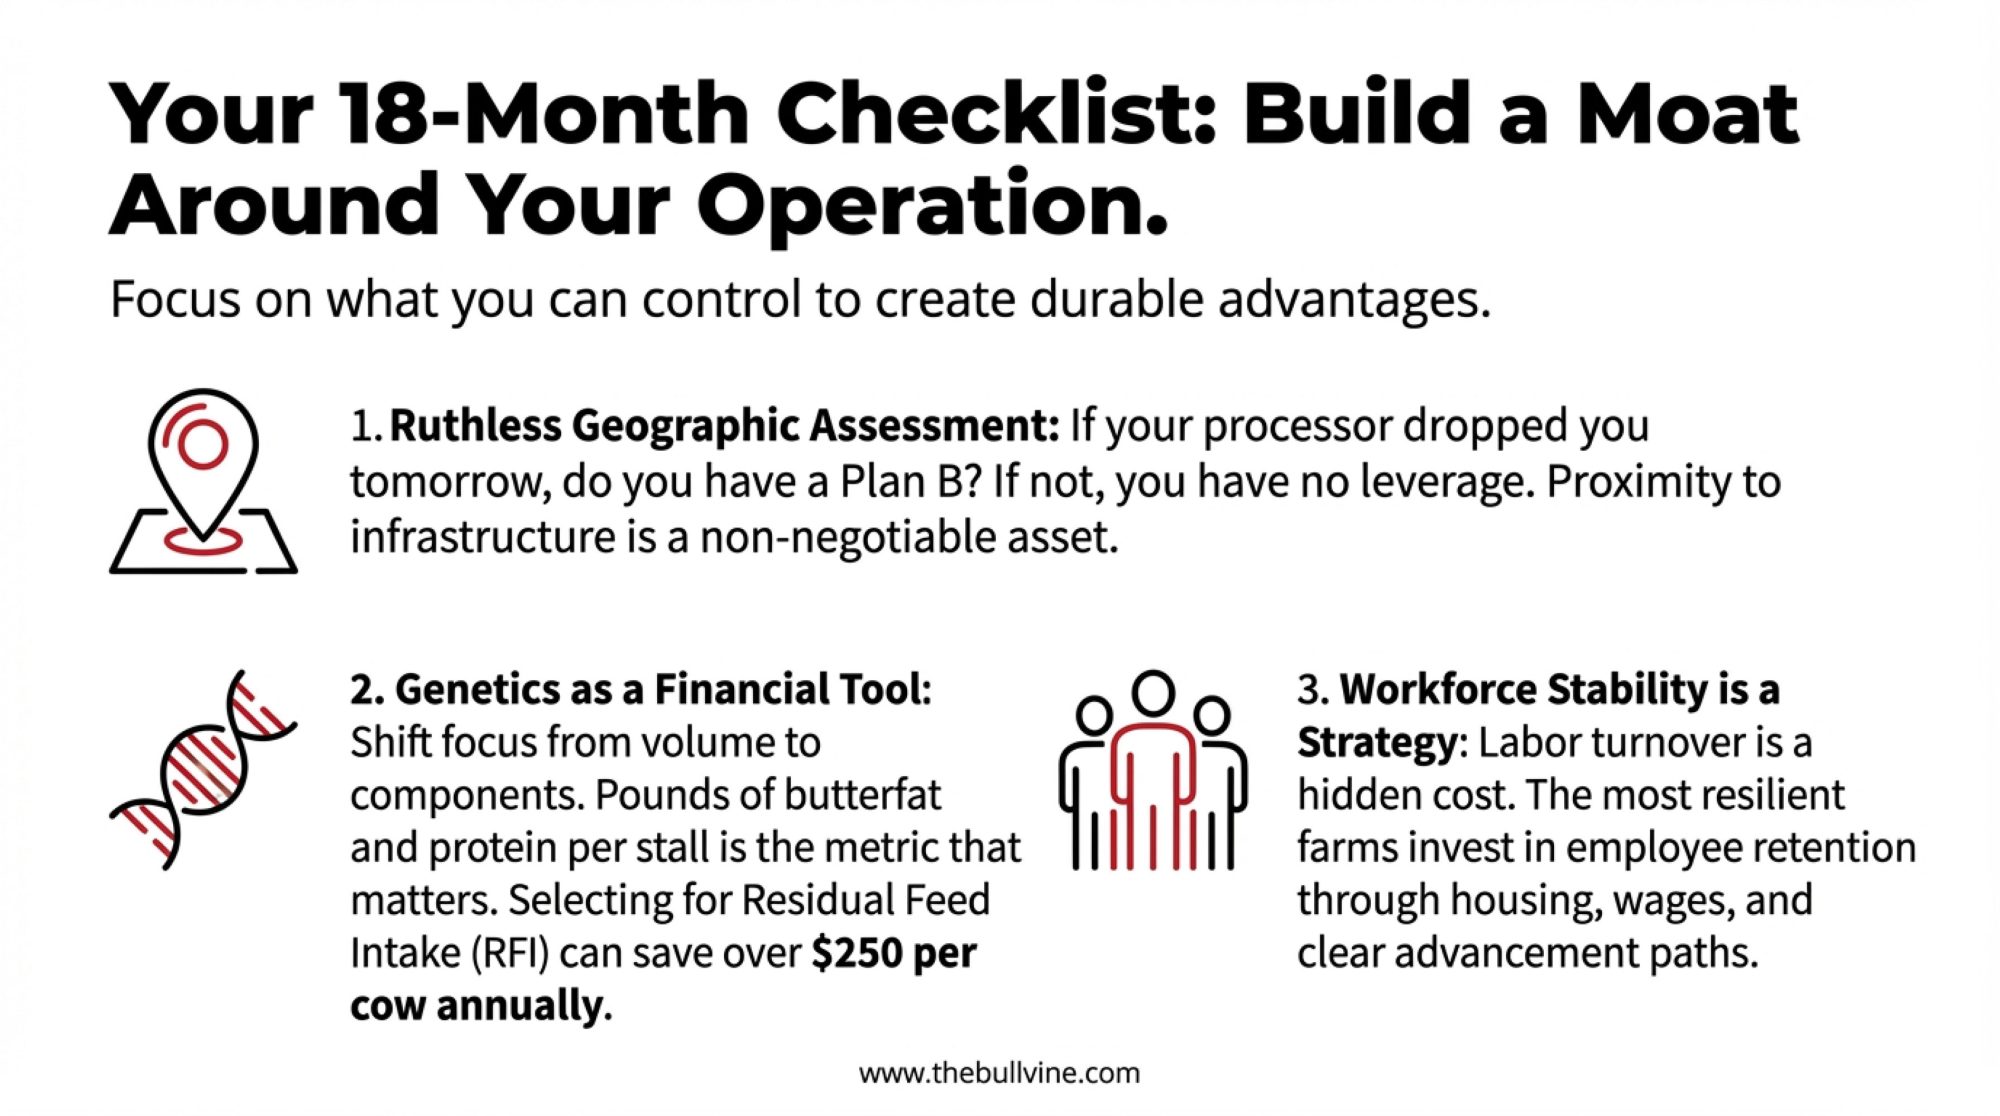
Ruthless Geographic Assessment. If you’re 200 miles from a processor and they drop you, do you have a Plan B? If not, you’re gambling, not farming. Farms within a reasonable distance of major processing infrastructure have structural advantages that operational improvements alone can’t replicate. If location is fundamentally disadvantaged for commodity milk or direct sales, that reality needs to inform every other decision you make.
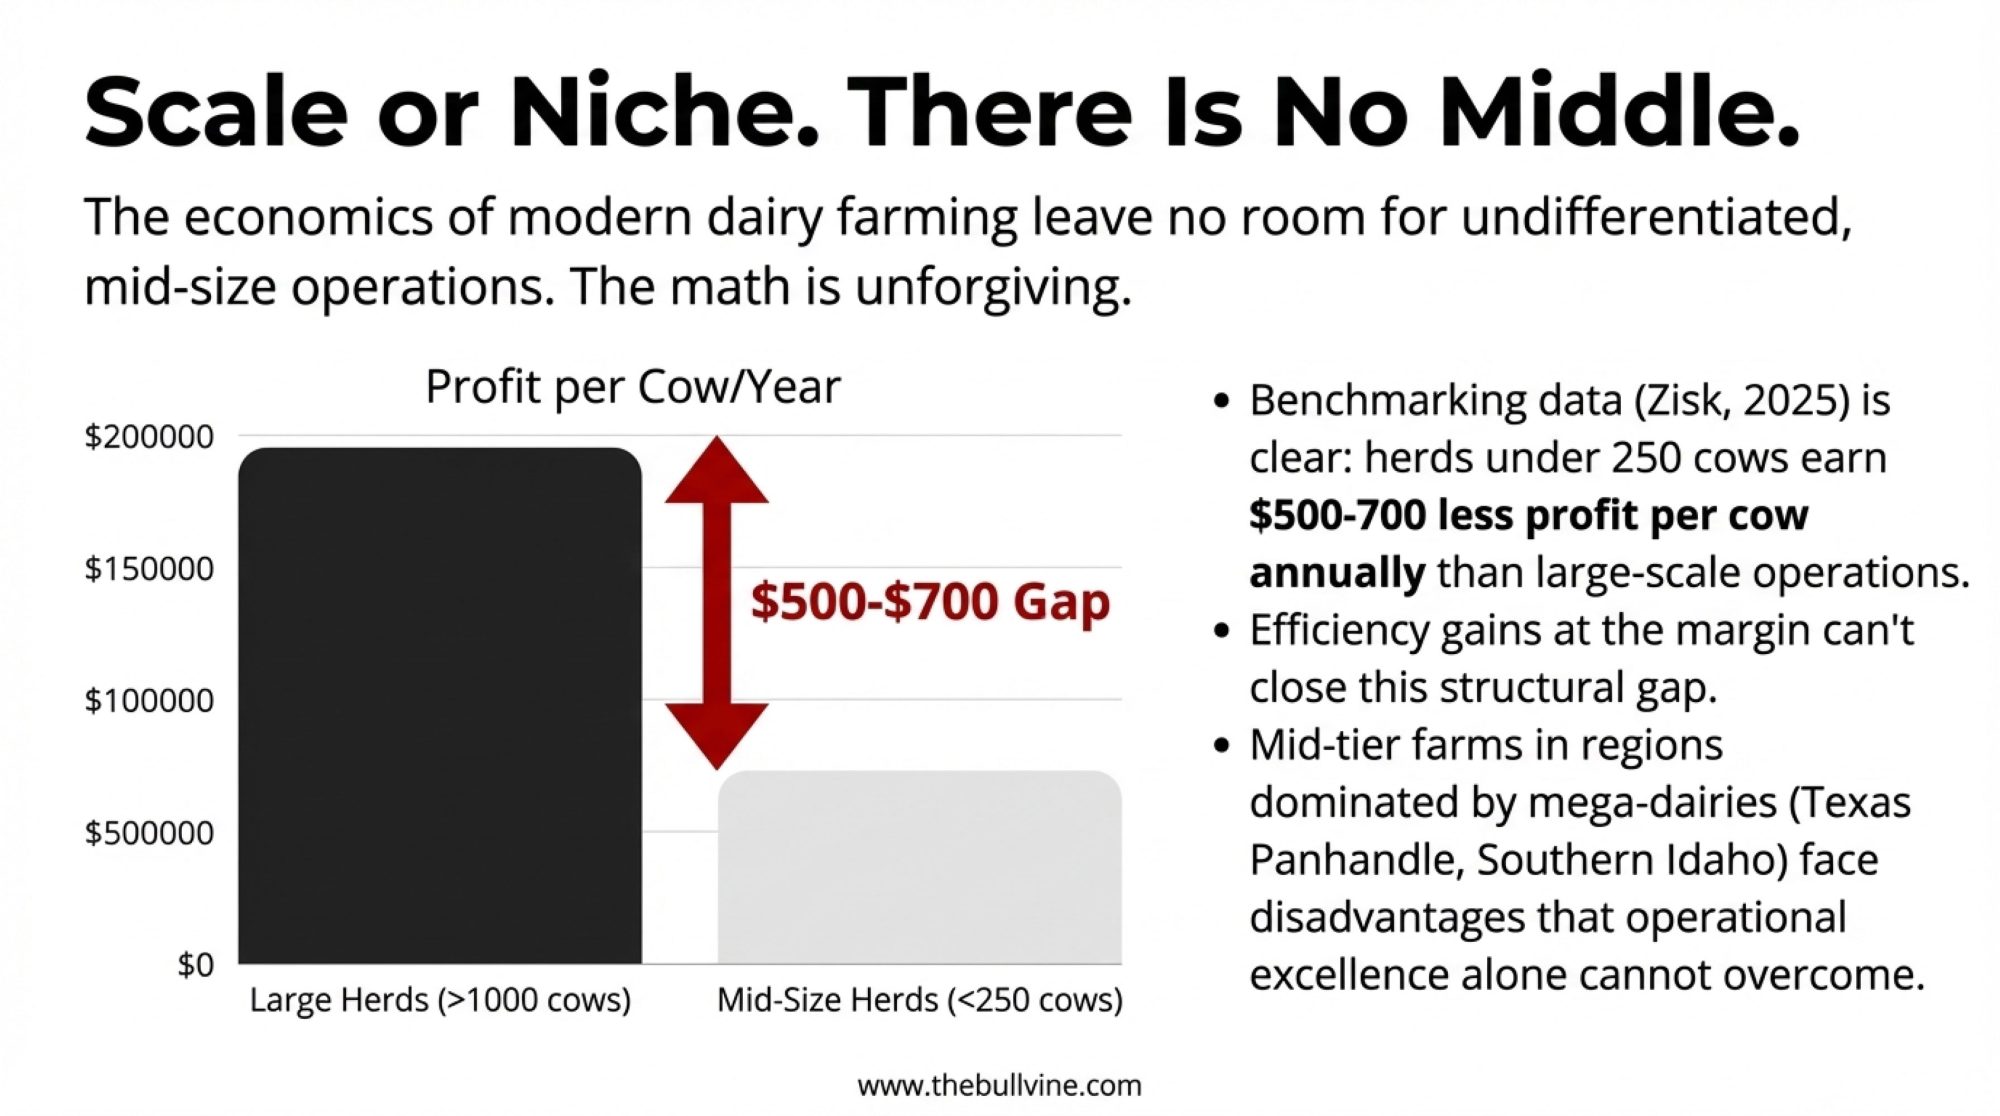
Scale or Niche—There Is No Middle. USDA and industry profitability analyses consistently show significant differences in production costs between small and large operations. Zisk data from 2025 benchmarking shows that herds under 250 cows earn $500-700 less profit per cow annually than large operations across all regions. If you’re running 80 cows and you aren’t bottling it yourself, breeding high-genomic bulls for A.I. studs, or pursuing some other differentiated strategy, the math is working against you. Efficiency improvements help at the margin but generally don’t close the structural gap.
Financial Red Lines. Penn State Extension notes that banks prefer debt-to-asset ratios below 60% for farms considering expansion—and that threshold serves as your risk benchmark more broadly. If you’re approaching that line, stop expanding. Debt reduction is your highest-ROI activity right now. The University of Wisconsin’s Center for Dairy Profitability data shows that income over feed costs swung $12.05 per cwt from peak to trough in just over a year. Operations with heavy debt loads don’t survive that kind of volatility.
Genetics as a Financial Tool. Reassess your breeding priorities. In a quota-restricted or processor-limited world, pounds of solids per stall is the metric that matters most. The industry is shifting its focus from milk volume to milk solids output. Pounds of butterfat and protein per stall—not just total milk volume—increasingly determines which operations stay profitable. Given that feed historically accounts for around half of production expenses, genetic selection for efficiency is critical. Research on genomic evaluations shows that selecting for residual feed intake (RFI) can deliver annual feed savings of over $250 per cow.
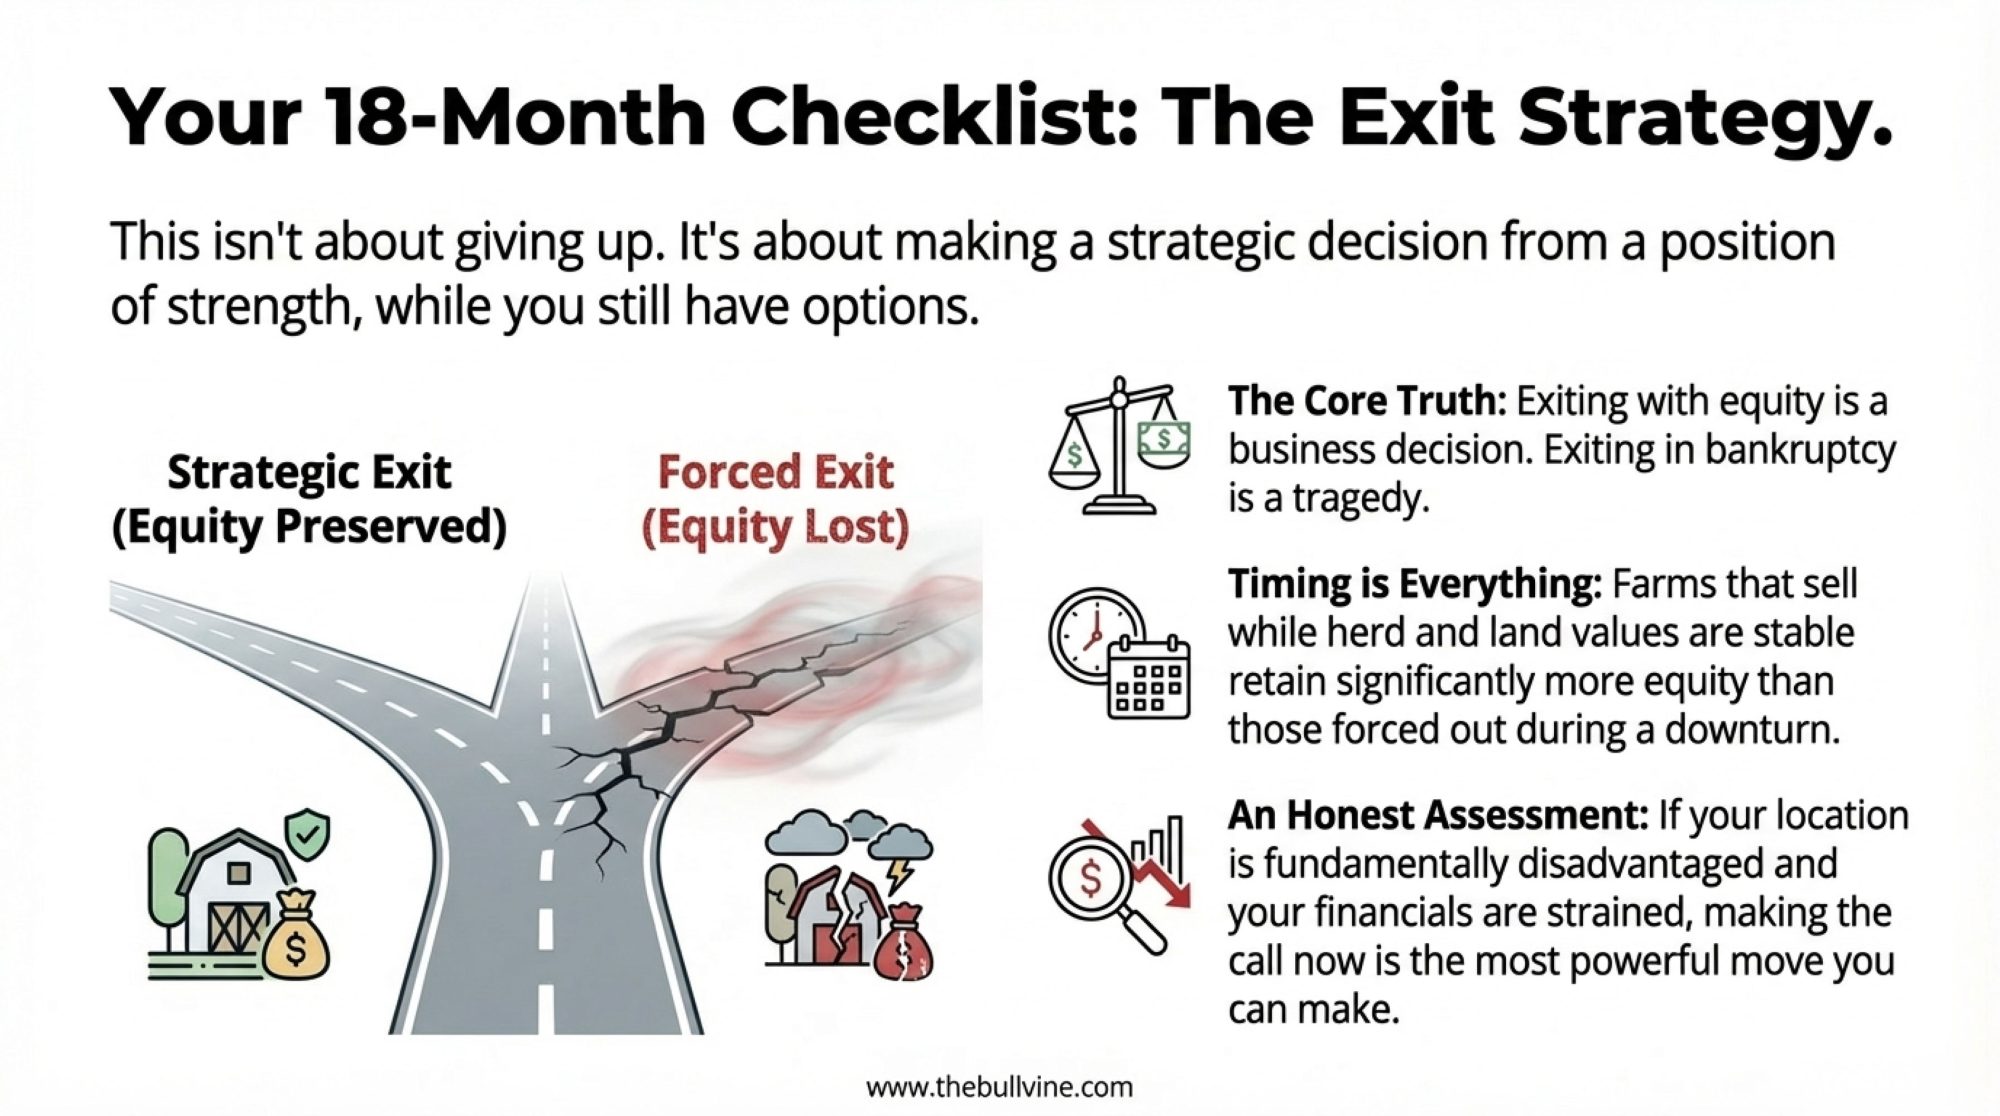
The Exit Strategy. Exiting with equity is a business decision. Exiting in bankruptcy is a tragedy. If the writing is on the wall, sell while herd and land values are still holding. Farms that exit during relative market stability typically retain significantly more equity than those forced out due to financial distress. This isn’t about giving up—it’s about making decisions while you still have options.
Don’t Neglect Workforce Stability. Labor turnover is expensive and disruptive. Farms that invest in employee retention—housing, wages, advancement opportunities—often find that stability pays dividends well beyond the direct costs. That Michigan operation I mentioned didn’t add cows when prices were good; they added housing for key employees. Seven years later, that decision looks brilliant.
Validate Before You Invest. If you’re considering on-farm processing or direct sales, validate demand before buying equipment. Successful on-farm processors I’ve talked with didn’t start with a cheese vat. They surveyed potential customers, secured committed buyers at premium prices, and validated the market. Then they invested. The failures typically reversed that sequence.
The Bottom Line
The dairy industry is working through structural changes that will leave us with different farm structure, processor concentration, and geographic organization than we have today. Understanding these dynamics doesn’t guarantee survival, but it provides a foundation for informed decisions about whether to adapt, invest, or exit on your own terms.

That Wisconsin farmer I mentioned at the start is still evaluating his options. “I’m not ready to quit,” he told me. “But I’m also not going to pretend the numbers don’t say what they say. My grandfather could afford to be stubborn. I can’t.”
That clear-eyed pragmatism—neither false optimism nor premature surrender—seems like the right posture for where we are.
The next 18 months represent a meaningful decision window. By late 2026, when production increases, and work through commodity markets, and regional trading patterns solidify further, options narrow. Farmers who thoughtfully evaluate their position now—with honest assessment of capital, location, scale, and market relationships—can make strategic decisions while they still have agency.
The industry will look different in 2030. The question is whether you’re positioned where you want to be when it does.
Key Takeaways:
- The global safety valve is gone. China hit 85% self-sufficiency and stopped absorbing surplus. U.S. production keeps climbing 4%+ annually, with nowhere for extra milk to go.
- Your location is your leverage. Farms far from processors or premium markets face structural disadvantages that no efficiency gains can fix. If your processor dropped you tomorrow, do you have a Plan B?
- 60% debt-to-asset is the red line. Above it, you’re gambling on margins that aren’t coming. If you’re approaching that threshold, debt paydown beats expansion—every time.
- Mid-tier is the kill zone. Hoard’s Dairyman benchmarking shows herds under 250 cows earning $500-700 less per cow annually. Scale up, carve a niche, or get squeezed out. There’s no profitable middle.
- You have 18 months to decide. By late 2026, production surges will have flooded commodity markets and your strategic options will narrow. The farms still milking in 2030 are making these calls now.
Complete references and supporting documentation are available upon request by contacting the editorial team at editor@thebullvine.com.
Learn More:
- Beyond the Milk Check: How Dairy Operations Are Building $300,000 in New Revenue Today – Reveals a 90-day roadmap for capturing immediate revenue through beef-on-dairy premiums, feed shrink recovery, and DMC optimization. This guide demonstrates how diversified operations are lowering their breakeven by $2-4 per cwt while traditional dairies wait for price rallies.
- The Real Reason Dairy Farms Are Disappearing (Hint: It’s Not About Better Farming) – Exposes the hidden mechanics of industry consolidation, detailing why operational efficiency alone no longer guarantees survival. This analysis provides strategies for mid-sized farms to combat the “market power” gap that leaves them earning less per cow than mega-dairies.
- Genetic Revolution: How Record-Breaking Milk Components Are Reshaping Dairy’s Future – Explains why the industry’s shift to component pricing makes “pounds of solids per stall” the only metric that matters. It offers specific breeding strategies to maximize milk check value as processors increasingly cap volume in favor of fat and protein.
 Join the Revolution!
 Join the Revolution!
Join over 30,000 successful dairy professionals who rely on Bullvine Weekly for their competitive edge. Delivered directly to your inbox each week, our exclusive industry insights help you make smarter decisions while saving precious hours every week. Never miss critical updates on milk production trends, breakthrough technologies, and profit-boosting strategies that top producers are already implementing. Subscribe now to transform your dairy operation’s efficiency and profitability—your future success is just one click away.


