


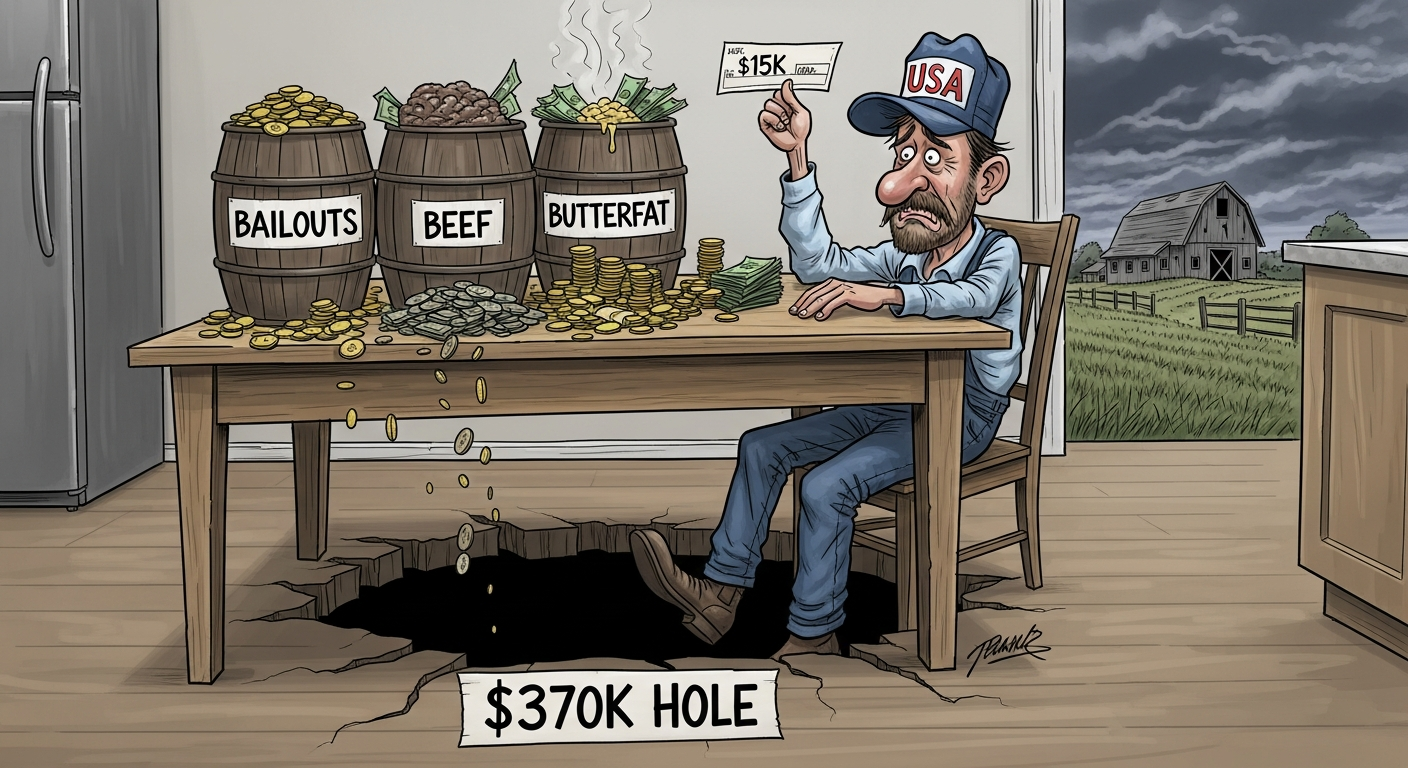
$15,000 from Washington. $370,000 in the red. The bailout’s a band-aid on a bullet wound—here’s what producers who’ll survive 2026 are doing right now.
EXECUTIVE SUMMARY: The $12 billion bailout sounds big—until you run the numbers. Dairy competes for scraps from a $1 billion ‘other commodities’ pool. A 500-cow operation might see $15,000. That covers 4% of projected annual losses exceeding $368,000. The June FMMO reforms made it worse: producers lost $337 million in pool revenue in just 90 days, according to AFBF analysis. But the dairies positioned to survive aren’t waiting on Washington. Beef-on-dairy crossbreeding is generating $90,000-$135,000 in new annual revenue. Component optimization is adding $50,000-$90,000 through butterfat gains. The bailout’s a band-aid—these moves are what separate survivors from casualties heading into 2026.
When the bailout announcement hit Monday morning, Jeff Voelker did what he’s done every month for the past year—he pulled up his spreadsheet and reran the numbers.
Voelker milks 480 cows outside of Marshfield in central Wisconsin. Good herd. Solid genetics. Third-generation operation. The kind of dairy that should be thriving. Instead, he’s been watching his working capital erode month after month, wondering how long the runway really is.
“I appreciate any help Washington sends our way,” Voelker told me when we spoke Tuesday. “But I’m not making business decisions based on that check. I’m making them based on what my cows and my land can actually do.”
That sentiment—grateful but exhausted—captures where a lot of mid-size producers find themselves this December. Because let’s be honest: after years of margin compression, trade wars, pandemic disruptions, and now FMMO reforms that took another bite out of the milk check, there’s a weariness setting in. Another bailout announcement. Another round of wondering if Washington actually understands what’s happening on the ground.
The Trump administration’s $12 billion agricultural aid package brings welcome relief. But for most dairy operations, it’s a band-aid on a bullet wound. Understanding what it actually covers—and more importantly, what it doesn’t—requires looking past the headline figures and getting realistic about what comes next.

Where Dairy Fits in This Package
Let’s be brutally honest: if you’re banking on this $12 billion to fix a structural deficit in your operation, you’re already in trouble. The check will clear, the lights will stay on for another month, but the fundamental math of 2026 hasn’t changed.
Here’s what the check actually looks like.
The bulk of the package—roughly $11 billion according to USDA program details and confirmed by the Washington Times and Forbes—flows through the new Farmer Bridge Assistance program targeting row crop producers affected by trade disruptions. Soybeans, corn, wheat. The commodities that dominate political conversations in farm states.
Dairy’s allocation comes from the remaining $1 billion designated for “other commodities”—a pool we’re sharing with specialty crops and other livestock sectors. USDA officials noted at Monday’s briefing that specific payment rates are “still being finalized.” If you’ve been around long enough, you recognize that language.
What we can do is look at precedent. During the 2018-2019 Market Facilitation Program, dairy received commodity-specific payments of $0.20 per hundredweight according to USDA Farm Service Agency program records. If something similar applies here—and that remains genuinely uncertain—we can start modeling what individual farms might expect.
Estimated payment ranges by operation size:
| Herd Size | Annual Production | Likely Payment Range |
| 100 cows | ~23,500 cwt | $3,000 – $5,000 |
| 500 cows | ~117,500 cwt | $12,000 – $20,000 |
| 1,000 cows | ~235,000 cwt | $20,000 – $35,000 |
| 2,000+ cows | ~470,000+ cwt | $35,000 – $50,000* |
*The MFP had a $250,000 per person cap, with a total household cap of $500,000, which limited larger operations
These estimates assume dairy captures roughly half of that $1 billion “other commodities” allocation. That might prove optimistic depending on how specialty crop interests advocate for their share. We’ll have better clarity when USDA publishes the final rule, likely sometime in January.
The Margin Picture Heading Into 2026
To put these payments in proper context, it helps to understand where dairy margins actually stand right now. And the picture isn’t pretty.
USDA Economic Research Service projects an all-milk price around $19.25-$19.50 per cwt for 2026, which aligns with what dairy economists have been tracking. Mark Stephenson, who spent years as director of dairy policy analysis at the University of Wisconsin-Madison before his recent retirement, has been following these projections closely, and the outlook has remained stubbornly consistent.
Meanwhile, production costs for mid-size operations—those 300 to 700 cow dairies that form the backbone of states like Wisconsin, Minnesota, and Michigan—are running $21.50 to $23.00 per cwt according to University of Illinois FarmDoc analysis and USDA cost of production data. The exact number depends on your region, feed situation, and labor management.
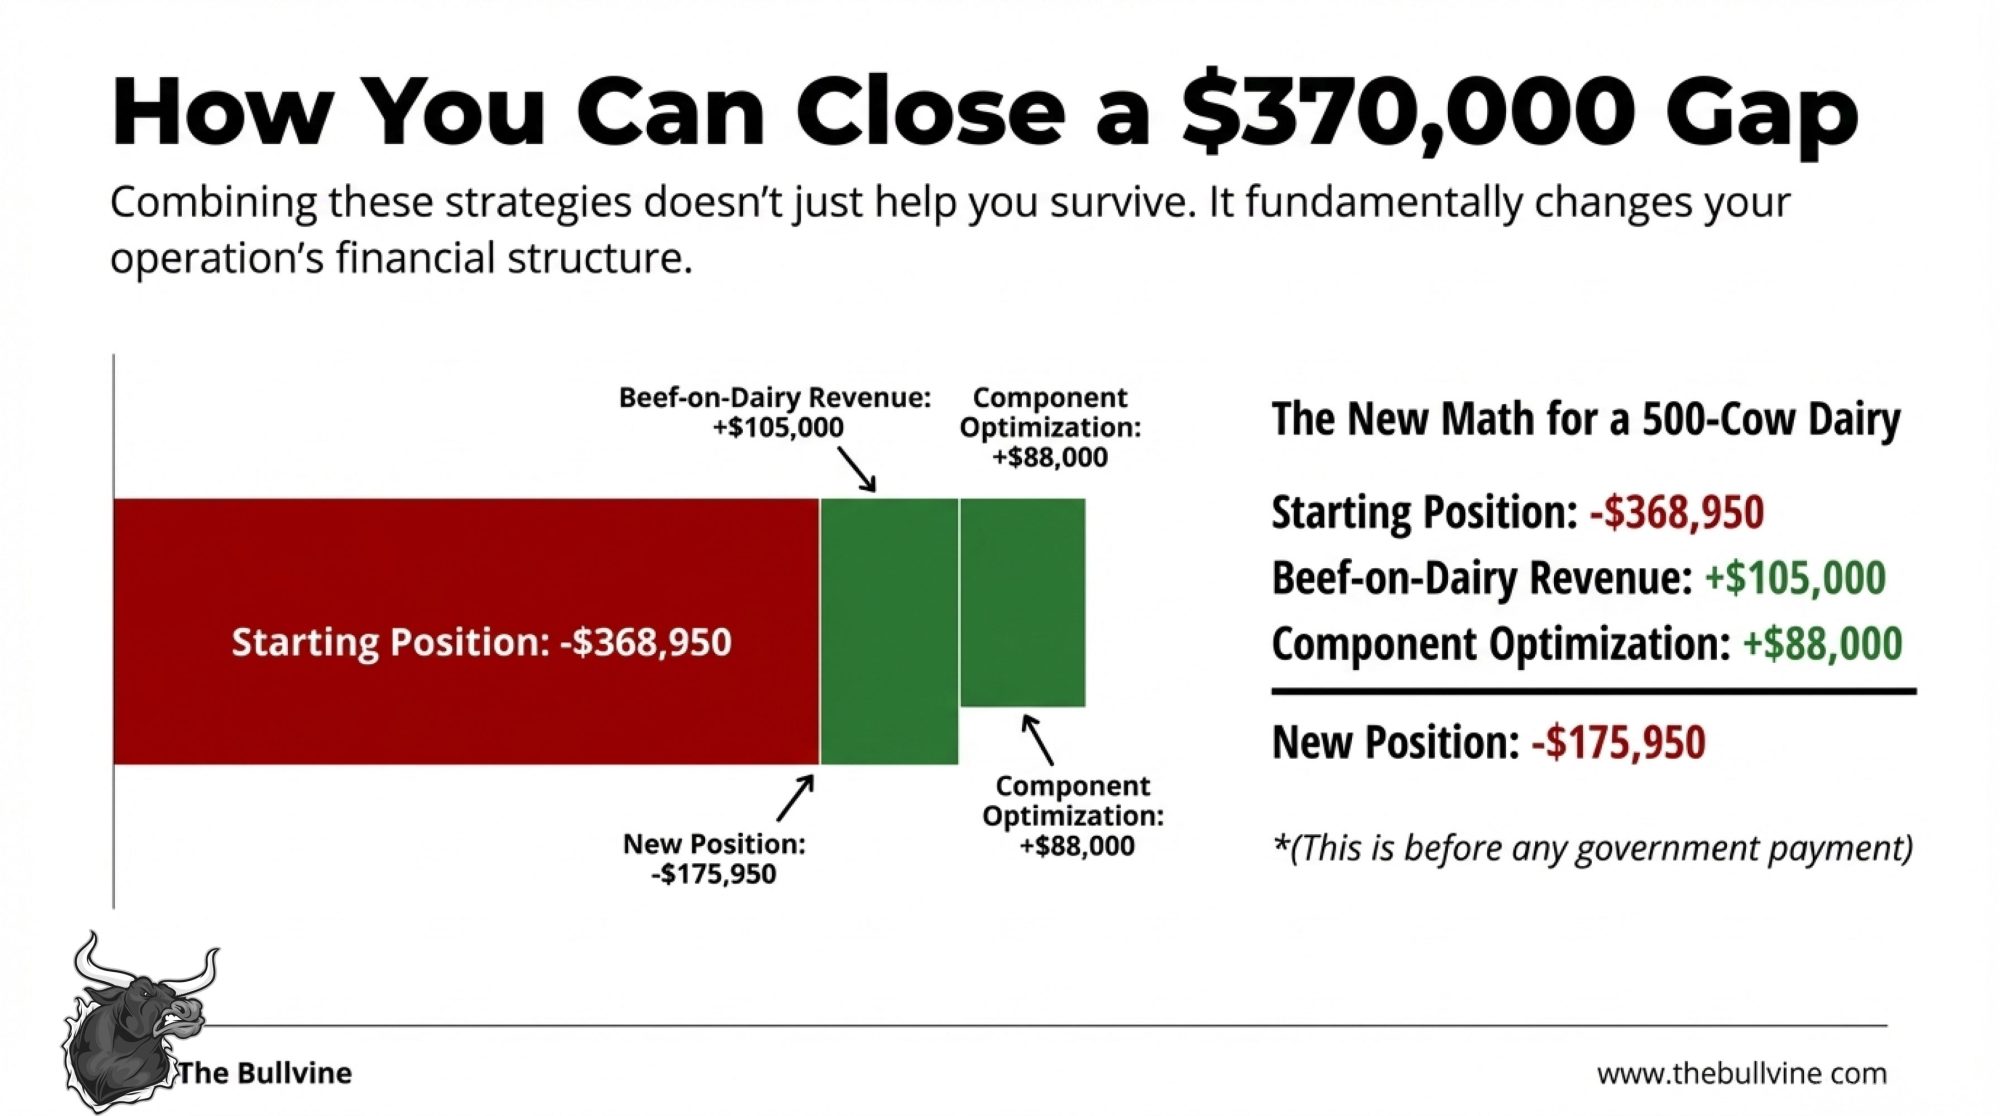
Based on those projections, here’s what the math looks like for a representative 500-cow dairy:
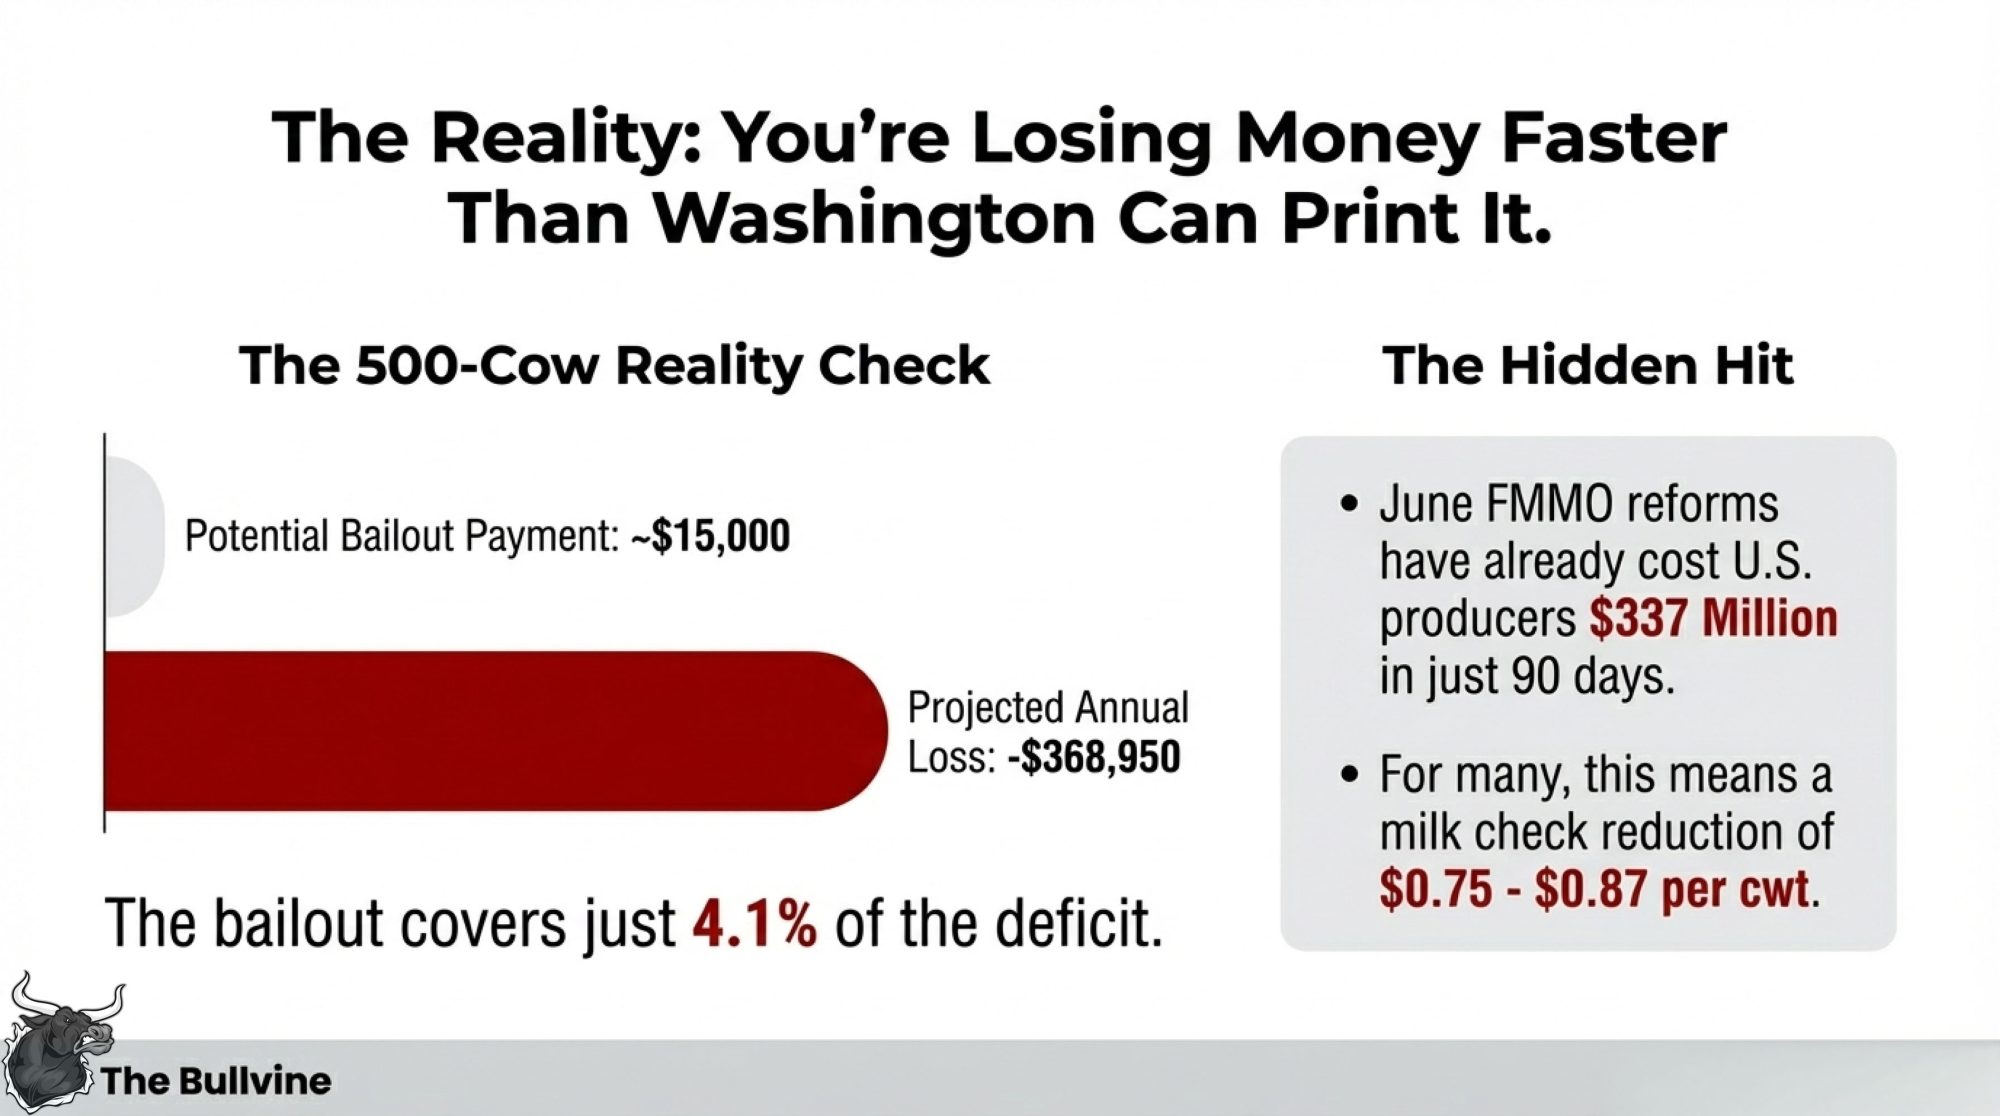
📊 THE 500-COW REALITY CHECK
| Category | Annual Figure |
| Milk Production | 117,500 cwt |
| Gross Revenue (at $19.50/cwt) | $2,291,250 |
| Operating Costs (at $22.64/cwt) | $2,660,200 |
| Net Position | -$368,950 |
| Bailout Payment | ~$15,000 |
| Bailout as % of Loss | 4.1% |
That potential $15,000 bailout payment represents about 0.6% of annual operating costs. It covers roughly two weeks of feed. Maybe a month of debt service. It’s meaningful as supplemental support—nobody should dismiss it. But it’s not moving the needle on a $370,000 annual loss.
What’s been consistent in conversations with producers over recent weeks is this recognition. They’re grateful for assistance, but they’ve learned not to build business plans around government payments that may arrive on uncertain timelines and in uncertain amounts. The operations weathering this period best are focused on what they can actually control.
Understanding the June FMMO Changes
This brings us to something that is still causing real frustration across the industry: the Federal Milk Marketing Order reforms that took effect on June 1, 2025.
I’ve talked with several producers who know their milk checks have changed but aren’t entirely sure why. So let me walk through this carefully.
The reforms included several adjustments, but the one generating the most anger is the increase in “make allowances.” These are the manufacturing cost credits that processors deduct from raw milk prices before pool distribution—essentially, what processors retain to cover their costs of turning your milk into cheese, butter, or powder.
Under the new rules, these allowances increased from approximately 5 cents to 7 cents per pound across cheese, butter, and powder classes according to the USDA Agricultural Marketing Service final rule. That adjustment comes directly out of producer prices before you ever see it.
Processors and cooperative leaders will tell you these updates were necessary corrections to the 2008 economics. And sure, inflation is real for everyone—manufacturing costs for labor, energy, and equipment have increased substantially over the past seventeen years. There’s some validity to that argument.
But for the producer on the receiving end of a 7-cent deduction, it feels less like an “update” and more like a wealth transfer from the milking parlor to the processing plant. It’s a bitter pill to swallow watching your milk check shrink to subsidize the processing sector, especially while some of those same processors post record earnings and cooperative patronage dividends remain flat.
The numbers tell the story. The American Farm Bureau Federation analyzed the first three months following implementation. AFBF economist Danny Munch reported in September 2025 that dairy producers collectively received approximately $337 million less in pool revenues than they would have under the previous formula. That’s $337 million out of producer pockets in just 90 days.
For individual farms, the impact varies by region and milk utilization. Operations in cheese-producing regions—Wisconsin, Idaho, parts of California’s Central Valley—appear most affected, with some producers reporting effective price reductions of $0.75 to $0.87 per cwt compared to pre-reform levels.
What this means practically: A 500-cow dairy that might have expected $2.39 million in milk revenue under the old formula could now be looking at $2.29 million—a $100,000 annual difference that makes any bailout payment look like pocket change.
The reform also returned the Class I pricing formula to a “higher-of” structure intended to benefit fluid milk producers and updated composition factors for protein and other solids. For operations in fluid-heavy markets, those changes may partially offset the make allowance impact. But for cheese-market producers—which describes most of the Upper Midwest—the make allowance adjustment dominates everything else.
The Global Context
One factor that often gets overlooked in domestic policy discussions: we’re operating in an interconnected global market, and right now, milk is flowing everywhere.
Rabobank’s quarterly Global Dairy reports show milk supply growth of around 2% across major exporting regions for the second half of 2025. New Zealand posted solid production gains despite earlier concerns about drought. The EU has been running above year-ago levels through much of the year.
This matters because global supply dynamics put a ceiling on how high U.S. prices can realistically climb. That same Rabobank analysis projects supply growth moderating to under half a percent by 2026, but continued pressure on world dairy commodity prices appears likely through at least mid-year.
The takeaway isn’t pessimism—it’s realism. Even if domestic conditions improve, global supply patterns suggest we shouldn’t expect dramatic price recovery to solve margin challenges. Which brings us to what actually might.
How Forward-Thinking Producers Are Responding
Here’s where the conversation becomes more encouraging—and more actionable.
Across the industry, I’m seeing producers treat this moment as an opportunity to accelerate changes they’d been considering. The operations that seem most confident heading into 2026 aren’t waiting for market recovery or larger government programs. They’re focused on revenue diversification and operational refinement—variables within their direct control.
Three approaches keep emerging in conversations.
Building Revenue Through Beef-on-Dairy
This might be the most significant shift in dairy economics over recent years, and if you haven’t run the numbers for your operation, you’re probably leaving serious money on the table.
With beef markets strong, verified crossbred calf values are running $350-$500 per head compared to $25-$75 for traditional Holstein bull calves. According to an American Farm Bureau Federation analysis, dairy-origin cattle account for roughly 20-28% of the annual U.S. calf crop, with beef-on-dairy crossbreds now representing an estimated 12-15% of fed cattle slaughter—and growing rapidly. A 2024 Purina survey found that 80% of dairy farmers and 58% of calf raisers now receive a premium for beef-on-dairy calves.
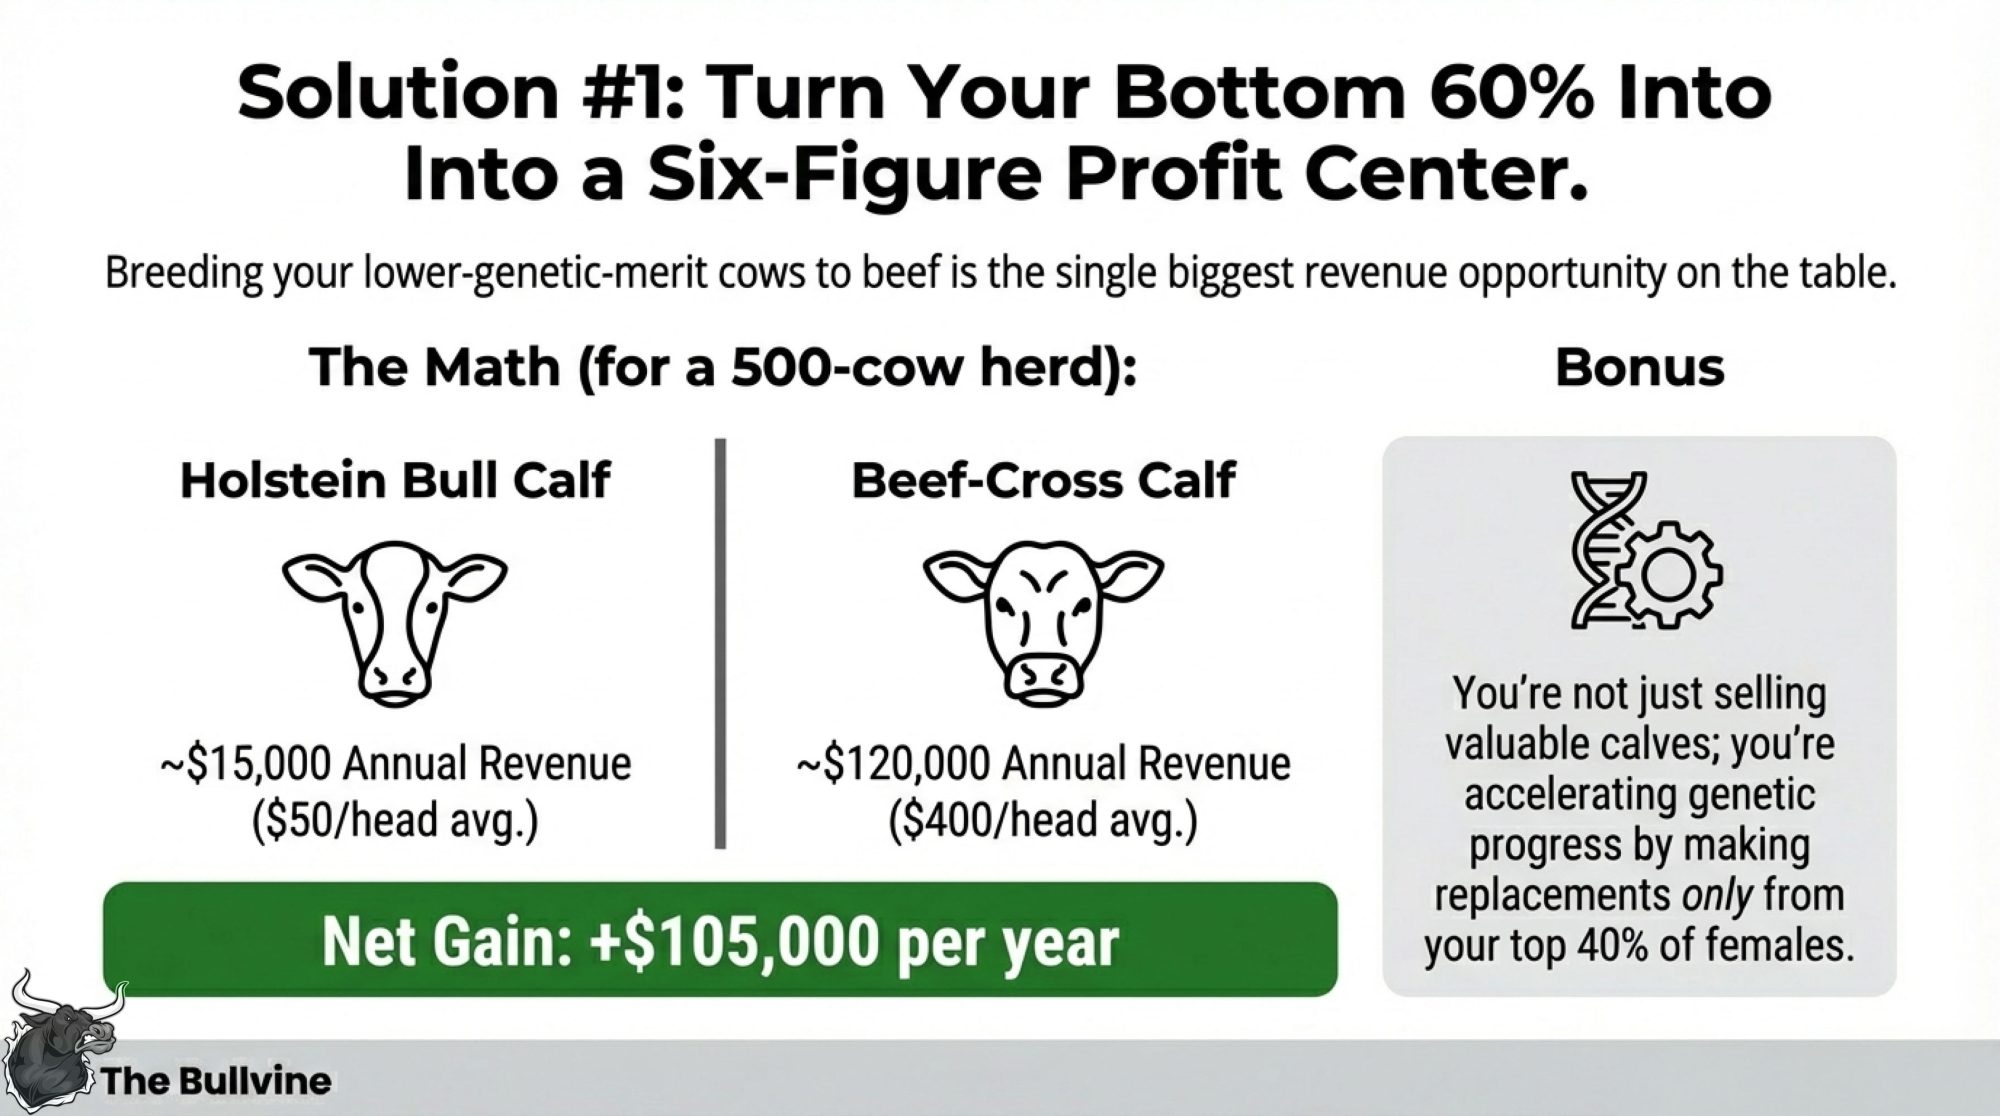
📊 THE BEEF-ON-DAIRY MATH (500-cow herd, 60% bred to beef)
| Revenue Source | Holstein Bulls | Beef-Cross Calves |
| Calves sold annually | ~300 | ~300 |
| Value per head | $25-$75 | $350-$500 |
| Annual calf revenue | ~$15,000 | $105,000-$150,000 |
| Net gain from the switch | — | +$90,000 to +$135,000 |
That’s not a typo. We’re talking about a potential six-figure revenue swing from a breeding decision you can make this week.
I recently spoke with Mark Hendricks, who milks 520 cows near Charlotte, Michigan. He made the transition in 2023. “It’s not complicated,” he explained. “I identified my bottom 60% on genomics, stopped using dairy semen on them, and contracted with a beef aggregator. My calf revenue went from around $15,000 to over $100,000 in one year.”
But here’s what really excites the breeder in me about this strategy: it’s not just about the calf check. When you commit to breeding beef on your bottom 60%, you’re forcing yourself only to generate replacements from your absolute best females. Every heifer that enters your milking string comes from a top-40% dam. You’re accelerating genetic progress while getting paid to do it.
Think about that for a moment. Instead of keeping mediocre replacements because you need the numbers, you’re culling harder, breeding smarter, and generating a six-figure revenue stream in the process. The economics align with the genetics in a way that rarely happens in this industry.
Key considerations if you’re exploring this approach:
- Forward contracts with beef finishers typically offer $100-$200 per head premium over spot market sales
- Sire selection matters significantly—calving ease scores and carcass merit both influence value
- Some cooperatives now offer specific programs for verified crossbred calves
- Plan breeding strategy around your herd’s actual genetic ranking, not arbitrary percentages
- Work with your genetics advisor to identify the true cutoff line for dairy replacements
What’s particularly noteworthy is how quickly this has shifted from experimental to standard practice among progressive herds. Five years ago, breeding dairy cows to beef was something you did with your problem animals. Now it’s a deliberate profit center and genetic accelerator.
Optimizing for Components
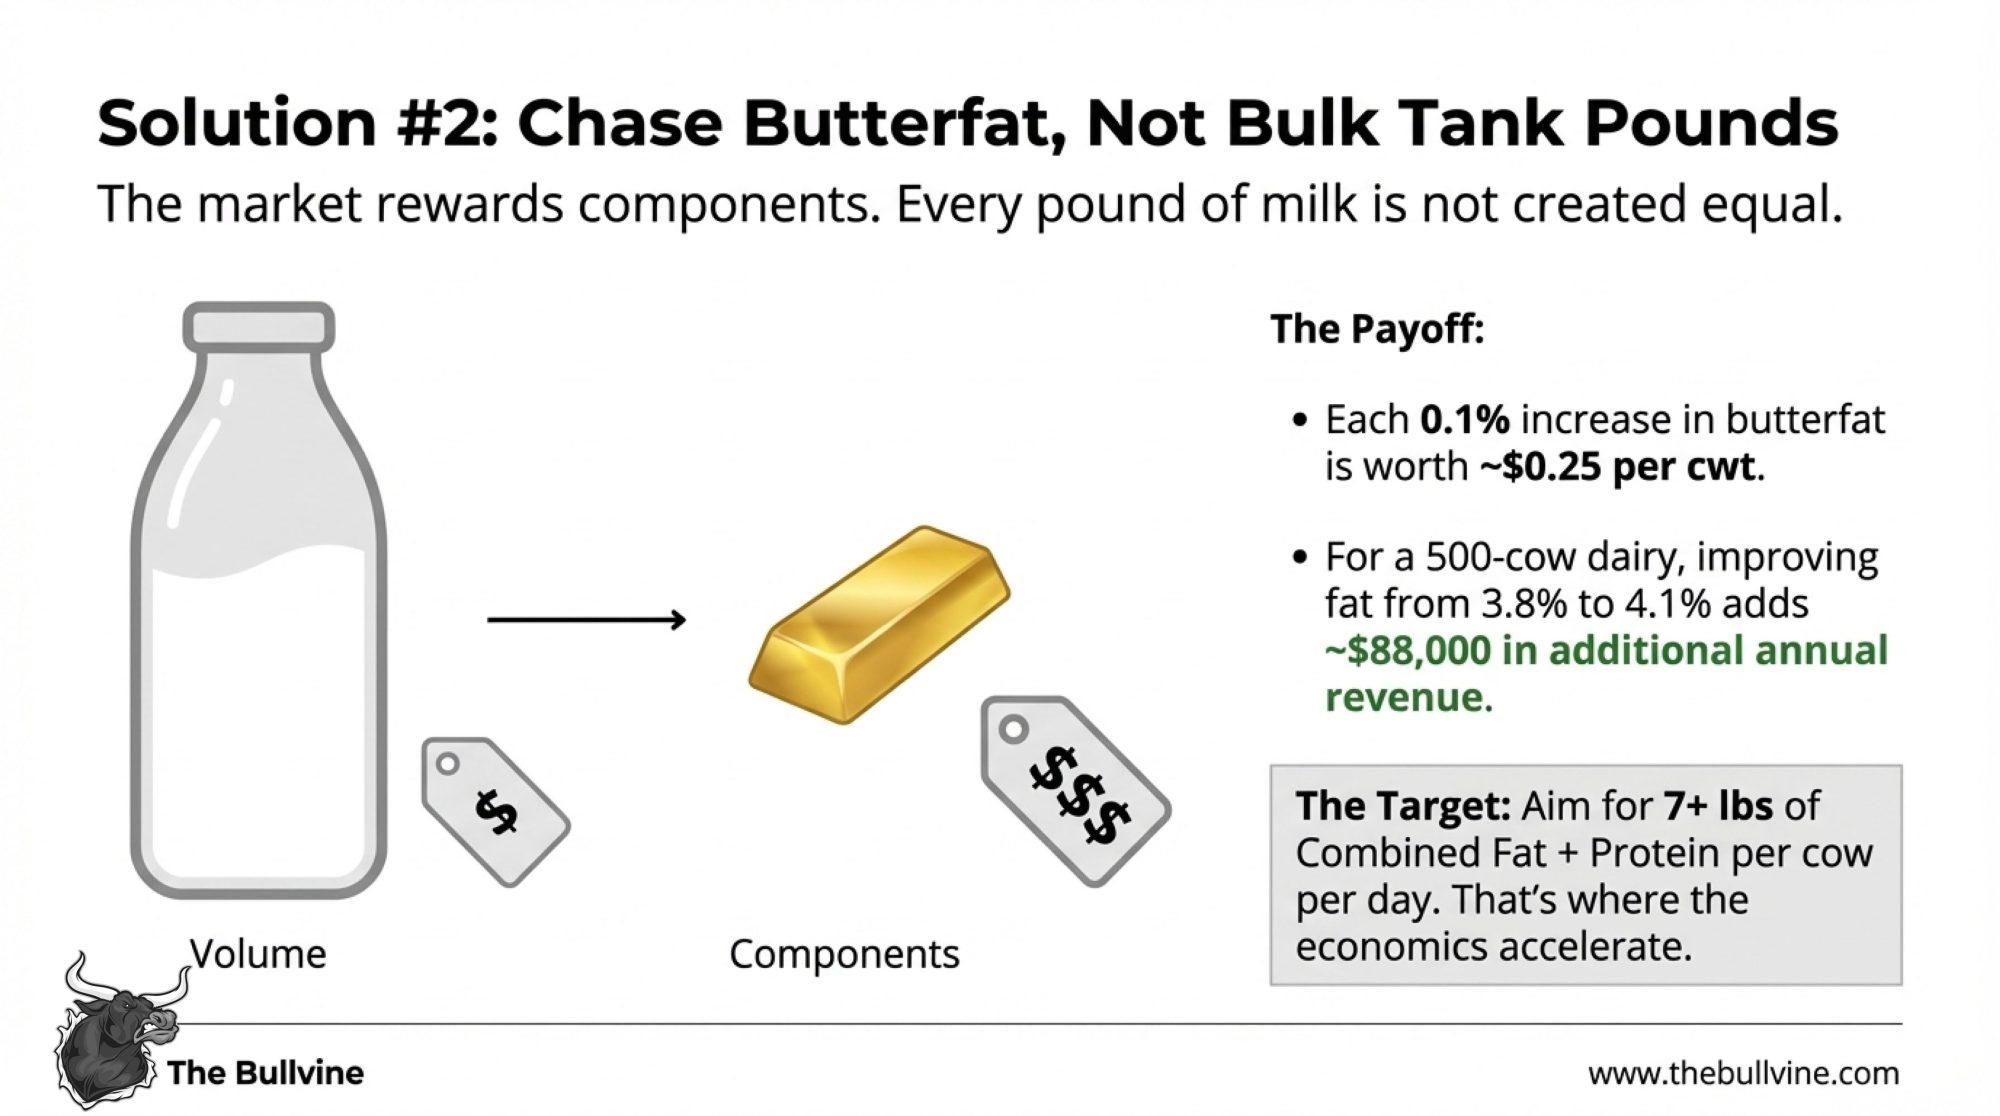
The FMMO reforms reinforced something that’s been building for years: the market rewards components over fluid volume. If you’re still managing primarily for pounds of milk, you’re chasing the wrong number.
Looking at Council on Dairy Cattle Breeding data and current component pricing, each 0.1% increase in butterfat is worth approximately $0.25 per cwt. That accumulates quickly.
For a 500-cow dairy, moving from 3.8% to 4.1% butterfat—a 0.3-point improvement achievable through genetics and nutrition over 18-24 months—translates to roughly $88,000 in additional annual revenue.
Maria Gonzalez runs a 650-cow operation with her husband near Hanford in California’s Central Valley. “We stopped chasing pounds five years ago,” she told me. “Our rolling herd average dropped about 2,000 pounds, but our milk check went up $40,000. Components changed everything for us.”
What this looks like practically:
- Shifting genetic selection toward Net Merit (NM$ or CM$) indexes that weight components more heavily
- Working with your nutritionist on rations supporting de novo fatty acid synthesis
- Making reproduction decisions based on component performance, not just production volume
- Tracking Combined Fat + Protein in pounds per cow per day
Producers who do this well tend to set Combined F+P above 7 lbs/cow/day as their benchmark. That seems to be where the economics really accelerate under current pricing structures.
Evaluating Scale and Structure
This is genuinely the most difficult topic, and there’s no universal answer.
Industry economists have noted that operations with 300 to 700 cows often face particular challenges—too large to operate primarily with family labor, but not large enough to capture the fixed-cost efficiencies available to larger operations fully.
USDA Economic Research Service cost of production estimates from 2023-2024 illustrate the scale dynamics:
- Under 200 cows: $24-$28/cwt
- 200-500 cows: $21-$25/cwt
- 500-1,000 cows: $19-$22/cwt
- Over 2,000 cows: $17-$20/cwt
That $2-$4 per cwt cost advantage at larger scale isn’t primarily about management quality—many smaller dairies are exceptionally well-managed. It’s largely about spreading fixed costs across more production units.
This doesn’t mean mid-size dairies can’t succeed. Many do, consistently. But success at that scale typically requires exceptional operational efficiency, premium market positioning, diversified revenue, or creative approaches to capturing scale benefits.
Options worth considering:
Collaborative arrangements with neighboring operations—sharing equipment, labor, or specialized services without full merger. Several partnerships I’m aware of in Wisconsin and Minnesota involve family operations sharing nutritionists, coordinating heifer programs, or jointly owning harvest equipment. These capture meaningful efficiencies while preserving independent ownership.
Strategic expansion for operations with strong balance sheets and available resources. The numbers suggest reaching 800-1,200 cows meaningfully improves cost structure—if the transition can be managed well.
Thoughtful transition planning for producers approaching retirement without identified successors. Recognizing that exiting while asset values remain relatively strong may better serve family interests than extended losses followed by a distressed sale. That’s not failure—it’s sound business judgment.
The Cooperative Conversation
One topic that emerged repeatedly in my reporting: how cooperatives participated in the FMMO reform process.
The January 2025 referendum approving the FMMO changes passed in ten of the eleven Federal marketing orders. The voting structure itself raised questions for some producers.
Under regulations established in the Agricultural Marketing Agreement Act, cooperatives can exercise “bloc voting”—casting ballots on behalf of member producers rather than requiring individual votes. This means many producers didn’t receive personal ballots; their cooperative boards voted based on their assessment of member interests.
Reasonable perspectives exist on both sides of this structure. Cooperative leaders note that bloc voting enables efficient administration of complex decisions and that elected boards are specifically chosen to make these judgments. That’s a legitimate point, and cooperative governance has deep roots in American agriculture.
Some producer advocates, including the American Farm Bureau Federation, have proposed “modified bloc voting,” allowing individual producers to request separate ballots when they disagree with their cooperative’s position. AFBF’s October 2025 policy brief outlined several such reforms.
USDA hasn’t adopted changes, though discussions continue.
What I’d encourage: understand how your cooperative makes policy decisions and engage actively. Most cooperatives solicit member input before major votes. Participating in those forums—attending meetings, asking questions, communicating with board representatives—is the most direct way to influence decisions affecting your operation.
Succession Considerations
One aspect deserving more attention: what current conditions mean for generational transfer.
When support programs maintain elevated land and asset values despite operating losses, the mathematics for incoming generations become brutal. Young farmers looking to purchase or assume 500-cow operations face asset valuations often based on historical performance or land appreciation, but an operating reality that includes current losses requiring significant working capital.
Farm Credit Canada’s November 2025 succession report found that capital requirements now constitute the primary barrier to next-generation entry, ahead of land availability, family dynamics, or technical knowledge. That finding likely applies similarly in the U.S.
“The worst outcome is transferring an operation to the next generation based on optimistic projections that don’t materialize,” observes Jennifer Horton, a farm succession specialist with University of Minnesota Extension who works extensively with dairy families throughout the Upper Midwest. “Honest conversations about margin expectations, capital needs, and risk tolerance need to happen before transfer. The families that navigate this successfully are those willing to examine real numbers together.”
If you’re considering succession—whether within the family or through an outside sale—this period offers an opportunity for realistic planning while asset values remain relatively strong.
The Bottom Line
Where does this leave the typical mid-size producer?
The bailout represents real assistance. For 500-cow operations, payments in the $12,000-$20,000 range provide meaningful cash flow support—perhaps a month of debt service or a quarter’s veterinary and breeding costs. That matters. But it’s not a strategy.
Here’s what actually moves the needle:
On revenue diversification: If you haven’t evaluated beef-on-dairy seriously, the $90,000-$120,000 annual revenue potential warrants attention this winter. Talk to your genetics advisor and explore forward contracting options.
On components: The $50,000-$90,000 annual impact from butterfat and protein optimization is achievable for most operations. Review genetic direction and nutritional programs through a component lens.
On positioning: Be honest about your cost structure relative to the market. Whether the answer involves collaboration, expansion, efficiency, or a thoughtful transition, making clear-eyed decisions now preserves more options than waiting.
On cooperative engagement: Understand how your cooperative makes policy decisions. Your voice carries more weight than you might assume—but only if you use it.
The dairy industry has navigated challenging periods before and emerged stronger. The operations that thrive through this one will be those that make proactive adjustments based on solid information—not those that wait for Washington to write a check that fixes everything.
That’s not pessimism. It’s practical wisdom.
KEY TAKEAWAYS:
- The bailout covers 4% of your loss: ~$15,000 for a 500-cow dairy against $368,000+ in annual red ink
- FMMO reforms already cost producers $337 million: Cheese-region operations are down $0.75-$0.87/cwt on every check
- Beef-on-dairy is a six-figure decision: Breed your bottom 60% to beef for $90,000-$135,000 in new annual revenue—and faster genetic progress
- Chase butterfat, not bulk tank pounds: A 0.3% fat improvement = $88,000/year. Target: 7+ lbs Combined F+P daily.
- The check won’t save you. These moves might. Lock beef contracts and revisit genetics before spring breeding.
Complete references and supporting documentation are available upon request by contacting the editorial team at editor@thebullvine.com.
Learn More:
- Why Are Dairy Farmers Desperately Holding onto Their Cows in 2024? Uncover the Truth – This analysis reveals how the beef-on-dairy boom has fundamentally altered culling strategies, providing financial data on why retaining cows for beef crosses is currently outperforming traditional replacement models for cash flow.
- Why Boosting Butterfat and Protein Is Key to Higher Profits – A tactical guide to the “component economy,” offering specific genetic and nutritional adjustments to capture the $6.87/cwt spread between average and high-component herds identified in current market analysis.
- Discover the Future of Dairy Farming: Key Technologies Revolutionizing the Industry – Explores the ROI of automation beyond the hype, detailing how automated feeding and milking systems are helping mid-size operations overcome labor shortages while stabilizing production costs against volatility.
 Join the Revolution!
 Join the Revolution!
Join over 30,000 successful dairy professionals who rely on Bullvine Weekly for their competitive edge. Delivered directly to your inbox each week, our exclusive industry insights help you make smarter decisions while saving precious hours every week. Never miss critical updates on milk production trends, breakthrough technologies, and profit-boosting strategies that top producers are already implementing. Subscribe now to transform your dairy operation’s efficiency and profitability—your future success is just one click away.


